kpi’s for battery sizing in a neighbourhood
TRANSCRIPT

KPI’S FOR BATTERY SIZING IN A NEIGHBOURHOOD
ENERGY OPEN 2019
VICTOR REIJNDERS

CONTENT
• Introduction• KPI’s• Case study• Results• Conclusions
2
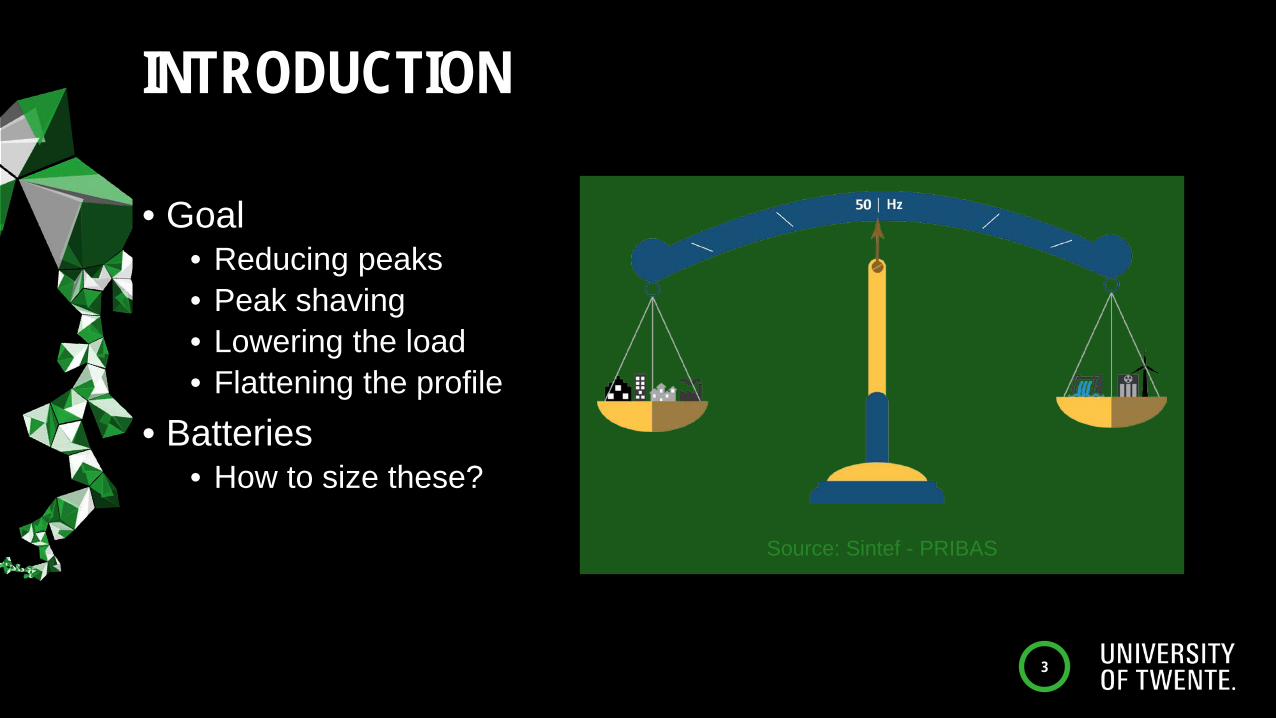
INTRODUCTION
• Goal• Reducing peaks• Peak shaving• Lowering the load• Flattening the profile
• Batteries• How to size these?
3
Source: Sintef - PRIBAS
KPI’S
• Measures of statistical dispersion• Spread of electricity demand 𝑋𝑋• Decide on battery capacity and power rating
4Source: Newlancer
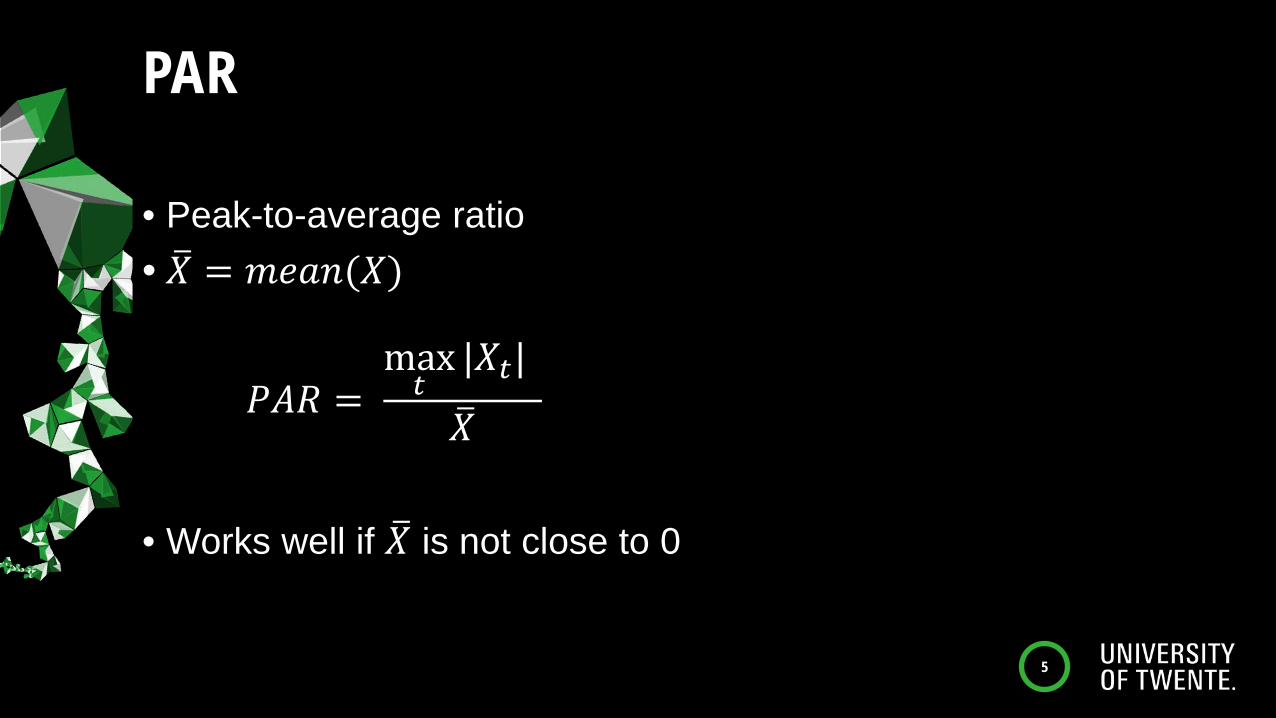
PAR
• Peak-to-average ratio• �𝑋𝑋 = 𝑚𝑚𝑚𝑚𝑚𝑚𝑚𝑚(𝑋𝑋)
• Works well if �𝑋𝑋 is not close to 0
5
𝑃𝑃𝑃𝑃𝑃𝑃 =max𝑡𝑡
|𝑋𝑋𝑡𝑡|�𝑋𝑋
PAR
6
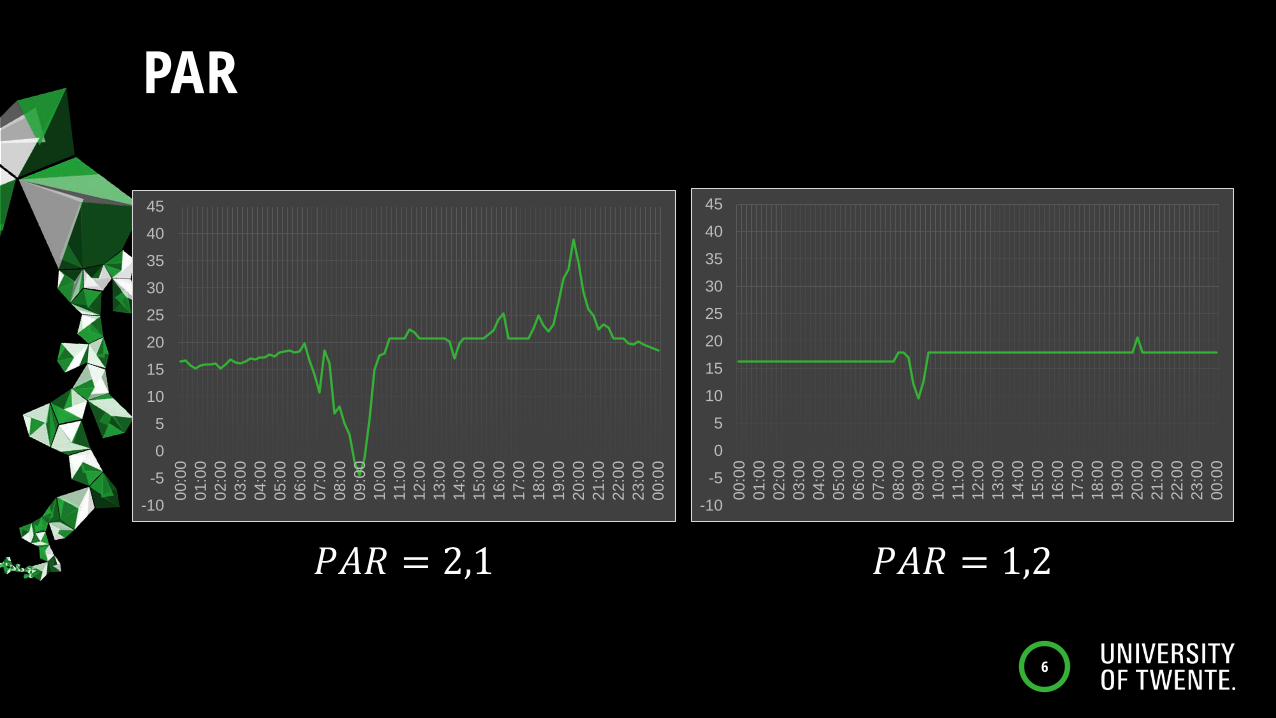
𝑃𝑃𝑃𝑃𝑃𝑃 = 2,1 𝑃𝑃𝑃𝑃𝑃𝑃 = 1,2-10-505
1015202530354045
00:0
001
:00
02:0
003
:00
04:0
005
:00
06:0
007
:00
08:0
009
:00
10:0
011
:00
12:0
013
:00
14:0
015
:00
16:0
017
:00
18:0
019
:00
20:0
021
:00
22:0
023
:00
00:0
0
-10
-5
0
5
10
15
20
25
30
35
40
45
00:0
001
:00
02:0
003
:00
04:0
005
:00
06:0
007
:00
08:0
009
:00
10:0
011
:00
12:0
013
:00
14:0
015
:00
16:0
017
:00
18:0
019
:00
20:0
021
:00
22:0
023
:00
00:0
0
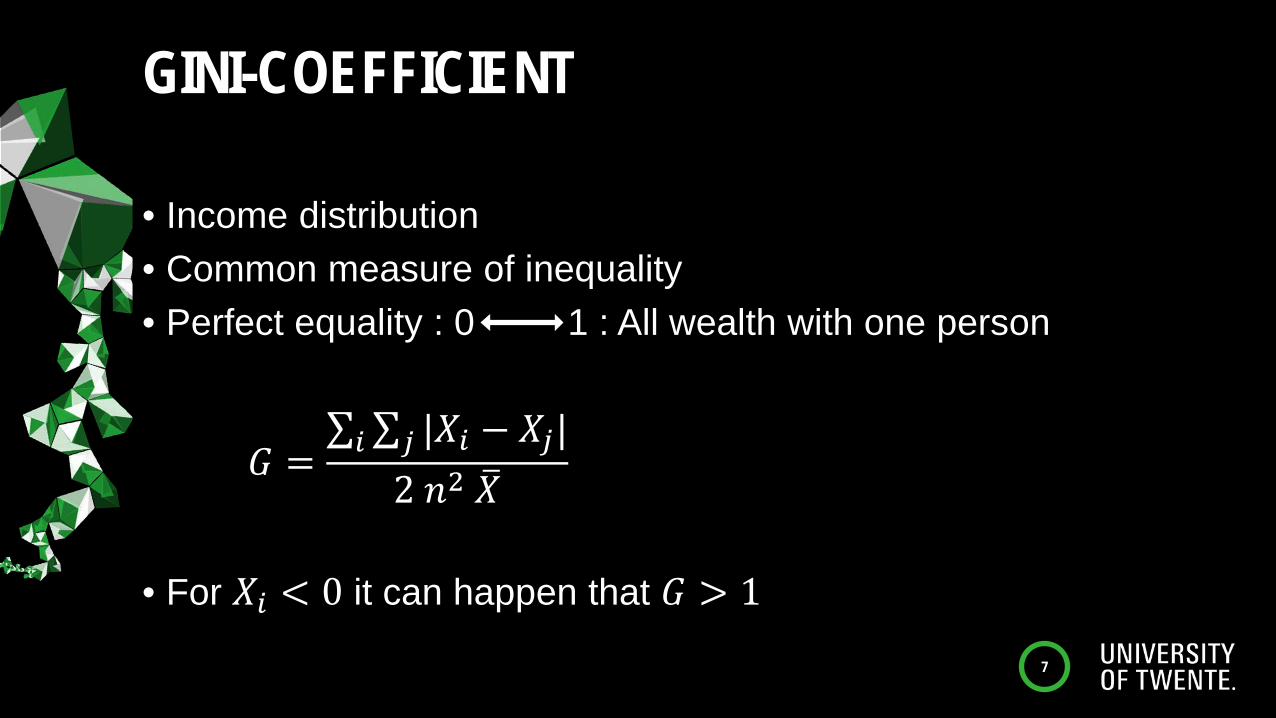
GINI-COEFFICIENT
• Income distribution• Common measure of inequality• Perfect equality : 0 1 : All wealth with one person
• For 𝑋𝑋𝑖𝑖 < 0 it can happen that 𝐺𝐺 > 1
7
𝐺𝐺 =∑𝑖𝑖 ∑𝑗𝑗 |𝑋𝑋𝑖𝑖 − 𝑋𝑋𝑗𝑗|
2 𝑚𝑚2 �𝑋𝑋
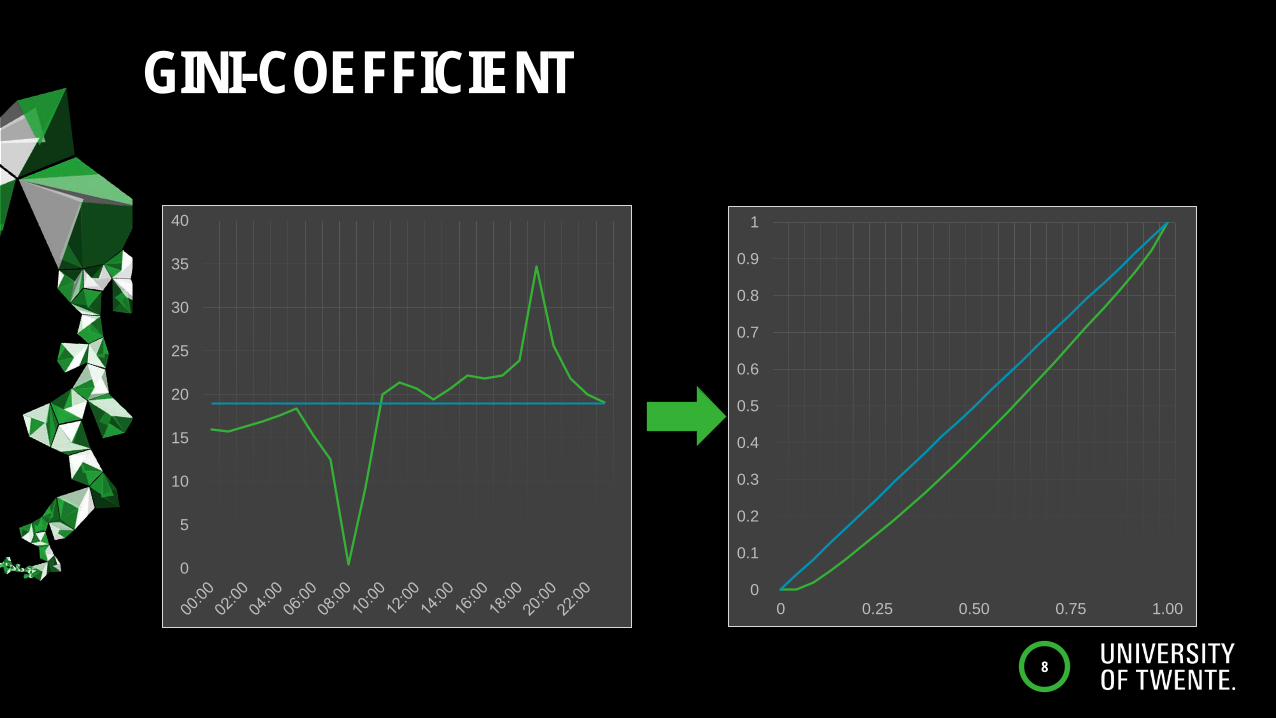
GINI-COEFFICIENT
8
0
0.1
0.2
0.3
0.4
0.5
0.6
0.7
0.8
0.9
1
0 0.25 0.50 0.75 1.00
0
5
10
15
20
25
30
35
40
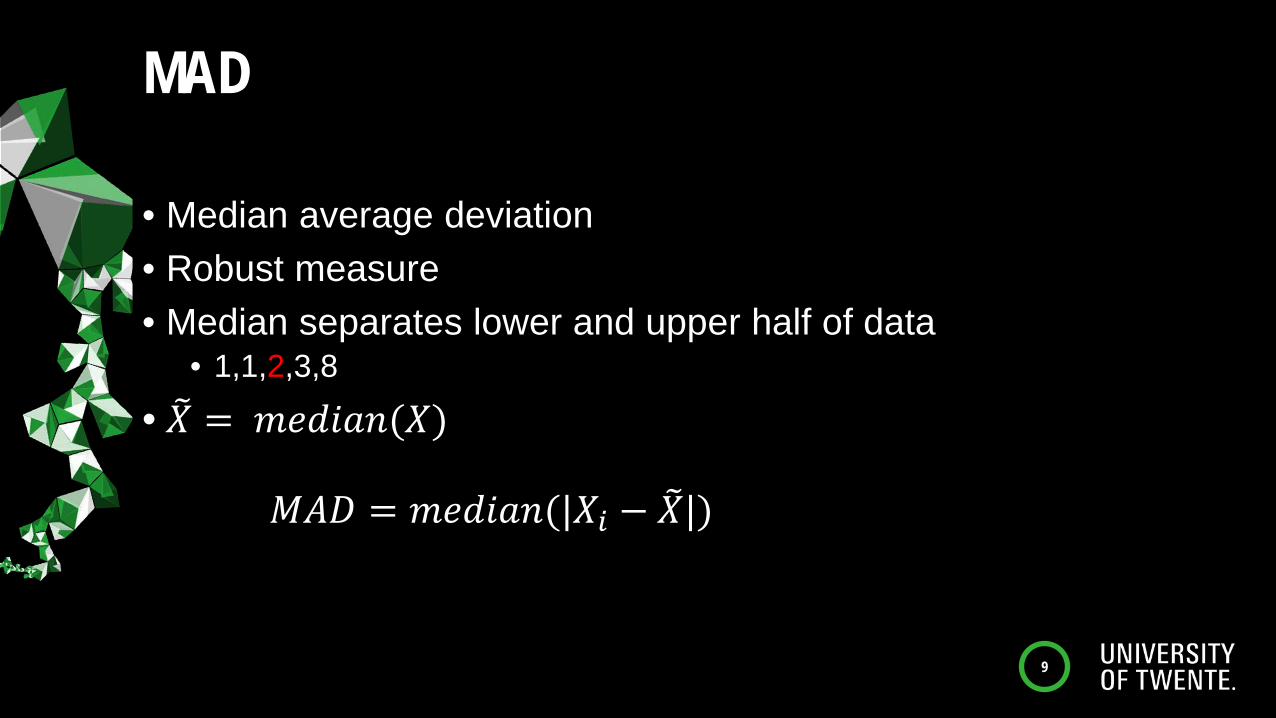
MAD
• Median average deviation• Robust measure• Median separates lower and upper half of data
• 1,1,2,3,8
• �𝑋𝑋 = 𝑚𝑚𝑚𝑚𝑚𝑚𝑚𝑚𝑚𝑚𝑚𝑚(𝑋𝑋)
9
𝑀𝑀𝑃𝑃𝑀𝑀 = 𝑚𝑚𝑚𝑚𝑚𝑚𝑚𝑚𝑚𝑚𝑚𝑚(|𝑋𝑋𝑖𝑖 − �𝑋𝑋|)
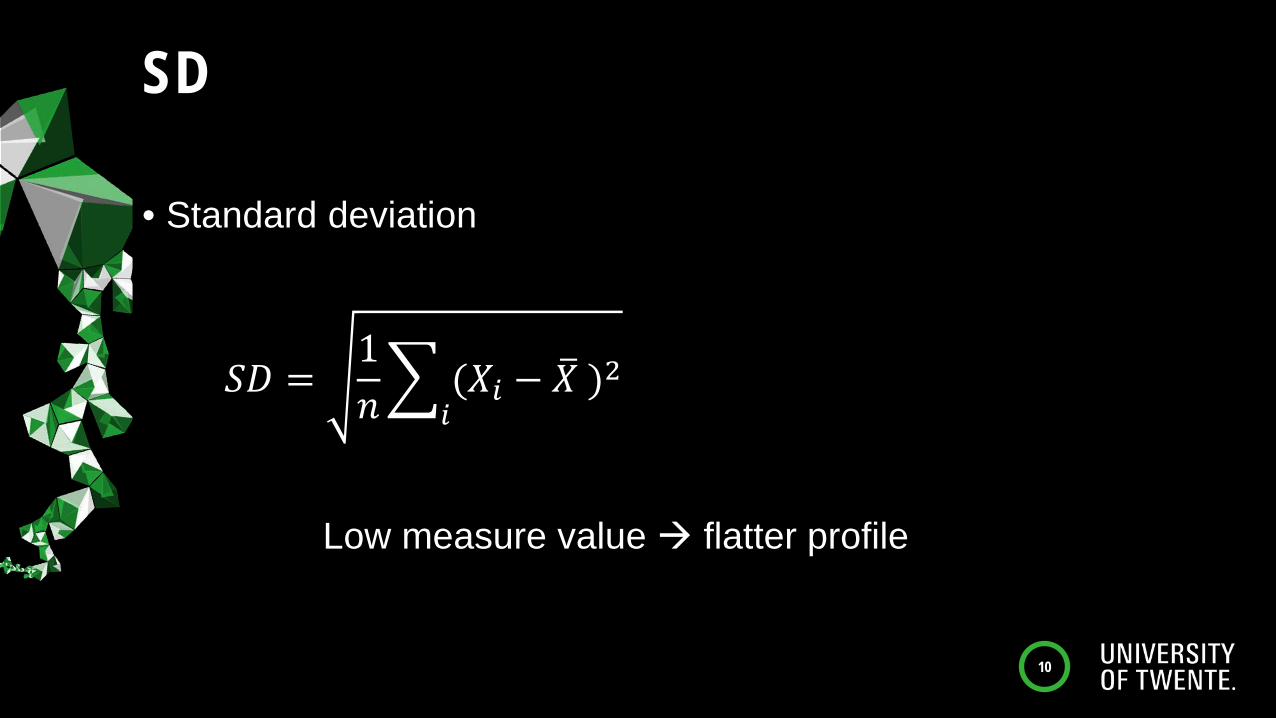
SD
• Standard deviation
Low measure value flatter profile aaaa
10
𝑆𝑆𝑀𝑀 =1𝑚𝑚�
𝑖𝑖(𝑋𝑋𝑖𝑖 − �𝑋𝑋 )2
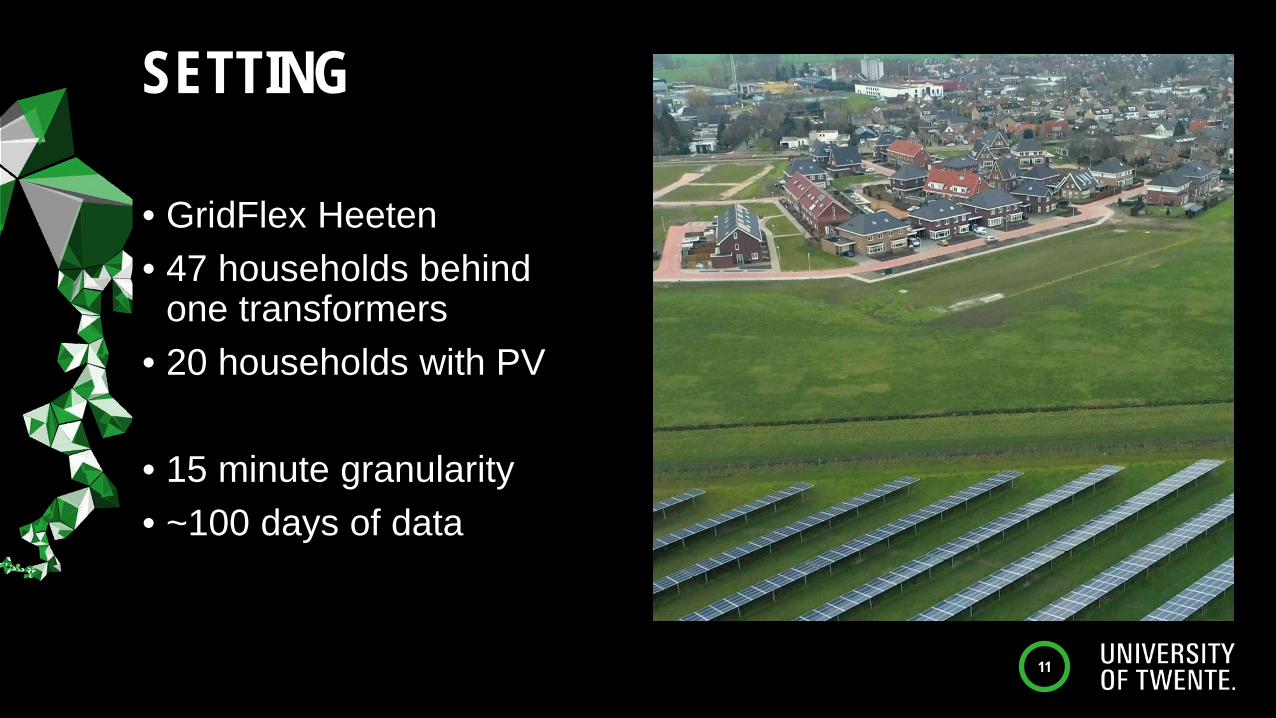
SETTING
• GridFlex Heeten• 47 households behind
one transformers• 20 households with PV
• 15 minute granularity• ~100 days of data
11
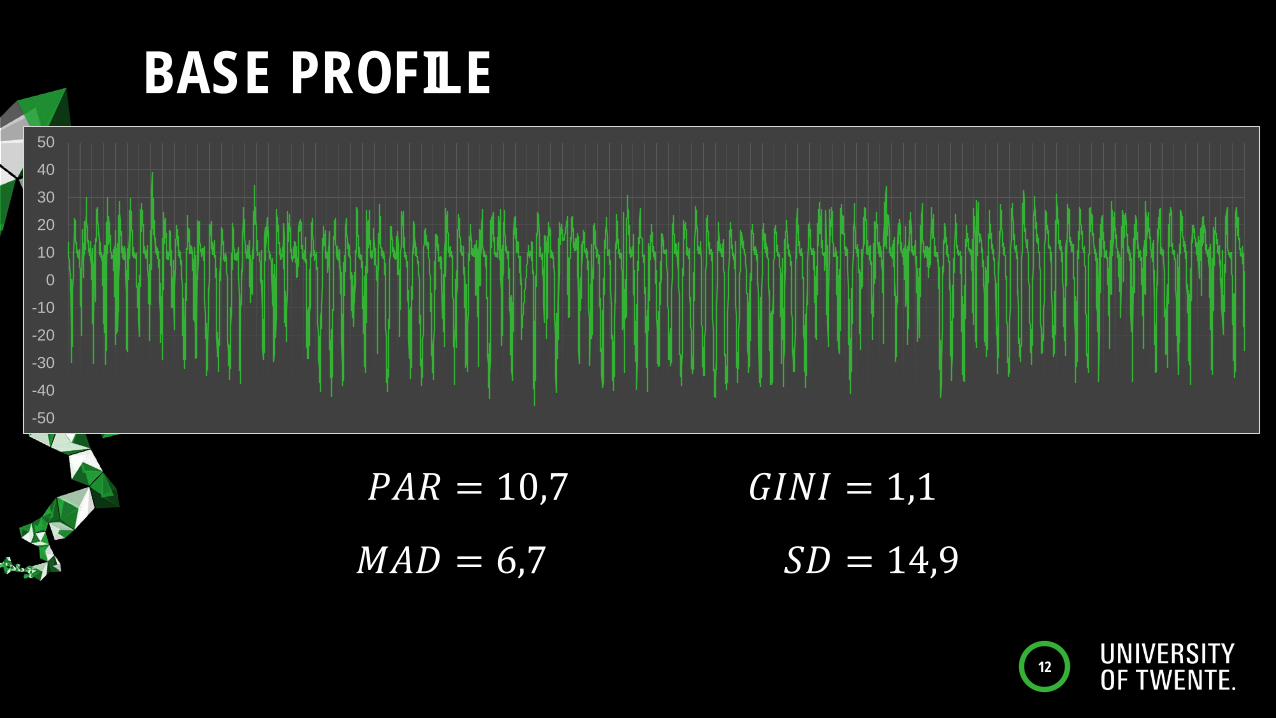
BASE PROFILE
12
𝑃𝑃𝑃𝑃𝑃𝑃 = 10,7
𝑀𝑀𝑃𝑃𝑀𝑀 = 6,7
𝐺𝐺𝐺𝐺𝐺𝐺𝐺𝐺 = 1,1
𝑆𝑆𝑀𝑀 = 14,9
-50
-40
-30
-20
-10
0
10
20
30
40
50
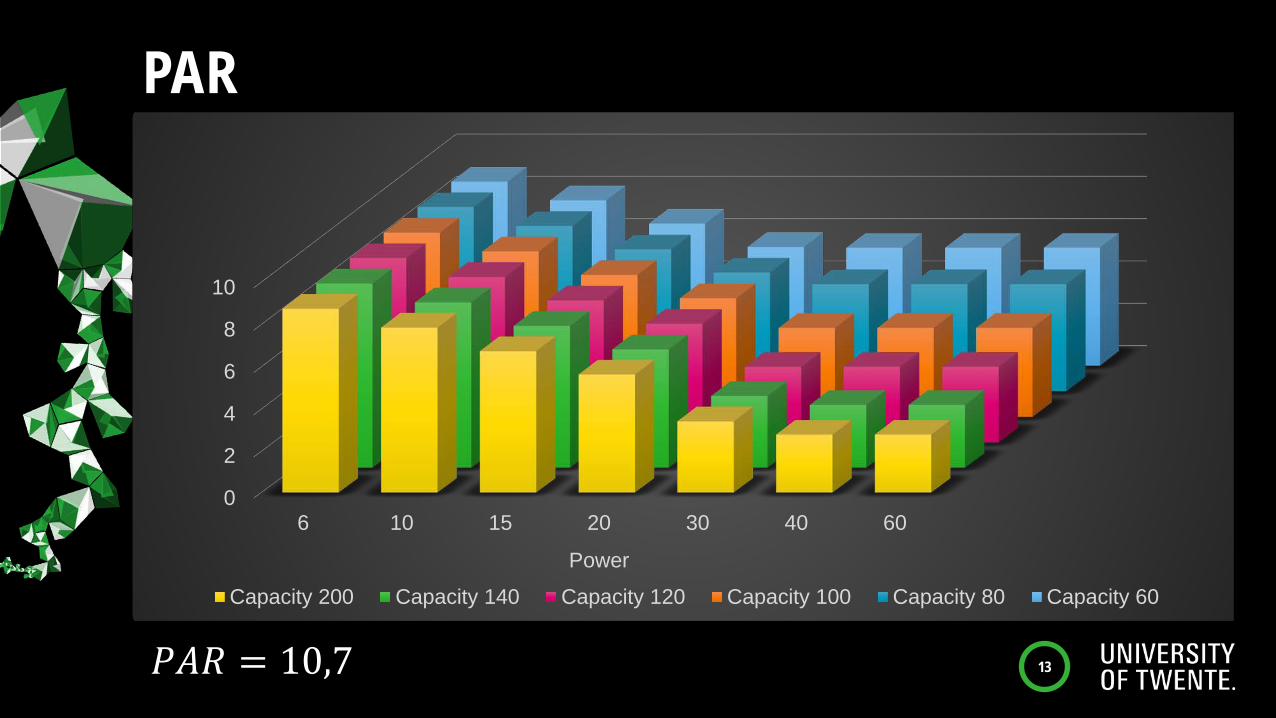
PAR
13
0
2
4
6
8
10
6 10 15 20 30 40 60
Power
Capacity 200 Capacity 140 Capacity 120 Capacity 100 Capacity 80 Capacity 60
𝑃𝑃𝑃𝑃𝑃𝑃 = 10,7
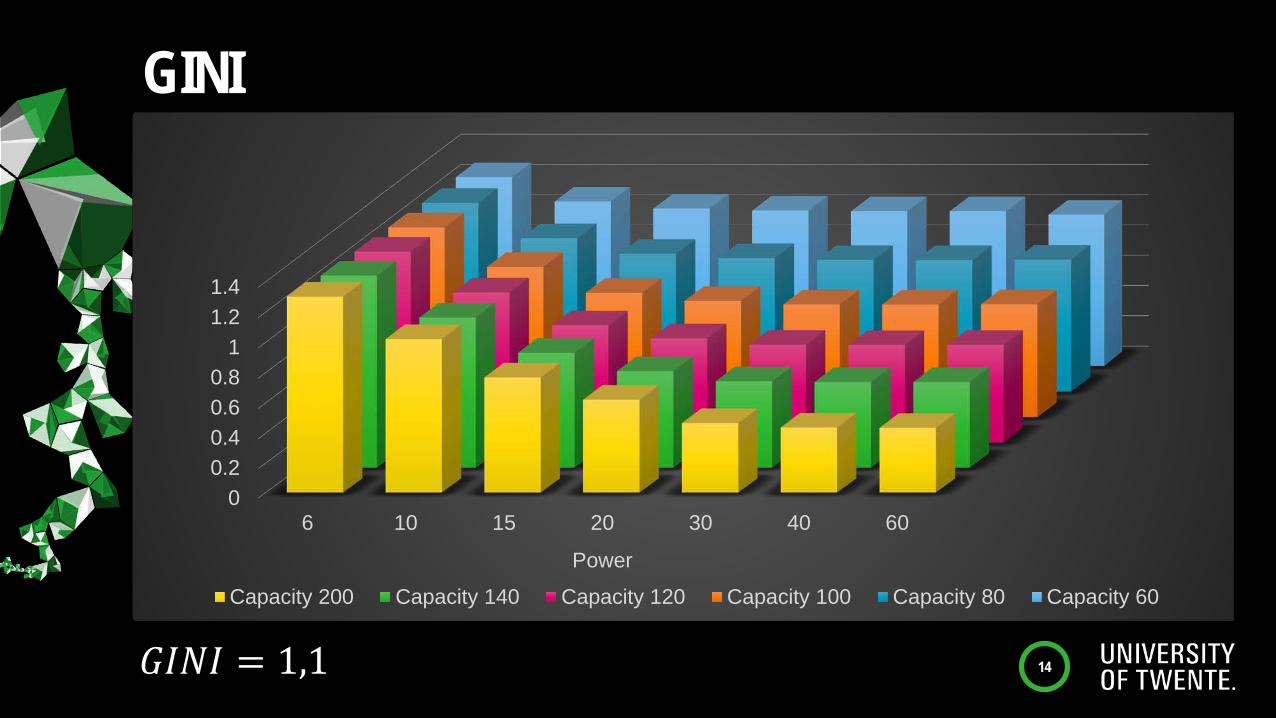
GINI
14
00.20.40.60.8
11.21.4
6 10 15 20 30 40 60
Power
Capacity 200 Capacity 140 Capacity 120 Capacity 100 Capacity 80 Capacity 60
𝐺𝐺𝐺𝐺𝐺𝐺𝐺𝐺 = 1,1
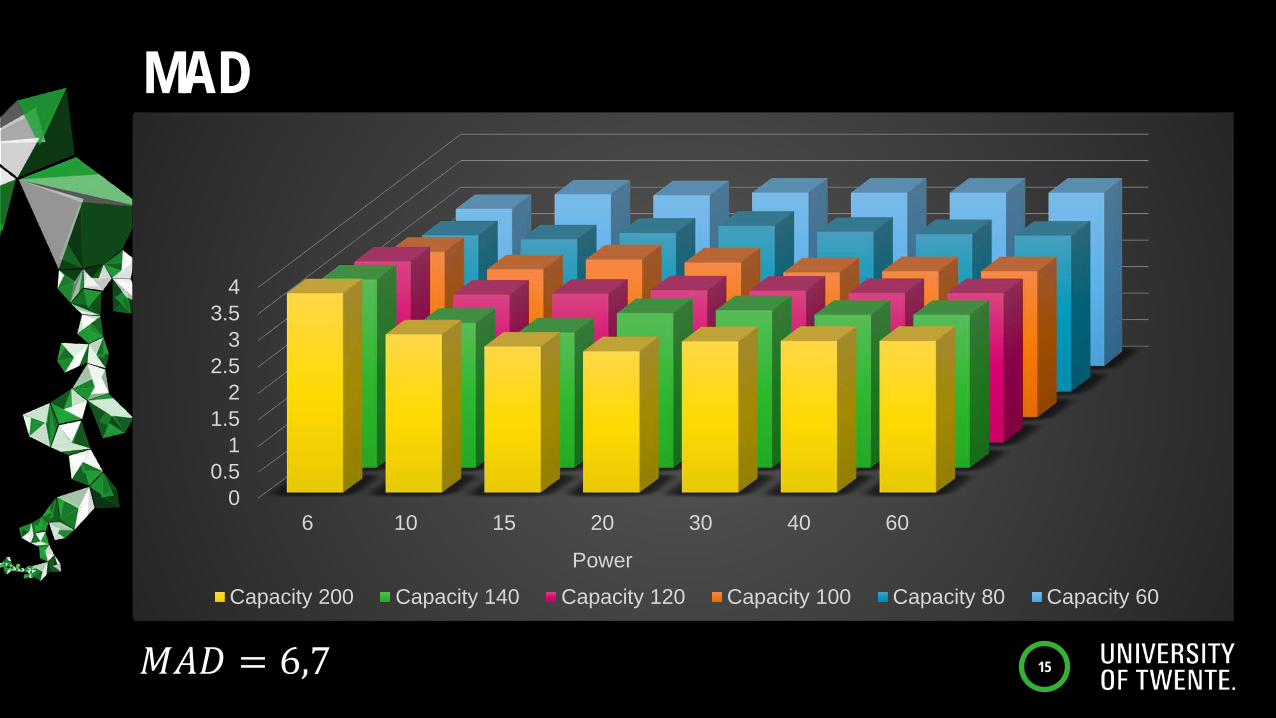
MAD
15
00.5
11.5
22.5
33.5
4
6 10 15 20 30 40 60
Power
Capacity 200 Capacity 140 Capacity 120 Capacity 100 Capacity 80 Capacity 60
𝑀𝑀𝑃𝑃𝑀𝑀 = 6,7
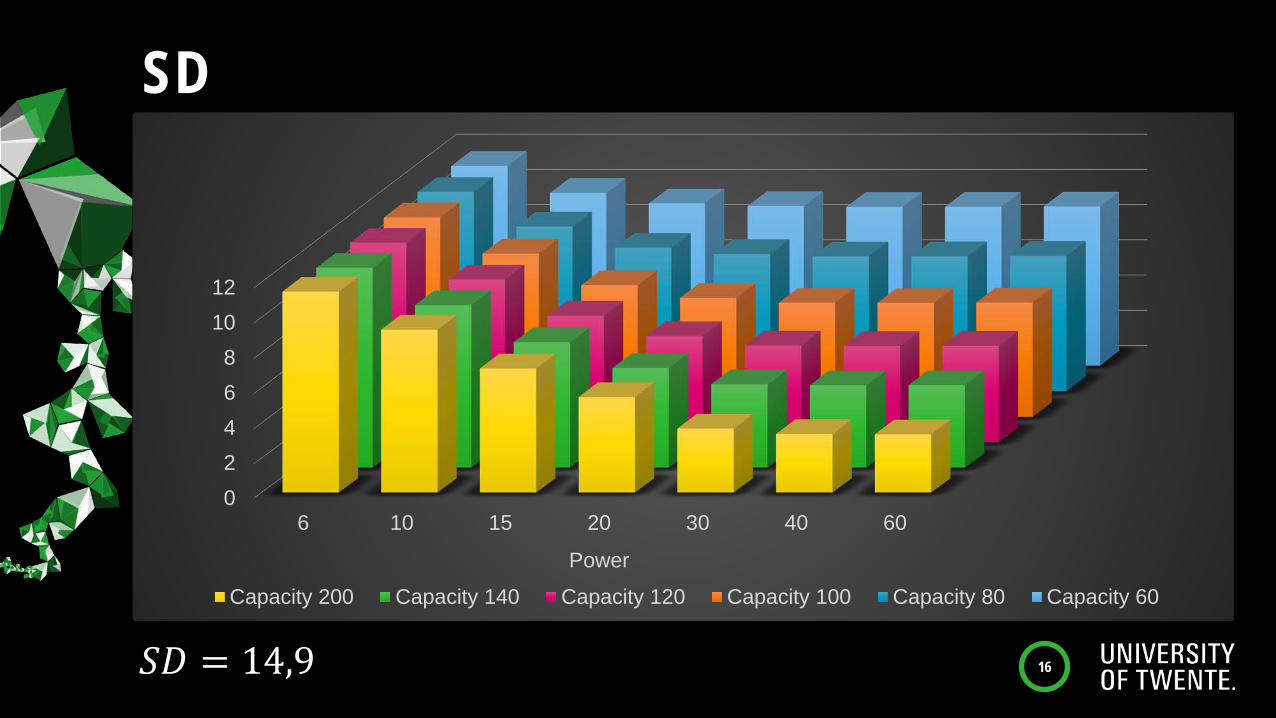
SD
16
02468
1012
6 10 15 20 30 40 60
Power
Capacity 200 Capacity 140 Capacity 120 Capacity 100 Capacity 80 Capacity 60
𝑆𝑆𝑀𝑀 = 14,9
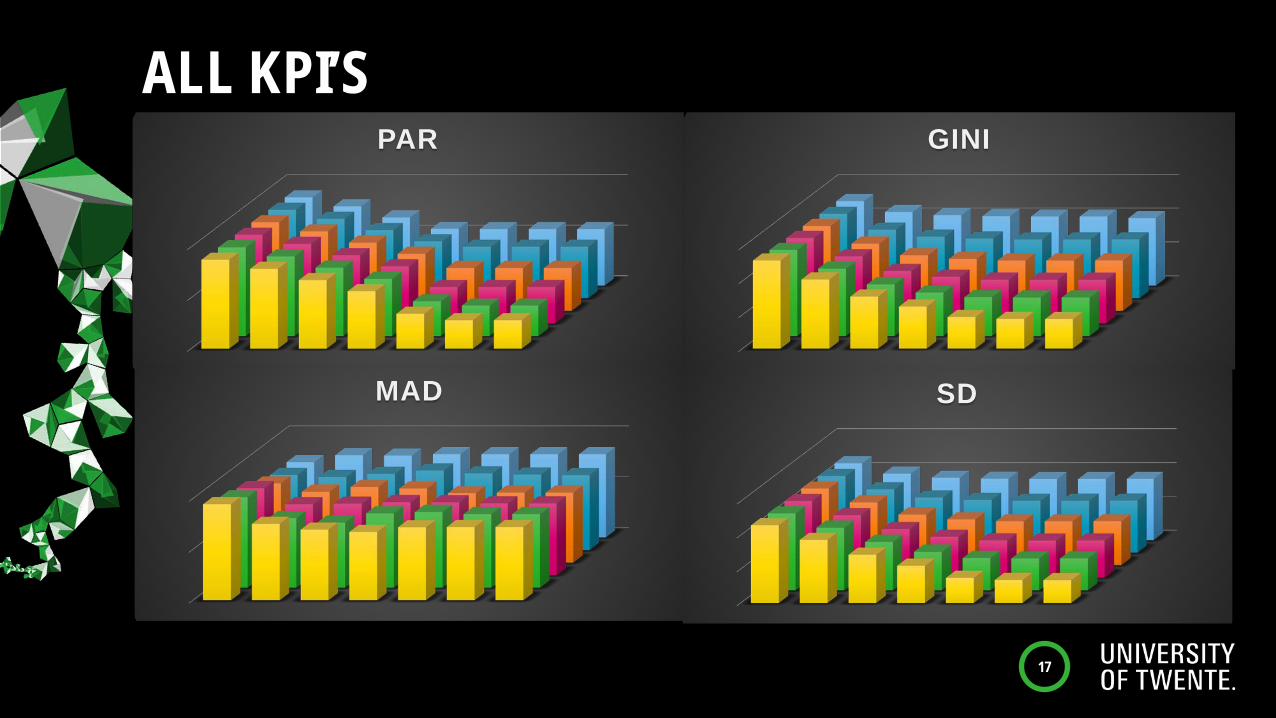
ALL KPI’S
17
PAR GINI
MAD SD
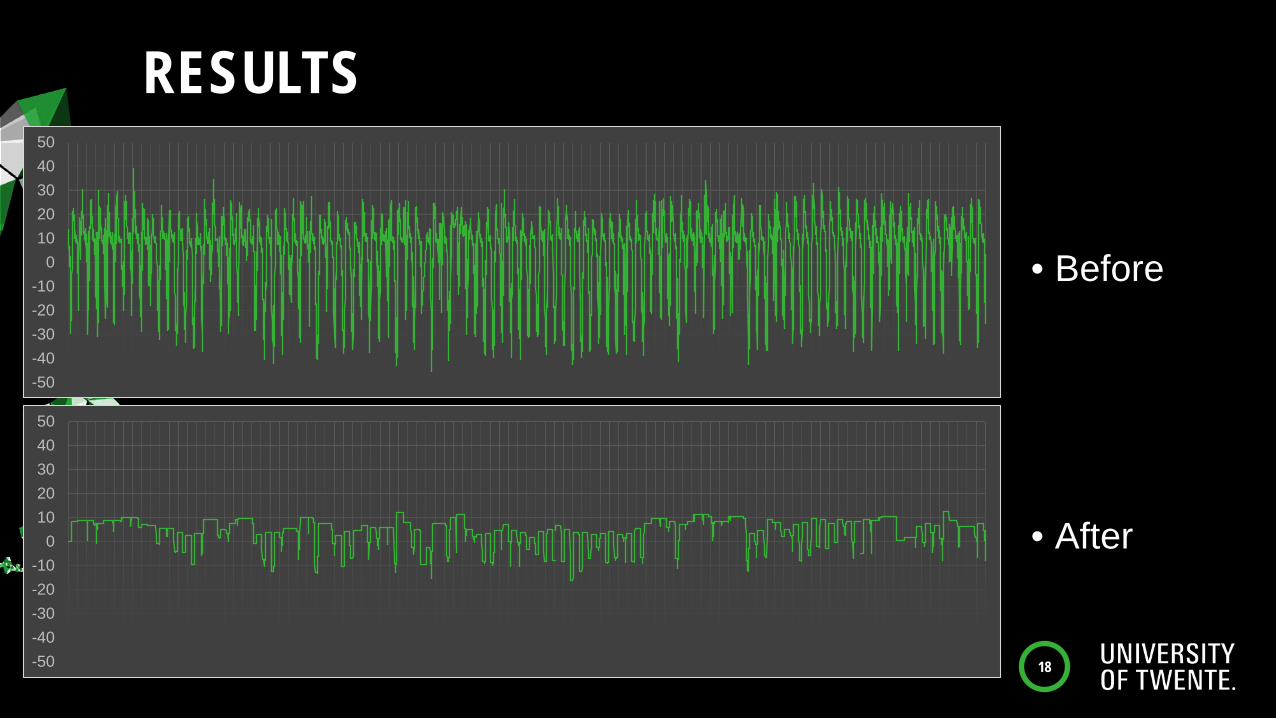
RESULTS
• Before
• After
18
-50-40-30-20-10
01020304050
-50-40-30-20-10
01020304050
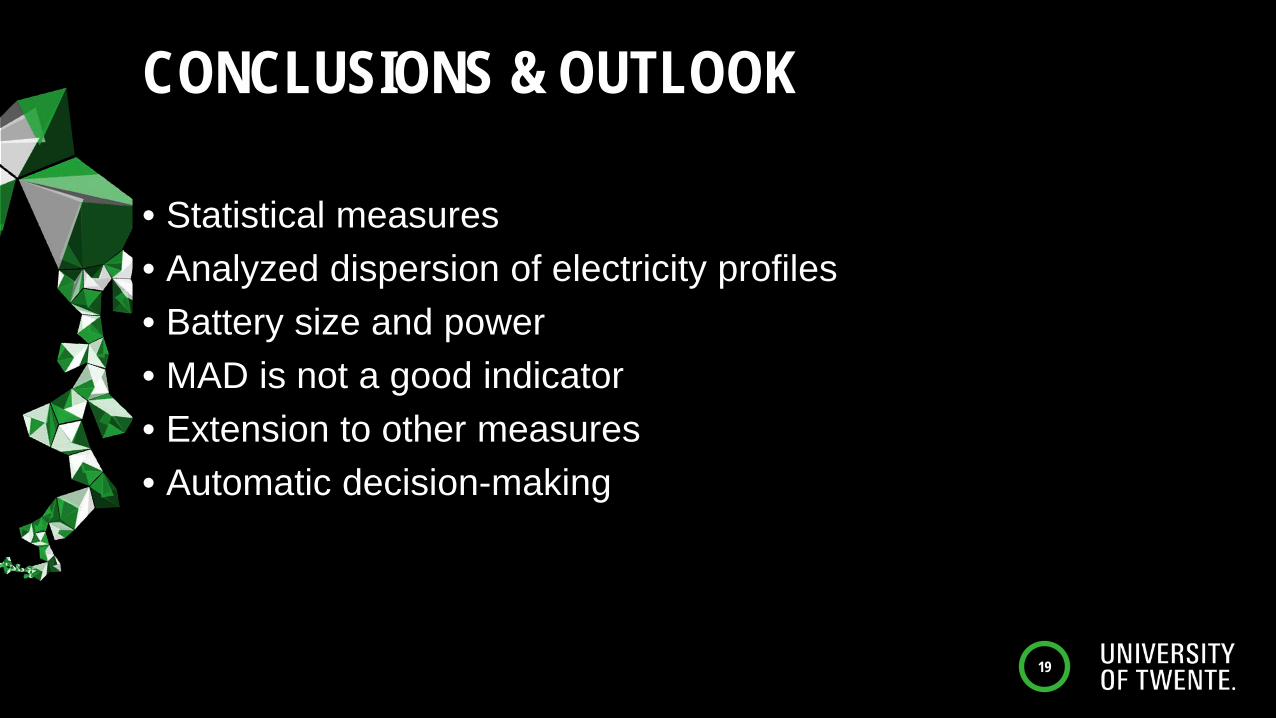
CONCLUSIONS & OUTLOOK
• Statistical measures• Analyzed dispersion of electricity profiles• Battery size and power• MAD is not a good indicator• Extension to other measures• Automatic decision-making
19

20
VICTOR REIJNDERSPhD StudentEmail: