deepwater trends and implications for the drilling marketswiber.listedcompany.com/misc/drilling_...
TRANSCRIPT

Strategic Advisors in Global Energy
Deepwater Trends and Implications for the Drilling Market
June 12, 2008
PFC Energy
Swiber Deepwater Open Forum

Table of Contents
| Page 2
� Overview of Fundamentals – Long Term Supply and Price Implications
� Significance of Deepwater Oil and Gas in Upstream Portfolios
� Deepwater Rig Supply and Demand – Implications for Future Day Rates
� Drilling Activity Forecasts

• In spite of high oil prices, Non-OPEC conventional production has been flatto declining with the exception of the FSU.
• Oil exploration in the last 10 years (with a few exceptions like Angola, Sudan,Mauritania, Brazil) has been much less successful than in previous decades.Since 1990 reserve replacement in non-OPEC has been less that 35 percent.
• Every year, in every region (including OPEC), the world produces more oilthan it finds. It is only logical to conclude that inevitably this will lead tosupply and daily rate issues. Our current view is that absent significant
Key Messages
| Page 3
supply and daily rate issues. Our current view is that absent significantimprovements in recovery technologies or exploration results global non-OPEC liquid hydrocarbon production will struggle to grow beyond 2010 andmay in fact start to decline.
• Non-OPEC production growth between now and the end of this decade willrely heavily on production growth in Kazakhstan, Azerbaijan, Russia, Brazil,and several smaller producing countries.
• If demand continues to grow beyond 2010 and if Non-OPEC productioncapacity plateaus or falls, OPEC will have to make up the difference resultingin an inevitable increase in dependency on OPEC sources.

Global Non-OPEC Liquids & OPEC Non-Quota Liquids Supply Forecast (With Exploration)
30,000
40,000
50,000
60,000
70,000
Daily Production (mb/d)
Global Non-OPEC & OPEC Non-Quota Total Liquids Forecast with Exploration
| Page 4
0
10,000
20,000
30,000
1985
1990
1995
2000
2005
2010
2015
2020
Daily Production (mb/d)
Europe USA Middle East
Africa Canada AustralAsia
Latin America FSU/EE Canada Unconventional Heavy
OPEC & Non-OPEC NGL Biofuels GTL
Oil Shale
A combined forecast of Non-OPEC liquids and OPEC non-quota liquids suggeststhat production will grow to just around 60 million barrels per day by 2015.

Uzbekistan
Norway
Oman
New Zealand
Argentina
Congo
Colombia
Australia
Yemen
Denmark
Mexico
Chad
Canada
Brunei
Malaysia
India
China
Turkmenistan
Countries in the decline phase
Countries in the plateau phase
Non-OPEC Countries in Decline or in Plateau
| Page 5
1965 1970 1975 1980 1985 1990 1995 2000 2005
USA
Romania
Tunisia
Peru
Dem Rep Congo
Cameroon
Other Europe
Egypt
Pakistan
Papua New Guinea
Syria
UK
Gabon
Uzbekistan
The above bars show the onset and duration of documented productionpeaks or plateaus – tracking country life cycle shows an acceleration ofthe number of countries passing from peak to decline
Onset of Plateau
Duration of Plateau
Onset of Decline

Why Has Traditional Exploration Been Slow to React to High Prices?
60
80
100
120
140
160
180
200
Mean Field Size (mmbo)
Mean Field Size Country History
Mean Field Size Post-1990
| Page 6
0
20
40
60
Argentina
Pakistan
Thailand
Indonesia
India
Colombia
Oman
Peru
Gabon
Egypt
Congo
Ecuador
China
Yemen
Kazakhstan
Malaysia
Syria
Denmark
Algeria
UK
Libya
Norway
Mexico
Vietnam
Azerbaijan
Venezuela
Mean Field Size (mmbo)
Comparison of Mean Sizes for All Basin History Versus the Post 1990 Period

2,000
4,000
6,000
8,000
10,000
12,000
Differential Between Annual Volumes Produced and
Annual Vloumes Discovered (m
mbo)
Annual Reserves Disc - Annual Reserves Prod
4 per. Mov. Avg. (Annual Reserves Disc - Annual Reserves Prod)
12 Consecutive Years Where Annual Production Volumes Have Exceeded Annual
Volumes Discovered
Annual Non-OPEC Crude Production Balance (excluding FSU, USA, and Uncon. Heavy Oil)
| Page 7
-8,000
-6,000
-4,000
-2,000
0
2,000
1965
1970
1975
1980
1985
1990
1995
2000
2005Differential Between Annual Volumes Produced and
Annual Vloumes Discovered (m
mbo)
PFC Energy’s analysis indicates that countries within this group have, inaggregate, been producing 4-5 billion barrels each year more than they have beenfinding through exploration since the mid-1990s.

Concerns With OPEC Reserves
• The real issue here is that we really do not know what several key OPECcountries reserves really are because there is no way to independently verifythem as we can in most non-OPEC countries where you have foreigncompanies doing the exploration and development.
• The shape and style of these country’s remaining reserve profiles in the face ofdisappointing exploration results over the last 20 years and the fact that theyalmost exactly offset production with reserves through book keeping has toraise suspicions - A comparison of actual new discoveries and productionvolumes indicates that OPEC has been running a negative crude oil balance
| Page 8
volumes indicates that OPEC has been running a negative crude oil balancesince the early 1980s with production volumes exceeding new volumesdiscovered by approximately 6.0-8.0 billion barrels per annum
• Our analysis suggests that OPEC overall has depleted approximately 40percent of its reserve base with annual depletion levels running at 1 %/year(OPEC would argue that it is their policy to have 0% depletion) ….. If PFC’sestimated rate of depletion is correct then OPEC will reach the critical level of60% in the later part of the next decade.

OPEC Historical Annual Crude Production Balance (OPEC)
C h a r t T it le
0
2 ,0 0 0
4 ,0 0 0
6 ,0 0 0
8 ,0 0 0
1 0 ,0 0 0
Differential Betw
een Annual Volumes Produced
and Annual Vloumes Discovered (mmbo)
Annua l R eserves D iscovered - Annua l R eserves P roduced
3 p e r . Mov . Avg . (Annua l R eserves D iscovered - Annua l R eserves P roduced )
| Page 9
Like all other areas of the world, PFC Energy’s data analysis indicates that GlobalOPEC crude production is currently exceeding volumes discovered.
-1 0 ,0 0 0
-8 ,0 0 0
-6 ,0 0 0
-4 ,0 0 0
-2 ,0 0 0
0
1965
1970
1975
1980
1985
1990
1995
2000
2005
Differential Betw
een Annual Volumes Produced
and Annual Vloumes Discovered (mmbo)

80,000
100,000
120,000
Daily Production (mb/d)
80,000
100,000
120,000
Non-OPEC Crude Non-OPEC Oil Sands
Non-OPEC NGL & Condensate OPEC NGL
1.1% Growth 1.7% Growth
2.4% Growth
37-45 mmb/d
46-58 mmb/d
Call on OPEC Crude
OPEC 33-36 mmb/d
The Dilemma - The Expected Growing Gap Between Global Demand and Global Non-OPEC Supply in the Next Decade
| Page 10
0
20,000
40,000
60,000
1995
2000
2005
2010
2015
2020
Daily Production (mb/d)
0
20,000
40,000
60,000
OPEC Crude

Table of Contents
| Page 11
� Overview of Fundamentals – Long Term Supply and Price Implications
� Significance of Deepwater Oil and Gas in Upstream Portfolios
� Deepwater Rig Supply and Demand – Implications for Future Day Rates
� Drilling Activity Forecasts

Production growth will come from 5 major categories
• Unconventional heavy oil (Canada and Venezuela)
• Monetizing large gas reserves through LNG
• Deepwater E&P
• Caspian/FSU E&P
• All other
– New shallow water or onshore discoveries
Growth: Where will it Come From?
| Page 12
– Older shallow water or onshore discoveries now commerciallyviable because of oil and gas prices
– Large gas projects developed for pipeline
– Projects gained thru improved access
– Unconventional natural gas
– Others

Where Are the Large Producers Adding New Production?
3000
4000
5000
6000
7000
8000
9000Entitlement Production (mboe/day)
All Other
Russia/Caspian
Deepwater
LNG
Unc Heavy Oil
| Page 13
• The above profile shows the breakout of entitlement production (barrelsequivalent) for: XOM, BP, Shell, Chevron, CoP, Total, ENI.
• Production additions from more conventional onshore and shallow waterplays (outside of the FSU) accounts for only about 25% of new production
0
1000
2000
200020
0220
04
200620
0820
1020
1220
14
201620
1820
2020
2220
24
202620
2820
30
Entitlement Production (mboe/day)

Global Deepwater Competition Service
Location of Global Deepwater ProjectsNorth Atlantic
Total Projects: 24
MediterraneanTotal Projects: 5
| Page 14
Total Projects: 217Minimum Water Depth 1,000 feet
Gulf of MexicoTotal Projects: 130
Latin AmericaTotal Projects: 21
West AfricaTotal Projects: 54
Asia-PacificTotal Projects: 17

Global Deepwater – Who are the players?
Who are the players?
Asia-Pacific Gulf of Mexico Latin America Mediterranean North Atlantic West Africa
BHP Billiton Anadarko Chevron BG BP BP
Chevron ATP Oil & Gas Petrobras BP ConocoPhillips Chevron
ConocoPhillips BHP Billiton Repsol YPF Hess Eni CNR
Eni BP Shell Petronas ExxonMobil Devon
Mitsui Chevron RWE-Dea Gaz de France Eni
Murphy ConocoPhillips Hess ExxonMobil
Niko Devon Idemitsu Hardman
Deepwater Participants By Region (Minimum 100 Net mmboe Global Deepwater)
| Page 15
Petronas Eni Marathon Hess
Reliance ExxonMobil Murphy Petrobras
Shell Helix RWE-Dea Petronas
Woodside Hess Shell Shell
Marathon StatoilHydro StatoilHydro
Marubeni Total Total
Murphy UK
Nexen
Petrobras
Shell
StatoilHydro
Total
Woodside

Global Deepwater Reserves in Known Discoveries
6,000
9,000
12,000
15,000
mmboe
West Africa
Asia-Pacific
North Atlantic
Mediterranean
Brazil
Mean Net Deepwater Reserves by Region
(Minimum 100 Million BOE)
Deepwater Reserves: All Companies
| Page 16
While nearly 40 companies have net deepwater reserves exceeding 100 mmboe (originally recoverable)…
0
3,000
6,000
Petrobras
StatHydroBP
Shell
ExxMob
Chevron
TOTAL
Eni
Reliance
Petronas
Hess
Anadarko
Woodside
BG
ConPhil
Marathon
Murphy
Sinopec
BHP
RWE-Dea
Devon
CNOOC
NNPC
GdF
DONG
Idemitsu
ATP Oil
Marubeni
Nexen
Helix
Niko
Repsol
E.ON
Petrogal
SAPCO
CNR
Famfa
Gulf of Mexico

Global Deepwater Major Players
9,000
12,000
15,000
mmboe
West Africa
Asia-Pacific
North Atlantic
Mediterranean
Brazil
Mean Net Deepwater Reserves by Region: Tier One Competitors
(Over 1.0 Billion BOE)
Deepwater Reserves: Tier 1 Competitors
| Page 17
0
3,000
6,000
Petrobras
StatHydro
BP
Shell
ExxMob
Chevron
TOTAL
Eni
Reliance
Petronas
Brazil
Gulf of Mexico
…only ten have net deepwater reserves exceeding 1 billion boe (originally recoverable); these competitors tend to have deepwater reserves in more
than one geographic region, although a single region is typically dominant.

Global Deepwater Remaining Reserves
Deepwater Reserves: Tier 1 CompetitorsRanking By Portion of Remaining Portfolio
9,000
12,000
15,000
mmboe
80%
90%
100%
Mean Net Deepwater Reserves: Remaining vs Produced
| Page 18
0
3,000
6,000
Petrobras
StatHydro
BP
ExxMob
Chevron
Shell
TOTAL
Reliance
Eni
Petronas
50%
60%
70%
Remaining Produced % Remaining
While net volumes vary considerably across the sample of ten Tier 1 companies, for each company, remaining (yet-to-be produced) reserves
account for the bulk (60% or more) of total original volumes.
Global Deepwater Production From Known Discoveries
4,000
6,000
8,000
10,000Reliance
PetronasChevron
ExxMobEni
ShellBP
TOTALStatHydro
Petrobras
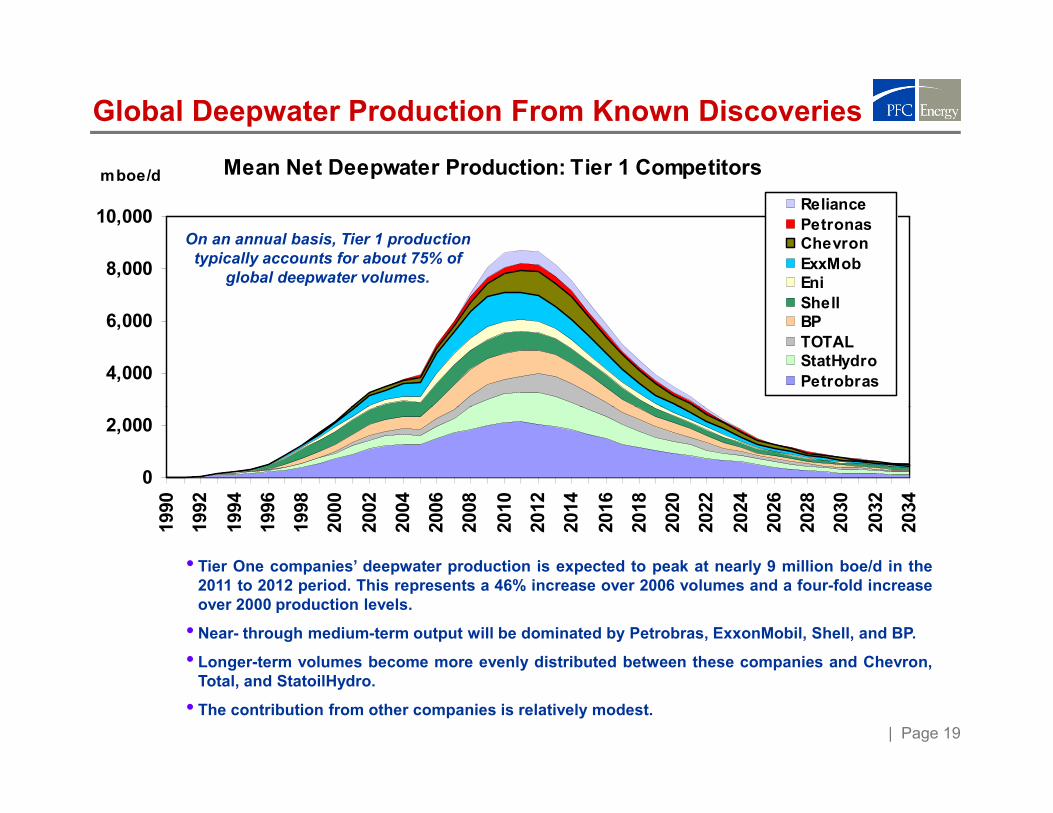
mboe/d Mean Net Deepwater Production: Tier 1 Competitors
On an annual basis, Tier 1 production typically accounts for about 75% of
global deepwater volumes.
| Page 19
0
2,000
1990
1992
1994
1996
1998
2000
2002
2004
2006
2008
2010
2012
2014
2016
2018
2020
2022
2024
2026
2028
2030
2032
2034
• Tier One companies’ deepwater production is expected to peak at nearly 9 million boe/d in the2011 to 2012 period. This represents a 46% increase over 2006 volumes and a four-fold increaseover 2000 production levels.
• Near- through medium-term output will be dominated by Petrobras, ExxonMobil, Shell, and BP.
• Longer-term volumes become more evenly distributed between these companies and Chevron,Total, and StatoilHydro.
• The contribution from other companies is relatively modest.

Global Deepwater Competition Service
Deepwater Reserves & Capex: Tier 1 Competitors
Net Capex vs Net Oil & Gas Reserves
20,000
30,000
40,000
50,000
Net Capex ($mm)
Petrobras
BP
StatoilHydro
Shell
ExxMobTotal
Chevron
| Page 20
Comparative spending is commensurate with relative volumetric positioning.
0
10,000
20,000
0 3,000 6,000 9,000 12,000 15,000
Net Capex ($mm)
Net Reserves (mmboe)
ChevronEni
ReliancePetronas

Net Cash Flow: Tier 1 Competitors
Global Deepwater Net Cash Flow
0
30,000
60,000
90,000
120,000
150,000
180,000
$mmWest Africa
Asia-Pacific
North Atlantic
Mediterranean
Latin America
Gulf of Mexico
Mean Net Cash Flow by Region ($50 Oil)
| Page 21
Deepwater Portfolio Net Cash Flow
Global NCF Range ($50 Oil): $11.4 billion to $177.2 billion
Note: Results are based on full cycle data (includes exploration and appraisal spending).
0
Petrobras
BP
Shell
ExxMob
Chevron
StatHydro
TOTAL
Eni
Reliance
Petronas
As is the case with reserves, for Tier 1 competitors a single region is often dominant with respect to Net Cash Flow.

Net NPV10: Tier 1 Competitors
Global Deepwater Value
0
5,000
10,000
15,000
20,000
25,000
30,000
35,000
$mmWest Africa
Asia-Pacific
North Atlantic
Mediterranean
Latin America
Gulf of Mexico
Mean Net NPV10 by Region ($50 Oil)
| Page 22
Deepwater Portfolio NPV10
Global NPV10 Range ($50 Oil): $3.6 billion to $31.0 billion
Note: Results are based on full cycle data (includes exploration and appraisal spending).
0
Petrobras
BP
Shell
ExxMob
Chevron
StatHydro
TOTAL
Eni
Reliance
Petronas
As is the case with reserves, for Tier 1 competitors a single region is typically dominant with respect to NPV10.

Global Deepwater Competition Service
Comparative Net Cash Flow: Tier 1 Competitors
• Total NCF for Tier Onecompanies’ deepwaterdevelopments is projected to reach$42 billion in 2012.
• On a cumulative basis, the grouplikely reached payout (positivecumulative NCF) in 2003.
• For the typical Tier One-10,000
0
10,000
20,000
30,000
40,000
50,000
1986
1988
1990
1992
1994
1996
1998
2000
2002
2004
2006
2008
2010
2012
2014
2016
2018
2020
2022
2024
2026
2028
2030
2032
2034
Reliance
EniPetronasChevronTOTALStatoilHydroPetrobras
ExxMobShellBP
$mm
$Bn
Global Deepwater Portfolio Net Cash Flow: Tier One Competitors
| Page 23
Note: Assumes $50 oil
• For the typical Tier Onecompany (as measured on amedian basis), cumulative NCFassociated with deepwaterprojects reached a negative $1.1billion in 1998, with payout likelyoccurring in 2004.
• Among all Tier One competitors,only Reliance (with a relatively newdeepwater portfolio) has yet toreach both maximum negative NCFand payout.
1986
1988
1990
1992
1994
1996
1998
2000
2002
2004
2006
2008
2010
2012
2014
2016
2018
2020
2022
2024
2026
2028
2030
2032
2034
Maximum Cumulative Development Portfolio Net Cash
Flow vs Payout Timing
1996
1998
2000
2002
2004
2006
2008
2000 2002 2004 2006 2008 2010 2012
Maximum Negative CNFC
Payout (Year)
BPExxMob
Shell
Chevron
Median
Eni
TOTAL
StatoilHydroPbras
Reliance
Petronas

Table of Contents
| Page 24
� Overview of Fundamentals – Long Term Supply and Price Implications
� Significance of Deepwater Oil and Gas in Upstream Portfolios
� Deepwater Rig Supply and Demand – Implications for Future Day Rates
� Drilling Activity Forecasts

Rig Fleet Status – New Builds 2008-2011
| Page 25

PFC Energy’s Unique Solution: Integrated Supply –Demand Model for Offshore Drilling Rigs
DAY RATE FORECAST BY DAY RATE FORECAST BY
Development Well Forecast
Development Well Forecast
Oil and Gas Supply Forecasts
Oil and Gas Supply Forecasts
E&P Spending Forecast
E&P Spending Forecast
IOC/NOC Portfolios and Strategies
IOC/NOC Portfolios and Strategies
Exploration Well Forecast
Exploration Well Forecast
New Source Project Models
New Source Project Models
Historical Historical utilization and
Actual Contracted Actual Contracted
Rig Demand
DAY RATE FORECAST BY DAY RATE FORECAST BY
Development Well Forecast
Development Well Forecast
Oil and Gas Supply Forecasts
Oil and Gas Supply Forecasts
E&P Spending Forecast
E&P Spending Forecast
IOC/NOC Portfolios and Strategies
IOC/NOC Portfolios and Strategies
Exploration Well Forecast
Exploration Well Forecast
New Source Project Models
New Source Project Models
Historical Historical utilization and
Actual Contracted Actual Contracted
Rig Demand PFC Energy’s Added Value
| Page 26
DAY RATE FORECAST BY WATER DEPTH AND REGION
DAY RATE FORECAST BY WATER DEPTH AND REGION
Actual/Forecast Rig Count
by Water Depth and Location
Actual/Forecast Rig Count
by Water Depth and Location
New Build ProgramsNew Build Programs RetirementsRetirementsUpgradesUpgrades
Historical utilization and
day rate algorithms
utilization and day rate algorithms
Relocation and switching:Arbitrage algorithms
Relocation and switching:Arbitrage algorithms
Actual Contracted Rigs and
Contracted Rates
Actual Contracted Rigs and
Contracted Rates
Rig Supply
DAY RATE FORECAST BY WATER DEPTH AND REGION
DAY RATE FORECAST BY WATER DEPTH AND REGION
Actual/Forecast Rig Count
by Water Depth and Location
Actual/Forecast Rig Count
by Water Depth and Location
New Build ProgramsNew Build Programs RetirementsRetirementsUpgradesUpgrades
Historical utilization and
day rate algorithms
utilization and day rate algorithms
Relocation and switching:Arbitrage algorithms
Relocation and switching:Arbitrage algorithms
Actual Contracted Rigs and
Contracted Rates
Actual Contracted Rigs and
Contracted Rates
Rig SupplyReadily Available
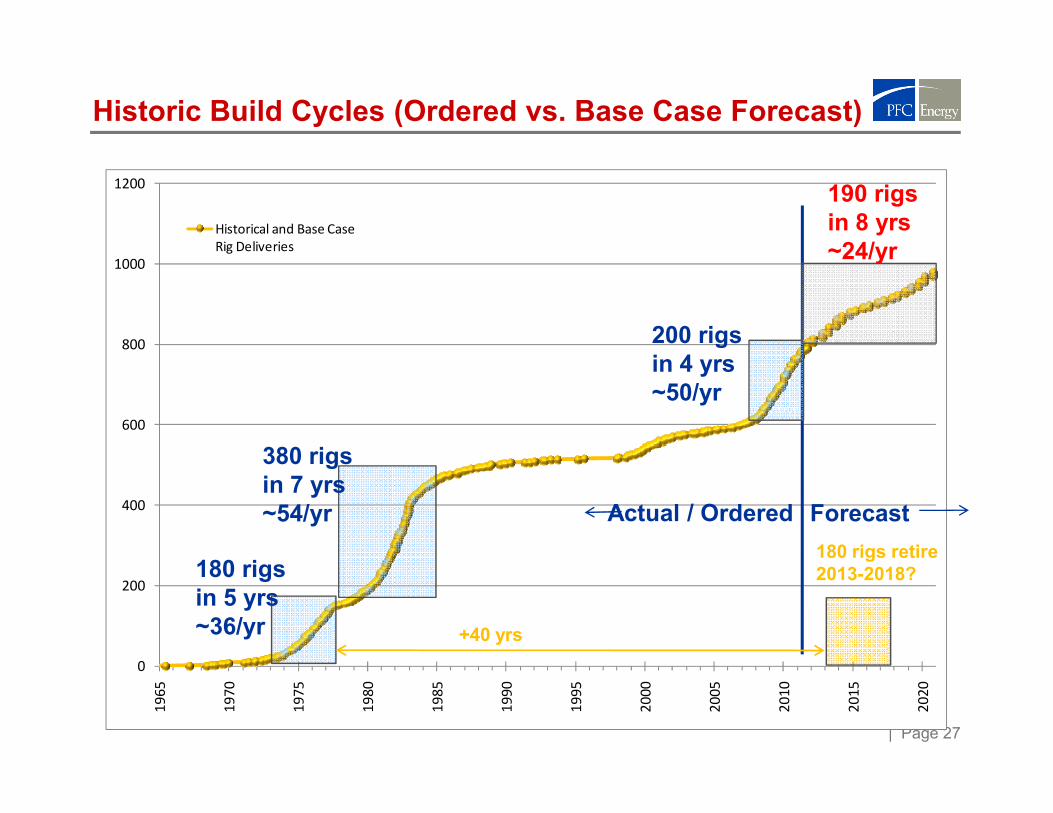
Historic Build Cycles (Ordered vs. Base Case Forecast)
800
1000
1200
Historical and Base Case
Rig Deliveries
200 rigs in 4 yrs ~50/yr
190 rigs in 8 yrs ~24/yr
| Page 27
0
200
400
600
19
65
19
70
19
75
19
80
19
85
19
90
19
95
20
00
20
05
20
10
20
15
20
20
380 rigs in 7 yrs ~54/yr
180 rigs in 5 yrs ~36/yr
Actual / Ordered Forecast
180 rigs retire 2013-2018?
+40 yrs

Table of Contents
| Page 28
� Overview of Fundamentals – Long Term Supply and Price Implications
� Significance of Deepwater Oil and Gas in Upstream Portfolios
� Deepwater Rig Supply and Demand – Implications for Future Day Rates
� Drilling Activity Forecasts

Projected Well Counts: West Africa
| Page 29

Projected Well Counts: Asia
0
50
100
150
200
250
300
350
Nu
mb
er
of
We
lls
Well Count 2000-2018 | Indonesia
Deep
Shallow
0
50
100
150
200
250
300
350
Nu
mb
er
of
We
lls
Well Count 2000-2018 | India
Deep
Shallow
| Page 30
0
2000 2002 2004 2006 2008 2010 2012 2014 2016 2018
0
2000 2002 2004 2006 2008 2010 2012 2014 2016 2018
0
50
100
150
200
250
300
350
2000 2002 2004 2006 2008 2010 2012 2014 2016 2018
Nu
mb
er
of
We
lls
Well Count 2000-2018 | Malaysia
Deep
Shallow

Projected Well Counts: Brazil
| Page 31

Deepwater Wells w/o Contracted Rigs, 2010-2014
60
80
100
120
140
160
| Page 32
0
20
40
Che
vron
She
ll
BP
TOTA
LEx
xonM
obil
ONGC
Pet
rona
sPet
robr
asCon
ocoP
hillips
Hes
sRel
ianc
e
San
tos
Mur
phy
Asia Pacific West & South Africa Brazil

Strategic Advisors in Global Energy
PFC Energy consultants are present in the following locations:
� Bahrain
� Beijing
� Buenos Aires
� Calgary
� Houston
Main regional offices:
Asia
PFC Energy, Kuala LumpurLevel 27, UBN Tower #21
10 Jalan P. Ramlee
50250 Kuala Lumpur, MalaysiaTel (60 3) 2172-3400
Fax (60 3) 2072-3599
Middle East
PFC Energy, BahrainManama Center
Entrance 4 - Office 705
Kingdom of Bahrain
Tel (973) 1721-5106 Fax (973) 1721-5108
� Houston
� Kuala Lumpur
� Lausanne
� London
� Mumbai
� New York
� Paris
� San Francisco
�Washington, D.C.
North America
PFC Energy, Washington D.C.1300 Connecticut Avenue, N.W. Suite 800
Washington, D.C. 20036, USA
Tel (1 202) 872-1199
Fax (1 202) 872-1219
PFC Energy, Houston4545 Post Oak Place, Suite 312
Houston, Texas 77027-3110, USA Tel (1 713) 622-4447
Fax (1 713) 622-4448
Europe
PFC Energy, France19 rue du Général Foy
75008 Paris, France
Tel (33 1) 4770-2900
Fax (33 1) 4770-5905
PFC Energy International, Lausanne19, Boulevard de la Forêt1009 Pully, Switzerland
Tel (41 21) 721-1440
Fax: (41 21) 721-1444
www.pfcenergy.com | [email protected] regional offices are shown in blue.