deep ocean ventilation, carbon isotopes, marine ... · pdf file772 t. tschumi et al.: deep...
TRANSCRIPT

Clim. Past, 7, 771–800, 2011www.clim-past.net/7/771/2011/doi:10.5194/cp-7-771-2011© Author(s) 2011. CC Attribution 3.0 License.
Climateof the Past
Deep ocean ventilation, carbon isotopes, marine sedimentationand the deglacial CO2 rise
T. Tschumi1, F. Joos1,2, M. Gehlen3, and C. Heinze4,5,6
1Climate and Environmental Physics, Physics Institute, University of Bern, Sidlerstrasse 5, 3012 Bern, Switzerland2Oeschger Centre for Climate Change Research, University of Bern, 3012 Bern, Switzerland3Laboratoire du Climat et de l’Environnement (LSCE), L’Orme des Merisiers Bat. 712, 91191 Gif-sur-Yvette, France4Geophysical Institute, University of Bergen, Allegaten 70, 5007 Bergen, Norway5Bjerknes Centre for Climate Research, Bergen, Norway6Uni Bjerknes Centre, Uni Research, Bergen, Norway
Received: 25 August 2010 – Published in Clim. Past Discuss.: 27 September 2010Revised: 14 May 2011 – Accepted: 13 June 2011 – Published: 22 July 2011
Abstract. The link between the atmospheric CO2 level andthe ventilation state of the deep ocean is an important build-ing block of the key hypotheses put forth to explain glacial-interglacial CO2 fluctuations. In this study, we systematicallyexamine the sensitivity of atmospheric CO2 and its carbonisotope composition to changes in deep ocean ventilation, theocean carbon pumps, and sediment formation in a global 3-D ocean-sediment carbon cycle model. Our results providesupport for the hypothesis that a break up of Southern Oceanstratification and invigorated deep ocean ventilation were thedominant drivers for the early deglacial CO2 rise of∼35 ppmbetween the Last Glacial Maximum and 14.6 ka BP. Anotherrise of 10 ppm until the end of the Holocene is attributedto carbonate compensation responding to the early deglacialchange in ocean circulation. Our reasoning is based on amulti-proxy analysis which indicates that an acceleration ofdeep ocean ventilation during early deglaciation is not onlyconsistent with recorded atmospheric CO2 but also with thereconstructed opal sedimentation peak in the Southern Oceanat around 16 ka BP, the record of atmosphericδ13CCO2, andthe reconstructed changes in the Pacific CaCO3 saturationhorizon.
Correspondence to:T. Tschumi([email protected])
1 Introduction
Ancient air samples trapped in polar ice reveal that atmo-spheric CO2 has undergone large natural fluctuations withamplitudes of 90–100 ppm between glacial and interglacialperiods. Antarctic temperature closely parallels the recordedatmospheric CO2 concentration during at least the last eightglacial cycles (e.g.,Luthi et al., 2008).The global oceanshave been identifie
The global oceans have been identified as the key regula-tor of the atmospheric carbon content on glacial-interglacialtime-scales (e.g.,Sigman and Boyle, 2000; Archer et al.,2000a; Siegenthaler and Wenk, 1984; Sarmiento and Togg-weiler, 1984; Knox and McElroy, 1984). The ocean carboncycle is driven by a multitude of different processes such asocean circulation, the ocean carbon pumps and marine sedi-ment formation which equilibrate with atmospheric CO2 ontime-scales of months to millennia. The main focus of thisstudy is to examine the millennial-scale response in atmo-spheric CO2 to changes in the ventilation rate of the deepocean considering the carbon cycle feedbacks from impliedmodifications in marine biological production and sedimentformation.
We perform a series of illustrative sensitivity experimentswith the coupled Bern3D+C ocean-sediment carbon cyclemodel in which the rate of deep ocean ventilation is systemat-ically varied by changing wind forcing. The time-dependentresponse for multiple carbon cycle proxies, such asδ13C- and114C-signatures in the ocean and the atmosphere but also
Published by Copernicus Publications on behalf of the European Geosciences Union.

772 T. Tschumi et al.: Deep ocean ventilation, carbon isotopes, marine sedimentation and the deglacial CO2 rise
the depth of the CaCO3 saturation horizon and the sedimen-tation rate of CaCO3, organic carbon and opal are comparedto available paleo-data to assess the importance of changesin deep ocean ventilation for glacial-interglacial CO2 varia-tions.
Paleo-records of CO2 carbon isotope composition pro-vide valuable insight into past sources and sinks of theatmospheric carbon reservoir. This information can beused to constrain contributions from the individual processesmade responsible for the CO2 fluctuations (e.g.,Elsig et al.,2009; Joos et al., 2004; Hughen et al., 2004; Smith et al.,1999; Leuenberger et al., 1992). Unfortunately, duringglacial-interglacial transitions, there were generally severalsimultaneous processes generating similar imprints on CO2,δ13CCO2 and114CCO2. So far, the isotope records of atmo-spheric CO2 alone have not allowed for a unique quantitativeprocess identification (Kohler et al., 2006a).
The timing and coevolution of the CO2 carbon isotoperecords over the last deglacation nevertheless indicate thatthe initial CO2 increase at the beginning of deglaciations wascaused by the injection of some old carbon stock with lowδ13C signature into the atmosphere, as both records of at-mosphericδ13CCO2 and114CCO2 exhibit a relatively rapiddecline during the early deglaciation. Such a carbon releasecould in principle come from terrestrial or oceanic sources.Zeng(2003) proposes that there is a 547 GtC carbon releasefrom glacial to interglacial originating from organic carbonunder the great ice sheets of the Northern Hemisphere. How-ever, the observed atmospheric CO2 variations are not inphase with reconstructed sea level fluctuations. Recordedatmospheric CO2 concentrations show instead an extraordi-nary correlation with Southern Ocean (SO) climate changes.It thus appears more plausible that the dominant internalforcing feedback driving the deglacial CO2 rise is located inthe Southern Ocean (e.g.,Fischer et al., 2010).
There is evidence that low glacial CO2 concentrations canbe at least partly attributed to an increased isolation of deepwater masses from the atmosphere (e.g.,Skinner et al., 2010;Boyle, 1988). Many authors postulate that during glacialtimes, there existed a relatively large and poorly ventilatedabyssal water mass which led to a relocation of carbon fromthe atmosphere to the deep ocean. As most deep ocean water-masses are ventilated through the SO surface (e.g.,Primeau,2005), physical processes in this region are put forth as theresponsible drivers of the postulated changes in deep oceanoverturning (e.g.,Fischer et al., 2010; Sigman and Boyle,2000). It has been proposed that variations in deep oceanventilation have resulted from (i) changes in SO wind forcing(Toggweiler et al., 2006), (ii) changes in SO buoyancy forc-ing (Watson and Naveira-Garabato, 2006) or (iii) changesin SO water column stratification (Schmittner and Galbraith,2008; Francois et al., 1997). However, there is no broadly ac-cepted consensus so far on the individual role of the differentphysical mechanisms nor on the magnitude of the associatedCO2 variations during glacial-interglacial transitions.
Reconstructions of the glacialδ13C distribution from ben-thic foraminifera in the Pacific Ocean show that – relativeto the Holocene – deep water below 2000–2500 m was moredepleted inδ13C compared to the upper water mass (Mat-sumoto et al., 2002; Keigwin, 1998). In the Indian, Atlanticand Southern Oceans, reconstructed glacial-age verticalδ13Cgradients point at the existence of a sharp chemocline at sim-ilar depths separating the well-ventilated water above frompoorly ventilated water below (e.g.,Hodell et al., 2003; Mc-Corkle et al., 1998; Curry et al., 1988; Duplessy et al., 1988).Theseδ13C-data support the “nutrient deepening” hypothe-sis (Boyle, 1988) calling for a transfer of nutrients and DICfrom upper- and mid-depth waters to the deep ocean drivenby a more efficient marine biological pump during glacialtimes. Several potential triggers for an increased biologi-cal pump efficiency during glacials have been suggested inthe literature. For instance, reduced deep-water ventilationrates (e.g.,Hodell et al., 2003), slowed organic matter degra-dation under colder water temperatures (Matsumoto et al.,2007; Kwon et al., 2009) or significantly increased aeolianiron supply to the ocean surface (Martin, 1990).
Jaccard et al.(2009) and Bradtmiller et al.(2010) haverecently presented evidence for increased sequestration ofremineralized carbon into the deep Pacific during the LGM.Their reasoning is based on the argument that a more efficientbiological pump during glacial periods does not necessarilyimply that total (= preformed + regenerated) nutrient concen-trations in the deep ocean were significantly higher than dur-ing interglacials. Rather, the increase in biological pump effi-ciency would be mirrored in lower oxygen concentrations inthe deep ocean together with an increase in regenerated nu-trients which might be at least partially offset by a decreasein the preformed nutrient component (e.g.,Ito and Follows,2005).
Further evidence for a slowed deep ocean ventilationduring glacial periods comes from recorded variations ofopal burial in SO sediments (Anderson et al., 2009) andthe occurrence ofδ13C carbon isotope minima in plankticforaminifera at the beginning of glacial terminations (Speroand Lea, 2002). These signals have been interpreted to re-flect an invigoration in SO ventilation during the last glacial-interglacial transition. As a consequence, the breakdown ofsurface water stratification and renewed Circumpolar DeepWater (CDW) upwelling in the SO would bring the postu-lated abyssal watermass – which was isolated from the atmo-sphere during the glacial period – to the ocean surface.
The large recorded drop in atmospheric114C of about300 ‰ over the course of the last deglaciation may furthersupport this interpretation as the drop cannot be attributedsolely to a decrease in stratospheric14C-production (Hughenet al., 2004; Muscheler et al., 2004). Radiocarbon measure-ments on glacial-age sediments from the North Pacific (Gal-braith et al., 2007; Marchitto et al., 2007) and from the deepAtlantic (Keigwin and Schlegel, 2002; Boyle, 1988) indi-cate that abyssal waters were indeed less ventilated during
Clim. Past, 7, 771–800, 2011 www.clim-past.net/7/771/2011/

T. Tschumi et al.: Deep ocean ventilation, carbon isotopes, marine sedimentation and the deglacial CO2 rise 773
glacial times. However, surface-to-deep14C-age differencesreconstructed from a sediment core in the western equa-torial Pacific show that late-glacial ventilation at a depthof 2.8 km was not significantly lower than today (Broeckeret al., 2007). Summarizing the available evidence from car-bon isotopes,Broecker and Barker(2007) come to the con-clusion that the volume of an isolated abyssal reservoir dur-ing glacials is limited to no more than half of the ocean.
The “shelf hypothesis” (Broecker, 1982) is an alternativeoceanic mechanism that has been put forth to explain therecorded glacial-interglacial CO2 fluctuations. This mech-anism relies on changes in the biological pump turnoverdriven by shifts in organic matter accumulation on shallowshelves as sea level rises and falls. AtmosphericpCO2 wouldbe reduced during glacial times through increased biologicalproductivity promoted by an enhanced whole-ocean nutrientinventory. Paleo-data have revealed, however, that severalprerequisites are not met which are required for the shelf hy-pothesis to explain the full glacial CO2 drawdown: For in-stance, there is no sufficiently large amount of organic sedi-ments on shelf areas to provide additional nutrients duringglacials (Peacock et al., 2006). Recent studies have sug-gested that an increase in the glacial nutrient inventory mightbe linked to changes in ventilation at intermediate depthsrather than to changes in sea-level. A decreased volumet-ric extent of oxygen minimum zones would have reducedboth the marine sinks for NO−3 (Deutsch et al., 2004) andfor PO3−
4 (Wallmann, 2010).Besides reorganizations of the ocean-internal carbon cy-
cle and the terrestrial biosphere, transient imbalances be-tween marine sediment formation and continental weath-ering fluxes may also have contributed significantly to therecorded millennial-scale variations in atmospheric CO2,δ13CCO2 and 114CCO2 (e.g., Archer et al., 2000a). Mostprominently, the mechanism of carbonate compensation mayhave accounted for up to a third of the glacial-interglacialCO2 change without conflicting with reconstructed seafloorCaCO3 preservation patterns (Marchitto et al., 2005). Imbal-ances in the marine organic matter budget have received lessattention in previous studies. Nevertheless, there is a priorino reason why excess burial or excess weathering of organicmatter should not also have affected atmospheric CO2 levelsin the past.
Numerical models allow a process-based interpretation ofthe recorded CO2 variations and to quantitatively test dif-ferent scenarios of glacial-interglacial CO2 variations. Adilemma is that the application of comprehensive climate-carbon models for multi-millennial simulations and for ex-ploring the sensitivity of results to uncertain parameters is re-stricted by their large CPU-demand. On the other hand, boxmodels are inherently limited as they do not include oceandynamics and only poorly represent the 3-D geometry of theocean and ocean-sediment interactions.
The goal of this study is to explore the carbon cycle im-plications of altered deep ocean ventilation and biologicalcarbon pumps together with the millennial-scale effects ofimplied changes in marine sediment formation. For this pur-pose, we use the global coarse-resolution 3-D Bern3D+Cocean model (Muller et al., 2006; Tschumi et al., 2008),which is coupled to a spatially-resolved dynamic model formarine sediment formation (Tschumi, 2009). This modellingframework allows for the simulation of multiple tracers overlong time periods of several 10 000 years which are requiredfor sediment formation processes to relax to equilibrium.
The model simulates the cycling of total carbon(12C +13C +14C) and the carbon isotopes13C and14C be-tween the atmosphere, the terrestrial biosphere, the oceanreservoir, and the marine sediments. The ocean circula-tion field, the ocean carbon pumps and the formation of or-ganic, opal, and CaCO3 sediments at the seafloor are cal-culated from prognostic dynamical equations discretized on3-D grids. The terrestrial reservoir and the atmosphere arerepresented rather simplistically as single well-mixed boxes.The carbon stock on land is fixed (2220 GtC), but not its iso-topic composition.
As a starting point of this study, we have calculated theresponse of the coupled model to a change in the export ra-tio of organic matter to calcite (Sigman et al., 1998). Thisexperiment served as a test for the model representation ofcarbonate compensation and allow us to compare our mod-elling framework to others. The second model experimentwas an increase of the whole-ocean nutrient inventory by30 % (Sigman et al., 1998; Broecker and Peng, 1987) servingas a test for the “shelf hypothesis”. Note that a 30 %-increasein whole-ocean nutrients during glacials is likely to be anupper limit of a realistic change (Deutsch et al., 2004; Wall-mann, 2010). In contrast to previous similar experiments,in our model stimulated export production of organic matterwill eventually relaxed back to initial rates as excess organicmatter sedimentation removes the injected nutrients from theocean in the long term. Therefore, the modeled shift in thePacific CaCO3 saturation horizon in our experiment turnedout to be small as opposed to previous studies (Heinze et al.,1991; Sigman et al., 1998). Finally, but as the main interestof this study, we have probed the response to variations inocean deepwater ages driven by changes in SO wind forcingand the implied changes in SO deep convection for a rangeof different ocean ventilation time-scales. All of these sensi-tivity experiments started from the same model steady-statethat is compatible with preindustrial boundary conditions forocean physics and the biogeochemical cycles as described inSect.1.2.
The novel aspect of our analysis is the simulation of thetime-dependent response to prototype scenarios considering13C- and14C-cycling explicitely in a fully-coupled dynami-cal ocean-sediment model with sedimentation of all particu-late species, i.e. the marine organic matter, CaCO3 and opalcycles are all represented as “open cycles” in this study. The
www.clim-past.net/7/771/2011/ Clim. Past, 7, 771–800, 2011

774 T. Tschumi et al.: Deep ocean ventilation, carbon isotopes, marine sedimentation and the deglacial CO2 rise
broad range of processes and variables simulated increasesthe complexity of the ocean carbon cycle in the model, butit also allows for a more robust simultaneous comparisonof the model results with multiple proxies. The systematicvariations in deep ocean water ages through changes in thewind forcing and deep convection in the Southern Ocean rep-resents a new approach to explore the sensitivity of atmo-spheric CO2 to deep ocean ventilation and marine sedimentformation in 3-D models.
1.1 Model description
The version of the Bern3D+C carbon cycle model used herecomprises an atmospheric, a terrestrial, an oceanic and a sed-imentary reservoir which are coupled through the exchangeof carbon and its isotopes13C and14C. The model’s oceanphysics is based on the work ofEdwards et al.(1998) as up-dated byEdwards and Marsh(2005) andMuller et al.(2006).The marine biogeochemical cycles are described byParekhet al. (2008) andTschumi et al.(2008) and the coupling tothe sedimentary component inTschumi(2009). Unless ex-plicitly stated otherwise, the model is run under standard pa-rameters as mentioned in these references.
Marine biogeochemical cycles and air-sea gas-exchangeare implemented following OCMIP-2 (Orr et al., 1999; Naj-jar et al., 1999) with the addition of prognostic formulationsfor marine biological productivity as well as representationsfor the cycling of iron (Parekh et al., 2008), silica (Tschumiet al., 2008), 13C and14C.
Export production is a function of temperature, light,phosphate and iron followingDoney et al.(1996). Thecompetition between opal and calcite producers is modeledfollowing formulations of the HAMOCC5 model ofMaier-Reimer et al.(2005). The half-saturation constant for silica-uptake is a function of local silica concentration and the ratioof silica to phosphorous uptake by opal producers varies withsilica, light, iron and phosphate followingAumont and Bopp(2006).
The atmosphere is considered as a single well-mixed box.To calculate air-sea gas-exchange, a constant value for thesquare of the wind-speedu2 is employed which is set equal tothe spatio-temporal mean of the climatology foru2 providedby OCMIP-2 (Najjar et al., 1999).
The land biosphere model taken fromSiegenthaler andOeschger(1987) is composed of 4 well-mixed compart-ments with fixed carbon exchange fluxes and stocks: groundvegetation and leaves (100 GtC), wood (500 GtC), detritus(120 GtC) and soils (1500 GtC).
The sedimentary component is based on the model de-scribed byGehlen et al.(2006) and Heinze et al.(1999)which represents sediment diagenesis in the top 10 cm be-neath seafloor. Sediment formation, i.e. the accumulationof opal, CaCO3, organic matter and clay sediments is cal-culated on the basis of a set of dynamical equations forthe sedimentary diagenetic processes. The redissolution and
remineralization reactions all follow first order kinetics. Twotypes of remineralization reactions are considered, oxic res-piration and denitrification. For more details on the sedimentmodel component and model equations, please refer to theappendix.
In the model, cycling of13C is subject to the followingfractionation effects: in the ocean, equilibrium fractiona-tion is considered in the chemical carbonate equilibrium sys-tem (Mook, 1988). For air-sea gas-exchange, a kinetic frac-tionation is computed (Siegenthaler and Muennich, 1981).Further fractionations occur during marine photosynthesis(Freeman and Hayes, 1992) and the formation of calciumcarbonate (Mook, 1988). In the land biosphere, isotopic frac-tionation is accounted for during photosynthesis.
Cycling of 14C is simulated explicitly, i.e. the actual con-centrations of14C are transported and not the14C/12C-ratio(Orr et al., 1999).
1.2 Model spin-up and preindustrial steady state
The coupled carbon cycle model was spun up by bringing theterrestrial biosphere, the ocean and the sediments into steadystate under fixed atmospheric values forpCO2 (278.00 ppm),δ13C (−6.305 ‰) and114C (0.00 ‰). A fixed productionrate for14C was then prescribed andpCO2, δ13C and114Cwere let evolve dynamically in the atmosphere to performthe subsequent sensitivity simulations. The remaining driftsin the control simulation was less than 3× 10⁻³ ppm kyr−1
in pCO2, less than 2× 10⁻⁵ ‰ kyr−1 in δ13C and less than3× 10−3 ‰ kyr−1 in 114C. As the typical model responseto the perturbations applied was much larger than that, thespun up model state is sufficiently close to equilibrium forour purposes.
The combined ocean/sediment compartment was sepa-rately intialized as follows before it was coupled interac-tively to the atmosphere. To spin up ocean physics in afirst step, sea surface temperatures (SST) and salinities (SSS)were restored towards modern monthly observations (Levi-tus et al., 1994; Levitus and Boyer, 1994) and wind stresswas prescribed according to the monthly climatology fromNCEP/NCAR (Kalnay and et al., 1996). After 10 000 modelyears, mixed boundary conditions were imposed for SST andSSS followingTschumi et al.(2008). Inspection of the mod-eled ocean circulation field and the temperature and salinitydistributions at steady state revealed that the primary flowpaths of the global ocean circulation and the important wa-ter masses were represented adequately (seeMuller et al.,2006; Tschumi et al., 2008). The annual mean maximum At-lantic meridional overturning circulation (AMOC) amountedto 14.7 Sv, comparing favorably to the estimate of 17± 5 Sv(Talley et al., 2003).
In a second step, the steady state ocean circulation wasthen used to spin up marine biogeochemical cycles during10 000 model years. The resulting steady state fields of themodeled biogeochemical tracers successfully reproduced the
Clim. Past, 7, 771–800, 2011 www.clim-past.net/7/771/2011/

T. Tschumi et al.: Deep ocean ventilation, carbon isotopes, marine sedimentation and the deglacial CO2 rise 775
large-scale patterns of the observed distributions in the mod-ern ocean (seeTschumi et al., 2008; Muller et al., 2006,and Fig. 3). Simulated export fluxes for particulate organicmatter (12.76 GtC yr−1), CaCO3 (1.13 GtC yr−1) and opal(95 Tmol Si yr−1) all lay within available estimates (Jin et al.,2006; Sarmiento and Gruber, 2006).
In a next phase, the sediments were “filled up” during50 000 years by imposing spatially uniform, but temporallyvariable weathering fluxes to the sea surface for phosphate,silicic acid, alkalinity, carbon,13C and14C. The weather-ing rates were set equal to the net flux of the respectivetracers across the ocean-sediment interface as diagnosed ateach time-step such that annual mean ocean inventories arekept practically unchanged. As the sediment inventories con-verged to their steady state values, weathering rates stabilizedto balance with the loss of solid matter that results from sed-iment burial. These values were diagnosed and prescribedsubsequently as temporally constant weathering input. Theocean-sediment component was run into a new equilibriumduring 30 000 years in this new setup.
Simulated sediment accumulation amounted to0.14 GtC yr−1 for organic matter and to 0.17 GtC yr−1
for CaCO3. These rates are roughly compatible withdata-based estimates of 0.12–0.26 GtC yr−1 for organicmatter burial and of 0.1–0.14 GtC yr−1 for CaCO3 burial(Sarmiento and Gruber, 2006; Feely et al., 2004). In a seriesof carbon pulse release experiments, CO2 neutralizationtime scales were found to be between 5–8 kyr for seafloorCaCO3 neutralization and between 8–13 kyr for terrestrialCaCO3 neutralization (Tschumi, 2009). These values arecompatible with previous studies (e.g.,Archer et al., 1997).The model equations, the model parameters and the detailsof the ocean-sediment coupling can be found inTschumi(2009).
Simulated sediment composition in the spun up coupledsteady state is shown in Fig. 1a–c. Table 1 displays bulknumbers of the simulated particulate fluxes exported from thesea surface, deposited at the sea floor and accumulated in thesediments along with available estimates for the preindustrialtime
2 Model experiments and results
2.1 Rain ratio reduction
The marine biological pumps (Volk and Hoffert, 1985),i.e. the organic matter and the carbonate pumps, are cen-tral drivers of the ocean carbon cycle. For two separatereasons, they are of great importance for the regulation ofthe atmospheric CO2 level by the oceans. First, they es-tablish systematic gradients in dissolved inorganic carbon(DIC) and alkalinity between the surface and the deep ocean.The overall impact of both pumps together is lowerpCO2levels in the surface ocean compared to an abiotic ocean.
Second, accumulation of organic matter and CaCO3 sedi-ments is driven by the deposition of biogenic material on theseafloor. Any change in the marine biological pumps thusalso affects organic matter and CaCO3 sedimentation withpotentially significant impacts on atmospheric CO2 throughperturbations of the marine organic matter and CaCO3 bal-ances.
The ocean carbonate pump is driven by the productionof biogenic CaCO3 shells in the sea surface. The sinkingCaCO3 shells entrain alkalinity to the deep ocean and henceincrease sea surfacepCO2 by shifting the speciation of thesurface ocean DIC towards dissolved CO2. A reduced ex-port ratio between CaCO3 and organic matter export (rainratio) would reduce sea surfacepCO2, not only due to anocean-internal redistribution of alkalinity but also as a resultof a lower carbonate concentration in the deep ocean trigger-ing redissolution of marine CaCO3 sediments. The resultingimbalance between the weathering flux of dissolved CaCO3into the ocean and marine CaCO3 sedimentation would drivea rise in the ocean’s total alkalinity and additionally con-tribute to lower sea surfacepCO2. Carbonate compensationis the feedback mechanism responsible for re-establishingthe ocean CaCO3 balance on a time-scale of order 10 kyrthrough shifts in the depth of the CaCO3 saturation horizon(Archer et al., 2000a).
By reason of their central role in the regulation of theocean’s alkalinity budget, rain ratio mechanisms were amongthe first candidates made responsible for driving glacial-interglacial CO2 fluctuations in the atmosphere (e.g.,Archeret al., 2000a; Berger and Keir, 1984). A reduced rain ratioduring glacial times may have resulted, for instance, from in-creased diatom productivity in lower latitudes at the expenseof coccolithophorids (silica leakage hypothesis,Matsumotoet al., 2002) or from relaxed nutrient-limitation in the sea sur-face (Margalef, 1978). The inferred CaCO3 preservation his-tory recorded in marine sediments, however, constrains thecontribution of whole-ocean alkalinity changes to roughly athird of glacial-interglacial CO2 variations (Marchitto et al.,2005).
In our first model experiment, we attempt to disentangleand quantify the complex response in ocean biogeochemistryto a reduced rain ratio. We perform parallel simulations in acoupled ocean-sediment setup and in an ocean-only setup toseparate ocean-internal mechanisms from interactions withthe sediments. FollowingSigman et al.(1998), we abruptlyreduce CaCO3 export by 20 % uniformly in the global seasurface. This corresponds in our model to a decline in theglobal rain ratio from 0.088 to 0.071.
2.1.1 Results
Figure 3 shows the time-dependent carbon cycle responsesas simulated with the ocean-only model (black lines) and theocean-sediment model (red lines). In response to decreasedCaCO3, export atmospheric CO2 drops from 278 ppm to
www.clim-past.net/7/771/2011/ Clim. Past, 7, 771–800, 2011

776 T. Tschumi et al.: Deep ocean ventilation, carbon isotopes, marine sedimentation and the deglacial CO2 rise
Fig. 1. Modelled (left row) and observed (right row) composition of surface sediments on the ocean bottom:(a) particulate organic matter,(b) CaCO3 and(c) opal. Modelled sediment composition is averaged over the top 1.1 cm of the sediment column. Sediment data is fromthe Pangaea database (publishing Network for Geoscientific & Environmental Data,http://orfois.pangaea.de). Note that the color scale is notlinear.
268 ppm within centuries (e-folding time scale: 390 yr) inthe ocean-only model (Fig. 3a, black line). Mean surface al-kalinity rises as less CaCO3 shells sink from the surface tothe ocean interior (Fig. 3b, black line). Reduced alkalinity inthe ocean interior in turn lowers [CO2−
3 ] pushing the CaCO3saturation horizon upwards by approximately 300 m (Fig. 3d,black line).
In the ocean-sediment model, the CO2 drawdown isstrongly amplified to 237 ppm due to the increase in whole-ocean alkalinity (Fig. 3a and b, red line). Carbonate compen-sation responds rather slowly with an e-folding time scaleof 11.7 kyr. Reduced CaCO3 export and deposition on theseafloor drive a deepening in the CaCO3 saturation horizonas to provide a larger area on the seafloor where the rain of
Clim. Past, 7, 771–800, 2011 www.clim-past.net/7/771/2011/

T. Tschumi et al.: Deep ocean ventilation, carbon isotopes, marine sedimentation and the deglacial CO2 rise 777
Fig. 2. Modelled distribution of the isotope signatures in ocean dissolved inorganic carbon for preindustrial boundary conditions.114CDICis shown in the left row andδ13CDIC in the right row. Top panels(a) and(d) show bottom water signatures, the middle row panels(b) and(e)display Atlantic and bottom panels(c) and(f) Pacific zonal mean sections in preindustrial steady state.
CaCO3 is efficiently preserved (Fig. 3d, red line). As a con-sequence, the simulated CaCO3 sedimentation rate starts torecover after the initial abrupt decline in order to restore theocean’s CaCO3 balance in the model (Fig. 3c). The final to-tal shift in steady state saturation depth in the ocean-sedimentmodel amounts to a deepening of 700 m in the Atlantic andof 800 m in the Pacific basin (Fig. 3d, red line).
The simulated responses in atmosphericδ13CCO2 and114CCO2 to changes in the rain ratio are small. Theocean-internal distribution ofδ13CDIC and114CDIC is onlymarginally affected by the marine CaCO3 cycle. In theocean-only experiment, we therefore simulate negligiblechanges in atmosphericδ13CCO2 and 114CCO2 as CaCO3export is reduced. In fact, there is virtually no response in
www.clim-past.net/7/771/2011/ Clim. Past, 7, 771–800, 2011

778 T. Tschumi et al.: Deep ocean ventilation, carbon isotopes, marine sedimentation and the deglacial CO2 rise
Fig. 3. Rain ratio reduction: Simulated response to a 20%-reduction in CaCO3 export. (a) Atmospheric CO2, (b) mean surface alkalinity,(c) CaCO3 sedimentation,(d) shift in Pacific CaCO3 saturation horizon,(e)atmosphericδ13CCO2 and(f) atmospheric114CCO2.
atmosphericδ13CCO2 (Fig. 3e, black line) and114CCO2 israised by a modest 3 ‰ (Fig. 3f, black line).
In the coupled ocean-sediment experiment, the system re-sponse in carbon isotope signatures of atmospheric CO2 isadditionally sensitive to the decline in marine CaCO3 sedi-mentation. However, the responses ofδ13CCO2 and114CCO2
to carbonate compensation are rather slow and remain small(Fig. 3e and f, red lines).
2.1.2 Comparison to other studies
Heinze et al.(1991) have simulated a relatively modest sen-sitivity of atmospheric CO2 to changes in the rain ratio. Theyhave found a CO2 drawdown of 28.5 ppm when the rain ra-tio is reduced by 50 % in the 3-D Hamburg Carbon CycleModel which was coupled to a simplistic model for sedimentdiagenesis with fixed sediment resuspension rates.Archerand Maier-Reimer(1994) have shown that including organic-carbon-driven dissolution of CaCO3 sediments substantially
increases thepCO2 response to rain ratio changes in theirmodel. They reach glacial CO2 levels by reducing the rainratio by 40 %, which amounts to a CO2 sensitivity compara-ble to this study.
Sigman and Boyle(2000) have reduced the ratio of organicmatter to CaCO3 export in the low latitudes by 50 % in theCYCLOPS box model. They obtain a drawdown of 22 ppmin the ocean-only model and of 63 ppm in the ocean-sedimentmodel. CaCO3 compensation amplifies the CO2 reduction bya factor of three in their study compared to a factor of fourin this study. The reason for the comparatively lower impactof CaCO3 compensation in the box model study is probablythe shorter relaxation time of CaCO3 burial. The originalrate is restored after about 15 kyr, whereas in the Bern3D+Cmodel it takes roughly 50 kyr. The longer relaxation timein our study results in a larger imbalance between CaCO3burial and weathering when integrated over time such thatthe increase in whole-ocean alkalinity is larger in response tocarbonate compensation.
Clim. Past, 7, 771–800, 2011 www.clim-past.net/7/771/2011/

T. Tschumi et al.: Deep ocean ventilation, carbon isotopes, marine sedimentation and the deglacial CO2 rise 779
Chikamoto et al.(2009) have lowered the rain ratio by25 % in the High-Latitude Exchange/Interior Diffusion Ad-vection (HILDA) model coupled to a similar dynamical sed-iment model as used in this study. They find a drawdownof 59 ppm in atmospheric CO2 together with a deepening ofthe calcite saturation horizon by 1870 m. The response timescale of atmospheric CO2 and the magnitude of the draw-down are comparable to the results of our study; however,we find a deepening of the order of only 800 m in the CaCO3saturation horizon.
In conclusion, it appears to be challenging to robustlyquantify the effect of rain ratio changes on atmospheric CO2by means of carbon cycle models. The simulated CO2 re-sponse depends on the specific biogeochemical model state,such as the initial rain ratio or the CaCO3 throughput in theoceans, as well as on the model parametrization of the ocean-sediment interactions. Our results are consistent with cur-rent understanding, suggesting that carbonate compensationwould amplify the CO2 response to changes in the ocean car-bonate pump by a factor of as much as 3–4.
2.2 Strengthening of the marine biological cycle
As an alternative to a reduced rain ratio, low atmosphericCO2 during glacial periods might have resulted from morevigorous biological carbon cycling in the ocean. A strength-ened marine biological cycle might be driven for instanceby increased nutrient availability (Broecker and Peng, 1982),iron fertilization (Martin and Fitzwater, 1988) or changes innitrogen cycling (Falkowski, 1997).
In the next experiment, we examine the response in atmo-spheric CO2, δ13CCO2 and114CCO2 to a stimulated oceanbiology by increasing the marine nutrient inventory in theBern3D+C model. The experiment is again performed withand without coupling to sediments to isolate the effect ofocean-sediment interactions.
Following the procedure ofArcher et al.(2000a); Sigmanet al.(1998) andBroecker and Peng(1987), we have abruptlyincreased PO4 concentrations uniformly by 30 % to stimu-late simultaneously both the organic matter and the carbon-ate pumps. With our model biology the global rain ratio re-mained virtually unchanged. Therefore, the sedimentary re-sponse on atmospheric CO2 is dominated in our model byexcess organic matter sedimentation rather than by carbon-ate compensation.
2.2.1 Atmospheric CO2
In the ocean-only model, the augmented PO4 inventorydrives a persistent increase in organic matter and CaCO3 ex-port production both by roughly 11 % (Fig. 4c and d, blacklines). The elevated rates of organic matter and CaCO3 ex-port have opposite effects on sea surfacepCO2. As thestrengthened organic matter pump dominates the net oceanresponse, atmospheric CO2 gets reduced to 255 ppm with an
e-folding time scale of 470 years in the ocean-only exper-iment (Fig. 4a, black line). As the concurrent changes indownward fluxes of POC and CaCO3 have roughly oppos-ing effects on [CO2−
3 ] at the depth of the saturation horizon,there is only a small shift in calcite saturation depth of lessthan 20 m in the ocean-only model (Fig. 4b, black line).
Biological export of carbon from the sea surface augmentsprimarily in the Atlantic and in the Indian oceans, and toa lesser degree in the Northern Pacific. There is almost nochange in export production in the equatorial and South Pa-cific as well as in the Southern Ocean (south of 51◦ S) be-cause biological productivity in these regions is limited byiron or light availability. Note that a glacial increase in ex-port production in the North Pacific is at odds with paleopro-ductivity reconstructions (seeJaccard et al., 2009; Galbraithet al., 2007; Crusius et al., 2004), suggesting that the historyof export production from the North Pacific surface was pre-dominantely controlled by processes other than changes inthe whole-ocean nutrient inventory such as changes in watercolumn stratification and associated upwelling of nutrientsfrom the deep (Galbraith et al., 2007).
In the coupled ocean-sediment setup, atmospheric CO2 isreduced to 232 ppm within 30 kyr (Fig. 4a, red line). There-after, CO2 slightly increases by 2 ppm until the full balancebetween weathering and burial of organic matter and CaCO3is re-established after 50 ky (Fig. 4e and f). The effect ofocean-sediment interactions thus enhances the CO2 draw-down in the coupled system by a factor of two.
The nutrient increase abruptly boosts the export of organicmatter and CaCO3 by 8.5 % in the ocean-sediment model(Fig. 4c and d, red lines). Subsequently, both export rates de-cline and reach almost original values after 50 kyr. As bothchanges in CaCO3 and organic matter burial are taken intoconsideration, elevated organic matter export is not sustainedin the long run here, in contrast to previous studies (Sigmanet al., 1998; Broecker and Peng, 1987) which have accountedsolely for changes in CaCO3 sedimentation.
Excess organic matter burial draws nutrients out of theocean to bring organic sedimentation back to balance theriverine input of nutrients. The initial increase in the nutrientinventory is thereby neutralized in the long run. The sim-ulated decline in CaCO3 export also follows directly fromthe gradual decrease in nutrient availability. In our modelbiology, CaCO3 export is computed from primary produc-tivity and is not affected by changes in the calcite satura-tion state. The effect of CaCO3 compensation on restoringCaCO3 burial is therefore only of secondary importance, incontrast to the rain ratio reduction experiment.
The modeled CaCO3 saturation horizon deepens by about150 m in the Atlantic and by 300 m in the Pacific during thefirst 15 000 years with a subsequent shoaling in both basinsthereafter (Fig. 4b, red line). The first part of the responseis dominated by excess POC burial, the second part by ex-cess CaCO3 burial. Since excess POC burial implies a lossof whole-ocean DIC, it tends to push the saturation horizon
www.clim-past.net/7/771/2011/ Clim. Past, 7, 771–800, 2011

780 T. Tschumi et al.: Deep ocean ventilation, carbon isotopes, marine sedimentation and the deglacial CO2 rise
Fig. 4. Strengthening of the marine biological cycle: Simulated response to an abrupt 30 %-increase in the ocean’s phosphate content.(a) Atmospheric CO2, (b) shift in Pacific CaCO3 saturation horizon,(c) POC export production,(d) CaCO3 export production,(e) POCsedimentation,(f) CaCO3 sedimentation,(g) atmosphericδ13CCO2 and(h) atmospheric114CCO2.
downwards. On the contrary, excess CaCO3 burial leads to ashoaling of the saturation horizon as alkalinity and DIC areremoved from the ocean in a 2:1-ratio. The final shift in thecalcite saturation horizon after 50 kyr is a deepening of lessthan 100 m.
2.2.2 Atmosphericδ13CCO2 and 114CCO2
The simulated changes in atmosphericδ13CCO2 and114CCO2 are predominantly controlled by the response in or-ganic matter cycling. In the ocean-only model, atmospheric
Clim. Past, 7, 771–800, 2011 www.clim-past.net/7/771/2011/

T. Tschumi et al.: Deep ocean ventilation, carbon isotopes, marine sedimentation and the deglacial CO2 rise 781
δ13CCO2 rises by 0.16 ‰ and114CCO2 by 7 in responseto the strengthened marine biological cycle (Fig. 4g and h,black lines). δ13CCO2 rises as surface oceanδ13CDIC isshifted towards more positive values due to enhanced pro-duction of organic matter. The increase in114CCO2 is thedirect consequence of reduced atmospheric CO2 under a con-stant14C-production rate.
In the ocean-sediment model,δ13CCO2 increases by∼0.4 ‰ and114CCO2 rises by roughly 70 ‰ in response toa strengthened marine biological cycle (red lines in Fig. 4gand h). The time-dependent response in the carbon isotopesignatures of atmospheric CO2 is more complex than in theocean-only system. In particular, relaxation times are muchlonger due to the slow ocean-sediment interactions.
Next to the (transient) changes in the individual pumps’strengths, elevated sedimentation rates of organic matter andCaCO3 additionally affect the response in isotopic carbonsignatures in the ocean-sediment setup. The sedimentary re-sponse in atmosphericδ13CCO2 is rather involved since ex-cess organic matter burial removes carbon with negativeδ13Cand excess CaCO3 burial draws carbon with positiveδ13Cout of the system. Excess organic matter sedimentation dom-inates the response in atmosphericδ13CCO2 during the initial25 kyr, whereas excess CaCO3 burial drives a slow reduc-tion in δ13CCO2 thereafter (red line in Fig. 4g). This time-dependent behavior results from the longer relaxation timeof the marine CaCO3 cycle to the intensified marine biologyas compared to the relaxation time of the organic matter cy-cle.
The sedimentary response pushes atmospheric114CCO2
signatures towards more positive values (red line in Fig. 4h).On the one hand, the ocean-sediment interactions draw CO2out of the atmosphere which elevates114CCO2 under con-stant14C-production. On the other hand, enhanced organicmatter and CaCO3 sedimentation further contribute to ris-ing atmospheric114CCO2 as excess burial removes rela-tively old carbon (with low114C) from the combined ocean-atmosphere system.
2.2.3 Comparison to other studies
Heinze et al.(1991) have increased the marine PO4 inventoryby 30 % in the 3-D Hamburg ocean-sediment model. Theyhave found that atmospheric CO2 decreased by 60 ppm andthe Pacific CaCO3 saturation horizon deepened by roughly900 m.Sigman et al.(1998) only let low-latitude productionrise upon a 30 %-increase in whole-ocean PO4 inventory inthe CYCLOPS box model. They find an increase of 32 %in low-latitude export production together with a CO2 reduc-tion of 32 ppm in the ocean-only setting. When CaCO3 sed-imentation is additionally taken into account, the simulatedCO2 decline is only of 19 ppm. As opposed to our results,the sedimentary response in their simulation is to counter-act the CO2 drawdown resulting from strengthened biologi-cal pumps.Sigman et al.(1998) find a mean global shoaling
in CaCO3 saturation depth of 500 m, whereas here we obtainonly a modest deepening.
The reason for this discrepancy is mainly the fact that POCburial is not taken into account explicitly bySigman et al.(1998). The nutrient-feedback is thus not considered. In oursimulations, the loss of nutrients through excess POC burialon the one hand draws carbon out of the ocean and on theother hand limits excess CaCO3 export in such a way thatCaCO3 compensation has only a minor effect opposing theCO2 reduction. The impact of CaCO3 compensation on at-mospheric CO2 is seen in a small increase occurring after30 kyr (Fig. 4a, red line).
The following conclusions emerge. Perturbations in globalburial fluxes due to ocean processes are removed on a multi-millennial time scale to re-establish the balance between re-moval of organic matter, CaCO3, and opal by burial and cor-responding weathering inputs from rivers and winds. As aconsequence of this sedimentary compensation, some proxysignals that arise from changes in the internal ocean carboncycle are partly or completely muted with time (see also nextSect. 3.3). Differences in proxies between distant time peri-ods, for instance between the LGM and the late Holocene,may therefore partly reflect changes in the balance of theweathering-sedimentation cycle.
Kohfeld et al.(2005) compared productivity records forthe late Holocene, the Last Glacial Maximum and marineisotope stage 5a to 5d. They concluded that export produc-tion was globally higher during the LGM than during eitherstage 5a-5d or the Late Holocene. They suggest a limited rolefor the marine biological cycle to explain glacial-interglacialCO2 variations. Our results indicate that such a conclusionshould be viewed with caution, because differences in prox-ies might also be related to imbalances in the weathering-sedimentation cycle. Potential secular trends arising fromthese imbalances should also be considered when analyzingwhole ocean changes inδ13C to infer variations in organicmatter pools (Shackleton, 1977; Bird et al., 1994) or in atmo-sphericδ13CCO2 (Leuenberger et al., 1992), as well as wheninterpreting the recorded evolution of nitrogen and silicateisotope signatures (Deutsch et al., 2004; De La Rocha, 2006).
2.3 Global ocean ventilation
The last set of simulations focusses on the response in atmo-spheric CO2, δ13CCO2 and114CCO2 to changes in the rateof deep ocean ventilation. In these idealized experiments wevary deep ocean ventilation in the model by uniformly scal-ing the prescribed amplitude of both zonal and meridionalwind stress in the Southern Ocean (south of 51◦ S). The time-dependent model response in atmospheric CO2, δ13CCO2 and114CCO2 is then calculated as the result of the interplay be-tween changes in ocean circulation, marine biogeochemicalcycling and sediment diagenesis subsequent to abrupt changein wind boundary conditions. Note that gas-exchange ve-locities are kept unaffected and feedbacks mediated by SST
www.clim-past.net/7/771/2011/ Clim. Past, 7, 771–800, 2011

782 T. Tschumi et al.: Deep ocean ventilation, carbon isotopes, marine sedimentation and the deglacial CO2 rise
Table 1. Bulk numbers characterising the preindustrial steady state of the coupled ocean-sediment Bern3D+C model compared to previousmodelling results and independent estimates.
Variable Units this study Heinze et al.(2003) Ind. estimates
atm. CO2 ppm 278.0 277.7 –POC export production GtC yr−1 12.76 8.66 6.5–13.1a
POC rain onto sediments GtC yr−1 0.49 0.12 1.7–3.3a
POC accumulation GtC yr−1 0.14 0.048 0.12–0.26a
CaCO3 export production GtC yr−1 1.13 1.64 0.8–1.2b
CaCO3 rain onto sediments GtC yr−1 0.40 0.42 0.5c
CaCO3 accumulation GtC yr−1 0.17 0.18 0.1–0.14d
Opal export production Tmol Si yr−1 95 185 102–178b
Opal rain onto sediments Tmol Si yr−1 64.9 81.3 13–47e
Opal accumulation Tmol Si yr−1 1.12 5.5 5.3–8.9e
POC sediment pool GtC 428 241.9 –CaCO3 sediment pool GtC 881 1010 –Opal sediment pool Tmol Si 9779 19 986 –
a Sarmiento and Gruber(2006), b Jin et al.(2006), c Millimann and Droxler(1996), d Feely et al.(2004), e Treguer et al.(1995)
changes and the response in terrestrial biosphere is not takeninto account. The simulation set consists of separate runs inwhich SO wind stress is gradually varied between 20 % and180 % relative to the original strength by steps of 20 %.
It has been found in several global ocean models (includ-ing ours) that deep mixing in the SO is driven to a large de-gree by momentum transfer from SH westerly winds to theocean surface in the latitudinal band spanned by the DrakePassage (e.g.,Toggweiler et al., 2006; Menviel et al., 2008;Tschumi et al., 2008). Furthermore, the modeled characteris-tics of deep ocean water masses are affected on a global scaleby changes in SO deep mixing. Accordingly, the SO repre-sents a major route of deep ocean ventilation in these oceanmodels.
Yet, it remains hard to draw conclusions on the physicalmechanisms controlling deep mixing in the real SO. In re-cent studies, factors other than wind stress have been pro-posed to play a major role for the control of SO deep mixing.These are for instance sea-ice dynamics and buoancy forc-ing (e.g.,Fischer et al., 2010; Watson and Naveira-Garabato,2006), small-scale eddy flows which are not represented ex-plicitely in most global ocean models (e.g.,Spence et al.,2009; Boning et al., 2008) or other processes affecting thevertical stratification in the SO (Sigman et al., 2004; Paillardand Parennin, 2004). The relative importance of the differentmechanisms capable of driving glacial-interglacial variationsin SO deep mixing remains under debate. For this reason,the amplitude of SO winds in our simulations is regarded asa mere tuning knob for the circulation state in the model.
2.3.1 Ocean circulation response
The two most prominent features in the circulation responseto SO wind variations are: (1) changes in the frequency anddepth of convective events in the SO and (2) changes inthe intensity and depth of the Atlantic meridional overturn-ing circulation (AMOC). Stronger winds intensify deep con-vection and Ekman upwelling in the SO and strengthen theAMOC (Fig. 5b andTschumi et al., 2008). Weaker windsinduce the opposite response characterized by a more stablystratified Southern Ocean and less intense AMOC.
In case of strongly reduced wind stress (20 % or 40 % ofthe original amplitude), the AMOC breaks down completelyin the model, leaving the SO as the sole region of deep wa-ter formation. These latter circulation states are named “off-states” here, whereas the model states with active AMOC aredenoted as “on-states”.
As long as the AMOC remains active, i.e. in the on-states,deep ocean ventilation scales quite homogeneously acrossall ocean basins with the changes in SO wind amplitude(Fig. 5a). Deep ventilation ages below 2000 m vary almostlinearly with the strength of SO wind stress. Globally av-eraged deep ventilation ages increase by 32 years per 10 %-reduction in SO wind strength. The Atlantic deep water ageis slightly more sensitive (43 years/10 %-reduction) than inthe other basins, owing to the changes in AMOC strength.
In case of the off-states the link between deep ocean venti-lation ages and SO wind stress deviates from the quasi-linearrelationship (Fig. 5a). In particular in the deep Atlantic,the AMOC shutdown results in a large anomalous drop ofroughly 600 years in ventilation age. This model responseindicates the change in end-members of Atlantic deep watersubsequent to the collapse of AMOC.
Clim. Past, 7, 771–800, 2011 www.clim-past.net/7/771/2011/

T. Tschumi et al.: Deep ocean ventilation, carbon isotopes, marine sedimentation and the deglacial CO2 rise 783
Fig. 5. (a) Ventilation age in different ocean basins as a func-tion of the SO wind stress amplitude. Ventilation age is calculatedfrom simulated14R-signatures in the ocean below 2000 m depth.14R is treated here as an ideal age tracer in the sense that it istransported only by ocean circulation and the atmospheric signa-ture is held constant (14Ratm= 1.0). Ventilation age is calculated
asτbasin= 1λ ln
(14Ratm/14Rbasin
)whereλ = 1/8267 yr−1 is the de-
cay constant for14C and14Rbasin is the average14R-signature inthe respective basin.(b) Southern Ocean convection index and At-lantic Meridional Overturning Circulation (AMOC) versus SO windstress. The SO convection index is proportional to the number ofmodel grid cells in the SO participating in convective mixing.
To sum up, changing wind stress in our model proves it-self as an effective method to gradually vary globally aver-aged deep water age in a range between 1580 years (180 %SO wind stress) and 2100 years (20 % SO wind stress). Ma-jor structural shifts in the modeled global circulation patternoccur only if SO wind stress is strongly reduced to 20 % or40 % where AMOC breaks completely.
2.3.2 Response to sub-millennial processes
Figure 6 shows the time-dependent response for a set of in-formative carbon cycle parameters. The reaction of atmo-spheric CO2 and its isotopic composition to changes in deepocean ventilation is characterized by a major fast response
unfolding during approximately the first 2 kyr and a minorslow response over several 10 kyr (Fig. 6a, g and h). The fastresponse arises from the reorganization of the ocean carbonpumps, the long-term response is driven by the slow adap-tation of sediment formation to the altered biogeochemicalstate of the ocean. Atmospheric CO2, δ13CCO2 and114CCO2
have reached a quasi-equilibrium after 2 kyr in the ocean-only model, whereas in the ocean-sediment model sedimen-tation processes affect atmospheric carbon on a time scale ofseveral 10 kyr.
Figure 7 shows the correlation between simulated deepocean ventilation age and the changes in atmospheric CO2,δ13CCO2 and114CCO2 at the time slice 2 kyr after perturbingSO wind stress forcing. The results unambiguously displaythat better ventilated deep ocean watermasses drive an in-crease in atmospheric CO2, whereasδ13CCO2 and114CCO2
decline. Model results of the ocean-sediment model at 2 kyrare not substantially different from those of the ocean-onlymodel since the effect of changes in sedimentation has notyet fully materialized at this early stage of the response.
Atmospheric CO2 and its isotopic signatures follow analmost linear relationship with deep ocean ventilation agefor both without and with sediments as long as there isno AMOC collapse. Linearized sensitivities forδ13CCO2
(0.08 ‰/100 years) and for114CCO2 (10 ‰/100 years)are almost identical in both model settings (Fig. 7band c). Changes in atmospheric CO2 are slightly larger(−8 ppm/100 years) at the 2 kyr time slice (Fig. 7a).
AMOC shutdowns significantly affect atmospheric CO2and114CCO2. The simulated changes for off-states clearlydeviate from the linear relationship as displayed in Fig. 7aand c. The AMOC shutdown induces an anomalous draw-down in atmospheric CO2 of ∼10 ppm without sedimentsand of ∼20 ppm with sediments. The anomalous rise in114CCO2 is of ∼10 ‰ in the ocean-only model and of∼15 ‰ in the ocean-sediment model. Atmosphericδ13CCO2
on the other hand is rather unsensitive to the shutdown ofAMOC. There is no substantial deviation from linearity inthe relation betweenδ13CCO2 with the rate of deep oceanventilation when AMOC shuts down (Fig. 7b).
The biological pump strongly dominates the net CO2 re-sponse subsequent to wind stress changes in our model (seealsoTschumi et al., 2008). The effect of the solubility pumpis minor as simulated changes in (potential) deep ocean tem-perature (below 2000 m) are∼0.5◦C at most (Table 2). Thistranslates into a maximum effect on atmospheric CO2 ofroughly 5 ppm given the sensitivity of CO2-solubility to tem-perature in seawater (e.g.,Sigman and Boyle, 2000). On theother hand, the imposed changes in ocean ventilation havea strong impact on the marine biological carbon pumps. En-hanced (reduced) ocean ventilation implies increased (dimin-ished) upwelling of nutrients, thus promoting (weakening)biological export from the surface.
Table 2 indicates that organic matter export diagnosed at2 kyr after the wind stress switch scales roughly linearly with
www.clim-past.net/7/771/2011/ Clim. Past, 7, 771–800, 2011

784 T. Tschumi et al.: Deep ocean ventilation, carbon isotopes, marine sedimentation and the deglacial CO2 rise
Fig. 6. Ocean ventilation experiments: time-dependent carbon cycle response of the coupled ocean-sediment system to changes in deepocean ventilation induced by scaling the amplitude of windstress and deep convection in the Southern Ocean.
ventilation in case of the on-states (rising by 2.9 % per 100-year reduction in global deep water age). The marine silicacycle reacts substantially more sensitively to the ocean ven-tilation changes than the organic matter cycle: Opal export at2 kyr increases by 8.6 % upon a 100 year-reduction in globaldeep water age and decreases by 7.6 % per 100 year-increase.The full time-dependent response in POC and opal export isshown in Fig. 6c and d.
Note that the efficiency of the soft-tissue pumpP∗, de-fined here as the ratio between regenerated and total phos-phate in the deep ocean (Ito and Follows, 2005), behavesconversely, i.e.P∗ increases as export production decreasesparallel to slowed ventilation (Table 3). As long as NADWformation is active, a linear relation is found between atmo-spheric CO2 andP∗ (Fig. 8), which reflects a maximum im-pact of the biological pumps of 336 ppm at full efficiency.
Clim. Past, 7, 771–800, 2011 www.clim-past.net/7/771/2011/

T. Tschumi et al.: Deep ocean ventilation, carbon isotopes, marine sedimentation and the deglacial CO2 rise 785
Table 2. Ocean ventilation experiments in the ocean-sediment model: simulated changes in the global mean deep ocean temperature,biological production and in the effeciency of the soft-tissue pump at the time slice 2 kyr after the abrupt variation in ocean ventilation.
SO wind stress Atm. Mean deep Mean deep POM CaCO3 Global mean Opal Efficiency ofamplitude pCO2 water agea water temp.a export export rain ratio export soft-tissue
pumpb
ppm years ◦C GtC yr−1 GtC yr−1 – Tmol Si yr−1 %
20 % 246.2 2097 2.02 11.07 0.99 0.089 76.8 52.040 % 250.0 2062 1.51 11.42 1.02 0.089 79.1 48.8
60 % 268.2 1963 1.49 12.14 1.08 0.089 86.4 47.780 % 273.1 1908 1.54 12.54 1.11 0.089 92.7 46.7Control 278.0 1840 1.61 12.76 1.13 0.088 95.5 45.4120 % 284.2 1770 1.62 12.99 1.14 0.088 98.6 43.5140 % 290.1 1706 1.69 13.24 1.16 0.088 104.2 41.7160 % 295.3 1640 1.77 13.46 1.17 0.087 110.7 40.018 0% 300.0 1578 1.90 13.62 1.18 0.087 116.4 38.4
aGlobal mean values below 2000 m depth.bDefined as the fraction of regenerated PO4 versus total PO4 afterIto and Follows(2005), Eq. (4).
Fig. 7. Response in atmospheric(a) CO2, (b) δ13CCO2, and(c) 114CCO2 to changes in ocean ventilation. Displayed values are diagnosedfor the time slice at 2 kyr after the perturbation in SO wind forcing. At this time carbon, cycling has reached a new equilibrium in theocean-only model (circles), whereas the ocean-sediment model (stars) is still under relaxation at 2 kyr due to the millennial-scale responseof ocean-sediment interactions.
This value is close to the 312 ppm found byIto and Follows(2005) on the basis of a simple theory combining the massbalance for carbon and nutrients in the ocean-atmospheresystem and the linearization of carbonate chemistry. The rel-atively close correspondence between this theoretical valueand the sensitivity of atmospheric CO2 to P∗ found in ourexperiments indicates that the predominant part of the simu-lated CO2 response to changes in SO deep water formationis due to changes in the biological pump efficiency.
The simulated relation between atmospheric CO2 and thesoft-tissue pump efficiencyP∗ deviates from linearity assoon as NADW formation shuts down in response to weakSO winds (Fig. 8). Thus, the anomalous CO2 reduction of∼10 ppm due to the AMOC collapse cannot be explainedwith changes in the biological carbon pumps. Further, the
absence of a drop in simulated global mean deep watertemperature and in the global rain ratio (Table 2) seemsto preclude a dominant role of the solubility and carbonatepumps. We conjecture that the simulated anomalous CO2drop in response to collapsed AMOC results primarily froman increase in the deep water DIC disequilibrium component(Marinov et al., 2008).
The simulated interplay between ocean ventilation, marinecarbon cycling and atmospheric CO2 displayed in our windstress-experiments is in good qualitative agreement with theresults ofSchmittner et al.(2007), who find a similar re-sponse in marine biogeochemistry to changes in the globalstrength of wind stress. However, the effect of AMOC shut-downs on marine carbon cycling in our experiments can-not be readily compared with the corresponding results of
www.clim-past.net/7/771/2011/ Clim. Past, 7, 771–800, 2011

786 T. Tschumi et al.: Deep ocean ventilation, carbon isotopes, marine sedimentation and the deglacial CO2 rise
Fig. 8. Ocean ventilation experiments: quasi-linear relation be-tween simulated atmospheric CO2 and the efficiency of the soft-tissue pumpP∗ (Ito and Follows, 2005) for the ventilation stateswith active NADW formation (circles). The linear relation is per-turbed when NADW formation is shutdown in response to stronglyreduced windstress in the Southern Ocean (rectangles).
Schmittner et al.(2007), since AMOC is suppressed by fresh-water forcing in the North Atlantic in their experiments ratherthan by weak SO winds.
The reorganization of the marine biological cycle is furtherreflected in the simulated change in the nutrient distributionandδ13CDIC signatures. The total phosphate concentrationsdecrease andδ13CDIC signatures increase in the sea surfaceas ocean ventilation is slowed and euphotic zone nutrients areutilized more efficiently (Table 3). After propagation of thissignal across the air-sea interfaceδ13CCO2 is shifted towardsless negative values in the atmosphere. The radiocarbon sig-nature in atmospheric CO2, 114CCO2, increases in responseto reduced ventilation due to slowed physical transport of ra-diocarbon to the deep ocean which ultimately reduces oceanuptake of14C.
A specific consequence of the Southern Ocean ventilationmechanism is that verticalδ13CDIC-gradients in the South-ern Ocean should have steepened during glacials (Hodellet al., 2003; Ninnemann and Charles, 2002). Our results re-produce this connection between deep mixing in the South-ern Ocean and the vertical gradient inδ13CDIC. Reduceddeep mixing evidenced by a larger114CDIC difference be-tween the surface and deep Southern Ocean is accompa-nied by steeper vertical gradients in total phosphate andδ13CDIC (Table 3). According to our results, upon a re-duction of 100 years in the difference between surface anddeep water age (mean value below 2000 m) in the South-ern Ocean, theδ13CDIC-gradient (difference between surfaceand mean signature below 2000 m in the Southern Ocean) in-creases by 0.16 ‰ and the vertical phosphate-gradient growsby 0.13 mol m−3 (Table 3).
2.3.3 The long-term effect of ocean-sedimentinteractions
The long-term millennial-scale trends in atmospheric CO2,δ13CCO2 and114CCO2 arise from the slow response in sedi-ment diagenesis to the changing biogeochemical state of theocean. The sedimentary processes tend to restore in the longrun burial rates of CaCO3, POC and opal towards initial un-perturbed values in order to re-establish the balance with thefixed weathering inputs.
The simulated variations in atmospheric CO2 are ampli-fied by 30 %–60 % within 50 kyr through the net effect ofthe sedimentary feedbacks subsequent to ventilation changes(Table 4). The overall simulated sedimentary CO2 responseis dominated by the changes in CaCO3 burial. In fact, theshifts in organic matter burial counteract the simulated CO2variations as long as AMOC is maintained (on-states). Forinstance, accelerated ocean ventilation leads to a net risein atmospheric CO2, whereas elevated organic matter burialtends to reduce CO2 by drawing carbon out of the ocean-atmosphere system. In the on-states, the sedimentary CO2response amplification is of 30 %–40 % (Table 4). In case ofcollapsing AMOC on the other hand, CO2 changes are re-inforced by the sedimentary feedbacks by as much as 60 %,since both carbonate compensation from reduced CaCO3 ex-port as well as excess POC burial driven by the reduction indeep ocean oxygen availability reinforce the CO2 drawdownfrom slowed ventilation.
In contrast to the previous experiment in which the whole-ocean nutrient content is enhanced, the concomitant varia-tions in deep ocean oxygen availability subsequent to ventila-tion changes weaken the importance of the nutrient-feedbackby decoupling the link between shifts in POC export andin POC sediment burial. Enhanced (decreased) ventilationpromotes (reduces) remineralization within the sedimentsthrough increased (decreased) oxygen concentrations in porewaters. A specific consequence is that the changes in POCexport arising from altered deep ocean ventilation are main-tained to a substantial degree in the long term (Fig. 6c). ThePOC burial flux, however, relaxes again to initial conditionsto re-establish the balance with weathering input. In con-clusion, the variations in oxygen availability in the oceandriven by the ventilation changes significantly decouple thelink between POC export and POC burial. This decouplingcomplicates the reconstruction of past POC export on the ba-sis of sedimentary records.
The sedimentary response in atmosphericδ13CCO2 is dom-inated by the temporal evolution of POC burial. For instance,in the model states with accelerated ocean ventilation, excessPOC burial draws organic matter with lowδ13 (∼ −20 ‰)out of the ocean-atmosphere system. As a consequence, thesediment response is to shiftδ13CCO2 towards less negativevalues (Fig. 6g, red and yellow lines). Excess burial of POCand CaCO3 both remove carbon with low114C from theocean-atmosphere system in response to a better ventilated
Clim. Past, 7, 771–800, 2011 www.clim-past.net/7/771/2011/
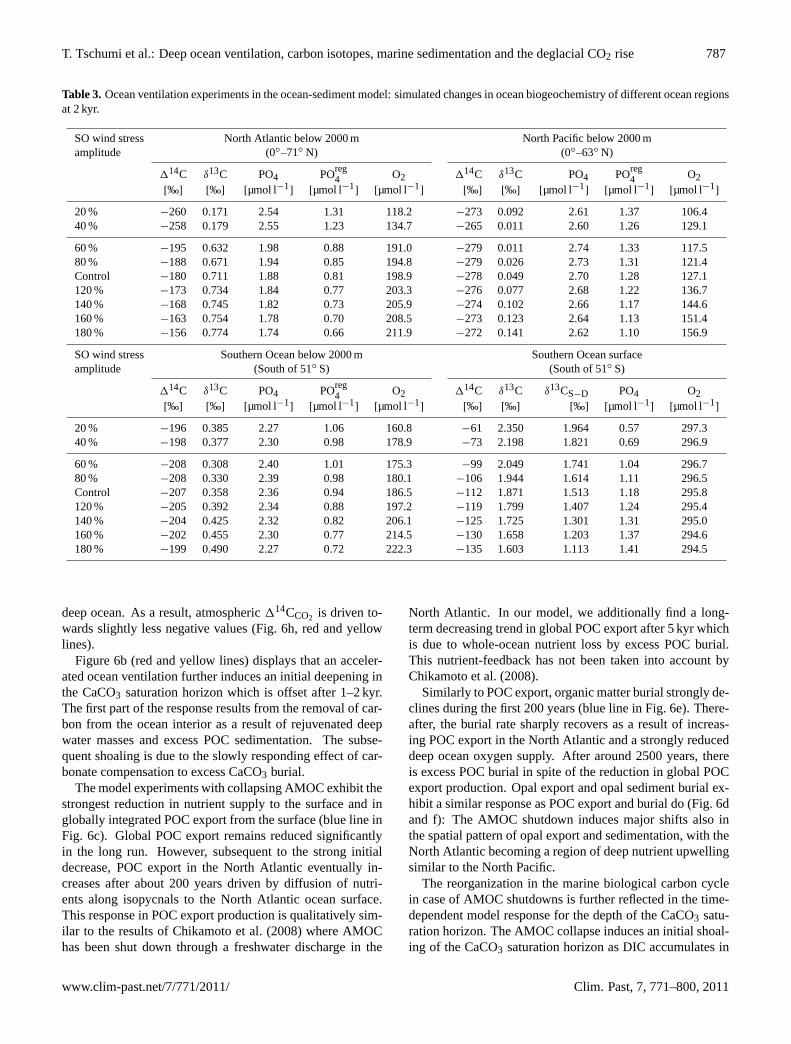
T. Tschumi et al.: Deep ocean ventilation, carbon isotopes, marine sedimentation and the deglacial CO2 rise 787
Table 3. Ocean ventilation experiments in the ocean-sediment model: simulated changes in ocean biogeochemistry of different ocean regionsat 2 kyr.
SO wind stress North Atlantic below 2000 m North Pacific below 2000 mamplitude (0◦–71◦ N) (0◦–63◦ N)
114C δ13C PO4 POreg4 O2 114C δ13C PO4 POreg
4 O2[‰] [‰] [µmol l−1
] [µmol l−1] [µmol l−1
] [‰] [‰] [µmol l−1] [µmol l−1
] [µmol l−1]
20 % −260 0.171 2.54 1.31 118.2 −273 0.092 2.61 1.37 106.440 % −258 0.179 2.55 1.23 134.7 −265 0.011 2.60 1.26 129.1
60 % −195 0.632 1.98 0.88 191.0 −279 0.011 2.74 1.33 117.580 % −188 0.671 1.94 0.85 194.8 −279 0.026 2.73 1.31 121.4Control −180 0.711 1.88 0.81 198.9 −278 0.049 2.70 1.28 127.1120 % −173 0.734 1.84 0.77 203.3 −276 0.077 2.68 1.22 136.7140 % −168 0.745 1.82 0.73 205.9 −274 0.102 2.66 1.17 144.6160 % −163 0.754 1.78 0.70 208.5 −273 0.123 2.64 1.13 151.4180 % −156 0.774 1.74 0.66 211.9 −272 0.141 2.62 1.10 156.9
SO wind stress Southern Ocean below 2000 m Southern Ocean surfaceamplitude (South of 51◦ S) (South of 51◦ S)
114C δ13C PO4 POreg4 O2 114C δ13C δ13CS−D PO4 O2
[‰] [‰] [µmol l−1] [µmol l−1
] [µmol l−1] [‰] [‰] [‰] [µmol l−1
] [µmol l−1]
20 % −196 0.385 2.27 1.06 160.8 −61 2.350 1.964 0.57 297.340 % −198 0.377 2.30 0.98 178.9 −73 2.198 1.821 0.69 296.9
60 % −208 0.308 2.40 1.01 175.3 −99 2.049 1.741 1.04 296.780 % −208 0.330 2.39 0.98 180.1 −106 1.944 1.614 1.11 296.5Control −207 0.358 2.36 0.94 186.5 −112 1.871 1.513 1.18 295.8120 % −205 0.392 2.34 0.88 197.2 −119 1.799 1.407 1.24 295.4140 % −204 0.425 2.32 0.82 206.1 −125 1.725 1.301 1.31 295.0160 % −202 0.455 2.30 0.77 214.5 −130 1.658 1.203 1.37 294.6180 % −199 0.490 2.27 0.72 222.3 −135 1.603 1.113 1.41 294.5
deep ocean. As a result, atmospheric114CCO2 is driven to-wards slightly less negative values (Fig. 6h, red and yellowlines).
Figure 6b (red and yellow lines) displays that an acceler-ated ocean ventilation further induces an initial deepening inthe CaCO3 saturation horizon which is offset after 1–2 kyr.The first part of the response results from the removal of car-bon from the ocean interior as a result of rejuvenated deepwater masses and excess POC sedimentation. The subse-quent shoaling is due to the slowly responding effect of car-bonate compensation to excess CaCO3 burial.
The model experiments with collapsing AMOC exhibit thestrongest reduction in nutrient supply to the surface and inglobally integrated POC export from the surface (blue line inFig. 6c). Global POC export remains reduced significantlyin the long run. However, subsequent to the strong initialdecrease, POC export in the North Atlantic eventually in-creases after about 200 years driven by diffusion of nutri-ents along isopycnals to the North Atlantic ocean surface.This response in POC export production is qualitatively sim-ilar to the results ofChikamoto et al.(2008) where AMOChas been shut down through a freshwater discharge in the
North Atlantic. In our model, we additionally find a long-term decreasing trend in global POC export after 5 kyr whichis due to whole-ocean nutrient loss by excess POC burial.This nutrient-feedback has not been taken into account byChikamoto et al.(2008).
Similarly to POC export, organic matter burial strongly de-clines during the first 200 years (blue line in Fig. 6e). There-after, the burial rate sharply recovers as a result of increas-ing POC export in the North Atlantic and a strongly reduceddeep ocean oxygen supply. After around 2500 years, thereis excess POC burial in spite of the reduction in global POCexport production. Opal export and opal sediment burial ex-hibit a similar response as POC export and burial do (Fig. 6dand f): The AMOC shutdown induces major shifts also inthe spatial pattern of opal export and sedimentation, with theNorth Atlantic becoming a region of deep nutrient upwellingsimilar to the North Pacific.
The reorganization in the marine biological carbon cyclein case of AMOC shutdowns is further reflected in the time-dependent model response for the depth of the CaCO3 satu-ration horizon. The AMOC collapse induces an initial shoal-ing of the CaCO3 saturation horizon as DIC accumulates in
www.clim-past.net/7/771/2011/ Clim. Past, 7, 771–800, 2011

788 T. Tschumi et al.: Deep ocean ventilation, carbon isotopes, marine sedimentation and the deglacial CO2 rise
Table 4. Long-term response in atmospheric CO2 and amplification by sedimentary feedbacks.
SO wind stress Global Deep Atmospheric CO2 Atmospheric CO2 Sedimentaryamplitude Water Age without sediments with sediments amplification
after 50 kyr after 50 kyr of the CO2 response[years] [ppm] [ppm] [%]
20 % 2097 251 234 63 %40 % 2062 252 236 62 %
60 % 1963 269 265 44 %80 % 1908 273 271 40 %
Control 1840 278 278 –120 % 1770 285 287 29 %140 % 1706 290 294 33 %160 % 1640 295 302 30 %180 % 1578 299 308 30 %
the deep from the slowed ventilation and reduced POC burial(Fig. 6b). Consistently, the shoaling is more pronounced inthe Atlantic than in the Pacific basin. After 1–2 kyr the sat-uration horizon starts to deepen again in both basins as deep[CO2−
3 ] rises from the combined effects of reduced CaCO3burial and increasing POC burial. The final steady state shiftin the CaCO3 saturation horizon is a deepening of 100–200 min the Atlantic and of 500–600 m in the Pacific.
3 Discussion
Our modelling approach is associated with a number of con-ceptual and methodological limitations worth mentioning.First, the model scenarios are idealized and not intended todirectly reflect the temporal evolution of paleo-proxy signalsas recorded in climatic archives. Second, changes in deepocean ventilation are generated by varying the magnitude ofthe wind stress in the Southern Ocean by more than a factorof two. This is a convenient technical tuning mechanism toadjust the deep ocean ventilation age in the model. However,we stress the fact that these variations in SO wind strengthexceed the range of realistic changes. The atmospheric CO2response to realistic variations has been found to be rathermodest (Tschumi, 2009; Menviel et al., 2008).
The model simulations have been tailored to investigatethe specific response in atmospheric CO2 and other paleo-proxies to uniform variations in deep ocean ventilation age.Several possibly important processes to explain the fullglacial-interglacial CO2 variability have not been taken intoaccount. We have neglected, for instance, the well-recordedvariations of AMOC (McManus et al., 2004), changes in theterrestrial biosphere, in sea surface temperatures or in sea icecover. Further, the Bern3D+C is a model of intermediatecomplexity with coarse resolution and does not resolve ed-dies and other processes operating on small scales. Marine
biological production is represented as simple prognostic for-mulations considering the competition between opal and cal-cite producers and changes in the uptake ratio of silica tophosphate.
When interpreting the model results in the context of car-bon cycle changes during the last deglaciation it should bekept in mind that the starting point of all sensitivity experi-ments is a stationary state corresponding to the preindustrialclimate and carbon cycle. This modelling approach has beenchosen, as the knowledge about glacial climate is subject toconsiderable uncertainty. The focus of this study is furtherlaid upon a more qualitative interpretation of the interplaybetween different carbon cycle processes which depends lesscritically on the specific choice of initial conditions than thequantitative interpretation of a single paleoclimatic processor signal.
Nevertheless, we have have performed an additional sensi-tivity experiment in order to quantify the uncertainty associ-ated with the initial state of ocean ventilation: Starting froma stationary state with preindustrial carbon cycle boundaryconditions but with low ocean ventilation as resulting from60 %-SO winds, SO wind stress has been increased to 140 %.Comparing the response in atmospheric CO2, δ13CCO2 and114CCO2 with the corresponding 180 %-SO winds experi-ment starting from standard winds (red lines in Fig. 6) hasshown that the sensitivity to the initial ventilation state ofthe ocean is negligible as long as there is no structural shiftin the large-scale circulation pattern such as a breakdown ofAMOC.
In spite of the inherent limitations mentioned above, theresults of our study allow for a number of robust conclusions.We argue in the following that the processes represented inour model played a dominant role for reorganizing the globalcarbon cycle during the early part of the last deglaciation.
Clim. Past, 7, 771–800, 2011 www.clim-past.net/7/771/2011/

T. Tschumi et al.: Deep ocean ventilation, carbon isotopes, marine sedimentation and the deglacial CO2 rise 789
3.1 Southern Ocean ventilation hypothesis
The “Southern Ocean ventilation hypothesis” (e.g.,Francoiset al., 1997) is the starting point for discussion of our mod-elling results. According to this hypothesis, low glacial CO2values are related to a poorly ventilated deep ocean and a sta-bly stratified Southern Ocean. Such a configuration wouldlead to an accumulation of carbon in the deep ocean dur-ing glacial periods relative to interglacials. The rise in atmo-spheric CO2 over the glacial transition is driven by the break-up of Southern Ocean stratification and the resumption ofmodern-scale upwelling, bringing water rich in carbon, sil-ica, and other nutrients and depleted in13C and14C to thesurface. The characteristics of these upwelled water massesare further communicated within the intermediate and sur-face ocean by entrainment into the Subantarctic Mode Waterand Antarctic Intermediate Water and to the atmosphere byair-sea gas-exchange. During recent years, a large numberof observational evidence has been published supporting theview that changes in SO deepwater formation and in deepocean ventilation have played an important role for glacial-interglacial CO2 variations (e.g.,Fischer et al., 2010; Speroand Lea, 2002; Adkins et al., 2002; Anderson et al., 2009;Muscheler et al., 2004; Brovkin et al., 2007; Hodell et al.,2003; Marchitto et al., 2007; Francois et al., 1997).
The response of our ocean-sediment carbon cycle modelto strengthened Southern Hemisphere westerly winds repro-duces some of the key mechanisms attributed to the “South-ern Ocean ventilation hypothesis”. Invigorated wind stresspromotes vertical exchange of water masses in the SO,thereby significantly affecting the physical and biogeochem-ical properties of deep ocean water on a global scale. Ourresults highlight in particular a rather close correlation be-tween changes in ventilation age, the amount of biologicallysequestered carbon and theδ13C-signature in sea water asshown in Fig. 9.
In the following sub-sections we will discuss paleo-datafrom sediment analyses and from ice cores which indi-cate that large changes in Southern Ocean ventilation in-deed occurred during the early part of the deglaciation,roughly in the interval between 18 ka BP and the onset ofthe Antarctic Cold reversal and the Bølling/Allerød North-ern Hemisphere warming at about 14.6 ka BP (Severinghausand Brook, 1999). We will then compare the data with ourmodel results to constrain the magnitude of the change in at-mospheric CO2 over the last termination which is driven bya SO ventilation mechanism.
3.1.1 Changes in Southern Ocean opal sedimentation
Anderson et al.(2009) report reconstructed opal fluxes inSouthern Ocean sediments which show a rapid increase start-ing roughly together with the rise in atmospheric CO2 around17 ka BP, followed by a deglacial maximum and a long-term
decrease into the Holocene (Fig. 9). Opal flux rates aretypically several-fold higher during the transition comparedto glacial and late-Holocene values.Anderson et al.(2009)interpret these opal flux changes as variations in South-ern Ocean upwelling, concluding that there was a rapid in-crease in the upwelling of silica and carbon rich deep wa-ter to the Southern Ocean surface at the onset of deglacia-tion (∼18 ka BP). They propose a direct link between the in-creased ventilation of deep water to the deglacial rise in at-mospheric CO2.
The step-wise strengthening of SO wind stress as appliedin our ocean ventilation experiments drives an immediate risein deep upwelling in the Southern Ocean in response to en-hanced Ekman pumping and more vigorous deep convectionin the model. These simulations may thus serve as modelscenarios for an abrupt resumption of upwelling in the SO.Figure 9 shows that our model results for strengthened SOwind stress are in good qualitative agreement with the sed-iment data ofAnderson et al.(2009) in relative magnitudeand timing: Increasing SO wind stress by 80 % drives a rapid30 %-rise in opal export as more silica is supplied to the sur-face. Additionally, opal sedimentation also increases andreaches a peak value with a delay of several millennia rel-ative to the reinvigoration of deep upwelling in the SouthernOcean. The peak sedimentation flux is two to three timeshigher than the initial flux. Both opal export and sedimen-tation slowly decrease towards initial rates with a typicaltime scale of 20 kyr. Note however that simulated opal burialfluxes are about 10 times smaller than the reconstructed opalflux (Fig. 9). This is likely due to the spatial averaging overthe model grid cell and the relatively low simulated globalburial rate of opal as compared to available estimates (Ta-ble 1).
Anderson et al.(2009) suggest, based on the positive cor-relation between231Pa/230Th and opal flux in their records,that the deglacial maximum in opal flux reflects past changesin opal production and Si supply rather than variable opalpreservation. In our model however, a relatively modest in-crease in global silica export of 30 % enhances the net flux tothe sediments in a highly non-linear way as pore water con-centrations of silicic acid and thus the preservation of opalin the sediments greatly increases under the enhanced rain ofsilica particles (Archer et al., 2000a; Ridgwell et al., 2002).The majority of the simulated change in opal sedimentationflux thus reflects increased preservation rather than increasedopal production as suggested byAnderson et al.(2009).
Why does the reconstructed opal sedimentation flux relaxtowards glacial conditions over the course of the Holocene,whereas atmospheric CO2 and, presumably, Southern Oceanupwelling remains at high interglacial values? From a con-tinued large Southern Ocean upwelling, one might expect acontinued silica supply to the surface ocean, and a sustainedhigh export and sedimentation rate. In our simulation, in-creased opal burial drives a loss of whole-ocean silica. As aresult, the simulated export of opal and its sedimentation rate
www.clim-past.net/7/771/2011/ Clim. Past, 7, 771–800, 2011

790 T. Tschumi et al.: Deep ocean ventilation, carbon isotopes, marine sedimentation and the deglacial CO2 rise
Fig. 9. Model response forδ13CDIC, ventilation age and114CDIC to stimulated deep mixing in the Southern Ocean and to more vigorousand deeper AMOC as a result of a 80 %-increase in SO wind stress amplitude. Shown are the simulated differences in Atlantic and Pacifczonal mean sections at 15 ka after the the step-wise perturbation of the model state.
relax towards initial conditions to balance riverine input withthe burial flux of silica.
Is the evolution of the opal sedimentation flux directly cor-related with opal export and the resumption of upwelling orare there any system time lags? The simulated peak in opalsedimentation is delayed by several millennia compared tothe onset of the ventilation in our model. This suggests that
the temporal evolution of the ventilation history may be diffi-cult to disentangle exactly from the temporal evolution of theopal sedimentation flux. Nevertheless, the opal records ap-pear consistent with a change in deep ocean ventilation thatoccurred during the early deglacial period and that may ormay not have been abrupt.
Clim. Past, 7, 771–800, 2011 www.clim-past.net/7/771/2011/

T. Tschumi et al.: Deep ocean ventilation, carbon isotopes, marine sedimentation and the deglacial CO2 rise 791
3.1.2 Changes in the stable carbon isotope ratioδ13C
Figure 10 displays the currently availableδ13CCO2 recordsfrom Antarctic ice cores covering the period of the lastdeglaciation (Smith et al., 1999; Lourantou et al., 2010;Elsig, 2009) together with reconstructed atmospheric CO2(Monnin et al., 2001) and δ18OH2O (Stenni et al., 2001),which is a proxy for local temperature on the ice sheet. Theδ13CCO2 records consistently show an early deglacial de-crease of 0.3–0.4 ‰ to reach a minimum at around 15 ka BPand a millennial-scale long-term increase by the same magni-tude to attain approximately constant values at 7 ka BP (Elsiget al., 2009). However, the records disagree on the details ofthe δ13CCO2 evolution during the Bølling/Allerød-YoungerDrias climate swings.
Sediment cores from different ocean basins (Indo-Pacific,sub-Antarctic, and South Atlantic) reveal that the occur-rence of carbon isotope minima at the beginning of glacialterminations is a widespread feature in planktic foraminiferaδ13C records (Spero and Lea, 2002). The decrease in theδ13C records occurred simultaneously with the initiation ofSouthern Ocean warming. The data suggests a decrease insurface waterδ13C in the early deglacial period (∼20 ka BPto 16 ka BP), an absolute minimum at the same time as theice core record ofSmith et al.(1999) which is followed byan increase over the rest of the deglacial period into the earlyHolocene. Taken together, both sediment and ice core datasuggest decreasing atmosphericδ13C during the first stageof the deglacial period followed by a long-term increase ofsimilar magnitude.
How can this millennial-scaleδ13C evolution be ex-plained? Our results lend support for the interpretation ofSpero and Lea(2002) andKohler et al.(2005) that the earlydeglacialδ13C decrease reflected renewed Circumpolar DeepWater upwelling with an enhanced transport of lowδ13C. Adecrease in atmosphericδ13CCO2 of 0.3 ‰ would require arejuventation of deep ocean waters by 300 to 400 years ac-cording to theδ13CCO2 sensitivity found in our ventilationexperiments (Fig. 7b). Subsequently, this negative signal isreduced by roughly 50 % over the following 15 kyr due to ex-cess sedimentation of organic material (Fig. 6g). This wouldleave an increase of 0.1–0.2 ‰ to be explained by other pro-cesses such as carbon uptake by the terrestrial biosphere, sur-face ocean warming or sea ice retreat.
3.1.3 Changes in CaCO3 saturation horizon depth
Analyses of the sedimentary bulk composition indicate a pe-riod of enhanced preservation of CaCO3 deep sea sedimentsbetween ∼15–7 ka BP (Ridgwell et al., 2003; Broeckeret al., 2001). Broecker et al.(2001) attribute this sedimen-tary signal to an early deglacial restoration of the terres-trial biosphere. The resulting removal of carbon from theatmospheric and oceanic reservoirs is made responsible fora deepening of the CaCO3 saturation horizon between about
Fig. 10.Reconstructed local opal flux (blue line) at 61.9◦ S/170◦ Wfrom Anderson et al.(2009) and simulated opal burial rate in thecorresponding model cell (red line) as simulated in the experimentwith an abrupt 80 %-increase in SO wind stress at 18 ka BP.
15–10 ka BP. The deepening is followed by a gradual shoal-ing until the latter part of the Holocene which is attributedto carbonate compensation.Ridgwell et al.(2003) invoke re-growth of coral reefs as additional factor driving the deglacialsignal of the Pacific CaCO3 saturation horizon to simultane-ously account for the evolution of atmospheric CO2.
In response to stimulated upwelling in the Southern Oceanrejuvenating deep waters by 300–400 years, our model pre-dicts a similar temporal evolution for the Pacific CaCO3 sat-uration horizon. We simulate a deepening saturation horizonby 300–400 m during the first∼2 kyr and a slow shaolingthereafter to reach initial depths after around 28 kyr (Fig. 6b).The simulated initial deepening is a result of the flushing ofthe old carbon-rich deep water mass from the Pacifc basinand of excess organic matter sedimentation (Fig. 4b). Thisis consistent with deglacial CaCO3 and organic matter fluxreconstructions from the North Pacific (e.g.,Jaccard et al.,2005; Galbraith et al., 2007) as well as with CO2−
3 recon-structions based on benthic Zn/Ca measured in the deepequatorial Pacific (Marchitto et al., 2005). However, the tim-ing of our model results does not match the observationsvery precisely, maybe due to the unrealistic abrupt change inmodel boundary conditions. Nevertheless, the agreement issufficient in order to indicate that increasing deep ocean ven-tilation and early deglacial excess sedimentation of organicmatter may have significantly contributed to the recordedcarbonate ion signal in the Pacific ocean in addition to thechanges in terrestrial biosphere and growth of coral reefsas proposed byBroecker et al.(2001) and Ridgwell et al.(2003).
3.1.4 Changes in radiocarbon signatures
Is an increase in deep ocean ventilation consistent with ma-rine radiocarbon data? To generate the full amplitude of
www.clim-past.net/7/771/2011/ Clim. Past, 7, 771–800, 2011

792 T. Tschumi et al.: Deep ocean ventilation, carbon isotopes, marine sedimentation and the deglacial CO2 rise
the early deglacial 35 ppm increase in atmospheric CO2, adecrease in the deep ocean ventilation age of about 300–400 years is required according to the model-derived lin-ear relationship between CO2 and ventilation age (Fig. 7a).Corresponding simulated changes in deep ocean114CDICare an increase of 40-45 in the deep North Atlantic of10–15 ‰ in the deep North Pacific and in the deep South-ern Ocean (Table 4). Atmospheric114C would drop by30–40 ‰ (Fig. 7c). The simulated atmosphere-deep ocean114C-difference would thus be reduced by 70–80 ‰ in thedeep Atlantic and by 40–50 ‰ in the deep North Pacific andthe deep Southern Ocean.
A decrease in deep ocean ventilation age of 300–400 yearsduring the early deglacial period seems broadly consistentwith available proxy records. However, the locally largechanges between 18 ka BP and 14.5 ka BP in the benthic-planktonic age-difference of∼1000 years in the Atlantic sec-tor of the SO (Skinner et al., 2010) or of ∼700 years in thedeep North Pacific (Galbraith et al., 2007) are not reproducedin our model. Overall, our results are in line with the model-based interpretation of the glacial-interglacial changes in pastatmospheric114C byKohler et al.(2006b) where a∼40 ‰-contribution is attributed to changes in ocean circulation,compared to the 30–40 ‰ from our results.
A difficulty in the interpretation of marine114C data interms of ventilation age is that the114C signature at anygiven time does not just reflect the ventilation age, but alsothe time history of the atmospheric114C. The life time ofradiocarbon with respect to radioactive decay is 8267 years,implying a considerable memory to earlier114C variations.Atmospheric114C decreased by about 400 ‰ over the lasttransition (Hughen et al., 2004; Beck et al., 2001). A riddlepresents the as yet unexplained drop of about 190 ‰ between17.5 to 14.5 ka BP (Broecker and Barker, 2007). This drop isalmost four times larger than the scenario-based decrease of50 ‰ and apparently also finds no correspondence in deepocean radiocarbon change (Broecker and Barker, 2007). Weare cautious to draw conclusions at this stage and believe thatfurther evaluations are required using transient simulations ofthe coevolution of atmospheric CO2, 114C, and14C produc-tivity.
4 Conclusions
Can we estimate the contribution of the Southern Ocean ven-tilation mechanism to the last deglacial CO2 rise on the ba-sis of our model results? CO2 rose by about 35 ppm be-tween the LGM and 15 ka BP (Fig. 10). If this CO2 in-crease is entirely attributed to rejuvenating deep ocean wa-ters, it would translate into a global reduction in deep waterage of roughly 350 years, according to the model-derived lin-ear relationship between CO2 and ventilation age (Fig. 7a).Due to carbonate compensation in response to this ventila-tion change, CO2 would increase by another∼10 ppm over
Fig. 11. Paleo-records from Antarctic ice cores:δ13C-data is fromElsig et al.(2009) (green triangles),Smith et al.(1999) (red tri-angles) andLourantou et al.(2010) (blue triangles). The blue ar-row indicates the recorded drop inδ13CCO2 (∼ −0.4 ‰) starting
around 18 ka BP. CO2-data is fromMonnin et al.(2001) andδ18O-data fromStenni et al.(2001).
the following 15 kyr. The early deglacial CO2 increase mightalso reflect positive contributions from surface water temper-ature changes (Tschumi et al., 2008) and an estimated neg-ative contribution from terrestrial uptake due to CO2 fertil-ization on ice-free land (Joos et al., 2004). The two effectsmight have roughly cancelled. Taken together, our model re-sults suggest that the Southern Ocean ventilation mechanismhas contributed about half to the reconstructed total glacial-interglacial CO2 increase of 90–100 ppm.
Our interpretation is further supported by a number ofprominent paleo-proxy signals that are adequately repro-duced in our simulations. As a response to an abrupt reju-venation of deep ocean watermasses by 300–400 years stim-ulated by more vigorous deep convection in the SouthernOcean, we simulate a decline inδ13CCO2 by ∼0.3 ‰ duringthe first 2 kyr followed by a gradual rise as observed in thepaleo-records. Taken at face value, the ice core data suggesta slope of 12 ppm per 0.1 ‰ change inδ13CCO2 (35 ppm per
Clim. Past, 7, 771–800, 2011 www.clim-past.net/7/771/2011/

T. Tschumi et al.: Deep ocean ventilation, carbon isotopes, marine sedimentation and the deglacial CO2 rise 793
0.3 ‰) during the early deglacial period, whereas the model-derived slope amounts to 13 ppm per 0.1 ‰. The model re-sponse also agrees well with increased opal sedimentationrates in the Southern Ocean during the early deglaciation(Anderson et al., 2009) and is further consistent with the re-constructed evolution of the Pacific CaCO3 saturation hori-zon (Broecker et al., 2001). We finally predict a drop of 30–40 ‰ in atmospheric114CCO2 as another result of the invig-orated deep ocean ventilation.
Although the simulated model response fits rather wellwith these specific paleo-proxy records, a perfect matchshould not be expected. Modeled carbon cycle sensitivi-ties might be subject to considerable uncertainty, in partic-ular due to unsettled questions related to the diffusivity ofthe oceans (Archer et al., 2000b). Further, it turned out dif-ficult to reproduce the exact temporal evolution ofδ13C and114C, as recorded in sediment cores in the model. Thesesignals might sensitively depend upon regional and temporaldetails of the deglacial reorganization of global ocean circu-lation and may be further affected by the variations of AMOC(McManus et al., 2004) not considered here. Nonetheless,based on the multi-proxy comparison between our simulatedresponse and the available paleo-data, we conclude that ac-celerating deep ocean ventilation linked to physical processesin the SO has been the dominant driver of early deglacialchanges in global carbon cycling. Early deglacial ocean ven-tilation changes have continued to significantly contributeto variations in atmospheric CO2 until the latter part of theHolocene, since it takes millennia for marine sedimentationto re-establish equilibrium with weathering input.
The glacial-interglacial CO2 variations appear to be drivenby a complex spatio-temporal pattern of processes involv-ing relaxation time-scales of years to millennia. Our anal-ysis of the time-dependent response in the coupled ocean-sediment system highlights that the benefit of conventional“time slice” approaches to study these processes might berather limited. Our model results suggest that proxy sig-nals arising from deglacial ventilation changes are sustainedon a multi-millennial time-scale until the balance betweencarbon, nutrient and isotope input through rivers and windsand the loss through sedimentation is re-established. Thus,differences in these proxies between the LGM and the lateHolocene time slice may partly reflect imbalances in theweathering-sedimentation cycles. This may also be relevantfor proxies not included here such as silica or nitrogen iso-topes.
We have identified a feedback between the marine nutrientinventory and sedimentation of organic matter. This mecha-nism emerges from the fact that marine biological produc-tivity in the long run is limited by the riverine input of nu-trients into the ocean. Our results indicate that this nutrient-sediment feedback might be important for glacial-interglacialchanges in global carbon cycling. For instance, invigo-rated ocean circulation promotes export production and ex-cess sediment burial of organic matter. The implications for
the combined ocean-atmosphere carbon cycle are similar tothose of a postulated early deglacial restoration of the terres-trial biosphere (Broecker et al., 2001).
In this study, we have analyzed the time-dependent re-sponse in atmospheric CO2 and its isotopic signaturesonly to the specific mechanisms of deep ocean ventilationchanges and biological pump reorganizations. To improvethe process-related understanding of the CO2, δ13CCO2 and114CCO2 records over the last deglaciation, further mech-anisms such as sea surface temperature changes, coral reefgrowth, changes in the carbon stock on land and the spatio-temporal details of the various regional oceanic reorgani-zations should be considered in coupled 3-D global car-bon cycle models. Simultaneous model-data comparison onthe basis of multiple proxy records wisely chosen seems tobe a promising approach towards a better understanding ofthe dynamical interplay between the multiple factors drivingglacial-interglacial CO2 fluctuations. A particular challengeis to identify and simulate the physical mechanisms respon-sible for the changes in Southern Ocean ventilation.
Appendix A
Sediment diagenesis model
The sediment diagenesis component used in this study isbuilt on previous work byHeinze et al.(1999) andGehlenet al. (2006) where the basic modelling concept is based onArcher et al.(1993). The spatial model domain is restrictedto the diagenetical zone of the sediments which is assumedhere to be the top 10 cm of the surface sediments. Any solidmaterial leaving this domain disappears into the subjacentdiagenetically consolidated zone. The interfaces of the 10model layers are defined at depths of 0, 0.3, 0.6, 1.1, 1.6, 2.1,3.1, 4.1, 5.1, 7.55, and 10.0 cm. The fraction of pore watervolume (porosity) decreases from 0.95 to 0.75, following ob-servations fromUllman and Aller(1982). Model geometryremains fixed during integration.
The vertical movement of solid material in the sedi-ment column is calculated on the basis of the equilibrium:burial = rain redissolution. When the particulate rain ontothe sediment is larger than the redissolution of solid mate-rial within the diagenetical zone, the entire column is shifteddownwards and sediment burial occurs. Conversely, when-ever redissolution is larger than rain, gaps of solid materialare produced within the model geometry. These are filledwith clay from below. Lateral movements in the sedimentsare not considered.
Modeled tracers are the four solid components (CaCO3,opal, POM and clay) and the six pore water substances (DIC,total alkalinity, phosphate, nitrate, oxygen and silicic acid).CaCO3 is only considered in the form of calcite. The lessstable aragonite form is assumed to be only of secondary im-portance for the global sediments (Berner and Honjo, 1981).
www.clim-past.net/7/771/2011/ Clim. Past, 7, 771–800, 2011

794 T. Tschumi et al.: Deep ocean ventilation, carbon isotopes, marine sedimentation and the deglacial CO2 rise
Table A1. Parameters for the sediment component of the Bern3D+C model along with standard values and references.
Symbol Parameter Value Reference
Number of time steps per year 48 this studyρ Density of solid sediment components 2.6 g cm−3 Heinze et al.(1999)MPOM Molar weight of POM 32.74 g mol−1 Heinze et al.(1999)MCaCO3 Molar weight of CaCO3 100.0 g mol−1 Heinze et al.(1999)Mopal Molar weight of opal 67.2 g mol−1 Heinze et al.(1999)Mclay Molar weight of clay 430.51 g mol−1 Heinze et al.(1999)
Terrestrial clay flux 1 g m−2 yr−1 Heinze et al.(1999)
rCaCO3 Rate constant for CaCO3 redissolution 1000 l mol−1 yr−1 Heinze et al.(1999)ropal Rate constant for opal redissolution 20 l mol−1 yr−1 this studyroxy Rate constant for oxydation 50 l mol−1 yr−1 Heinze et al.(1999)rdenit Rate constant for denitrification 50 l mol−1 yr−1 Gehlen et al.(2006)[Si]sat Saturation concentration 800 µmol l−1 Heinze et al.(2003)
for pore water silicic acid
D Pore water diffusion coefficient 8.× 10−6 cm2 s−1 Heinze et al.(1999)DB Bioturbation diffusion coefficient 15.× 10−3 cm2 yr−1 Heinze et al.(1999)[O2]crit Critical oxygen concentration 1 µmol l−1 Gehlen et al.(2006)
for denitrification
RPO4 Redfield coefficient for phosphate 1 Anderson and Sarmiento(1994)RO2 Redfield coefficient for oxygen 170 Anderson and Sarmiento(1994)R−
NO3Redfield coefficient for nitrate 16 Anderson and Sarmiento(1994)
RC Redfield coefficient for carbon 117 Anderson and Sarmiento(1994)Rdenit Redfield coefficient for denitrification 97.6 Gehlen et al.(2006)
All the solid components are taken to have equal densities(ρ = 2.6 g cm−3).
Considered processes occurring during sediment diagene-sis are the dissolution of opal and CaCO3 as well as the oxy-dation and denitrification of POM. The mixing of sedimentsby burrowing animals such as clams and worms (bioturba-tion) is parametrized as a diffusion of solid components withclosed boundaries at the sediment-water interface and at thebottom of the bioturbated zone.
The mathematical formulation of the sediment model con-sists of two sets of dynamical equations, one for the foursolid components and one for the six pore water substances,along with adequate boundary conditions. The two sets ofequations are coupled to each other through the four reactionrates of the sediment-pore water processes (redissolution /remineralization). All of these reactions follow first orderkinetics with spatially uniform reaction rate constants. Themodel parameters of the sediment component are listed inTable A1 along with their standard values and references.
A1 Redissolution/remineralization
The rate of opal dissolutionRopal [mol Si m−3 yr−1] is pro-portional to the amount of opal in the sediment,copal,the pore water undersaturation with respect to silicic acid,([Sisat]−[Si]), and the rate constant,ropal:
Ropal = ropal · copal · 8 · (1 − 8) ·ρ
Mopal(A1)
· ([Sisat] − [i]) · H ([Si]sat − [Si]).
Mopalstands for the molar weight of opal,ρ for the density,8 for porosity andcopal corresponds to the weight-fraction ofopal sediments.H(x) is the Heaviside step function, prevent-ing spontaneous precipitation of solid opal in case of porewater supersaturation. The silicic acid saturation concentra-tion, [Si]sat, is a spatially constant model parameter set to800 µ mol−l .
Since [Ca2+] is fairly constant and has a relatively highbackground concentration, CaCO3 preservation is primar-ily governed by the concentration of carbonate ions inthe pore water. The rate of CaCO3 dissolution RCaCO3
[mol C m−3 yr−1] is thus linearly related to the pore waterundersaturation with respect to carbonate ions, ([CO3]sat−
[CO3]), the weight-fraction of CaCO3, cCaCO3, and the rateconstant,rCaCO3:
RCaCO3 = rCaCO3 · cCaCO3 · 8 · (1 − 8) ·ρ
MCaCO3
(A2)
× ([CO3]sat − [CO3]) · H ([CO3]sat − [CO3]),
[CO3]sat =
[Ca2+
]K ′
sp.
Clim. Past, 7, 771–800, 2011 www.clim-past.net/7/771/2011/

T. Tschumi et al.: Deep ocean ventilation, carbon isotopes, marine sedimentation and the deglacial CO2 rise 795
The solubility product of calciteK ′sp is calculated after
Mucci (1983) with a pressure dependence followingMillero(1995). The calcium ion concentration [Ca2+] is propor-tional to salinity.
The rate of organic matter oxydationRoxy [mol C m−3
yr−1] is limited by the availability of oxygen in the pore wa-ter, [O2], and by the amount of POC,cPOC, in the sediment:
Roxy = roxy · cPOC · 8 · (1 − 8) ·ρ
MPOC·RC
RO2
(A3)
· [O2] · H ([O2]).
The rate constant for oxydation,roxy, is set to 50 l mol−1
yr−1. RC andRO2 are the Redfield ratios for carbon andoxygen, respectively.
Organic matter denitrification only occurs in suboxic con-ditions, i.e. below a critical oxygen concentration in the porewater [O2]crit. The reaction rateRdenit [mol C m−3 yr−1] isproportional to the POC weight-fraction,cPOC, the availabil-ity of nitrate, [NO−
3 ], and the rate constantrdenit:
Rdenit = rdenit · cPOC · 8 · (1 − 8) ·ρ
MPOC·RC
Rdenit(A4)
·[NO−
3
]· H
([NO−
3
])· H ([O2]crit − [O2]).
Rdenit is the Redfield coefficient for denitrification. Thereaction rate,rdenit, is set to 50 l mol−1 yr−1.
Inert clay is not subject to redissolution in the sediments:
Rclay = 0. (A5)
A2 Solid components
The four solid sediment components are subject to biotur-bation, advection and remineralization/redissolution. Theysatisfy the following equations:
∂cCaCO3
∂t= DB
∂2
∂z2
(cCaCO3
)−
∂
∂z
(wcCaCO3
)(A6)
− RCaCO3 ·MCaCO3
ρ·
1
1 − 8,
∂copal
∂t= DB
∂2
∂z2
(copal
)−
∂
∂z
(wcopal
)− Ropal (A7)
·Mopal
ρ·
1
1 − 8,
∂cPOC
∂t= DB
∂2
∂z2 (cPOC) −∂
∂z(wcPOC) (A8)
−(Roxy + Rdenit
)·
MPOC
ρ·
1
1 − 8,
∂cclay
∂t= DB
∂2
∂z2
(cclay
)−
∂
∂z
(wcclay
). (A9)
cS corresponds to the dry weight fraction of CaCO3, opal,POC or clay. DB is the bioturbation coefficient,w is thevertical advection velocity andRx are the reaction rates.The variable porosities are taken into account when solvingEqs. (A6)–(A9).
Below the bioturbated zone, the sediment composition re-mains unchanged:
∂cS
∂z
∣∣∣∣z≥10cm
= 0, for each solid componentS. (A10)
At the sediment-water interface (z = 0 cm) the vertical ad-vection velocity is given by the sum of the volume rain rates,RainS · MS/ρ [cm3 cm−2 yr−1], divided by the solid sedi-ment fraction,(1−8(0)):
w(0) =1
1 − 8(0)
∑solid
components
RainS · MS/ρ. (A11)
Vertical advection velocities,w(z), decrease with depthdue to remineralization and redissolution as well as due toincreasing solid sediment fractions:
w(z) < w(0), for z > 0. (A12)
The velocityw(z) is given by the remaining volume fluxat depthz divided by the solid sediment fraction,(1−8(z)):
w(z) =1
1 − 8(z)
∑solid
components
RainS · MS/ρ (A13)
−
z∫z′=0
∑solid
components
RS(z′) · MS(z′)/ρ · dz′
.
The burial flux of the solid componentS at the base ofthe bioturbated zone (z = 10 cm),F burial
S [mol cm−2 yr−1], isgiven by:
F burialS = w(10) · cS(10) ·
ρ
MS· (1 − 8(10)). (A14)
In case total redissolution is larger than total rain in thesediment column, gaps of solid material are produced withinthe fixed model geometry. These are filled with clay in orderto ensure mass conservation:
copal + ccal + corg + cclay = 1. (A15)
A3 Pore water solutes
The concentrations of pore water solutes are subject to sed-iment remineralization and redissolution as well as to porewater diffusion. Here, the diffusion in a porous medium isrepresented by multiplying the uniform pore water diffusioncoefficientD by the porosity8. Experimentally derived dif-fusion coefficients do not deviate much from these values
www.clim-past.net/7/771/2011/ Clim. Past, 7, 771–800, 2011

796 T. Tschumi et al.: Deep ocean ventilation, carbon isotopes, marine sedimentation and the deglacial CO2 rise
(Ullman and Aller, 1982). The dynamical equations for thepore water solutes are:
∂Si
∂t=
∂
∂z
(8 D
∂Si
∂z
)+ Ropal/8, (A16)
∂O2
∂t=
∂
∂z
(8 D
∂O2
∂z
)−RO2
RC· Roxy/8, (A17)
∂NO−
3
∂t=
∂
∂z
(8 D
∂NO−
3
∂z
)+
RNO−
3
RC(A18)
· Roxy/8 −Rdenit
RC· Rdenit/8,
∂PO4
∂t=
∂
∂z
(8 D
∂PO4
∂z
)+RPO4
RC(A19)
·(Roxy + Rdenit
)/8,
∂DIC
∂t=
∂
∂z
(8 D
∂DIC
∂z
)(A20)
+(Rcalc + Roxy + Rdenit
)/8,
∂ALK
∂t=
∂
∂z
(8 D
∂ALK
∂z
)−
RNO−
3+ 2 · RPO4
RC(A21)
· Roxy/8 +Rdenit − 2 · RPO4
RC· Rdenit/8
+ 2 · Rcal/8.
The boundary condition for pore water solutes at theocean-sediment interface is:
C|z=0cm = Cbottom water, for each solute tracerC. (A22)
Below the bioturbated zone the solute concentrations areassumed to remain constant:∂C
∂z
∣∣∣∣z≥10cm
= 0, for each solute tracerC. (A23)
The pH-equilibrium in the pore water is given by:
[CO2][CO=
3
][HCO−
3
]2 =K ′
1
K ′
2. (A24)
The apparent dissociation constantsK ′
1 and K ′
2 are calcu-lated afterMehrbach et al.(1973) with pressure dependencefollowing Millero (1995).
Acknowledgements.This study received support by the SwissNational Science Foundation, by the Swiss Staatssekretariat furBildung und Forschung (#C07.0068; COST Action 735), and bythe European Commission through the FP7 projects Past4Future(grant no. 243908), CARBOCHANGE (grant no. 264879), andEPOCA (grant no. 211384). This is publication no. A 343 ofthe Bjerknes Centre for Climate Research. The comments byT. F. Stocker are greatly appreciated.
Edited by: J. Singarayer
References
Adkins, J., McIntyre, K., and Schrag, D.: The salinity, temperatureandδ18O content of the glacial deep ocean, Science, 298, 1769–1773, 2002.
Anderson, L. and Sarmiento, J.: Redfield ratios of remineralizationdetermined by nutrient data analysis, Global Biogeochem. Cy.,8, 65–80, 1994.
Anderson, R., Ali, S., Bradtmiller, L., Nielsen, S., Fleisher, M.,Anderson, B., and Burckle, L.: Wind-Driven Upwelling in theGlacial Southern Ocean and the Deglacial Rise in AtmosphericCO2, Science, 323, 1443–1448, 2009.
Archer, D. and Maier-Reimer, E.: Effect of deep-sea sedimentarycalcite preservation on atmospheric CO2 concentration, Nature,367, 292–294, 1994.
Archer, D., Lyle, M., Rodgers, K., and Froelich, P.: What Con-trols Opal Preservation in Tropical Deep Sea Sediments?, Paleo-ceanography, 8, 7–21, 1993.
Archer, D., Peltzer, E., and Kirchman, D.: A timescale for dissolvedorganic carbon production in equatorial Pacific surface waters,Global Biogeochem. Cy., 11, 435–452, 1997.
Archer, D., Winguth, A., Lea, D., and Mahowald, N.: What causedthe glacial/interglacial atmosphericpCO2 cycles?, Rev. Geo-phys., 38, 159–189, 2000a.
Archer, D., Eshel, G., Winguth, A., Broecker, W., Pierrehumbert,R., Tobis, M., and Jacob, R.: AtmosphericpCO2 sensitivity tothe biological pump of the cean, Global Biogeochem. Cy., 14,1219–1230, 2000b.
Aumont, O. and Bopp, L.: Globalizing results from ocean in situiron fertilization studies, Global Biogeochem. Cy., 20, GB2017,doi:10.1029/2005GB002591, 2006.
Beck, J., Warren, J., Richards, D., Edwards, R., Smart, B. S. P.,Donahue, D., Hererra-Osterheld, S., Burr, G., Calsoyas, L., Jull,A., and Biddulph, D.: Extremely Large Variations of Atmo-spheric14C Concentration During the Last Glacial Period, Sci-ence, 292, 2453–2458,doi:10.1126/science.1056649, 2001.
Berger, W. and Keir, R.: Glacial-Holocene Changes in atmosphericCO2 and the deep-sea record, in: Climate Processes and ClimateSensitivity, edited by: Hansen, J. E. and Takahashi, T., 303–317,1984.
Berner, R. and Honjo, S.: Pelagic Sedimentation of Arago-nite: Its Geochemical Significance, Science, 211, 940–942,doi:10.1126/science.211.4485.940, 1981.
Bird, M., Lloyd, J., and Farquhar, G.: Terrestrial carbon storage atthe LGM, Nature, 371, 566,doi:10.1038/371566a0, 1994.
Boning, C., Dispert, A., Visbeck, M., Rintoul, S., and Schwarzkopf,F.: The response of the Antarctic Circumpolar Current to recentclimate change, Nat. Geosci., 1, 864–869, 2008.
Boyle, E.: Vertical oceanic nutrient fractionation andglacial/interglacial CO2 cycles, Nature, 331, 55–56, 1988.
Bradtmiller, L., Anderson, R., Sachs, J., and Fleisher, M.: A deeperrespired carbon pool in the glacial equatorial Pacific Ocean,Earth Planet. Sc. Lett., 299, 417–425, 2010.
Broecker, W.: Ocean chemistry during glacial time, Geochim. Cos-mochim. Acta, 46, 1689–1706, 1982.
Broecker, W. and Barker, S.: A 190 ‰ drop in atmosphere’s114Cduring the “Mystery Interval” (17.5 to 14.5 kyr), Earth Planet.Sc. Lett., 256, 90–99, 2007.
Clim. Past, 7, 771–800, 2011 www.clim-past.net/7/771/2011/

T. Tschumi et al.: Deep ocean ventilation, carbon isotopes, marine sedimentation and the deglacial CO2 rise 797
Broecker, W. and Peng, T.: The role of CaCO3 compensation inthe glacial to interglacial atmospheric CO2 change, Global Bio-geochem. Cy., 1, 15–29, 1987.
Broecker, W. and Peng, T.-H.: Tracers in the Sea, Eldigo, Palisades,N. Y., 1982.
Broecker, W., Lynch-Stieglitz, J., Clark, E., Hajdas, I., and Bonani,G.: What caused the atmosphere’s CO2 content to rise during thelast 8000 years?, Geochem. Geophy. Geosys., 2(10), 1062–1074,doi:10.1029/2001GC000177, 2001.
Broecker, W., Clark, E., Barker, S., Hajdas, I., Bonani, G.,and Moreno, E.: Radiocarbon age of late glacial deep wa-ter from the equatorial Pacific, Paleoceanography, 22, PA2206,doi:10.1029/2006PA001359, 2007.
Brovkin, V., Ganopolski, A., Archer, D., and Rahmstorf, S.: Lower-ing of glacial atmospheric CO2 in response to changes in oceancirculation and marine biogeochemistry, Paleoceanography, 22,PA4202,doi:10.1029/2006PA001380, 2007.
Chikamoto, M., Matsumoto, K., and Ridgewell, A.: Responseof deep-sea CaCO3 sedimentation to Atlantic meridional over-turning circulation shutdown, J. Geophys. Res., 113, G03017,doi:10.1029/2007JG000669, 2008.
Chikamoto, M., Matsumoto, K., and Yamananka, Y.: Influence ofExport Rain Ratio Changes in Atmospheric CO2 and Sedimen-tary Calcite Preservation, J. Oceanogr., 65, 209–221, 2009.
Crusius, J., Pedersen, T., Kienast, S., and Keigwin, L.: Influenceof northwest Pacific productivity on North Pacific IntermediateWater oxygen concentrations during the Bolling-Allerod interval(14.7–12.9 ka), Geology, 32, 633–636, 2004.
Curry, W., Labeyrie, J. D. L., and Shackleton, N.: Changes in theDistribution of δ13C of Deep Water
∑CO2 Between the Last
Glaciation and the Holocene, Paleoceanography, 3, 317–341,1988.
De La Rocha, C.: Opal-based isotopic proxies of paleoenvi-ronmental conditions, Global Biogeochem. Cy., 20, GB4S09,doi:10.1029/2005GB002664, 2006.
Deutsch, C., Sigman, D., Thunell, R., Meckler, A., and Haug,G.: Isotopic constraints on glacial/interglacial changes in theoceanic nitrogen budget, Global Biogeochem. Cy., 18, GB4012,doi:10.1029/2003GB002189, 2004.
Doney, S., Glover, D., and Najjar, R.: A new coupled, one-dimensional biological-physical model for the upper ocean: Ap-plications to the JGOFS Bermuda Atlantic Time-series Study(BA TS) site, Deep-Sea Res. Pt. II, 43, 591–624, 1996.
Duplessy, J. C., Shackleton, N. J., Fairbanks, R. G., Labeyrie, L.,Oppo, D., and Kallel, N.: Deepwater source variations duringthe last climatic cycle and their impact on the global deepwatercirculation, Paleoceanography, 3, 343–360, 1988.
Edwards, N. R. and Marsh, R.: Uncertainties due to transport-parameter sensitivity in an efficient 3-d ocean-climate model,Clim. Dynam., 3, 67–94, 2005.
Edwards, N. R., Willmott, A. J., and Killworth, P. D.: On the role oftopography and wind stress on the stability of the thermohalinecirculation, J. Phys. Oceanogr., 28, 756–778, 1998.
Elsig, J.: New insights into the global carbon cycle from measure-ments of CO2 stable isotopes: methodological improvements andinterpretation of a new EPICA Dome C ice coreδ13C record,Ph.D. thesis, Climate and Environmental Physics, Physics Insti-tute, University of Bern, 2009.
Elsig, J., Schmitt, J., Leuenberger, D., Schneider, R., Eyer, M.,Leuenberger, M., Joos, F., Fischer, H., and Stocker, T.: Stableisotope constraints on Holocene carbon cycle changes from anAntarctic ice core, Nature, 461, 507–510, 2009.
Falkowski, P.: Evolution of the nitrogen cycle and its influence onthe biological sequestration of CO2 in the ocean, Nature, 387,272–275, 1997.
Feely, R., Sabine, C., Lee, K., Berelson, W., Kleypas, J.,Fabry, V., and Millero, F.: Impact of Anthropogenic CO2 onthe CaCO3 System in the Oceans, Science, 305, 362–366,doi:10.1126/science.1097329, 2004.
Fischer, H., Schmitt, J., Luthi, D., Stocker, T., Tschumi, T., Parekh,P., Joos, F., Kohler, P., Volker, C., Gersonde, R., Barbante,C., Floch, M. L., Raynaud, D., Barnola, J.-M., and Wolff, E.:The role of Southern Ocean processes on orbital and millennialCO2 variations – a synthesis, Quaternary Sci. Rev., 29, 193–205,2010.
Francois, R., Altabet, M., Yu, E., Sigman, D., Bacon, M., Frank, M.,Bohrmann, G., Bareille, G., and Labeyrie, L.: Contribution ofSouthern Ocean surface-water stratification to low atmosphericCO2 concentrations during the last glacial period, Nature, 389,929–935, 1997.
Freeman, K. H. and Hayes, J. M.: Fractionation of carbon isotopesby phytoplankton and estimates of ancient CO2 levels, GlobalBiogeochem. Cy., 6, 185–198, 1992.
Galbraith, E., Jaccard, S., Pedersen, T., Sigman, D., Haug, G.,Cook, M., Southon, J., and Francois, R.: Carbon dioxide releasefrom the North Pacific abyss during the last deglaciation, Nature,449, 890–893, 2007.
Gehlen, M., Bopp, L., Emprin, N., Aumont, O., Heinze, C., andRagueneau, O.: Reconciling surface ocean productivity, exportfluxes and sediment composition in a global biogeochemicalocean model, Biogeosciences, 3, 521–537,doi:10.5194/bg-3-521-2006, 2006.
Heinze, C., Maier-Reimer, E., and Winn, K.: GlacialpCO2 Re-duction by the World Ocean: Experiments With the HamburgCarbon Cycle Model, Paleoceanography, 6, 393–430, 1991.
Heinze, C., Maier-Reimer, E., Winguth, A., and Archer, D.: Aglobal oceanic sediment model for long-term climate studies,Global Biogeochem. Cy., 13, 221–250, 1999.
Heinze, C., Hupe, A., Maier-Reimer, E., Dittert, N., and Rague-neau, O.: Sensitivity of the marine biospheric Si cycle for bio-geochemical parameter variations, Global Biogeochem. Cy., 17,1086,doi:10.1029/2002GB001943, 2003.
Hodell, D., Venz, K., Charles, C., and Ninnemann, U.: Pleistocenevertical carbon isotope and carbonate gradients in the South At-lantic sector of the Southern Ocean, Geochem., Geophy., Geosy.,4(1), 1004,doi:10.1029/2002GC000367, 2003.
Hughen, K. S., Lehman, J. S., Overpeck, J., Marchal, O., Her-ring, C., and Turnbull, J.:14C Activity and Global Carbon Cy-cle Changes over the Past 50’000 Years, Science, 303, 202–207,2004.
Ito, T. and Follows, M.: Preformed phosphate, soft tissuepump and atmospheric CO2, J. Mar. Res., 63(4), 813-839,doi:10.1357/0022240054663231, 2005.
Jaccard, S., Haug, G., Sigman, D., Pedersen, T., Thierstein, H., andRohl, U.: Glacial/Interglacial Changes in Subarctic North PacificStratification, Science, 308, 1003–1006, 2005.
www.clim-past.net/7/771/2011/ Clim. Past, 7, 771–800, 2011

798 T. Tschumi et al.: Deep ocean ventilation, carbon isotopes, marine sedimentation and the deglacial CO2 rise
Jaccard, S., Galbraith, E., Sigman, D., Haug, G., Francois, R., Ped-ersen, T., Dulski, P., and Thierstein, H.: Subarctic Pacific evi-dence for a glacial deepening of the oceanic respired carbon pool,Earth Planet. Sc. Lett., 277, 156–165, 2009.
Jin, X., Gruber, N., Dunne, J., Sarmiento, J., and Armstrong, R.: Di-agnosing the contribution of phytoplankton functional groups tothe production and export of particulate organic carbon, CaCO3,and opal from global nutrient and alkalinity distributions, GlobalBiogeochem. Cy., 20, GB2015,doi:10.1029/2005GB002532,2006.
Joos, F., Gerber, S., Prentice, I., Otto-Bliesner, B., and Valdes, P.:Transient simulations of Holocene atmospheric carbon dioxideand terrestrial carbon since the Last Glacial Maximum, GlobalBiogeochem. Cy., 18, GB2002,doi:10.1029/2003GB002156,2004.
Kalnay, E., Kanamitsu, M., Kistler, R., Collins, W., Deaven, D.,Gandin, L., Iredell, M., Saha, S., White, G., Woollen, J., Zhu, Y.,Leetmaa, A., Reynolds, R., Chelliah, M., Ebisuzaki, W., Higgins,W., Janowiak, J., Mo, K. C., Ropelewski, C., Wang, J., Jenne, R.,and Joseph, D.: The NCEP/NCAR 40-Year Reanalysis Project,B. Am. Meteorol. Soc., 77(3), 437–471, 1996.
Keigwin, L.: Glacial-Age Hydrography of the Far Northwest Pa-cific Ocean, Paleoceanography, 13, 323–339, 1998.
Keigwin, L. and Schlegel, M.: Ocean ventilation and sedi-mentation since the glacial maximum at 3 km in the west-ern North Atlantic, Geochem. Geophy. Geosy., 3(6), 1034,doi:10.1029/2001GC000283, 2002.
Knox, F. and McElroy, M.: Changes in atmospheric CO2 – Influ-ence of the marine biota at high-latitude, J. Geophys. Res., 89,4629–4637, 1984.
Kohfeld, K. E., Le Quere, C., Harrison, S. P., and Anderson, R.F.: Role of marine biology in glacial-interglacial CO2 cycles,Science, 308, 74–78, 2005.
Kohler, P., Fischer, H., Munhoven, G., and Zeebe, R.: Quantita-tive interpretation of atmospheric carbon records over the lastglacial termination, Global Biogeochem. Cy., 19(4), GB4020,doi:10.1029/2004GB002345, 2005.
Kohler, P., Fischer, H., Schmitt, J., and Munhoven, G.: On the ap-plication and interpretation of Keeling plots in paleo climate re-search - decipheringδ13C of atmospheric CO2 measured in icecores, Biogeosciences, 3, 539–556,doi:10.5194/bg-3-539-2006,2006a.
Kohler, P., Muscheler, R., and Fischer, H.: A model-based inter-pretation of low-frequency changes in the carbon cycle duringthe last 120,000 years and its implications for the reconstructionof atmospheric114C, Geochem., Geophy., Geosy., 7, Q11N06,doi:10.1029/2005GC001228, 2006b.
Kwon, E., Primeau, F., and Sarmiento, J.: The impact of reminer-alization depth on the air-sea carbon balance, Nat. Geosci., 2,630–635, 2009.
Leuenberger, M., Siegenthalter, U., and Langway, C.: Carbon Iso-tope Composition of Atmospheric CO2 during the Last Ice-Agefrom an Antarctic Ice Core, Nature, 357, 488–490, 1992.
Levitus, S. and Boyer, T.: World Ocean Atlas 1994 Volume 4: Tem-perature, NOAA Atlas NESDIS, US Department of Commerce,Washington, DC, 117 pp., 1994.
Levitus, S., Burgett, R., and Boyer, T.: World Ocean Atlas 1994Volume 3: Salinity, NOAA Atlas NESDIS, US Department ofCommerce, Washington, DC, 99 pp., 1994.
Lourantou, A., Lavric, J., Kohler, P., Barnola, J.-M., Paillard, D.,Michel, E., Raynaud, D., and Chappellaz, J.: Constraint of theCO2 rise by new atmospheric carbon isotopic measurementsduring the last deglaciation, Global Biogeochem. Cy., 24(2),GB2015,doi:10.1029/2009GB003545, 2010.
Luthi, D., Floch, M. L., Bereiter, B., Blunier, T., Barnola, J.-M.,Siegenthaler, U., Raynaud, D., Jouzel, J., Fischer, H., Kawamura,K., and Stocker, T.: High-resolution carbon dioxide concentra-tion record 650,000–800,000 years before present, Nature, 453,379–382, 2008.
Maier-Reimer, E., Kriest, I., Segschneider, J., and Wetzel, P.: TheHAMburg Ocean Carbon Cycle Model HAMOCC5.1 – Techni-cal Description Release 1.1, Tech. rep., Max Planck Institue forMeteorology, Hamburg, Germany, 2005.
Marchitto, T., Lynch-Stieglitz, J., and Hemming, S.: Deep PacificCaCO3 compensation and glacial-interglacial atmospheric CO2,Earth Planet. Sc. Lett., 231, 317–336, 2005.
Marchitto, T., Lehman, S., Ortiz, J., Fluckiger, J., and van Geen,A.: Marine radiocarbon evidence for the mechanism of deglacialatmospheric CO2 rise, Science, 316, 1456–1459, 2007.
Margalef, R.: Life-forms of phytoplankton as survival alternativesin an unstable environment, Oceanol. Acta, 1, 493–509, 1978.
Marinov, I., Gnanadesikan, A., Sarmiento, J. L., Toggweiler,J. R., Follows, M., and Mignone, B. K.: Impact of oceaniccirculation on biological carbon storage in the ocean and at-mosphericpCO2, Global Biogeochem. Cy. 22(3), GB3007,doi:10.1029/2007GB002958, 2008.
Martin, J.: Glacial-Interglacial CO2 change: The iron hypothesis,Paleoceanography, 5, 1–13, 1990.
Martin, J. and Fitzwater, S.: Iron deficiency limits phytoplanktongrowth in the north-east Pacific subarctic, Nature, 331, 341–343,1988.
Matsumoto, K., Sarmiento, J., and Brzezinski, M.: Silicic acid leak-age from the Southern Ocean: a possible explanation for glacialatmosphericpCO2, Global Biogeochem. Cy., 16(3), 1031–1054,doi:10.1029/2001GB001442, 2002.
Matsumoto, K., Hashioka, T., and Yamananka, Y.: Ef-fect of temperature-dependent organic carbon decay onatmospheric pCO2, J. Geophys. Res., 112, G02007,doi:10.1029/2006JG000187, 2007.
McCorkle, D., Heggie, D., and Veeh, H.: Glacial and HoloceneStable Isotope Distributions in the Southeastern Indian Ocean,Paleoceanography, 13, 20–34, 1998.
McManus, J., Francois, R., Gherardi, J.-M., Keigwin, L., andBrown-Leger, S.: Collapse and rapid resumption of Atlanticmeridional circulation linked to deglacial climate changes, Na-ture, 428, 834–837, 2004.
Mehrbach, C., Culberson, C., Hawley, J., and Pytkowicz, R.: Mea-surement of the apparent dissociation constant of carbonic acid inseawater at atmospheric pressure, Limnol. Oceanogr., 18, 897–907, 1973.
Menviel, L., Timmermann, A., Mouchet, A., and Timm, O.: Cli-mate and marine carbon cycle response to changes in the strengthof the southern hemispheric westerlies, Paleoceanography, 23(4),PA4201,doi:10.1029/2008PA001604, 2008.
Millero, F.: Thermodynamics of the carbon dioxide system in theoceans, Geochim. Cosmochim. Acta, 59, 661–677, 1995.
Clim. Past, 7, 771–800, 2011 www.clim-past.net/7/771/2011/

T. Tschumi et al.: Deep ocean ventilation, carbon isotopes, marine sedimentation and the deglacial CO2 rise 799
Millimann, J. and Droxler, A.: Neritic and pelagic carbonate sed-imentation in the marine environment: ignorance is not bliss,Geol. Rundsch., 85, 496–504, 1996.
Monnin, E., Indermuhle, A., Dallenbach, A., Fluckiger, J., Stauffer,B., Stocker, T., Raynaud, D., and Barnola, J.: Atmospheric CO2concentrations over the Last Glacial Termination, Science, 291,112–114, 2001.
Mook, W. G.:13C in atmospheric CO2, Neth. J. Sea Res., 20, 211–223, 1988.
Mucci, A.: The solubility of calcite and aragonite in seawater at var-ious salinities, temperatures, and on atmosphere total pressure,Am. J. Sci., 283, 780–799, 1983.
Muller, S., Joos, F., Edwards, N., and Stocker, T.: Water massdistribution and ventilation time scales in a cost-efficient, three-dimensional ocean model, J. Climate, 19, 5479–5499, 2006.
Muscheler, R., Beer, J., Wagner, G., Laj, C., Kissel, C., Raisbeck,G., Yiou, F., and Kubik, P.: Changes in the carbon cycle duringthe last deglaciation as indicated by the comparison of10Be and14C records, Earth Planet. Sc. Lett., 238, 325–340, 2004.
Najjar, R. G., Orr, J., Sabine, C. L., and Joos, F.: Biotic-HOWTO,Internal OCMIP Report, Tech. rep., LSCE/CEA Saclay, Gif-sur-Yvette, France, 15 pp., 1999.
Ninnemann, U. and Charles, C.: Changes in the mode of South-ern Ocean circulation over the last glacial cycle revealed byforaminiferal stable isotopic variability, Earth Planet. Sc. Lett.,201, 383–396, 2002.
Orr, J., Najjar, R. G., Sabine, C. L., and Joos, F.: Abiotic-HOWTO,Internal OCMIP Report, Tech. rep., LSCE/CEA Saclay, Gif-sur-Yvette, France, 25 pp., 1999.
Paillard, D. and Parennin, F.: The Antarctic ice sheet and the trig-gering of deglaciations, Earth Planet. Sc. Lett., 227, 263–271,2004.
Parekh, P., Joos, F., and Muller, S.: A modeling assess-ment of the interplay between aeolian iron fluxes and iron-binding ligands in controlling carbon dioxide fluctuations dur-ing Antarctic warm events, Paleoceanography, 23(4), PA4202,doi:10.1029/2007PA001531, 2008.
Peacock, S., Lane, E., and Restrepo, J.: A possible sequenceof events for the generalized glacial-interglacial cycle, GlobalBiogeochem. Cy., 20(2), GB2010,doi:10.1029/2005GB002448,2006.
Primeau, F.: Characterizing Transport between the Surface MixedLayer and the Ocean Interior with a Forward and Adjoint GlobalOcean Transport Model, J. Phys. Oceanogr., 35, 545–564, 2005.
Ridgwell, A., Watson, A., and Archer, D.: Modeling the responseof the oceanic Si inventory to perturbation, and consequences foratmospheric CO2, Global Biogeochem. Cy., 16(4), 1071–1097,doi:10.1029/2002GB001877, 2002.
Ridgwell, A., Watson, A., Maslin, M., and Kaplan, J.: Impli-cations of coral reef buildup for the controls on atmosphericCO2 since the Last Glacial Maximum, Paleoceanography, 18(4),1083–1093,doi:10.1029/2003PA000893, 2003.
Sarmiento, J. and Gruber, N.: Ocean biogeochemical dynamics,chap, Chapter 8: Carbon Cycle, Princeton University Press, 318–358, 2006.
Sarmiento, J. and Toggweiler, J.: A new model for the role of theoceans in determining atmosphericpCO2, Nature, 308, 621–624, 1984.
Schmittner, A. and Galbraith, E.: Glacial greenhouse-gas fluctua-tions controlled by ocean circulation changes, Nature, 456, 373–376, 2008.
Schmittner, A., Brooke, E., and Ahn, J.: Ocean Circulation: Mech-anisms and Impacts, vol. 173, chap. Impact of the ocean’soverturning circulation on atmospheric CO2, AGU GeophysicalMonograph Series, 209–246, 2007.
Severinghaus, J. and Brook, E.: Abrupt Climate Change at the Endof the Last Glacial Period Inferred from Trapped Air in Polar Ice,Science, 286, 930–934, 1999.
Shackleton, N.: Carbon-13 in uvigerina: Tropical rainforest historyand the equatorial Pacific carbonate dissolution cycles, in: TheFate of Fossil Fuel CO2 in the Ocean, edited by: Andersen, N.and Malahoff, A., Plenum, New York, 401–428, 1977.
Siegenthaler, U. and Muennich, K. O.: Carbon-13/carbon-12fractionation during carbon dioxide transfer from air to sea,SCORE 16: Carbon Cycle Modelling, edited by: Bolin, B., Wi-ley, Chichester, 249–257, 1981.
Siegenthaler, U. and Oeschger, H.: Biospheric CO2 emissions dur-ing the past 200 years reconstructed by deconvolution of ice coredata, Tellus B, 39, 140–154, 1987.
Siegenthaler, U. and Wenk, T.: Rapid atmospheric CO2 variationsand ocean circulation, Nature, 308, 624–626, 1984.
Sigman, D. and Boyle, E.: Glacial/interglacial variations in atmo-spheric carbon dioxide, Nature, 407, 859–869, 2000.
Sigman, D., McCorkle, D., and Martin, W.: The calcite lysoclineas a constraint on glacial/interglacial low latitude productionchanges, Global Biogeochem. Cy., 12, 409–428, 1998.
Sigman, D., Jaccard, S., and Haug, G.: Polar ocean stratification ina cold climate, Nature, 428, 59–63, 2004.
Skinner, L., Fallon, S., Waelbroeck, C., Michel, E., and Barker, S.:Ventilation of the Deep Southern Ocean and Deglacial CO2 Rise,Science, 328, 1147–1151,doi:10.1126/science.1183627, 2010.
Smith, H., Fischer, H., Wahlen, M., Mastroianni, D., Beck, D., andBeck, B.: Dual modes of the carbon cycle since the Last GlacialMaximum, Nature, 400, 248–250, 1999.
Spence, P., Saenko, O., Eby, M., and Weaver, A.: The SouthernOcean Overturning: Parameterized versus Permitted Eddies, J.Phys. Oceanogr., 39, 1634–1651, 2009.
Spero, H. and Lea, D.: The Cause of Carbon Isotope MinimumEvents on Glacial Terminations, Science, 296, 522–525, 2002.
Stenni, B., Masson-Delmotte, V., Johnsen, S., Jouzel, J., Longinelli,A., Monnin, E., Rothlisberger, R., and Selmo, E.: An OceanicCold Reversal During the Last Deglaciation, Science, 293, 2074–2077,doi:10.1126/science.1059702, 2001.
Talley, L., Reid, J., and Robbins, P.: Data-based meridional over-turning streamfunctions for the global oceans, J. Climate, 16,3213–3226, 2003.
Toggweiler, J. R., Russell, J., and Carson, S.: Midlatitude west-erlies, atmospheric CO2, and climate change during ice ages,Paleoceanography, 21(2), PA2005,doi:10.1029/2005PA001154,2006.
Treguer, P., Nelson, D., DeMaster, A., Leynart, A., and Queguiner,B.: The silica balance in the world ocean: A reestimate, Science,268, 375–379, 1995.
Tschumi, T.: Modeling the ocean’s contribution to past and futurechanges in the global carbon cycle, Ph.D. thesis, Climate and En-vironmental Physics, Physics Institute, University of Bern, 2009.
www.clim-past.net/7/771/2011/ Clim. Past, 7, 771–800, 2011

800 T. Tschumi et al.: Deep ocean ventilation, carbon isotopes, marine sedimentation and the deglacial CO2 rise
Tschumi, T., Joos, F., and Parekh, P.: How important areSouthern Hemisphere wind changes for low glacial carbondioxide? A model study, Paleoceanography, 23(4), PA4208,doi:10.1029/2008PA001592, 2008.
Ullman, W. and Aller, R.: Diffusion coefficients in nearshore ma-rine environments, Limnol. Oceanogr., 27, 552–556, 1982.
Volk, T. and Hoffert, M.: Ocean carbon pumps: Analysis of rela-tive strengths and efficiencies in ocean driven atmosphericpCO2changes, vol. 32 of Geophys. Monogr. Ser., edited by: Sundquist,E. T. and Broecker, W. S., AGU, Washington, DC, 99–110, 1985.
Wallmann, K.: Phosphorous imbalance in the global ocean?, GlobalBiogeochem. Cy., 24(4), GB4030,doi:10.1029/2009GB003643,2010.
Watson, A. and Naveira-Garabato, A.: The role of Southern Oceanmixing and upwelling in glacial-interglacial atmospheric CO2change, Tellus B, 58(15), 73–87, 2006.
Zeng, N.: Glacial-Interglacial Atmospheric CO2 Change – TheGlacial Burial Hypothesis, Adv. Atmos. Sci., 20, 677–693, 2003.
Clim. Past, 7, 771–800, 2011 www.clim-past.net/7/771/2011/