deep bed drying of malt - newcastle university b.k... · with commercial kiln data. ... 4.2...
TRANSCRIPT

DEEP BED DRYING OF MALT
by ACCESSION No.
r!EWC/SfLE U;:O:'J TY:~E-IUNIVeRSITY U2r\MY ,
I
3 ... j8 -j113311----.--,
6I LASH KANT I BALA'B.Se. (EnggL (Electrical) (SUET)
M. Eng. J (A 9ric. Sy stems Eng g) (A IT)
LOCATIOi'J
'{/J .Si".
VOLUME 1
A th e si s su bmitted f or the degree
of Doctor of Phi losophy
in the
Uni versi ty of Newcast le upon Tyne
o (to ber, 1 983

TO SHREMAT PANCHANAN GOSWAMI

1
ACKNOWLEDGEMENTS
This work was carried out under the supervision of
Dr. J.L. Woods, and the author is indebted to him for his constant
encouragement, advice and criticism.
Acknowledgement is made to Professor J.R. O'Callaghan
for his encouragement, help and advice, and for the use of the
laboratory facilities.
Grateful acknowledgement is also due to the Commonwealth
Scholarship Commission for providing a scholarship to study at
the University of Newcastle upon Tyne.
The author wishes to acknowledge the assistance of
Mr. C. Croydon, Mr. T. Highland, Mr. B. Higgs, Mr. P. Kidger and
Dr. J. Chapman of Pauls and Sanders, Ltd., Grantham, for arranglng
to send the experimental malt samples and especially Dr. J. Chapman
for his advice and help.
The author owes to his wife and son for enduring much
neglect, and for their encouragement and moral support.
Thanks are also due to Mr. J. Taylor and Mr. J. Jenkyns
for their help in the construction of the apparatus.
Finally, my thanks to Mrs. I. Mills, for her careful
typing of the manuscript.
ABSTRACT
During the production of malt, germinated barley is dried
from 70 - 85% to 2.4 - 4% moisture content (d.b.) requiring high
energy and a long drying process. This study is concerned with
developing a mathematical simulation model for deep bed drying of
malt to provide design data and data on temperature and moisture
content histories at different depth of the bed for use by the design
engineers and maltsters for minimizing energy consumption andimproving quality. In order to do this certain physical and thermalproperties were also determined.
The properties of physical dimensions, 1000 grain weight,
bulk density and dry bulk density were determined experimentally
and each of these properties except bulk density was found to be
linearly dependent on moisture content. Specific heat was also
determined experimentally and also found to be linearly dependent
on moisture content. The ratio of latent heat of malt to latent
heat of free water was determined from existing experimental data
on equilibrium moisture content and found to be a function of moisture
content. Shrinkage of the mal t bed was de termined experimentally
and found to be a non-linear function of moisture content reduction.
The heat transfer coefficient of the malt bed was also determined
experimentally and found to be a function of air flow rate.
The thin layer drying experiments were conducted under
controlled conditions of the drying air using an automatic continuousweighing system. Numerical procedures were developed to fit the

experimental data to the single exponential equation, the Page
equation and the double exponential equation. The drying constant
was expressed as a function of the drying air temperature and the
dynamic equilibrium moisture content was expressed as a function
of drying air temperature and relative humidity.
Two mathematical models, model 1 similar to Newcastle
University model and model 2 similar to the Michigan State University
model were programmed in FORTRAN to predict temperature and moisture
content changes with time and position. Shrinkage and variable
dry bulk density effects and a simple comprehensive condensation
procedure were incorporated in both models. The set of partial
differential equations for model 2 was solved by an exponential
approximation and using central difference values updated by an iteration.
Five deep bed experiments were conducted in the laboratory
and the suspended thermocouple technique for the measurement of
temperature was found quite satisfactory. Both models agreed well
with the experimental data. Reasonable agreement was also obtained
with commercial kiln data. Practically there is no difference between
the predictions of the two models and model 1 takes less computing time.
A short section 1S included to illustrate the use of the programme for
simulation. Typical commercial conditions are used and the effect
of gas fired,Urlirect fired and recirculating gas fired conditions isexamined.

~vCONTENTS
VOLUME 1 - TEXT
ACKNOWLEDGEMENTS ~
ABSTRACT ii
CONTENTS ivKEY TO SYMBOLS v~~~1. INTRODUCTION 12. PHYSICAL AND THERMAL PROPERTIES OF MALT 5
2.1 Physical Dimensions of Malt 52.1. L Method 52.1.2 Results and Discussion 6
2.2 1000 Grain Weight 7
2.2.1 Method 82.2.2 Results and Discussion 8
.2.3 Bulk Density of Malt 82.3.1 Method 9
2.3.2 Results and Discussion 102.4 Specific Heat of Malt 11
2.4.1 Method 142.4.2 Results and Discussion 16
2.5 Latent Heat of Vaporization of Malt 182.5.1 Theory 202.5.2 Data Analysis 222.5.3 Results and Discussion 22
2.6 Shrinkage of the Malt Bed 232.6.1 Theory 252.6.2 Method 262.6.3 Results and Discussion 27

v
2.7 Heat Transfer Coefficient of Malt
2.7.1 Method
2.7.2 Results and Discussion
28
38
44
47
47
53
56
57
58
63
64
64
65
67
68
71
71
73
74
76
79
84
84
89
90
90
91
3. THIN LAYER DRYING OF MALT
3.1 Thin Layer Drying Equations
3.1. 1 Theory
3.2 Drying Parameters
3.2.1 Drying Constant
3.2.2 Equilibrium Moisture Content3.3 Thin Layer Drying Apparatus
3.3.1 Moisturising Column
3.3.2 Drying Chamber
3.3.3 Instrumentation and Accuracy3.4 .Procedure
3.5 Data Processing
3.6 Data Analysis
3.6.1 Curve Fitting
3.7 Results and Discussion
3.7.1 Thin Layer Drying Equations
3.7.2 Drying Constant
3.7.3 Dynamic Equilibrium Moisture Content
4. SIMULATION OF DEEP BED DRYING
4.1 A Review of the Literature
4.2 Development of Models for Deep Bed Drying of Malt
4.3 Heat and Mass Transfer Equations for Modell
4.3.1 Mass Balance Equation
4.3.2 Drying Rate Equation

V~
4.3.3 Heat Balance Equation 92
4.3.4 Heat Transfer Rate Equation 92
4.3.5 Method of Solution 94
4.3.6. Condensation Procedure 95
4.3.7 Computer Programme 97
4.4 Heat and }fass Transfer Equations for Model 2 97
4.4.1 Mass Balance Equation 98
4.4.2 Drying Rate Equation 994.4.3 Heat Balance Equation 99
4.4.4 Heat Transfer Rate Equation 1014.4.5 Method of Solution 1034.4.6 Computer Programme 104
4.5 Preliminary Tests with the Programme 104
4.5.1 Sensitivity Analysis 105
5. DEEP BED DRYING EXPERIMENTS AND COMMERCIAL KILN SIMULATION 106
5.1 Apparatus 1065.2 Experimental Procedure 108
5.3 Results and Discussion 109
5.3.1 Comparison of the Simulation with Experimental 110Results
5.3.1.1. Mean Moisture Content Variation with Time 110
5.3.1.2 Moisture Content Distribution 110
5.3.1.3 Air Temperature Variation with Timeand Position 111
5.3.2 Comparison of Simulation with Kiln Data 112
5.3.2.1 Temperature Variation with Time andPosition 112

vii
5.4 Computing Time 1125.5 Validity of the Models 1125.6 Application of Model 113
5.6.1 Operating Procedure 1135.6.2 Results 115
6. DISCUSSION AND CONCLUSION 1176.1 Physical and Thermal Properties of Malt 1176.2 Thin Layer Drying of Malt 1186.3 Simulation of Deep Bed Drying 1206.4 Deep Bed Drying Experiments and Commercial Kiln
Simulation 1216.5 Future Work 123
7. REFERENCES 125

Operators
In
log
exp( )
f
F( )
d
a/j
\]2
Lower case
a
avb
c
d
dee
f
f. (x)1.
g
hshghc
viii
KEY TO SYMBOLS
logarithm to base e
logarithm to base 10
exponent of
function of
function of
differential
partial differential
incremental
sumnation
constant
area of particle per unit volume of bed
constant
constant
constant
effective diameter
exponent of
constant
residuals
constant
heat capacity per unit volume of solid
heat capacity per unit volume of gas
convective heat transfer coefficient,Watts/m2 oK

hcvhcv
hcs~
j
JhJdk
kl, k2ks
m
n
n
p
q
qcr
r
rh
t
tequ
v
x
x
y
~x
volumetric heat transfer coefficient, Joules/m3 sec oK
volumetric heat transfer coefficient in model land
model 2, kJ/m3 min oK
surface heat transfer coefficient
integer
integer
Colburn j-factor for heat transfer
Colburn j-factor for mass transfer
drying constant, l/time
drying constants,l/time
shrinkage constant
integer
integer
constant
constant
constant
rate of heat transfer by convection
radius of sphere
correlation coefficient
relative humidity, ratio
time, nun ,
equivalent time, m~n.
constant
specific volume of liquid
space coordinate
independent variable
space coordinate

x
y dependent variable
z half thickness of a plane sheet
z depth of bed, m
z space coordinate
Upper case
A constant
A heat transfer area
A abbreviated term in model 1B constant
B abbreviated term in model 1
C constant
CI, C2, C3,C4, Cs constants
CP
specific heat of wet grain, kJ/kgOK
specific heat of dry grain, kJ/kgOK
specific heat of air, kJ/kgOK
specific heat 0of water, kJ/kg K
specific heat of water vapour, kJ/kgOK
diffusivity
abbreviated term in model 1
Cpg
CpaCplCpwDvE
F constant
F abbreviated term in model 1
G mass flow rate of air, kg/m2 sec
G2mass flow rate of air in model 1 and model 2, kg/m mln
H humidity, kg/kg
Io modified Bessel function of first kind and zero order

K
Kll, K12, K13K2l, K22, K23K3l, K32, K33LaLgLwaterLwheatLshelled cornLsoybeansLmaltM
M0
MeM t
M-MMR. e= M-M
0 eMdMwMwo
~
MsdM swMddHdw
xi
thermal donductivity
phenomenalogical coefficients
latent heat of water ~n model 1 and model 2, kJ/kg
latent heat of gra~n in model 1 and model 2
latent heat of water, kJ/kg
latent heat of wheat
latent heat of shelled corn
latent heat of soybeans
latent heat of malt
moisture content i. or ratio, {d.b.)
initial moisture content i. or ratio, (d.b.)
equilibrium moisture content i. or ratio, (d.b.)
moisture content at time t i. or ratio, (d.b.)
moisture content i., (d.b.)
moisture content i., (w.b.)
initial no isture content i., (w.b.)
bound moisture content i. or ratio, (w.b.)
static equilibrium moisture content % or ratio, (d.b.)
static equilibrium moisture content i. or ratio, (w.b.)
dynamic equilibrium moisture content i. or ratio, (d.b.)
dynamic equilibrium moisture content i. or ratio, (w.b.)
d~ .(YZ)M (YZ)= 0
n d (YZ)n
M (YZ)= I (2 / YZ )0 0
P
PsPwsPwP, pI
P , PI' P20
P3' P4' P5Patkp
Q
R
R0
Re
RH
RHP
S
SP
T
TsTaTgTaoTgoT.1TfTab
Tdb
pressure, N/m2
saturated vapour pressure
saturated vapour pressure at Tdb, N/m2
saturated vapour pressure at Tdp' N/m2
abbreviated term in model 2
constants
atmospheric pressure, N/m2
direction of search
abbreviated term in model 2
drying rate
universal gas constant
Reynolds number
relative humidity, 7.
maximum permissible relative humidity
shrinkage, % or ratio
sphericity
temperature
temperature of solid, °c. °ca1r temperature,
. 0graln temperature, Cinitial air temperature, °cinitial grain temperature, °cinitial temperature of calorimeter, °c
h. 0final temperature of t e mlxture, Cokabsolute temperature,
dry bulb temperature, oR

· oRdew po~nt temperature,
specific volume of gas
weight at time t, g
weight of grain, g
ww weight of water, g
water equivalent, g
initial weight, g
final weight, g
weight of dry matter, g
balance reading at time t, mV
initial balance reading, mV
final balance reading, mV
dimensionless variabley abbreviated term in model 1
z dimensionless variable
Greek
viscosity
e void fraction
shape factor
density of air, kg/m3
dry bulk density of grain, kg/m3
o standard deviation

1
Chapter 1
INTRODUCTION
The malting process may be divided into three stages. First,
carefully selected barley is immersed in water until a moisture content
of 70 to 85% (d.b.) is reached, the process is called steeping. This
,moisture content is sufficient to support growth and biochemical changes
during the malting period. The nature of the steep water is said to
affect the quality of malt and the derived products. The rate of water
uptake by barley is very rapid at first, but later declines almost to
zero and depends on steeping temperature. Secondly, the wetted barley
is set to germinate under controlled conditions. The intensity of the
germination process is controlled by regulating the moisture and temperature
of the grain. The changes occurring during germination that are essential
1.nconverting barley into malt are collectively termed "modification".
Finally at the end of the germination stage, when biochemical and physical
changes have advanced sufficiently, the green malt is dried to a moisture
content of 2.5 to 4% (d.b.) to produce a friable, readily milled and stable
product for long storage. Once the malt is hand dry (moisture contento5 to 8%) the malt is cured by raising the temperature to between 80 C and
1000C to give the malt colour, flavour and aroma.
Malting barley plays an important role in the British economy.
The estimated plantings of malting varieties of barley in the U.K. compared
with plantings of total cereals is approximately 31%. The projected use
of U.K. barley for malting, both at home and abroad In 1985, is 2.8 million
tonnes. This is 1.0 million tonnes higher than 1.n1974 - 76 (Sturgess
and Knell, 1978). Again, energy consumption in the malting industry in the
U.K. is greater than that of the whole remaining cereal production industry.

2
The total energy consumption in the ma lt i.ng industry is 9.8 million
G.J., out of this about 80% is used for drying malt (Energy Series
Audit No. 15, 1981). Malt ~s dried from 70 - 85% to 2.4 - 4% moisture
content which is equivalent to the evaporation of approximately 400 kg
of water per tonne of malt, whereas most of the cereals are dried
typically from 25% to 13% moisture content, which requires approximately
100 kg of water to be evaporated per tonne of the cereals. Thus the
evaporation load per tonne of malt is about 4 times higher than that of
the cereals.
Johnston (1954) has indicated that the ma~n physical factors
affecting the drying of malt are the quantity of moisture to be removed,
the temperature and humidity of the air entering the kiln, the temperature
to which the air is heated, the hygroscopic state of the grain and the
volume of air passing through the bed. He has also shown that above about
13% (d.b.) moisture content the water evaporates freely. Logan (1954)
has suggested that the free water stage is about about 25% (d.b.) and
an intermediate stage is from 25% (d.b.) to 13% (d.b.). Sfat (1965) has
reviewed the fundamental bio-engineering principles involved in kilning
of malt and suggested further research in the areas of:
(i) Malt equilibrium moisture and moisture hysterisis. Effect
of barley variety, barley kernel size, barley protein,
malting process, analytical properties, surface condition,
drying conditions and adsorption condition.
(ii) Determination of drying rate controlling mechanisms during
falling rate period.

3
(iii) Economic study relating initial kiln investment, operating
costs, including heat and fan power with bed depth.
(iv) Inter-relationship of bed depth with turning, drying time
and product quality.
(v) Mechanism of flavour development during falling rate period,
and how related to physical parameters of drying.
(vi) Rate-controlling steps for colour formation and enzyme
inactivation during falling rate period, and relationship
to the physical parameters of drying.
(vii) Mechanism of sulphering,especially effects of sulphur dioxide
concentration in gas phase, temperature, time of contact
and bed depth.
(viii) Effects of other products of combustion, fuel:air ratio,
velocity and temperature.
Thin layer drying experiments have been conducted for a number
of agricultural products and the data has been used by several researchers
for mathematical models of the deep bed drying process. Although
experiments on the deep bed drying of barley have been reported (Boyce,
1965), the design data for barley does not apply to malt drying. The
main reasons are:
(i) Malt is dried at higher temperatures (50°C - 90oC).
(ii) Initial moisture content is high and final moisture content
~s very low.
(iii) The endosperm and cell walls of wetted barley are degraded
(Pomeranz, 1972).
(iv) Final product should be brittle and have characteristic
flavour.

4
The malting industry is now investing heavily on heat recovery
and the use of microprocessor based programmable controls of kilns,
Major energy saving opportunities are:
(i) Control of drying and energy re-use from kiln to
kiln.
(ii) Heat recovery from exhaust
(iii) Heat pump.
But, the effectiveness of heat recovery, malt quality and microprocessor
based programmable control of kilns depends fully on the theoretical
knowledge of the drying process. The mathematical model of deep bed
drying can be used to test and develop the microprocessor control
programs for decision making such as finding the optimum rates of
recirculation after the break and the optimum re-use of post-break alr
from one kiln for pre-break air on another kiln, when more than one kiln
is in operation.
The objective of this research was to attempt to develop a
mathematical simulation model for deep bed drying of malt to provide
design data and data on temperature and moisture content histories at
different depths of the bed for use by design engineers, operating maltsters
and biochemists.

5
Chapter 2
PHYSICAL AND THERMAL PROPERTIES OF MALT
This chapter describes the basic properties of malt that are
required for simulating the heat and mass transfer phenomena during
drying and storage. The dimensions and 1000 grain weight are used to
describe the physical characteristics of malt and their influence on
drying is discussed. When the drying is simulated by a model using the
diffusion equations to describe internal moisture movement, the above
parameters are essential in order to select geometry and specify size.
Bulk density, specific heat, latent heat of vaporization, shrinkage
and heat transfer coefficient of a malt bed are essential in any simulation
of the heat and mass transfer in a deep bed of malt during drying.
2.lPhysical Dimensions of Malt
Physical dimensions of malt are of vital importance in the design
of cleaning and grading equipment. Furthermore, the dimensions of malt
have an important influence on its drying characteristics. Breeders of
barley need a guide in their work of developing new varieties of desirable
size and shape.
2.1.1 Method
Two varieties of malt, Triumph and Sonja, were selected for
determination of physical dimensions. Physical dimensions were determined
at five different moisture levels for each variety.The five moisture levels were obtained for both varieties by
drying four batches of malt and using the undried malt itself. The batches
were tumbled to attain uniformity and five samples were taken randomly
from each batch for moisture content determination. It should be noted

6
here that the samples used for physical dimensions, 1000 grain weight,
bulk density and specific heat, were taken from these batches of known
moisture content. Fifty grains were randomly selected for measurement
for each moisture content and each variety. The length and width of
malt grain were obtained by direct measurement through a microscope
with an accuracy of 0.1 mm. The thickness was measured by a micrometer
(accuracy 0.01 mm).
20 - 220C.
All measurements were conducted at room temperature,
2.1.2 Results and Discussion
The physical dimensions of the two varieties of malt determined
in this study are presented in Table 2.1 and Figs. 2.1 - 2.3. Length,
width and thickness appeared to be linearly dependent on moisture content
on a wet basis. The following regression equations were developed for
length, width and thickness; where M is expressed as a % and the unit ofw
length is millimetres:
Triumph
Length = 7.968 + 0.02171 Mw
2.12(r = 0.88)
Width = 3.687 + 0.008269 Mw 2.2
2(r = 0.87)
Thickness = 3.209 + 0.002875 Mw2.3
(r2 = 0.95)

7
Sonja
Length = 8.146 + 0.02337 Mw 2.4
2(r = 0.95)
Width = 3.615 + 0.01392 Mw
2.5
2(r = 0.96)
Thickness = 3.118 + 0.008359 Mw
2.6
2(r = 0.96)
Linear regress~on with moisture content on a dry basis was less
effective. Figs. 2.1, 2.2 and 2.3 show the experimental data and
regression lines. It is quite obvious from the Figures that the physical
dimensions of the variety, Sonja are more sensitive to the change in moisture
content than the variety, Triumph. Fig. 2.4 and 2.5 show that the computed
percentage changes of physical dimensions with respect to percentage change
in moisture content. It is apparent from Figs. 2.4 and 2.5 that the
percentage change in physical dimensions of Sonja is more or less uniform
but higher than that of Triumph. The data of Nellist (1974) shows that
the drying constant, k, for ryegrass seed varieties, Sabel and S.23 was
greatest for the smaller variety, although the difference is diminished
with increasing temperature. However, fertility, soil type and irrigation,
may have some effect on physical dimensions of malt, unfortunately this
effect is not known.
2.2 1000 Grain Weight
The 1000 grain weight is also of importance in the design of
cleaning and grading equipment. One thousand grain weight also has
application in the determination of effective diameter of the grain.

8
2.2.1 Method
The 1000 grain weight was determined at five different
~oisture levels for the two varieties, Triumph and Sonja. The batches
at five moisture levels were prepared as described in Section 2.1.1.
Five random samples were taken from the conditioned grains and 100
grains were randomly selected from each sample. The weight of 100
gra~ns was measured by an analytical balance (accuracy 0.0001 g) and
this weight was multiplied by 10 to give the 1000 grain weight. The
measurements were repeated for each moisture content for both the
varieties.
2.2.2 Results·and Discussion
The 1000 grain weight of malt is shown in Table 2.2. The
1000 grain weight appeared to be related to moisture content (% w.b.)
linearly. Linear regression with the moisture content on a dry basis
was less effective. The following regression equation was developed for
1000 grain weight:
1000 Grain Weight (g) = 35.15 + 0.6266 Mw
2(r = 0.96)
2.7
1000 grain weight increases with increase in moisture content and there
is no significant difference between the two varieties (Fig. 2.6). The
regression equation agrees more closely with experimental data at low
moisture content.
2.3 Bulk Density of MaltBulk density is one measure of quality. Miles (1937) measured
test weight of five varieties of corn and observed that the test weight
decreases with the increase of moisture content from 10 to 25% (w.b.)

9
and the test weight increases with the increase of moisture content
above 35% (w.b.) Chung and Converse (1971) observed that the
relationship between test weight and moisture content was curvilinear
for both wheat and corn but the dry bulk density was linearly dependent
on moisture content. Vemuganti and Pfost (1980) observed that the
test weight of corn decreases with the increase of moisture content,
whereas Matouk (1976) found that the bulk density of maize gra1n 1ncreases
with the increase of moisture content. Browne (1962) and Kazarian and
Hall (1965) observed that the bulk density of wheat decreases with the
increase of moisture content above 16% moisture content (w.b.). Several
researchers (Wrattenet al. 1969, Morita'etal. 1979 and Vemuganti et al.
1980) found that the bulk density of rough rice increases with the increase
of moisture content. Browne (1962) observed that the bulk density of
barley decreases with the increase of moisture content at higher moisture
content, but Vemuganti and Pfost (1980) reported that the test weight of
barley decreases with the increase in the moisture content (r2 = 0.755).
Thus, there is no general trend 1n the variation of bulk density of common
agricultural crops even for the same crop except rough rice.
2.3.1' MethodBulk density was determined for the two varieties, Triumph and
Sonja, at five different moisture levels. The batches at five moisture
levels were prepared as described in Section 2.1.1. The bulk density
of malt was determined by measuring weight of a grain sample of known
500 c.c.
The grain sample was placed in a cylindrical container of volume
Uniform density in the cylinder was obtained by gently tappingvolume.
the cylinder vertically down onto a table 30 times in the same manner in

10
all measurements. The excess on the top of the cylinder was removed
by sliding a string along the top edge of the cylinder. After the
excess had been removed completely, the weight of the grain sample was
measured by an electronic balance (accuracy 0.01 g). Dry weight of
the grain sample was deternJned from the weight of the wet grain and
the moisture content.
2.3.2. Results artdDiscussion
The bulk density of malt and dry bulk density are presented in
Table 2.3. The dry bulk density of malt appeared to be linearly
dependent on moisture content (w.b.). The following regression equation
was developed for dry bulk density of malt:
Dry Bulk Density (kg/m3) = 527.0 - 4.481 Mw
2(r = 0.98)
2.8
Linear regression with the moisture content on a dry basis was less
effective. There is no significant difference between the two varieties,
of malt and the above equation has been developed for both varieties
(Fig. 2.7). The dry bulk density is found to decrease with the increase
in moisture content. Physically this means that reduction in physical
dimensions during drying reduces porosity which allows more grains to be
accommodated per unit volume. Equation 2.8 was converted. into a general
equation for bulk density. The bulk density can be estimated by the
following equation:
Bulk Density (kg/m3) =(527.0 - 4.481 M )w x 100 2.9
(100 - M )w

11
The curve predicted by equation 2.9 along with the experimental data
is shown in Fig. 2.8. It has been reported (Thompsonet al. 1967, and
Gustafson et al. 1972) that bulk density increases with decrease 1nporosity. The bulk density of malt increases with the increase of
moisture content in the range 25 to 45% moisture content which means
that bulk density is more influenced by the moisture present than by
the porosity of malt. But the reverse effect is observed in the moisture
content range 0 to 15%. There exists a critical region between these
two ranges and this critical region is characterized by the counter
balance effect of moisture present and porosity. Bulk density alsodepends on location and soil type where the crop is grown and the cultural
and harvesting practices used.
2.4 Specific Heat of 'Malt
The specific heat at constant pressure is normally used for
heat transfer problems during drying and storage of agricultural crops.
The pressure dependence of specific heat is very little for solids and
liquids until extremely high pressure is encountered. Specific heatis also a function of temperature. However, it has been established thatat ordinary temperatures and over temperature intervals which are not too
great, specific heat may be considered as a constant physical property.
The need for data on specific heat of food materials has been
recognised as early as 1892. Siebel (1892) proposed that specific heat
of food materials can be expressed as equal to the sum of the specific
heat of the solid matter and that of water associated with the solid dry
matter. Siebel proposed the following equations for food materials suchI
as ,eggs, meat, fruits and vegetables:

12
For values above freezing:
C = 0.837 + 0.03349 Mp w 2.10
For values below freezing:
Cp0.837 + 0.01256 M
w2.11
where
C = specific heat, kJ/kg oKp
M = moisture content, % w.b.w
Kazarian and Hall (1965) measured specific heat of wheat and
corn using a Dewar flask calorimeter and dropping heated grain into water
used as the calorimeter fluid. Muir and Viravanichai (1972) and Matouk
(1976) measured the specific heat of wheat and maize grain respectively
by dropping cooled grains into the calorimeter containing water at room
temperature. The use of these techniques causes undesirable heat loss
or gain during transferring the grains into the calorimeter and no method
lS available to make correction for it.
Disney (1954) and Haswell (1954) measured the specific heats
of wheat, barley, paddy, corn, oats and groats by means of a modified
Bunsen calorimeter, but used the grains at room temperature. Pfalzner
(1951), Alam and Shove (1973), and Morita and Singh (1979) used the method
of mixtures and dropped the grains at room temperature into ice cooled
water in the calorimeter for determining the specific heats of wheat, soybeans
and rough rice. Vemuganti and Pfost (1980) determined the specific heat
of sixteen kinds of cereals, legumes and oilseeds, and dropped the grains
at room temperature into heated toluene instead of lce cooled water. Whatever

13
the type of calorimeter used and whether the calorimeter fluid is
cooled or heated, the use of grains at room temperature avoids the
heat gain or loss during the transfer of the grains into the calorimeter
and the only correction needed is for the final temperature in thecalorimeter.
Pfalzner (1951) presented an approximate formula for correcting
the temperature rise in the calorimeter for radiation and Morita and
Singh (1979) used the Regnault-Pfaunder formula for temperature correction.
Muir and Viravanichai (1972) provided a graphical method for temperaturecorrection. Since the radiation loss in an insulated calorimeter is very
small in comparison with the convection heat loss, the graphical method
is superior to the approximate formula for radiation correction.
The researchers uS1ng toluene argued that toluene enables the
gralns to sink more readily and gives greater temperature rise than thatof water. However, the use of ice cooled water and shaking the mixture
for a while have not been proved to cause any error in the determinationof the specific heat.
Pfalzner (1951) used wheat enclosed in a small copper capsule
and dropped into the calorimeter water. However, Muir and Viravanichai
(1972) found no difference at 5% level of significance between the two
means of specific heats obtained by pouring the wheat directly and by
dropping a sealed polythelene bag of wheat into the calorimeter.
There exists a general agreement among the researchers on the
observations of the specific heats for common agricultural crops that the
specific heat of wet grain increases linearly with moisture content.
The regressions equations of some common agricultural crops are presentedin Table 2.4.

14
2.4.1 Method
The specific heat of grain 1S determined by the method of
mixtures using distilled water as a calorimeter fluid. The technique
consists of determining the temperature change of water contained 1n
the calorimeter when a known quantity of grain is added to it at a
known different temperature. The specific heat is calculated by
solving the following heat balance equation:
Heat lost by grain = heat gained by water and calorimeter
C W (T - Tf)P g g
2.12
where
WE = water equivalent of the calorimeter
C = specific heat of gra1np
T initial grain temperatureg
Tf = final temperature of the mixture
T. = initial temperature of the calorimeter1
W = weight of graing
W c = weight of the calorimeter
W = weight of waterv
Cpc = specific heat of the calorimeter
Cpl specific heat of water

15
In this study an ordinary thermos flask was used as a
calorimeter and fibreglass insulation was added between the vacuum
bottle and the outer metal walls of the container. The specific heat
was determined by dropping the grain directly into the calorimeter.
The malt grains were conditioned to provide five different
moisture levels for both varieties as described in section 2.1.1.
One experiment with the variety Sonja was rejected due to a sudden
change in room temperature. Five measurements were performed at eachmoisture level. The grain samples of approximately 30 g were placed
in glass test tubes and sealed with a rubber stopper, through which a
copper-constantan thermocouple was inserted into the grains to check
grain temperature. The placing of grain into sealed test tubes avoids
the addition or removal of moisture to the graln from the room. The
grain temperature was in equilibrium with room temperature within 24 hours,
as indicated by thermocouples inside and outside the test tube. Two copper-
constantan thermocouples were used to monitor the temperature inside the
calorimeter. The thermocouple reference junction was maintained at zero
°c by means of the ice-cell. For each measurement 50g of ice water was
placed into the calorimeter and allowed to rise to an equilibrium temperature.
Then approximately 30 g of grain sample which had been held in the test
tube at room temperature was quickly transferred into the calorimeter. The
thermos flask and its contents were shaken for a while (5 to 10 sec) to
ensure the mixing of grain and water evenly. The temperature of the mixture
was printed by the datalogger every second and the temperature recording
continued 4 - 5 minutes after equilibrium was obtained. The arithmetic
mean of the two thermocouple readings was considered the temperature of the
mixture. A correction was made to the final temperature to allow for heat

16
loss from the calorimeter. The graphical extrapolation technique
used is described by Muir et·al. (1972). The correction is not criticalas it causes only a 3% change in the temperature rise.· The average
specific heat was calculated from the equation 2.12. The mean of thefive replicates was considered as the specific heat of malt at that
moisture content.
The water equivalent of the thermos flask was determined by
using lead shot (470 g) and distilled water (50 g) instead of thegrain and then for material of known specific heat, WE becomes the only
unknoWn in Eqn. 2.12. Three and five replicates were made for lead
shot and distilled water respectively.
2.4.2 . Results and Discussion
The water equivalent of the calorimeter was determined us~ng
lead shot of known specific heat (0.1337 kJ/kgOK) and distilled water.
The mean value of water equivalent of the calorimeter for five measurementsusing distilled water was 14.26 g with a standard deviation of 1.713 g
and the mean value obtained by using lead shot for three measurements was
14.12 g with a standard deviation of 1.635 g. There was no significantdifference between the two means of water equivalent. The average valueof these two means was taken as the water equivalent of the calorimeter.
The specific heats of the two varieties of malt, Triumph and
Sonja, determined in this study are presented in Table 2.5. The specificheat of the two varieties of malt was found to vary linearly with moisture
content (w.b.) and the following regression equation was developed.
c = 1.651 + 0.04116 MP w2
(r = 0.99)
2.13

17
Linear regression with moisture content on a dry basis was less
effective. Fig. 2.9 shows'the regress10n line of the two varieties
of malt together with the 95% confidence band of the line. A regression
equation was fitted to the data on specific heats of barley from Disney(1954). Fig. 2.10 shows the regression lines for malt and barley.
It is quite obvious from Fig. 2.10 that the specific heat of malt is
higher than but not far removed from that of barley. This high valueof specific heat of malt might be attributed to the fact that barley is
converted into malt after significant changes in physical properties andchemical composition. Johnston (1954) reported the specific heat of
dry matter of malt to be 1.674 kJ/kgOK which is in very good agreementowith the observed value of 1.651 kJ/kg K.
The apparent specific heat of bound water was computed fromoequation 2.13 and was found to be 5.767 kJ/kg K. Similar results have
been reported by Muir and Varavanichai (1972), Matouk (1976) and Shipleyet 'al. (1939). Shipley et al. suggested that a rise in temperature
decreases the amount of bound water and increases the freedom of some waterto the corresponding extent. According to this theory, the heat that wassupplied to the malt was required for two purposes, first for the heat
capacity of the system as a whole and second, to supply the heat necessary
to bring about a decrease in the amount of bound water with rise in
temperature. This would explain why the calculated heat content of the
moisture in the malt kernel is greater than the heat content of free water.
Stitt and Kennedy (1945) have held the opposite view that the heat capacityof bound water is actually less than that of free water. According totheir theory, the addition of water to dry solid produces changes in the

18
~nner structure of the material which results in an increase of overall
specific heat exceedi?g the ~ffect of the depression of specific heat
caused by the bound water. The apparent specific heat of bound water
of malt was calculated neglecting the contribution of the changes in the
inner structure of malt to the overall specific heat of malt. This
contribution might be higher than the depression caused by the bound water.
This would also explain why the calculated specific heat of bound water
in malt is higher than that of free water.
In fact the changes in inner structure of the malt are higher
than that of barley. This would explain, according to the theory of
Stitt and Kennedy (1945), why specific heat of malt is higher than thatof barley.
2.5 . Latent Heat of Vaporization of Malt
The latent heat of vaporization of malt is defined as the energy
required to vaporize moisture from the product. The energy required to
evaporate moisture from grain especially at low moisture content is higher
than that of free water and depends on the type of crop. The latent heat
of vaporization of wheat has been used to a great extent for other crops
(Boyce, 1966, Nellist, 1974, and Matouk, 1976). The use of the latent
heat of wheat for other crops ~s certainly better than the use of the latent
heat of free water, but with crops which are dried to a very low moisture
content as ~n the case of malt, its use may result ~n considerable error.
Since malt is dried to a very low moisture content, the determination of its
latent heat of vaporization is essential for simulating deep bed drying
of malt.

19
Othmer (1940), starting with the Clapeyron equation,developed the following equation:
.L'Log p'= log P + C 2.14
L
where P and P' are vapour pressures and Land L' molal heats of the two
compounds respectively, taken at the same temperatures. C is a constant.Equation 2.14 states that, if the log of the pressure of any substance is
plotted against the log of the pressure of any other substance, a straight
line results which will have for its slope the ratio of the molal latentheats. He made plots to illustrate the utility of this relation with
various materials in checking and correlating vapour pressure data, andit gave a good fit to the data.
Gallaher (1951) uSlng the equilibrium moisture content data for
wheat, published by Gay, determined the latent heat of vaporization ofwheat. He developed Othmer plots for wheat by plotting the log of the
vapour pressure of the crop against the log of the vapour pressure of water
at the same temperature for each moisture content'. The ratio of latentheat of the crop to the latent heat of free water was calculated from theslope of the line resulting from the plot. He also found that when theratios of the latent heat of wheat to the latent heat of free water were
plotted against moisture content (d.b.), the resulting curve could be
described by the following equation:
L wheat = 1 + 23 exp ( - 0.40 Md)L2.15
water
where Md is the moisture content on a dry basis. This equation shows that
the amount of heat required to vaporize water from wheat increases considerably
as the moisture content of the wheat decreases.

20
Strohman and Yoe ger (1967) developed an equilibrium moisture
content equation utilizing the linear form of the Othmer plots of
equilibrium moisture content and the solution of the equation provides
information about the latent heat of vaporization. They developed the
following equation for the latent heat of vaporization of shelled corn:
L shelled cornL water
= 1 + 0.8953 exp ( - 0.1232 Md) 2.16
A1am and Shove (1973) developed the following equation for latent of
vaporization of soybeans using Strohman and Yoeger relationship for soybeans:
L soybeans= 1 + 0.21624 exp ( - 0.06233 Md) 2.17
L water
2.5.1 Theory
The theoretical basis for the determination of the latent heat of
malt is the Othmer plot based on the Clapeyron equation.
equation is g1ven by (Rogers and Mayhew, 1980)The Clapeyron
dP . L
dT (V-v)2.18
where
P = vapour pressure
T = absolute temperature
V = specific volume of water vapour
v specific volume of liquid water
L = latent heat of vaporization
If v is disregarded 1n comparison with V and if it is possible to assume

21
a perfect gas, the following equation may be used for the volume
term:
v = RT/P 2.19
From the combination of equations 2.18 and 2.19 the Clausius-Clapeyron
equation results:
.dP LP
dT - RT2
1 dP dTx-
RT2L P
2.20
2.21
The same equation may be written for water in grains at the same
temperature.
1 dP' dTRT2 2.22x - =
L' P'
where
P' vapour pressure of grain 1n equilibrium
L' latent heat of vaporization of grain.
From equatiors 2.21 and 2.22
dP'/p' L'----- 2.23dP/P L
It 1S also apparent that equation 2.23 can be integrated to give:L'
Log pI = Log P + C 2.24L
The latent heat of the material can be established from the
slope of the log pI vs log P curve.

22
2.5.2 Data Artalysis
The equilibrium moisture content data for malt from the
unpublished data of Pixton and Henderson (1981) was used to determine
the latent heat of vaporization of malt. For each temperature, the
saturation vapour pressure was found from the Steam Tables (Rogers
and Mayhew, 1980). The vapour pressure of malt at each moisture
content was determined by mUltiplying the corresponding relative humidity
by the saturation vapour pressure for the given temperature. The
logarithm of the vapour pressure of malt was plotted against the logarithm
of the vapour pressure of free water. These gave reasonably well defined
straight lines. The slopes of the lines, namely, the ratios of the
latent heat of malt to the latent heat of free water were plotted against
moisture content (~.b.). An equation was developed to describe the
ratio of the latent heat of vaporization of malt to the latent heat of
vaporization of free water as a function of moisture content and of the
form used by Gallaher (Eqn. 2.15).
2.5.3 Results and Discussion
Table 2.6 presents the equilibrium moisture content data of
malt (Pixton and Henderson, 1981) along with the calculated saturated
vapour pressures and vapour pressures of malt. Fig. 2.11 presents the
Othmer plots for malt and shows that the plot of the log of the vapour
pressures of malt against the log of the vapour pressure of free water
gives a reasonably well defined straight line. The ratio of the latent
heat of malt to the latent heat of free water was a function of moisturecontent. The following regression equation was developed:
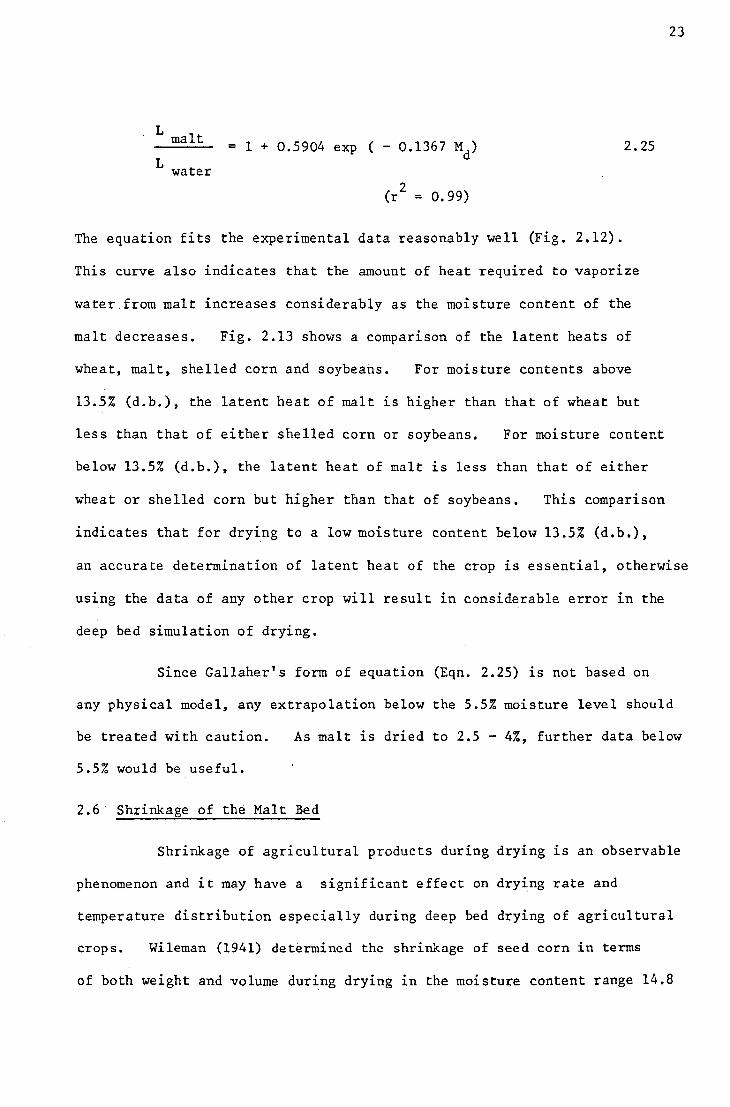
23
.L maltL water
1 + 0.5904 exp ( - 0.1367 Md) 2.25
2(r = 0.99)
The equation fits the experimental data reasonably well (Fig. 2.12).
This curve also indicates that the amount of heat required to vaporize
water from malt increases considerably as the moisture content of the
malt decreases. Fig. 2.13 shows a comparison of the latent heats of
wheat, malt, shelled corn and soybeans. For moisture contents above
13.5% (d.b.), the latent heat of malt LS higher than that of wheat but
less than that of either shelled corn or soybeans. For moisture content
below 13.5% (d.b.), the latent heat of malt is less than that of either
wheat or shelled corn but higher than that of soybeans. This comparison
indicates that for drying to a low moisture content below 13.5% (d.b.),
an accurate determination of latent heat of the crop is essential, otherwise
using the data of any other crop will result in considerable error in the
deep bed simulation of drying.
Since Gallaher's form of equation (Eqn. 2.25) is not based on
any physical model, any extrapolation below the 5.5% moisture level should
be treated with caution. As malt is dried to 2.5 - 4%, further data below
5.5% would be useful.
2.6 Shrinkage of the Malt Bed
Shrinkage of agricultural products during drying is an observable
phenomenon and it may have a significant effect on drying rate and
temperature distribution especially during deep bed drying of agricultural
crops. Wileman (1941) determined the shrinkage of seed corn in terms
of both weight and volume during drying in the moisture content range 14.8

24
to 34.8%. He found the we.ight.and volume shrinkage of ear corn to
be related linearly to the percentage moisture removed from the grain
during artificial drying of seed corn on the ear.
Boyce (1966) reported that the shrinkage of barley during
drying in deep beds appeared to be continuous and linear over the moisture
content range,16 - 34% (d.b.) being on the average 16% by volume. He
determined the following relationship between the shrinkage and the
average moisture content of remoistened barley drying in deep beds:
S = 25.21 - 0.661 Md 2.26
where
S = shrinkage of bed, %.
Nellist (1974) determined the shr inkage of ryegrass seeds and found this
to be a linear function of the reduction in moisture content. The following
equation was developed:
S = 5.34 + 0.1889 (Mo - Mf) 2.27
where
M = initial moisture content %, (d.b.)a
Mf = final moisture content %, (d.b.)
He maintained that the constant in equation 2.27 is consistent with that
part of the shrinkage that is due to settling which would occur even in an
undried bed.
Spencer (1972) determined overall bed shrinkage of wheat for
changes in bed mean moisture contents from the data of Clark and Lamond.
The following equation was developed:
25
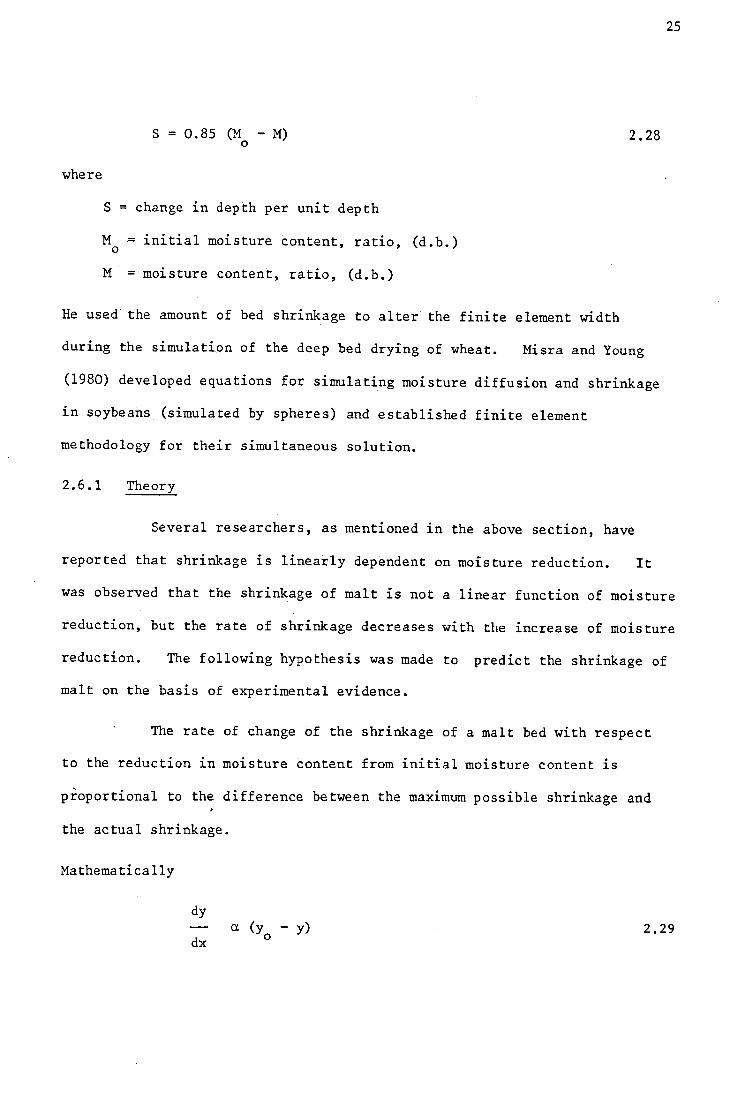
S = 0.85 (M - M)o 2.28
where
S = change in depth per unit depth
M = initial moisture content, ratio, (d.b.)o
M = moisture content, ratio, (d.b.)
He used the amount of bed shrinkage to alter the finite element width
during the simu1ati.on of the deep bed drying of wheat. Misra and Young
(1980) developed equations for simulating moisture diffusion and shrinkage
in soybeans (simulated by spheres) and established finite element
methodology for their simultaneous solution.
2.6.1 Theory
Several researchers, as mentioned in the above section, have
reported that shrinkage is linearly dependent on moisture reduction. It
was observed that the shrinkage of malt is not a linear function of moisture
reduction, but the rate of shrinkage decreases with the increase of moisturereduction. The following hypothesis was made to predict the shrinkage ofmalt on the basis of experimental evidence.
The rate of change of the shrinkage of a malt bed with respect
to the reduction in moisture content from initial moisture content is
proportional to the difference between the maximum possible shrinkage and
the actual shrinkage.
Mathematically
dy
dxa (y - y)
o 2.29

26
where
y the shrinkage expressed as a percentage of
the original depth
y = maximum shrinkage %o
x = moisture reduction %
The equation 2.29 can be written as
dy
dx= ks (Yo - y) 2.30
where
k = shrinkage constants
The solution of the equation 2.30 gives
y -k xy (I-e s)o 2.31
This equation requires the determination of the shrinkage coefficient
and the maximum possible shrinkage from experimental data.
2.6.2 Method
An aluminium cylinder of 15 cm diameter and 30 cm long filled
with green malt was mounted on a rectangular box serving as an air mixingchamber. The whole set was placed on a balance so that the amount of
moisture removed could be determined at any time during the drying process.
As the balance was of the beam type fitted with a balance pan for counter-
weights, the effect of flexible connecting tube could be eliminated. The
schematic diagram of the experimental set upis shown in Fig. 2.14. A
stainless steel scale graduated in mm was placed inside the cylinder to
determine the change in depth at any time during drying.

27
Two runs of experiments on the shrinkage of the malt bedwere performed. The cylinder containing green malt was placed on the
balance and heated air at a constant air flow was passed through the·grains. The scale indicator was set to zero by the use of counter
weights and water in a plastic cylinder. The depth of grain bed wasnoted. A 20 g weight was placed on the pan containing the cylinderfilled with grain. When 20 g of moisture had been removed, thescale indicator was again at zero position. The bed depth and moistureremoved were noted and another 20 g of weight was placed on the pan
containing the aluminium cylinder. This procedure was repeated untilthe drying rate approached zero.
2.6.3 Results and Discussion
The shrinkage of the malt bed determined in this study isshown in Table 2.7. Shrinkage coefficient, k and max~mum possibles
shrinkage were determined by direct least square fit of equation 2.31to the experimental data. The following equation was developed forthe shrinkage of the malt bed during drying:
s = 15.91 [1 - e - 0.0966 (Mwo - Mw)] 2.32
(S.E. = 0.6871)
where
S percentage shrinkage
M = initial moisture content %, (w.b.)woM = moisture content %, (w.b.)w
Standard error of estimate was higher with moisture content on dry basis.

28
Fig. 2.15 shows that the agreement between the theory and experimentsis reasonable. Furthermore, Fig. 2.15 shows that shrinkage can be
related linearly with moisture reduction in the range 0 - 10%, (w.b.).
Physically the non-linearity of shrinkage of malt can beinterpreted as follows. The shrinkage of a malt bed at any instant
during drying is the cumulative effect of the free shrinkage of the cells
due to loss of moisture and elastic shrinkage, if any, due to constraints
on the free shrinkage exerted by the adjacent cells of the grains in the
bed. The rate of shrinkage of cells in the malt grains decreases asthe moisture content approaches a low value. This explains why the rateof shrinkage in the malt bed (Fig. 2.15) gradually decreases to almostzero at very low moisture content.
2.7 Heat Transfer Coefficient of Malt Bed
The rate of heat transfer between a solid surface and fluid
may be computed from the following relation:
q = h A ~Tc c 2.33
where
q = rate of heat transfer by convection (Watts)c2A = heat transfer area, (m )
~T = temperature difference between the surface and the fluid, (oK)
h = convective heat transfer coefficient, (Watts/m2 oK)c
Equation 2.33 was originally proposed by Isaac Newton in 1707. Engineershave used this equation for many years, although it is a definition of hcrather than a phenomenological law of convection. The heat transfer

29
coefficient is actually a complicated function of the fluid flow, the
thermal properties of the fluid medium and the geometry of the system.
Schumann (1929) made a significant contribution in the field
of heat transfer by developing the following analysis for fluid and
solid temperature distribution in a packed bed of crushed material:
d Ts = T - Ta s2.34
d Z
d Tad Y
T - Ts a2.35
where
Y = k2x/v
Z = kl (t-x/v)
T = temperature of the fluida
T temperature of the solids
x = distance traversed by the fluid in the bed
t = time
k2 ::: k/h fakl ::: k/h (l-f)sk = constant of heat transfer
h ::: heat capacity per unit volume of the solidsh = heat capacity per unit volume of the fluidaf = free space per unit volume.

He also presented the following solution involving some interesting
mathematical functions related to the well known Bessel Functions:
Ts -Y-Z ex:= e 2: Zn M (yz) 2.36T n=l n0
Ta -Y-Z ex: Zne 2: M (YZ) 2.37T n=o n0
where
M (YZ)n
dn M (YZ)o
d(YZ)n
M (YZ) = I (2 vYz)0 0
I (2 m) = modified Bessel function of the first0 kind and order zero
T initial temperature of the fluid0
He calculated the numerical values of T IT and T IT from equationss 0 a 0
2.36 and 2.37 for values of Y and Z ranging from zero to 10 and presented
the results graphically.
Furnas (1930) developed an interesting alternative numerical
method of solution for the differential equations developed by Schumann
and extended the temperature history curves for values of Y up to 500.
He also demonstrated the use of the computed temperature history curves
to calculate the heat transfer coefficient from observed data on temperature
history. He determined the heat transfer coefficients of iron ore,

limestone, bituminous coal, anthracite, coke and typical blast furnace
charge, and postulated the following equation:2Av 0.7 T 0.3 10 1.68f - 3.56f
h =cv 2.38
where
hcv = volumetric heat transfer coefficient,(cal/sec °c cm3)
2v = velocity, (litres/sec em )oT = temperature, (C)
f = fractional value of voids in bed
A cons.tant dependent on the bed material
d = average particle diameter, (em)
In a written discussion on the paper of Furnas particularly on
the introduction of T as a variable in equation 2.38, Colburn made the
following comments:
"The effect of temperature on heat transfer coefficients of
gases in pipes has not been proven by previous investigators
and it seems safest to accept the theoretical equation which
shows that the only effect of temperature is that on specific
heat. Mr. Furnas' introduction of a temperature factor does
not, therefore, seem justified."
Lof and Hawley (1948) following the measurement of the time-
alr temperature relationship at the exit end of a packed bed of granitic
gravel, determined the heat transfer coefficient by use of the Schumann
curves. He found that the results could be correlated by the equation:

32
h =cvG 0.7
0.79 ( )de
2.39
where
hcv volumetric heat transfer coefficient,(btu/hr ft3 of)
air flow rate, (pounds/hr ft2)G
d = equivalent spherical diameter, (ft)e
Alanis, Saravia and Rovetta (1977) measured the volumetric
heat transfer coefficient of a rock pile by means of the transient
method where a temperature step was applied to the bed, and the obtained
time-temperature relations for fluid at different points in the pile
were compared with the theoretical curves computed by Schumann and Furnas.
The following equation was developed for heat transfer coefficient:
h = 824 (cvG 0.96
) 2.40de
where
Hcv = volumetric heat transfer coefficient,(WIn-3 K-l)
-1 -2G = mass velocity, (kg sec m )
d = equivalent spherical diameter, (m)e
Colburn (1933) made a significant contribution in the determination
of heat transfer coefficient by proposing a general method to correlate the
forced convection heat transfer data which consists in plotting, against
Reynolds number, a dimensionless group representing the experimentally
measured data from which heat transfer coefficient would be calculated,
namely, [(TI - T2) / ~Tm] (S/A) or its equivalent hcs/Cpa G, multiplied

33
by two-thirds power of the group (C ].l/K). He called thispadimensionless group the j-factor and by definition
(Tl-T2) S (Cpa u2 h 2
)3 cs ( Cpa lJ)"3Jh = =
6. T A K C G Km pa
2.41
where
Jh = Colburn j-factor for heat transfer
Tl-T2 = temperature change
6.Tm
= mean temperature difference between thefluid and the surface
s = cross sectional area of air flow
A = heat transfer area
C = specific heat of the fluidpa].l = viscosity of the fluid
K = thermal conductivity of the fluid
hcs = heat transfer coefficient based onsurface area
G mass velocity
Gamson, Thodos and Hougen (1943) conducted a series of
experiments (180 runs) on heat and mass transfer uS1ng spherical and
cylindrical catalyst carrier pellets of diameters from 2.29 to 18.8 rom
and cylindrical heights from 4.78 to 16.9 romunder conditions of constant
drying rate, at temperatures from 26.7 to 71.1 °c and at mass velocities2of a1r from 0.54 to 3.12 kg/sec m . They found a remarkable correlation
of experimental data by plotting the heat transfer factor, jh against
mod i f ied Reynolds number, d G/lJ.e
The results were represented by the
following equations:

34
For turbulent flow, Re >350
h = 1.064 Ccs pad G -0.41
G (_e )u
23
2.42
For laminar flow, Re < 40
h = 18.1 C Gcs pa 2.43
where
Re = Renolds number
d = effective particle diametere
It was also observed that for all conditions of flow, turbulent, laminar
or transition, the ratio of jh to jd remains constant, that is
1.076 2.44
where
jd = Colburn j-factor for mass transfer.
Yoshida, Ramaswami and Hougen (1962) recorrelated the data of
Wilke and Hougen; Gamson, Thodos and Hougen; and Wakao, Oshima and Yagi,
by plotting jd values against the values of Re on a logarithmic plot.
For convenience, without appreciable loss 1n accuracy, the correlations
were divided into parts as follows:

35
For 0.01 < Re < 50
jd = 0.84 Re -0.51 2.45
For 50 < Re < 1.000
jd = 0.57 Re -0.41 2.46
where
GRe
av area of particle per unit volume of bedgeometric mean diameter
~ .= shape factoreffective diameter
Again. Jh can be estimated from equation 2.44.
Barker (1965) made an extensive survey on heat transfer in
packed beds. He found by plotting the Colburn jh factor against Reynolds
number that whatever the type of packing, there was a general agreement
among most of the investigators. The agreement is generally within a
factor of about 2 over Reynolds numbers ranging from 10 to 100.000 and
especially in the most common range from 200 to 4000. He also plotted
Colburn Jh factor against Reynolds number for beds of randomly packed
spheres of uniform diameter and found that the pioneering work of Furnas
produced data lying in the centre of data spread produced by later workers,
indicating that his data was essentially correct in all important aspects.

36
Henderson and Pabis (1962) developed a correlation equation
from Treybal's data. The equation used for drying of wheat was:
h = 2.24 V 0.494cs 2.47
where
h = surface heat transfer coefficient, (Btu/hr ft2 of)csV = superficial velocity of air, (ft3/min ft2)
Boyce (1966) studied the convective heat transfer coefficient
of a thin layer of barley. A thin layer of barley was dried to equilibrium
with the airstream and then cooled to a lower temperature. The change
1n moisture content was assumed to be zero during the heating process.
He developed an equation of volumetric heat transfer coefficient of the
form:
hcv(T + 460) b
P ]at
2.48
where
h = volumetric heat transfer coefficientcvG = mass flow rate of drying air
T = temperaturep = atmospheric pressureat
a, b = constants.
Menzies (1971) plotted the jh factor against Reynolds number from the
results obtained by a number of workers for heat transfer coefficients 1n
packed beds, together with the original data of Boyce. He found that the

37
relationship proposed by Boyce does not reduce to the form of equation
2.41, but the original data of Boyce is not very far removed from the
data obtained by other workers for non-organic materials.
Nel1ist (1974) made an attempt to use the method of Boyce to
determine the heat transfer coefficient of ryegrass seeds, but abandoned
it due to comparatively large heat losses during the measurement of heat
transfer coefficient. He also compared the values of heat transfer
coefficients obtained by the Gamson, Thodos and Hougen equation for barley
and ryegrass seeds. He found that the Gamson, Thodos and Hougen equation
always gives larger estimates. He developed the deep bed drying model
of ryegrass seeds using Boyce equation multiplied by a constant.
Matouk (1976),using Boyce's method, determined the volumetric
heat transfer coefficient at a temperature of 290C and air flow rates from20.1588 to 0.776 kg/m sec and developed the following equation:
Gh = 372600.0 [cv
x Tab 1pat
0.52172.49
where
= volumetric heat transfer coefficient,(Joules/m3 sec oK)
G mass flow rate of air, kg/m2 sec)
hcv
T t t (OK)ab empera ure,
= atmospheric pressure, (N/m2)

38
Wang, Rumsey and Singh (1979) studied convective heat transfer
coefficient in a packed bed of rice. The basic equations used 1n their
study were developed by Schumann. They compared the experimental results
with the Schumann curves to compute heat transfer coefficients at different
air flow rates. The computation procedure was similar to that developed
by Furnas (1930); Lof and Hawley (1948). They developed the following
correlating equation:
h = 8.69 x 10⁴ Gl.30Cv 2.50
where
= volumetric heat transfer coefficient,(Joules/m3 sec oK)
G = mass flow rate of air (kg/m2 sec)
2.7.1 Method
There are two general methods available for the determination of
convective heat transfer coefficients 1n the malt bed:
(1) Dimensional analysis correlating existing data
(2) Direct measurement of heat transfer coefficient on a malt bed
by comparing the temperature curves with Schumann's exact solution.
Dimensional analysis is mathematically simple and has a.wide
range of application. This method is useless and incomplete without
sufficient experimental data and contributes little to our understanding
of the transfer process, but it facilitates the interpretation and extends
the range of application of experimental data by correlating them in
terms of dimensionless groups.

39
Schumann's mathematical solution of the simultaneous equations
are quite complicated. The method presupposes that the physical
mechanisms are sufficiently well understood to be described in the form
of partial differential equations. The solution in the dimensionless
form is compared with the experimental data to compute convective heat
transfer coefficient. Exact solutions are important because the assumptions
made in the course of the analysis can be specified accurately and the
validity can be checked by experiment.
In this study convective heat transfer coefficients were
determined by both methods.
(1) Dimensional Analysis
The correlating equation developed by Yoshida, Ramaswami and
Hougen (1962) was selected for this study. This equation was developed
by recorrelation of the data of Wilke and Hougen; Gamson, Thodos and Hougen;
and Wakao, Oshima and Yagi. Thus this equation has been supported bysufficient experimental data.
For Re < 50 < 1,000.
jh = 0.61 Re-0.41 2.51
Again
cs
2.52
h
C Gpa
40
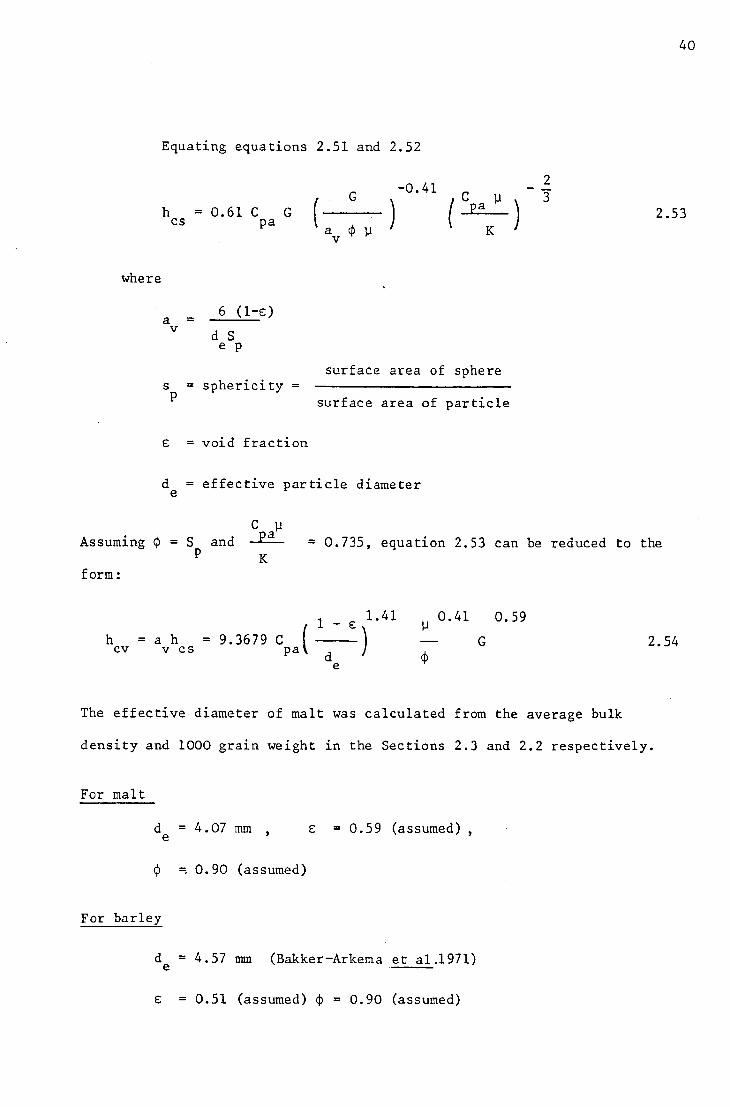
Equating equations 2.51 and 2.52
-0.41 2G (C u 3"
h = 0.61 C G ( a ) Ea )cs pacP Kv u
2.53
where
a =v6 (1-£)
d Se p
surface area of spheres = spherici typ surface area of particle
£ = void fraction
d effective particle diametere
Assuming ¢ = Sp
c ~and ~
K= 0.735, equation 2.53 can be reduced to the
form:
hcv = a hv cs
1 _ 1.41= 9.3679 C (-_£)
pa de
0.41 0.59G 2.54
The effective diameter of malt was calculated from the average bulk
density and 1000 grain weight in the Sections 2.3 and 2.2 respectively.
For malt
d = 4.07 mm ,e e: = 0.59 (assumed) ,
¢ 0.90 (assumed)
For barley
d = 4.57 nun (Bakker-Arkema et al.1971)e
E = 0.51 (assumed) ¢ = 0.90 (assumed)

41
Substituting the values of C and ~ at 60oC, d , £ and ~ inpa e
equation 2.54, the following equations for heat transfer coefficient
were obtained:
For malt
h = 82.25 x 10³ GO.59cv 2.55
For barley
h =cv 89.83 x 10³ GO.59 2.56
(2) Experiments on a Malt Bed
The formulation of Schumann's equations with the underlying
assumptions are derived by a comparatively simpler method in Appendix 2.1.
Schumann's equations for malt are:
d Ta = T - Tg a2.57
ay
a T___g_ T - T 2.58aZ a g
whereh x
y cv 2.59G Cpa
h tZ cv 2.60
CpgPd

42
with boundary conditions:
T (O,Z) Ta ao
T (Y,O) = Tg go
The exact solution of Equations 2.57 and 2.58, as presented by Schumann,
is:
T - Ta go
T - Tao go
-Y-Z= e
a::
l: Zn N (YZ)n
2.61n=o
a::T - T -Y-Z z Zn M (YZ) 2.62g go = e nT - T n=lao go
wheredn M (YZ)
0M (YZ) = (YZ)nn d
M (YZ)o I (2 vYz)0
(YZ)2 (YZ)31 + YZ + + + .....
2! 3!2.63
I (2 IY:Z) is a modified Bessel function of first kind and zeroth order.o
The heat transfer coefficient was determined by comparing the
experimentally determined results with these analytical solutions.
An insulated aluminium cylinder 15 em diameter and 30 em long,. . .used as the sample conta1ner,was mounted on a rectangular box serv1ng as
a mixing chamber. The whole set was placed on an Avery balance. The

43
schematic diagram of the experimental set up is shown in Fig. 2.14
and the experimental cylinder 1S shown in Fig. 2.16. Malt grain was used
to fill the cylinder up to 24 cm. Shielded thermocouples were placed
at 6 cm, 12 cm, and 18 cm to measure air temperature. In addition,
shielded thermocouples were used to measure inlet and outlet temperatures.
Malt grains were dried to equilibrium moisture content with an
air stream and then cooled to room temperature by placing the grains inside
two thin plastic bags for at least 48 hours. A dummy insulated cylinder
filled to the same depth of malt was placed on the rectabgular box and air
at the temperature and relative humidity used to dry the original sample
was blown up through the dummy malt grains. It took about two hours to
stabilise the temperature and relative humidity of the air. After the
heated air temperature and relative humidity had stabilized, the dummy
container was quickly replaced with the experimental container and the air
temperatures were recorded at one minute intervals on the data logger. The
recording was continued for about 30 minutes. A total of nine runs were
performed at a flow rate ranging from 0.35 to 0.62 kg/m2/s and air
temperatures ranging from 50.8 to 70.8 °C.
The method to calculate heat transfer coefficient requires the
comparison of the air temperature at different times and depths from the
inlet. The theoretical curves for non-dimensional air temperature were
plotted against the logarithm of Z for several values of Y on tracing paper.
The experimental nondimensional air temperatures at a particular position
were then plotted against the logarithm of time on separate paper and the
tracing paper containing the theoretical curves was placed on it. The
theoretical curves were shifted along the time axis of the experimental

44
curves until the experimental curve lined up with one of the theoretical
curves. The Y value of the theoretical curve that lines up with the
experimental curve was used to calculate heat transfer coefficient from
Equation 2.59. This procedure was repeated for each of the runs.
2.7.3 Results and Discussion
Calculated heat transfer coefficients are shown in Table 2.8·
Fig. 2.17 shows the theoretical non-dimensional air temperatures for
different values of Z and for values of Y ranging from 2 to 16. The
comparisons between the experimental non-dimensional air temperatures and
theoretical non-dimensional air temperatures are shown 1n Figs. 2.18 to
2.26, for the nine runs of experiments conducted. It is obvious from
these figures that the agreement between the experimental and theoretical
curves is good. The heat transfer coefficients appeared to be a function
of mass flow rate of air and the following regression equation was developed:
h = 49.32 x 10³ GO.6906cv(r2 = 0.90)
2.64
The regresslon line along with experimental data 1S shown in Fig. 2.27.
The heat transfer coefficients were determined under isomoisture
condi tions . To check the validity of the isomoisture condition the reading
of the balance was checked during experimental runs. No noticeable change
was observed in the balance reading. Changes of 2 g could be detected
on the balance. This confirms that the error due to moisture transfer was
negligible.
45
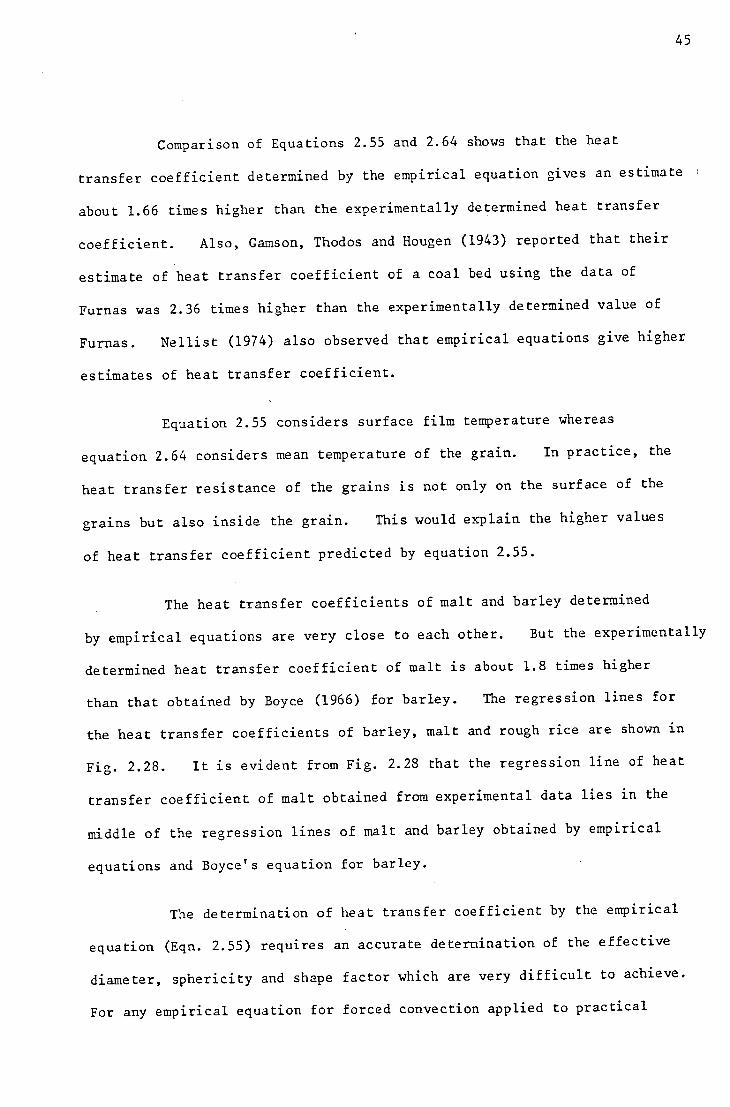
Comparison of Equations 2.55 and 2.64 shows that the heat
transfer coefficient determined by the empirical equation gives an estimate
about 1.66 times higher than the experimentally determined heat transfer
coefficient. Also, Gamson, Thodos and Hougen (1943) reported that their
estimate of heat transfer coefficient of a coal bed using the data of
Furnas was 2.36 times higher than the experimentally determined value of
Furnas. Ne11ist (1974) also observed that empirical equations g~ve higher
estimates of heat transfer coefficient.
Equation 2.55 considers surface film temperature whereas
equation 2.64 considers mean temperature of the grain. In practice, the
heat transfer resistance of the grains is not only on the surface of the
grains but also inside the grain. This would explain the higher values
of heat transfer coefficient predicted by equation 2.55.
The heat transfer coefficients of malt and barley determined
by empirical equations are very close to each other. But the experimentally
determined heat transfer coefficient of malt is about 1.8 times higher
than that obtained by Boyce (1966) for barley. The regression lines for
the heat transfer coefficients of barley, malt and rough rice are shown in
Fig. 2.28. It is evident from Fig. 2.28 that the regress~on line of heat
transfer coefficient of malt obtained from experimental data lies in the
middle of the regression lines of malt and barley obtained by empirical
equations and Boyce's equation for barley.
The determination of heat transfer coefficient by the empirical
equation (Eqn. 2.55) requires an accurate determination of the effective
diameter, sphericity and shape factor which are very difficult to achieve.
For any empirical equation for forced convection applied to practical

46
problems, Kreith (1973) has mentioned that the accuracy of a heat
transfer coefficient predicted from any available equation or graph may
be no better than 30 per cent.
Physically the high value of the heat transfer coefficient
of malt in comparison with that obtained by Boyce for barley may be
attributed to the following facts. Partial degradation of the endosperm
and cell walls, and breakdown of hulls may be considered to increase
the effective surface area of malt grain. Again the specific heat of
malt was found to be higher than that of barley. Finally, the heat
transfer coefficient of barley was determined from a thin layer isomoisture
condition rather than a packed bed isomoisture condition. In order to
determine the heat transfer coefficient, Boyce used an inverted funnel-
like attachment terminating in a small insulated box, enclosing a thermocouple
which could be closed at either end and was push fitted over the top of the
shallow drying box. He placed grain which had been dried to the equilibrium
moisture content of the drying air and then cooled in a sealed container
to ambient temperature in the drying tray and placed the special funnel over
it. Heated air at a known rate was then forced through it for a given time
after which the assembly was removed and the top of the funnel closed with
an insulated plug. The assembly was then inverted, the drying tray removed
and the bottom of the insulated box was closed by an insulated plug. During
this procedure the temperature inside the box was continuously recorded by
the thermocouple and the highest reading after the box was closed was
considered to be the grain temperature. It is apparent that there was some
heat loss during the removal of the tray and closing the insulated box.
The moisture content range for Boyce's work was very similar to the range
for malt and this would therefore not account for the difference.

47
Chapter 3
THIN LAYER DRYING OF MALT
Thin layer drying equations and expressions for the drying
parameters as a function of drying conditions are required for the
mathematical modelling of the deep bed drying of malt. This chapter
deals with:
(1) thin layer drying of malt under controlled conditions of
temperature and relative humidity
(2) development of thin layer drying equations
(3) development of expressions for drying parameters.
3.1 Thin Layer Drying Equations
Two general approaches to the study of thin layer drying of
cereal grains are
(1) the development of empirical equations
(2) the development of theoretical or semi-theoretical
equations.
The theoretical approach concerns either the diffusion equation or the
simultaneous heat and mass transfer equations. The semi-theoretical
approach concerns approximated theoretical equations. The main
justification for the empirical equation is a satisfactory fit to all
experimental data and subsequent benefit 1n describing deep bed drying
of gra1ns. The reasons for using theoretical equations are to give
some physical explanation and understanding of the transfer process.
The approximated equations are simpler and take less computing time
in comparison to the theoretical equations and provide some understanding
of the transfer process.

43
Based on the differential equation for diffusion and making
certain approximations, Lewis (1921) derived the following expression
for drying under constant conditions.
In ( M - He ) =
M - Mo e
- kt 3.1
Hukill (1947) observed that the rate of moisture loss is approximately
proportional to the difference between the moisture content of the grain
and the equilibrium moisture content for corn and sorghum. Several
investigators (Simmonds, Ward and McEwen, 1953, Q'Callaghan, 1954, Hall
and Rodriguez-Aris, 1958, Boyce, 1966, Kachru, Ojha and Kurup, 1971, and
Watson and Bhargava, 1974) have proposed the following equation for wheat,
rice, barley and shelled corn.
M - Me = exp (-kt) 3.2M - Mo e
The above equation was based on the assumption that all resistance to
drying is at the outer layer of the kernel.
Page (cited by Hall, 1970, and Van Rest and Issacs, 1968),
proposed the following empirical equation for shelled corn
M - Me u= exp (kt ) 3.3
M - Mo e
Several investigators (White, Ross and Westerman, 1973, Matouk, 1976,
Misra and Brooker, 1980, and White, Bridges, Loewer and Ross, 1981) have
reported that the Page equation adequately predicts the thin layer drying

49
of shelled corn and soybeans. Van Rest and Issacs (1968) investigated
exposed layer drying rates of shelled corn, wheat and oats for a variety
of conditions. They found that the basic logarithmic model proved
moderately adequate for wheat, but it failed to provide adequate fit
for corn. The Page equation described the experimental data better
than the logarithmic model for each of the crops. They tested the
following form of the equation
H - Mep - q log t 3.4
M - Mo e
They found that this equation is more useful than the logarithmic model.
Troeger and Hukill (1971) developed the following model for shelled corn
dMdt
a= -k (M - M )e 3.5
where
a = arbitrary constant.
They also observed that the use of three regions rather than a single
region allows a good fit of the entire drying curve. Thompson, Peart
and Foster (1968) developed the following second order differential
equatibn for corn
t Aln (MR) + B {In (MR) )2 3.6
where
t time in hours
A = -1.862 + 0.00488 TB = 427.4 exp (-0.033 T)
T . a= temperature ~n F

50
They found reasonable agreement with experimental results for the
wide range of temperatures used.
Hussain, Chen and Clayton (1973) applied Luikov's equations
to the drying of rough rice and found that the prediction agrees well
with the experimental data. Fortes, Okos and Barret (1981) analysed
wheat drying and rewetting by applying a model based on non-equilibrium
thermodynamics. The proposed model predicted single kernel drying
rates and centre temperatures in the dry bulb range between 26.7 and
87.8°C and moisture contents between 0.1 and 0.35 dry basis. Fortes
and Okos (1981) developed a set of transport equations incorporating
both the mechanistic and non-equilibrium thermodynamic approaches to
heat and mass transfer in porous media. A comparison between the non-
equilibrium thermodynamic equations and those obtained from the
mechanistic viewpoint led to the evaluation of the phenomenological
coefficients. They found the model gave good predictions of drying
and average kernel temperature in a broad range of drying conditions
(26.7 to l500C) for corn.
Babbit (1949) appears to be the first to apply the diffusion
'equation to data for agricultural crops. Chu and Hustrulid (1968)
developed numerical solutions of the diffusion equation for a spherical
solid, when the diffusion coefficient is concentration dependent, and
applied these numerical solutions to the analysis of the experimental
data for shelled corn. They demonstrated that the drying can be
predicted with good accuracy for known air temperature, relative humidity
and known initial moisture content. Pabis and Henderson (1961) have
shown that a three dimensional equation of internal diffusion with

51
diffusion coefficient variable with time describes the drying curve
very well for shelled yellow maize dried in a single kernel layer.
They found that the equation of internal diffusion for a sphere gives
satisfactory results. Nellist (1976) fitted four alternative equations
to the experimental data for ryegrass seeds. These equations are the
single exponential equation, diffusion equation for a sphere, the
equation of diffusion through an infinite plate and a two term exponential
equation. The two term exponential gave the best fit but acceptable
results were given by the series equation of diffusion through an infinite
plate. The two term exponential equation gave the best fit, because this
equation has more flexible shape and more degrees of freedom than that
of the series equation for either the infinite plate or sphere.
Chinnan and Young (1977) considered peanut pods as two concentric
shells - kernel and hull. They applied the mathematics of diffusion
considering liquid, vapour and both liquid and vapour diffusion. The
liquid diffusion model was found to gLve a better fit with experimental
data for thin layer drying than the vapour diffusion model. They observed
that the vapour-liquid diffusion model gives a better fit to experimental
data than either the liquid diffusion or vapour diffusion models. Ingram
(1976) applied a liquid diffusion model to moisture transfer in grains and
developed a series method of finite difference solution of the diffusion
equation. This method is a more accurate representation of the solution
than would be possible with the finite difference method, and also facilitates
their incorporation into the system of deep bed drying equations. Wang
and Singh (1978) applied four equations for single layer drying of rough
rlce. These models are the single exponential equation, diffusion equation

52
for a sphere, Page equation and Thompson's quadratic equation. They
observed that the diffusion model gave the worst fit and Thompson's equation
was found to be the best. Steffe and Singh (1980) have applied the
mathematics of diffusion for rough r1ce. They considered rough rice
as three concentric shells - endosperm, bran and hull. Good agreement
was found with experimental observations.
Sharaf - Eldeen, Hamdy and Keener (1979) developed a two term
exponential equation in the following form
M - Me A exp (-kt) + (1 - A) exp (-Bkt) 3.7M - Mo e
They observed that the two term exponential model adequately describes
the drying behaviour of fully exposed shelled corn, rough rice and soybeans.
They also observed that the Page equation gives a better description than
the basic logari thmic model. Sharaf - Eldeen, Hamdy and Blaisdell (1979)
found that a two term exponential model adequately describes the drying
behaviour of ear corn and shelled corn over the entire drying period.
The logarithmic drying model and its modified form fail to describe the
drying behaviour for ear corn and shelled corn throughout the entire drying
period.
Sharma, Kunze and Tolley (1982) developed a two term exponential
model for rough rice and explained rough rice drying more logically by
considering the drying equation to be a two compartment model. This two-
compartment model is similar to Nellist's two term exponential model in
all respects.

53
3.1.1 Theory
The physical mechanism of drying 1n capillary porous products
such as cereal grains is quite complicated and it is not yet well
understood. It is generally agreed that the moisture within a grain
kernel moves in the form of a liquid and/or vapour. A number of
physical mechanisms have been proposed to describe the transfer of
moisture in cereal grains (Brooker et al. 1974).
(1) liquid movement due to surface forces (capillary flow)
(2) liquid movement due to moisture concentration differences
(liquid diffusion)
(3) liquid movement due to diffusion of moisture on the pore
surfaces (surface diffusion)
(4) vapour movement due to moisture concentration differences
(vapour diffusion)
(5) vapour movement due to temperature differences (thermal
diffusion)
(6) water and vapour movement due to total pressure differences
(hydrodynamic flow)
Luikov (1966, 1980) developed the following equations for\
describing the drying of capillary porous products based on the physical
mechanisms mentioned above.
aM \j2 KllM \jZ K1ZTg2
+ + \j K13
Pat
aT 2 \j2 Z--g = \j K21M + K22Tg + 'iJ K23Patap 2 z z
'iJ K31M + 'iJ K32Tg + 'iJ K3lat
3.8
3.9
3.10

54
The moisture flow due to a total pressure gradient is not significant
~n the temperature ranges employed in cereal gra~n drying. When there
is no gradient of total pressure, the system of differential moisture
transfer equations will take the form
aM 2 2at = 'iJ KllM + 'iJ K12Tg
aT 2 2_J_ = 'iJ K21M + 'iJ K22Tgot
3.11
3.12
The system of equations 3.11 and 3.12 is the most general system of
equations. It is valid not only for drying processes but also for any
type of moisture transfer.
Thermal diffusion ~s negligible for cereal grains and may be
assumed to be zero. Again the contribution of 2'iJ K21M to3.12 become
aT-gat
~s
also negligible. Therefore, equations 3.11 and
= 3.13
aT-gat 3.14
For cereal grains the thermal diffusivity ~s large compared to moisture
diffusivity. Neglecting the temperature gradient leads to the following
general equation of diffusion based on Fick's law.
3.15
The diffusion equation 3.15 can be expressed 1n terms of the nomenclature
of vector analysis as

55
div (D grad M)v
3.16
where the transfer coefficient Kll is called the diffusion coefficient.
Sherwood (1931) and Newman (1931) suggested that the physical mechanism
of drying is diffusion as described by Eqn. 3.16 and solved for different
shapes of solids.
The solutions of the diffusion equation (3.16) in cartesian,
spherical and cylindrical coordinates have been discussed in detail by
Crank (1979). Thus, the solution for a sphere is
0:M - M 6 1e i:= n2 2"M - M n=l n0 e
2exp ( - nD n 2v
2rt) 3.17
and the solution for a plane sheet of half thickness, Z 1S
0: n2M-M 8 1 2 De L v t)=n2
exp ( -(2n-l) -;z2M - M (2n-1)0 e n=l
3.18
This equation converges rapidly because of the omission of alternate
terms. If only the first term of either Eqn. 3.17 or 3.18 is considered,
each of these equations can be approximated to the form
M - He = a exp (-kt) 3.19M - Mo e
when a = 1, this equation reduces to the equation 3.2.

56
Green malt contains high moisture content and the aleurone
layer and cell walls are degraded (Pomeranz, 1972). In addition, the
rate of drying is also influenced by the previous history of steeping
and germination. It is also quite reasonable to assume that the thermal
diffusivity is large compared to the moisture diffusivity for malt.
Considering all these factors, it was proposed to develop the thin layer
drying equation in the following forms
M-M e = exp (-kt) 3.20M - Ho e
3.21
M - Me u= exp (-kt ) 3.22
M - Mo e
The first two equations are approximated diffusion equations and the
third one is an empirical equation (Page equation).
Repeated solution of the thin layer drying equation ~s the
whole basis of deep bed drying simulation. The complicated equations
might give greater accuracy but ;ill take much more computing time.
A compromise should be made between the degree of accuracy required and
computing time. Thus, the first choice always should be the simpler
equation if the prediction is reasonably good.
3.2 Drying Parameters
Moisture content at any time can be predicted by any of the
proposed equations if the drying parameters such as drying constant and
dynamic equilibrium moisture content are known. Thus, an accurate
determination of the drying parameters is necessary for better prediction
of the equations.

57
3.2.1 Drying Constant
O'Callaghan (1954) observed that drying constant ~s independent
of the relative humidity of drying air but is dependent on air temperature
for wheat in the temperature range, 80 - l50oF. He proposed an equation
for drying constant in the form
k = A exp (BT) 3.23
Subsequently O'Callaghan, Menzies and Bailey (1971) modified it into the
form proposed by Henderson and Pabis (1961). Henderson and Pabis
proposed that the drying constant could be expressed by an Arrhenius type
equation of the form
fk = d exp (- IT) 3.24
They verified the relationship with experimental data on wheat and maize.
Boyce (1966) has shown that the drying constant of barley is highly
correlated to air temperature in the form proposed by Henderson and Pabis.
Nellist (1974) observed that inclusion of the initial moisture content and
air humidity in the form
k = a exp (b T + cH + dM ) .a 03.25
improves the fit for the drying of ryegrass seeds but these factors are
not as important as the air temperature. Allen (1960) and Westerman,
White and Ross (1973) observed that air temperature and relative humidity
affect the drying constant of paddy rice and shelled corn. Greig (1971)
has shown that the drying constant of barley is highly correlated to the
difference between air temperature and the dew point temperature of the air
in the temperature range, ambient to 60oc.

58
Moisture is assumed to be contained in small grains as adsorbed
moisture, i.e. held in the system by molecular attraction, being more
closely linked with adsorbing substance and therefore being held more
firmly. The general term sorption is used to denote such interaction.
The term adsorption and desorption are used specially to denote the process
of taking up or giving off of moisture. The energy required to desorb
moisture can be considered analogous to the energy of chemical reaction
and an Arrhenius type equation would apply. This empirical equation is
k = a exp (-b/(273.15 + T ) )a
3.26
The temperature in equation 3.26 actually refers to gra~n temperature.
Since the temperature difference is not significant after a short transient
period and the measurement of drying air temperature is relatively simple,
drying a~r temperature has been used in the thin layer determination of k.
3.2.2 Equilibrium Moisture Content
The equilibrium moisture content of a cereal gra~n is defined as
the moisture content of the material after it has been exposed to a
particular environment for an infinitely long period of time. The equilibrium
moisture content is dependent upon the relative humidity and temperature
conditions of the environment as well as on the species, variety and maturity
of the gra~n. The concept of dynamic equilibrium moisture content was
introduced by McEwen, Simmonds and Ward (1954). The concept of dynamic.
equilibrium moisture content is a hypothetical one and has been doubted by
Chu and Hustrulid (1968). However, they have suggested that it may represent
some average of surface moisture content over a certain period. Dynamic
equilibrium moisture content is obtained by the best fitting of the thin

59
layer drying equations to experimental data, whereas static equilibrium
moisture content is obtained after a long term exposure to a constant
admosphere. McEwen, Simmonds and Ward further suggested that dynamic
and static equilibrium moisture content should be used for drying and
storage design respectively. Allen (1960) also mentioned that the
dynamic equilibrium moisture content is a logical choice for the grain
drying process, but the static equilibrium moisture content is more
relevant for storage problems.
Smith (1947) has shown that the final portion of the water
isotherms of biological materials such as starch and cellulose are
described by the following equation
Msw = Mb - bIn (l-rh) 3.27
where ~ is the bound moisture content and b is a constant. He has shown
that Eqn. 3.27 fails to take into account the progressive enlargement of
the effective sorbing surface of the gel which accompanies swelling when
moisture content is expressed on a dry basis. He also demonstrated that
the plot of moisture content (w.b.) vs. -In (l-rh) is linear between
relative humidities of 0.5 to 0.95 for cellulose. Becker and Sallans
(1956) have shown that the Smith equation is applicable for desorption
isotherms of wheat for the relative humidity range 0.5 to 0.95, when
moisture content is expressed on a wet basis.
Henderson (1952) proposed the following semi-empirical model
for the equilibrium moisture content of cereal grains
I - rh n= exp (-CTMsd) 3.28

60
Henderson's equation, ~n the form described above, has been found
inadequate for cereal grains (Pichler, 1957, and Brooker et al. 1974).
Day and Nelson (1965) modified Henderson's equation to describe wheat
1 - rh 3.29
w~ere a and b are functions of temperature.
Strohman and Yoeger (1967) proposed the following equation
to represent the equilibrium relative humidity of corn at various moisture
content
rh = exp (a exp (bMsd) In Ps + c exp (dMsd) ) 3.30
This equation was valid over the whole range of moisture content, relative
humidity and temperatures.
Chung and Pfost (1967) developed the following equilibrium
moisture content equation based on potential theory and a simplified
equation of state
-AIn (rh) =
(R T b)o a
3.31
This equation assumes that the free energy function or useful work decreases
exponentially with the increasing thickness of adsorbed layer and the
adsorbed layer is directly related to moisture content. The Chung and
Pfost equation fits grain equilibrium moisture content data well over the
20 to 90% relative humidity range. Gustafson and Hall (1974) have shown
that the constants A and B are temperature dependent for shelled corn.

61
Q'Callaghan (1954) proposed the dynamic equilibrium moisture
content equation for wheat in the following form
~df + g 3.32
This equation cannot predict equilibrium moisture content at extremely
high relative humidities. Nellist (1974) used the modified Smith
equation for dynamic equilibrium moisture content of ryegrass seeds in
the following form
Mdd = a -b In T - c In (l-rh)a
3.33
This equation gives weaker correlations than that g~ven by the Smith
equation, but this modification is justified for the inclusion of the
temperature effect.
Pixton and Howe (1983) examined the suitability of the following
equations for cereals and other products
(1) BET Equation (Brunaur, Emmet and Teller Equation)
(2) Iglesias and Chirife Equation
(3) Harkins and Jura Equation
(4) Smith Equation
(5) Chung and Pfost Equation
(6) Halsey Equation
(7) Henderson Equation.
They observed that the Chung and Pfost formula g~ves an excellent
fit to the observed data relating moisture content and equilibrium relative
humidity data of tapioca starch and can be used to fit the relationship

62
using only three experimental points between 25 and 70% relative humidity.
They also found that the Chung and Pfost equation is adequate for
representing the moisture content/equilibrium relative humidity relationship
for cereal grains between 20 and 90% relative humidity and the lines for
cereal grains at different temperatures are reasonably parallel. None
of the other transformations were found suitable for cereal grains, but the
Henderson equation was suitable for flour. They maintained that "only
the Chung and Pfost transformation can be used for cereals".
Tuerlinckx, Berckmans and Goedseels (1982) determined the
equilibrium moisture content of malt, variety Carina, by using saturated
salt solutions for the temperature range 15 - SOOC and drying in thin layerso 0for 4 to S days for temperatures of 70 C and 90 C. They applied the
Henderson equation, modified Henderson equation, Day and Nelson equation,
and Chung Pfost equation to the data of malt. They observed that the
residual sum of the squares for fitting the Chung Pfost equation was lowest
but still rather high. They developed an empirical equation for equilibrium
moisture content of malt into the form of
[CI
exp --T·a
[exp (CS rh) -lJ 3.14
This equation ~s for static equilibrium moisture content and their
determination of moisture content does not conform with the recommended
method of the Institute of Brewing. However, their experimental results
show that the prominent effect of temperature on equilibrium moisture content
is at low relative humidity for temperature variations of 15 - SOoC.
Their results are not ~n good agreement with that of Pixton and Henderson
(1981), especially in this range.

63
3.3 Thin Layer Drying Apparatus
Thin layer drying should be conducted under controlled
conditions of air temperature, relative humidity and air flow rate.
An apparatus was therefore needed for the purpose of providing these
required conditions. The experimental thin layer drying equipment
available ~n the department of Agricultural Engineering has been
described in detail by Greig (1971). For the purpose of the present
work it was necessary to adapt this apparatus for thin layer drying of
malt. aMalt is dried at high temperatures (50 - 90 C) for both rapid
drying and structural changes in the grains. To meet this requirement
a new drying chamber was designed and constructed.
The schematic diagram of the apparatus is shown in Fig. 3.1.
To dry malt under controlled conditions of air temperature, relative
humidity, atmospheric air was supplied by a backward curved centrifugal
fan, A, through a pipe fitted with an orifice plate, B, to the bottom
of a glass tower packed with raschig rings, C. At the top of the tower
water was sprayed at the required dew point temperature of the air.
At the exit of the air from the tower dry bulb and wet bulb temperature
were measured. The air passing through the packed tower was approximately
saturated and was heated to the required temperature by an electric heater,
D. The air was then passed through the tray, G, containing a malt layer
of one grain thickness via gauze, E, and honeycomb flow straightener, F.
The tray was suspended from a balance, H, in an oil bath. The balance was
capable of producing an electric signal in proportion to the weight suspended
from the balance. The apparatus is shown in Figs. 3.2 to 3.4.

64
3.3.1 Moisturising Column
The moisturising column consists of a vertical glass tower
packed with raschig rings. The desired air condition may be defined
by dew point temperature and dry bulb temperature. The desired dew
point temperature of the air was obtained by passing the air through
the packed tower from the bottom and water was allowed to pass down the
tower in the opposite direction to the air so that the air was humidified.
The desired dew point temperature of the air was obtained by controlling
the temperature of the water being passed down from the top of the tower.
The water was circulated to the tower from a 70 gal. insulated tank and
the water temperature was maintained by a thyristor activated control
unit. A refrigeration unit whose evaporator was located in the tank was
used to cool the water, so that dew point temperatures below the ambient
temperature could be obtained. This unit works in opposition to the
heating coil in the tank, the latter maintaining the set dew point
temperature.
3.3.2 Drying Chamber
The drying chamber consists of an inner cylinder of 230 rom
diameter suspended in an oil both from an electric balance and supporting
the tray containing the sample to be dried. The outer cylinder causes
the air leaving the grain to flow down through an annular space between
the two cylinders. This a1r was further ducted through the annular
space between the p1pe and a polythene tube. This arrangement ensures
minimum heat loss from the chamber and a portion of the upstream piping.
The rest of the p1pe was insulated. As the plastic frame tray was found
to melt down at high temperature, the inner cylinder and the tray frame

65
were made of aluminium to make the system lighter and suitable for
high temperature drying. The total weight of the inner cylinder and
the tray with nylon net was approximately 935 g. The balance had a
total weight capacity of 1000 g with 900 g tare capacity. To lncrease
the tare capacity of the balance, the top of the balance was removed,
giving a tare capacity of 1400 g.
3.3.3 Instrumentation and Accuracy
A number of checks were made to determine the accuracy of the
apparatus. These will be discussed under the following headings:
the continuous weighing system, temperature, air flow and moisture content.
The Continuous Weighing System
A tray containing a range of weights was suspended from the
balance and heated air was passed through the tray. The outputs of
the balance were recorded by the data logger. The weight change and
the recorded output in mV was found to be linear with a standard error
of 0.235 g. Unfortunately, during the first nine experiments some
random fluctuation in the balance reading was observed due to zero shifting
of the balance. The balance was checked and repaired. The accuracy of
the balance was again tested (Table 3.1). Weight change and recorded
output in mV was found to be linear. The standard error of weight change
was found to be 0.015 g. To check the zero shift, a constant weight was
suspended from the balance and the balance output was recorded at five
minute intervals for about 20 hours.
reading was observed (Fig. 3.5).
Very little change in the balance

66
Temperature
An IMP data logger was used and the accuracy of the analogue+to digital converters of the data logger is - 0.05% f.s.d. The f. s.d.
used was 10 mV for all the recording on the data logger with an error
of ~ 0.005 mV, which is equivalent to 0.12°C when using Copper/Constantan
thermocouples. To check the suitability of the data logger to record
thermocouple outputs in mV the following test was conducted.
The hot junction of a thermocouple and calibration thermometer
(graduated 1/10 of IOC) were placed in well stirred water bath. Thermo-
.couple outputs were simultaneously displayed by the data logger and a
digital voltmeter and at the same time the thermometer reading was noted.
The temperature of the water was lowered gradually and the whole procedure
was repeated. The millivolts were converted into degrees centigrade
by interpolation using standard data. The results are shown in Table
3.2. The standard error of the data logger and digital voltmeter compared
with the thermometer were found to be 0.3230C and 0.542oC respectively.
The standard error of the data logger compared with the digital voltmeterowas found to be 0.127 C. All the temperature outputs were recorded ~n
millivolts and converted into degrees centigrade by fitting a spline to
the British Standard data (BS.4937: Part 5: 1974).
Air Flow
Air flow was measured by an orifice plate and an inclined
manometer. An orifice plate of 2 inches diameter was set in the air
supply pipe of 4 inches diameter. The flow rate was calculated according
to the British Standard (1042: Part 1: 1964). Several researchers
(Sharaf - Eldeen et al. 1981, and White et al. 1981) have reported that

67
the drying rate becomes independent of a1r velocity if the velocity
exceeds 0.25 m/sec. The velocity was maintained constant for each
thin layer experiment between 0.250 m/sec and 0.275 m/sec. The
accuracy of the measurement of pressure drop across the orifice was+- 0.5 romof water.
Moisture Content
All moisture contents were determined by the method
recommended by the Institute of Brewing (Appendix 3.1).
3.4 Procedure
Thin layer drying experiments were conducted under controlled
conditions of air temperature and relative humidity covering the whole
range of drying operations. Some of them were replicated to check
the degree of experimental error.
Green malt used in this study was sent from Grantham and it
was collected within 5 hours. The collected sample had a moisture
content between 60% (d.b.) and 80% (d.b.) Samples were sent in sealed
containers and were stored in the sealed container in a domestic
refrigerator. Each lot was used for thin layer drying experiments
within three days of arrival.
All thin layer experiments were carried out with the variety
Triumph. Before starting any experiment the instrumentation system was
checked carefully and the whole of the apparatus was operated with a
dummy grain tray.for at least two hours to stabilize the air temperature,
relative humidity and air flow rate. When the whole system was

68
stabilized, one randomly selected sample of 100 g of malt was placed
evenly on the drying tray and another 100 g o~ randomly selected sample
was placed in three previously weighed petri'dishes for moisture content
determination. The dummy tray was quickly replaced by the sample tray
and the data logger was switched on to record air temperature below
the grain tray, dry bulb and wet bulb temperature at the top of the tower,
water temperature in the tank and the change in weight of the experimental
sample. The data logger was programmed to record the change in weight
at 1 minute intervals and temperatures at 5 minute intervals for drying
air temperature of approximately sooc and above. For drying airatemperatures below 50 C, the data logger was programmed to record the weight
change at 5 minute intervals and temperature at 10 minute intervals. The
results were recorded on a strip printer. The experiments were continued
for 3 - 10 hours for high temperature (> SOoe) and 20 hours for lowotemperatures (> 50 C). At the completion of each thin layer drying
experiment, final moisture content was determined.
3.5 Data Processing
The temperatures were recorded in mV using copper/constantan
thermocouples and the change in weight in the balance was also recorded
in mV. The data on air temperature just below the tray containing the
grain, the dry bulb and wet bulb temperatures at the top of the tower, and
the change in weight in the balance were recorded by the data logger on the
strip printer. The data was converted into the following forms.
(1) The balance reading was converted into moisture content (d.b.)
(2) The temperature data in mV was converted into degrees centigrade
(3) Relative humidity was calculated from the air temperature below
the grain tray and the dew point temperature at the exit from
the saturation column.

69
A FORTRAN program was written to convert the data recorded ~n mV
into temperature, relative humidity and moisture content. Flow chart
and the program with a typical run of experiment are given in Appendix
3.2.
Calculation of Hoisture Content
The weight on the balance at any time can be calculated from
the following relationship
W = Wt 0
(Wo
-Wf)
(Yo - Yf)
3.35
where
W weight at time, ttW = initial weight0
Wf = final weight
Y = balance reading at time, ttY = initial balance reading0
Yf = final balance reading
Dry weight of the sample was assumed constant and was determined from
initial weight of the sample and initial moisture content (d.b.).
Moisture content at any time of the experimental run was calculated from
the relationship
3.36

whereM = moisture content (d.b.) at any time, tt
Wd weight of dry matter of the sample
Calculation of Relative Humidity
70
The relative humidity was calculated by using the mathematical
model proposed by Lerew (Brooker et a1. 1974). This model is valid for
The following relationships were used
pws
234
[p + P T + P2·Tdb + P3 Tdb + P4 Tdb6894 .76 F exp ~o__ ·_l~·...:d:.::b__ =--_:"';_-_':"___;:";2~-__;_-::.::...-J
P5 Tdb - P6 Tdb3.37
P = 6894.76 Fw
RHPw
=Pws
where
P saturated vapour pressure of the drying air, N/m 2=W's
P = saturation vapour pressure at dew point, N/m2W''" = dry bulb temperature in oR.l.dbTdp deW'point . oRtemperature ~n
=P = -0.274055 x 10⁵°
PI = 0.541894 x 10²
P2 = -0.451370 x 10⁻¹
P3 = 0.215321 x 10⁻⁴
P4 -0.462027 x 10⁻⁸
P5 = 0.241613 x 10
P6 = 0.121547 x 10⁻²
F = 0.320618 x 10⁴
T 4+ P 4 dp ] 3.38
3.39

i'l
3.6 Data Analysis
The processed data was analysed in order to
(1) fit the proposed thin layer drying equations to the experimental
data to determine the constants
(2) determine relationships between the drying constants and drying
air temperature. This is equivalent to correlating with grain
temperature apart from the short period when the grain is heated
(3) define dynamic equilibrium moisture content as a function of air
temperature and relative humidity.
3.6.1 Curve Fitting
The proposed equations in section 3.1.1 were fitted to the
experimental data by the Modified Gauss - Newton Method proposed by
Gill and Murray (1978). They developed a comprehensive modified Gauss -
Newton algorithm for finding an unconstrained minimum of a sum of squares
of m non-linear functions in n variables (m4n) whose first derivatives
are known.
Fortunately, the modified Gauss - Newton algorithm for finding
the unconstrained minimum of a sum of squares of m non-linear functions in
n variables (m~ n) prograrmned in FORTRAN was available as the NAG library
subroutine E04GDF. The routine is applicable to problems of the form
Minimize F (X)ml: [f i (X) 12i = 1
wheref. (X)~- = residuals
X

72
A subroutine must be supplied by the to calculate the values of
f.(X) and their first derivatives,1 -
useraf.1ax.1
at any point X.
From a starting point X supplied by the user, the routine(2) (3) .generates a sequence of points X ,! •••.•, WhlCh is intended to
converge to a local minimum of F(X). The sequence of points is given
by
3.41
where the vector, p(k) is a direction of search, and the vector, a(k)
is chosen such that F (!(k) + a(k) ~(k)) is approximately a minimum
with respect of a(k). The vector, p(k). used depends upon the reduction
in the sum of the squares obtained during the last iteration. If the
sum of the squares was sufficiently reduced then ~(k) is the Gauss -
Newton direction; otherwise finite difference estimates of the second
derivatives of f.(X) are taken into account.1 -
designed to ensure that steady progress is made whatever the starting
This method has been
point, and to have the rapid ultimate convergence of Newton's Method.
A FORTRAN program incorporating NAG library subroutine (E04GDF)
was written to evaluate the constants in the proposed thin layer drying
equations. The inputs to the program were moisture content (d.b.) and
time, and the starting values of the constants were supplied. Flow
chart and programmes with a typical example are given in Appendix 3.3.
Another FORTRAN program, incorporating a graphics package, was written to
plot the predicted curve and experimental points on one graph for each
of the proposed equations for thin layer drying. The program is glven
ln Appendix 3.4.

73
Standard Error of Estimate
The standard error of estimate is a measure of the average
discrepancy between the experimental points and the fitted curve. It
measure~ goodness of fit in the unit of dependent variable. To compare
the goodness of fit of each of equations 3.20 to 3.22, the standard
error of estimate cr, (%, d.b.) was calculated from the following equation
o/r. (M/ pred
M .)2obs 3.42
No. of date points
where
Mpred predicted moisture content
Mobs = observed moisture content
3.7 Results and Discussion
In the first set of experiments, 9 experimental runs were
conducted. There was random fluctuation in the balance reading due to
zero shift and buffeting effect of the air flow. Only the single
exponential equation was fitted to the experimental data. Summarised
results of the first 9 experiments are shown in Table 3.3. The second
set of experiments consisted of 22 experimental runs. The proposed
equations were fitted to the experimental data. The summar.isedresults
of the second set of experiments are shown in Tables 3.4 to 3.6. The
results of all the thin layer drying experiments are discussed under the
headings of thin layer drying equations, drying constant and dynamic
equilibrium moisture content.

74
3.7.1 Thin Layer Drying Equations
The single exponential equation was fitted to the first set
of 9 experiments by the method proposed in section 3.6.1. Although
the standard error of estimate of fitting the equation to the data was
high (mean standard deviation = 1.22% (d.b.) ), the overall fitting of
the equation was good. An example of the overall fitting of the
equation is presented in Fig. 3.6. This high standard error of estimate
may be attributed mainly to the fact that the zero of the balance was
shifting randomly after a certain time for short periods and later returning
to the original position. The fact was confirmed by operating the balance
without any load. The fitting of the single exponential equation to
this set of data suggested that it may be adequate to describe the thin
layer drying of malt.
The problem with the zero shifting was sorted out (see section
3.3.3) and the second set of 22 experimental runs were conducted covering
the whole range of drying conditions normally encountered in the malting
industry. The single exponential equation was fitted to 20 of the sets
of experimental data. The standard error of estimate was considerably
lower (mean value of standard error = 0.61% (d.b.). Two experimental runs
were abandoned because the period of the runs was too short to give the
proper shape of the drying curve. The Page equation was fitted to 17
experimental runs and the fitting was better than that of the single
exponential equation. The mean standard error of estimate was 0.46% (d.b.).
The double exponential equation was fitted to 8 experimental runs and the
best fitting was obtained by the double exponential equation with a mean
standard error of estimate of 0.30% (d.b.).~
The fitted curves and

75
experimental points for three experimental runs at three positions of
the experimental range are shown in Figs. 3.7 to 3.10. The results
of experimental runs 28 and 31 in Tables 3.4 to 3.6 and in Figs. 3.9 and
3.10 illustrate the good agreement between replicate experiments. Dynamic
equilibrium moisture contents for the single exponential equation and
the Page equation for high temperature drying were higher than final
moisture content (Figs. 3.9 and 3.10), but the dynamic equilibrium moisture
content for the double exponential equation is ~n good agreement with
final moisture content. It is worth noting that the overall fitting of
the equations was good.
The double exponential equation could not be fitted to all
experimental runs. The program failed to converge to all the experimental
runs mainly due to the fact that the program finds the local unconstrained
m~n~mum. In the case of fitting the double exponential equation there
was more than one mln~mum and the starting values caused convergence to
a minimum which is physically unrealistic but mathematically possible.
_-The double exponential equation always gave the best fit but
the drying constants did not show consistent effect of temperature and the
proportion of the two components was found to vary randomly (Table 3.6).
Because of this inconsistency and the partial failure of the program to
converge to the actual minimum, no further attempt was made to fit the
double exponential equation.
The resistance to the drying of malt may be explained in terms
of structural changes of malted barley as follows;
It has been observed by Pomeranz (1972) that
(1) The surface of aleurone cells in steeped barley is highly pitted.

76
(2) The walls of the aleurone cells are progressively degraded
during malting and kilning.
(3) The cell walls 1n the centre of the starchy endosperm of malted
barley break down partially.
(4) In the central endosperm of kilned barley malt, the cell wall
dissolution is extensive and is accompanied by mechanical
breakdown of the large starch grannules.
It has also been reported by McLeod (1967) that
(1) Pericarp-testa is semi-permiable to the passage of water and
the resistance to moisture transfer into and out of the corn
is abolished if pericarp-testa is removed.
(2) During germination the root sheath breaks pericarp-testa and
protrudes from the base of the corn.
From this experimental evidence, it is logical to assume that the resistance
to the drying is mainly in the pericarp-testa and partially in the starchyendosperm. The resistance offered by pericarp-testa and starchy endosperm
is influenced by the steeping and germination of malted barley. The
experimental evidence indicates that the main resistance to drying of malt is
in the pericarp-testa and this is confirmed by the fact that the single
exponential equation adequately fits the experimental data of malt. The Pageequation gives a slightly better fit than that of the single exponentialequation. These two equations were selected for the deep bed drying simulationof malt.
3.7.2 Drying Constant
The drying constant of malt was found to be function of drying air
temperature and the following Arrhenius type equation was fitted to theexperimental data on drying constant.
k = a exp (-b/(273.l5 + T ))a 3.43

77
Although several researchers (Boyce, 1966, Becker and Sallans, 1955,
and Pabis and Henderson, 1962) have discussed the importance of
correlating drying constant to the grain temperature, the measurement of
the malt temperature is extremely difficult during thin layer drying.
However, Pabis and Henderson (1962) have shown that grain comes to thermal
equilibrium with drying air temperature very rapidly (3 - 4 min.). It
1S relatively simple to measure alr temperature and in these experiments
it can be considered equal to grain temperature.
The following equation for drying constant was obtained by
correlating the drying constants of the first set of experiments to
drying air temperature
6 (-6725.02
) -1k = 9.5294 x 10 exp (min ) 3.44
273.15 + Ta
(r2 0.98)
The following equations were developed for the drying constants for the
second set of experiments
(1) The equation of drying constant for the single exponential
equation is given by
7k = 1.196 x 10 exp (-6819.52--)273.15 + Ta
-1(min ) 3.45
2(r = 0.96)
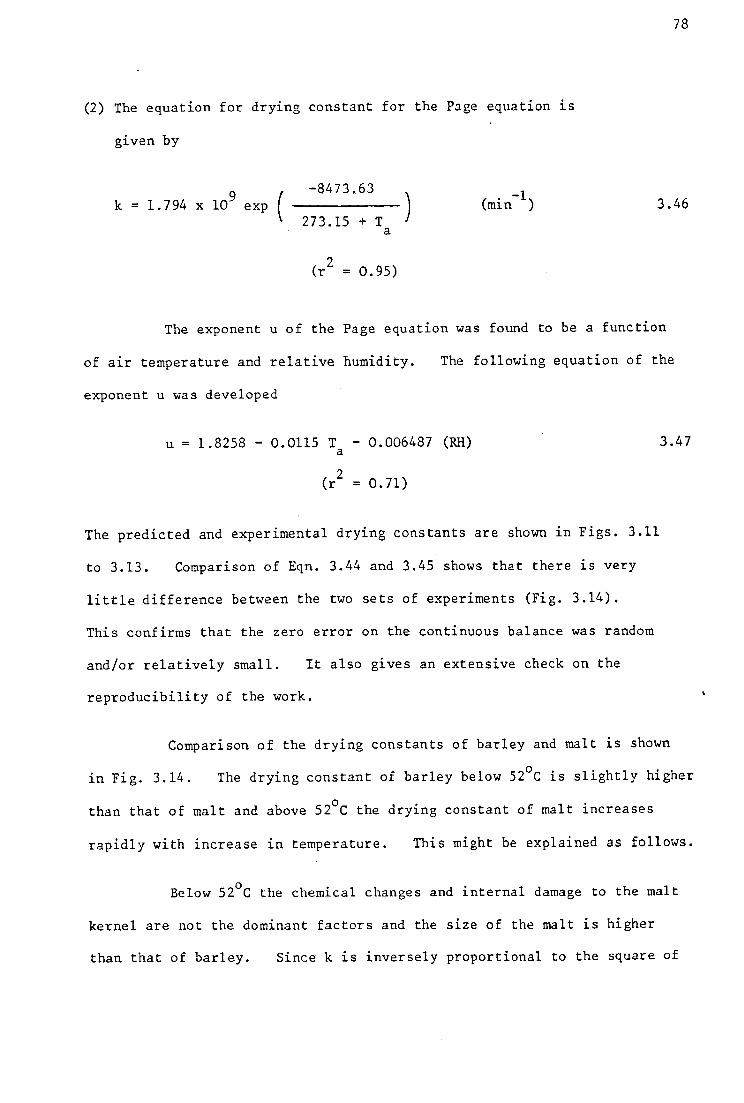
78
(2) The equation for drying constant for the Page equation ~s
given by
-8473.63k = 1.794 x 10⁹ exp ( ------ )
273.15 + Ta
-1(min ) 3.46
(r2 = 0.95)
The exponent u of the Page equation was found to be a function
of a~r temperature and relative humidity. The following equation of the
exponent u was developed
u 1.8258 - 0.0115 T - 0.006487 (RH)a
3.47
(r2 = 0.71)
The predicted and experimental drying constants are shown in Figs. 3.11
to 3.13. Comparison of Eqn. 3.44 and 3.45 shows that there is very
little difference between the two sets of experiments (Fig. 3.14).
This confirms that the zero error on the continuous balance was random
and/or relatively small. It also gives an extensive check on the
reproducibility of the work.
Comparison of the drying constants of barley and malt is shown
a.nFig. 3.14. The drying constant of barley below S20C is slightly higher
than that of malt and above 520C the drying constant of malt increases
rapidly with increase in temperature. This might be explained as follows.
Below S2°C the chemical changes and internal damage to the malt
kernel are not the dominant factors and the size of the malt is higher
than that of barley. Since k is inversely proportional to the square of

79
the characteristic dimension, the smaller gra~ns (barley) dry faster
than the malt. Above 520C the chemical changes and internal damage to
the malt kernel progressively increases and decreases the drying resistance.
The difference below 52°C is very small and the difference in drying constant
increases progressively with temperature due to progressively higher
structural changes in the malted barley.
3.7.3 Dynamic Equilibrium Moisture Content
Smith (1947) has suggested that equilibrium moisture content
expressed on a wet basis provides an approximate correction to the isotherm
equations for shrinking materials. Becker and Sallans (1956) have demonstrated
that the equilibrium moisture content for wheat on a wet basis is a linear
function of -In (l-rh) between relative humidity 0.50 to 0.95. Again the
derivation of the Chung and Pfost equation assumes that thickness of adsorbed
layer is directly related to the moisture content on a dry basis which is
only valid for non-shrinking materials. For shrinking materials it may be
better to relate the thickness of the adsorbed layer to the moisture content
on a wet basis. To provide an approximate correction for shrinking and include
the effect of temperature, the dynamic equilibrium moisture content of malt
on a wet basis was expressed as a function of temperature and relative humidity.
The modified Smith equation proposed by Nellist (1974), and the
Chung and Pfost equation (1967) were fitted to the dynamic equilibrium moisture
content data of the second set of experiments obtained by fitting the single
exponential equation and Page equation.. The values of dynamic equilibrium
moisture content g~ven by the fits of the single exponential equation and the
Page equation are plotted in Figs. 3.15 and 3.16 respectively. Since the
first set of experiments were conducted for a narrow band of relative humidity

80
and the balance reading caused higher values of standard error, .no
attempt was made to fit these equations for dynamic equilibrium moisture
content.
The following equations were obtained by fitting the modified
Smith equation
(1) For the data obtained from the fit of the single exponential
equation
= 5.87 - 0.0086 Ta - 5.349 In (l-rh) 3.48
(r2 0.88)
(2) For the data obtained from the fit of the Page equation
= 9.80 - 0.0609 T - 3.374 In (l-rh)a3.49
(r2 = 0.96)
The fitting of equations of this form was found to be less effective when
the moisture content was expressed on a dry basis. The equations for the
dynamic equilibrium moisture content show a shift in equilibrium moisture
content due to temperature in the direction normally observed, but the effect
of temperature is not significant in Eqn. 3.48. When the static equilibrium
moisture content of malt data from the report of Pixton and Henderson (1981)
was fitted to the modified Smith equation. an absence of temperature effect
similar to that of Eqn. 3.48 was observed (Fig. 3.17). Nellist (1974)
observed that the effect of temperature on the dynamic equilibrium moisture
content, derived from the fitting of the diffusion equation for a plane layer
to the data for ryegrass seeds, variety Sabel, is not significant.

81
The following equations were obtained by fitting the Chung
and Pfost equations
(1) For the data obtained from the fit of single exponential equation
In (rh) = [ -37357.91' ] (0 2999 M )exp -. dwR (273.15 + T )o a
3.50
(r2
= 0.84)
(2) For the data obtained from the fit of the Page equation
In (rh) -_ [ -49891. 20 ] ( 0 3320 M )exp -. dwR (273.15 + To a
3.51
(r2 = 0.94)
Both the Eqns. 3.50 and 3.51 show an absence of temperature effect similar
to Eqn. 3.48. An examination of the plots of the logarithm of the change
in free energy vs. moisture content of the isotherms for corn (Chung and
Pfost, 1967) reveals that these plots are almost parallel to one another.
This suggests that the Chung and Pfost equation might be modified in the
following form to include a further temperature effect
Md = a - b T b - c In [-R T b (In (rh) ]w a 0 a3.52
The following equation was developed for the dynamic equilibrium moisture
content for the data obtained by the fit of the Page equation
= 34.45 - 0.0201 (273.15 + T ) - 2.438 In (-Ra 0(273.15 + T ) In (rh) )a
3.53
(r2 = 0.95)

82
The fitting of equations of the form of Eqns 3.50, 3.51 and
3.53 were found to be less effective when the moisture content was
expressed on a dry basis. The comparison of the plots of the Eqns.
3.49 and 3.53 is shown in Fig. 3.16. The prediction of both equations
are comparable, but the modified Chung and Pfost equation gives the correct
shape of the experimental data reasonably well. Equations 3.50, 3.51 and
3.53 were chosen as the most effective description of dynamic equilibrium
moisture content.
Johnston (1954) measured the equilibrium moisture content of
malt during drying studies, employing air temperatures in the range 60oto 93.33 C. He also measured the equilibrium moisture content of barley
during drying. He plotted the equilibrium moisture content (w.b.) as a
function of restriction of vapour pressure (relative humidity). From
these plots he showed that the equilibrium moisture content of malt and
barley at observed deep bed saturation temperature (break through of
temperature) were to be 12% (w.b.) and 17% (w.b.) respectively. The
observed deep bed saturation temperature was in the range 22 - 29.50C.
He explained this low value of the equilibrium moisture content of malt
by considering the fact that in the case of malt the presence of sugars
reduces the vapour pressure by 40%. Since the vapour pressure of a
solution is always less than that of the pure solvent. Boyce (1966)oreported that at 26.7 C, about the average value of the observed deep bed
osaturation temperature when drying at air temperatures of 60 - 68.33 C,
the indicated grain equilibrium moisture content when the a1r is saturated
is about 15.25% (w.b.). This is 3.25% (w.b.) lower than the observation
of Johnston. Logan (1954) suggested that there was a free water stage

83
above about 20% (w.b.) moisture content. Narziss (1976) found that
an emergence of heating front (break through of temperature) into the
upper layer also occurs earlier, at about 18 - 20% (w.b.) moisture
content, than would be expected from the figures of Johnston
(about 13%).
The dynamic equilibrium moisture content of malt at saturation
obtained by the Chung and Pfost equation and its modified form were in
good agreement with Logan and Narziss. The equations have the correct
overall shape over the entire practical range and the use of these
equations might be expected to give more realistic values. The validity
of the equations is limited to the normal range of temperature and relative
humidity in the malt kilning process. The Chung and Pfost equation gives
a sigmoid shape and it has been recommended by Pixton and Howe (1983) for
cereals. The Chung and Pfost type equations developed for malt were
selected to be used in the deep bed drying simulation of malt.

84
Chapter 4
SIMULATION OF DEEP BED DRYING
The conditions of the grain and air change with position
and time during the deep bed drying of agricultural crops. Mathematical
models have been widely accepted for studying such complex phenomena.
The models for deep bed drying may be classified as (Morey et ale 1978):
(i) Graphical and Logarithmic Models
(ii) Heat and Mass Balance Models
(iii) Partial Differential Equation Models
This study is concerned with Partial Differential Equation Models.
These models are developed by deriving a set of four partial differential
equations to describe heat and mass transfer within a thin layer during
a small time increment. The analytical solution of this set of partial
differential equations is either extremely difficult or beyond the reach
of today's mathematics. The solution procedure is basically a numercial
integration with respect to time and position. the deep bed being considered
as a series of thin layers. This process of step by step solution is
called simulation. Simulation does not give a general solution, but a
simulation model can be used in place of the real system and it can rapidly
and inexpensively give useful information about its dynamic behaviour.
4.1 A Review of the Literature
McEwen and O'Ca1laghan (1954) were the first to propose that the
deep bed drying of grain can be represented by a number of thin layers in
series and developed a semi-graphical method of solution. At about the
same period Van Arsdel (1955) developed a partial differential equation
model and solved the partial differential equations by predictor-corrector

85
methods. He has not presented any comparison with experimental
data. The graphical solution of the McEwen and O'Callaghan model
and the solution of the Van Arsdel model without a digital computer
were quite laborious for general use.
About a decade after the publication of these models, Boyce
(1965, 1966) was the first to develop a digital computer model for
the deep bed drying of barley and validated the model with experimental
results. Thompson, Peart and Foster (1967), and Henderson and Henderson
(1968) used the same semi-empirical approach as Boyce and their results
are similar. Bloome and Shove (1971) developed a model based on a
finite difference method for low temperature drying of shelled corn.
This model assumes that temperature equilibrium is achieved during each
time increment and uses only a heat balance equation. Sharma and
Muir (1974) applied Bloome and Shove's model for low temperature drying
of wheat and rape seed. Good agreement was observed between the predicted
values and experimental results. Thompson (1972) developed a low air
flow and low temperature drying simulation model for shelled corn which
takes into account the dry matter decomposition of grain. Morey, Cloud,
Gustafson and Petersen (1979) added several modifications to the Thompson's
model, as a result of validation procedures, and found it suitable for
predicting moisture content changes using either 1 hour or 24 hour time
increments for low air flow and near ambient temperature deep bed drying
of corn.
Baughman, Hamdy and Barre (1971) modified Hukill's logarithmic
model (Hukill, 1974) and simulated the model on an analogue computer.
They observed that the diffusion model g~ves better results than the basic
logarithmic model for shelled corn. Barre, Baughman and Hamdy (1971)
applied a modified Hukill's model for cross flow deep bed drying and obtained

86
quite good agreement between observed and predicted mean moisture
contents for ear corn.
Bakker-Arkema, Bricket and Patterson (1967) developed a set
of partial differential equations for heat and mass transfer ln a deep
bed of biological materials and solved them numerically with aid of
a digital computer. Bakker-Arkema, Lerew and Evans (1970) developed
partial differential equation models for the four basic grain drier
types at Michigan State University. The system of equations for each
of the fixed bed, concurrent flow, cross flow and counter flow driers
was solved numerically and the results were compared with experimental
corn drying data. The agreement between the predicted values and
experimental results was satisfactory. Hamdy and Barre (1970) developed
a partial differential equation model and solved the equations on a
hybrid digital/analogue computer. The agreement between the model
predictions and experimental results was quite good. Spencer (1969)
developed a set of partial differential equations to describe deep bed
drying of wheat and solved numerically by the method of Runge Kutta.
The agreement between the experimental results and model predictions were
quite good. Spencer (1972) further improved the model by incorporating
the equations for latent heat of vaporization of moisture, bed shrinkage
and an improved equation for surface moisture content.
At Newcastle University the semi-empirical model of Boyce was
further developed by Menzies (1971) and Bailey (1972) by replacing the
semi-empirical model by a set of 4 partial differential equations directly
formulated into finite difference form. The simulation model was validated
by comparing the predicted values with those measured in static and

87
fluidized beds, and cross, contra and co-flow gra~n driers. Comparisons
were also made with both static and drum type grass driers (O'Callaghan,
Menzies and Bailey, 1971). Nellist (1974) further developed the
Newcastle model by incorporating the diffusion equation and improved
condensation procedure. He applied this model to the drying of ryegrass
seeds and the model gave reasonable overall agreement with experimental
results. Matouk (1976) modified the Newcastle model for low temperature
drYlng and storage of maize grain, but the model has not been validated
with experimental results. Chinnan and Young (1978) developed a deep
bed drying model similar to the Newcastle model for peanut pods. This
model incorporates a vapour-liquid diffusion thin layer model and takes
into account heat losses to the surroundings and to the walls of the
drier. They also obtained deep bed drying predictions employing the
liquid diffusion thin layer model. In most cases the deep bed model
with the vapour-liquid diffusion thin layer model gave a better estimate
of change in condition of the pods and the condition of the air leaving
the layer than the liquid diffusion model.
Ingram (1976) developed a partial differential equation model
for the deep bed drying of grains. He developed a series method of
solution of the diffusion equations, which were incorporated into the
model and made an exponential approximation to the solution of the partial
differential equations. He avoided the prediction of impossible relative
humidities by replacing the equation
GaH oM
= - Paz d at
dM RPd aM h - Rp C( Ta - ) aM
by e e cv d pw T edz G aH G (C + C H) g aTpa pw a
4.1
4.2

33
He validated the model against the experimental results of Boyce
(1965, 1966) and Woodforde and Lawton (1965), the.predictions were
better than those of O'Callaghan, Menzies and Bailey (1971) for the
former and were 1n good agreement with the latter. This improvement
is probably due to the increased accuracy of the numerical approximation
and the provision for the reduction of the space increment in the areas
of the bed with high gradients. Smith (1982) modified Ingram'S model
for non-parallel flow of air and used two methods for simulating the
drying of any shape of grain heap. He observed a general similarity
between the experimental and computer results, although there were
some differences.
Kachru and Matthes (1976) developed a completely different
type of model for rough rice on the basis of dimensional analysis and
similitude to predict drying time and instantaneous moisture content.
The predicted values from the suggested model and experimental values were
in relatively good agreement.
More recently Bowden, Lamond and Smith (1983) used the following
four models to simulate low temperature deep bed drying of barley:
(i) Moisture deficit model
(ii) Logarithmic model
(iii) Near equilibrium model
(iv) Ingram model
As a process of validation of the models, they compared the predicted
and experimental results. The Ingram and Near-equilibrium models gave
good predictions for the drying process but the Ingram model used considerably

89
more computing time. The logarithmic model was adequate and the
moisture deficit model only of use for rapid calculation.
All of the partial differential equation models described
above have been shown to predict moisture content and temperature
changes with a reasonable amount of accuracy either for shallow bed
(up to 0.30 m) and/or short duration (2 - 4 hours) (Spencer, 1969,
Bakker-Arkema et a1. 1967, 1970, Menzies, 1971 and Ingram, 1976).
Nellist (1974) and Chinnan and Young (1978) observed good agreement
between the predicted and observed moisture content changes for deep
beds (1 - 1.5 m) and long duration, but their models over predicted
the rate of passage of the heating front. Spencer (1972) reported
good agreement between the predicted and observed mean moisture content
and exhaust air temperature for a deep bed (0.70 m) and long duration
(24 hours). Although Ingram (1976) has shown that his model agrees
quite well with the experimental data of Boyce for both temperature
and moisture content, it has not been validated against deep bed data
(above 0.30 m) and for a long duration. As far as the author is aware
no model has been reported to predict the temperature changes for a
deep bed (above 0.3 m) and for a long duration (above 4 h) with reasonable
amount of accuracy.
4.2 Development of Models for Deep Bed Drying
Two mathematical models were used for this study. Modell
~s similar to the Newcastle University model described by Nellist (1974)
and Model 2 is similar to the Michigan State University model described
by Ingram (1976).
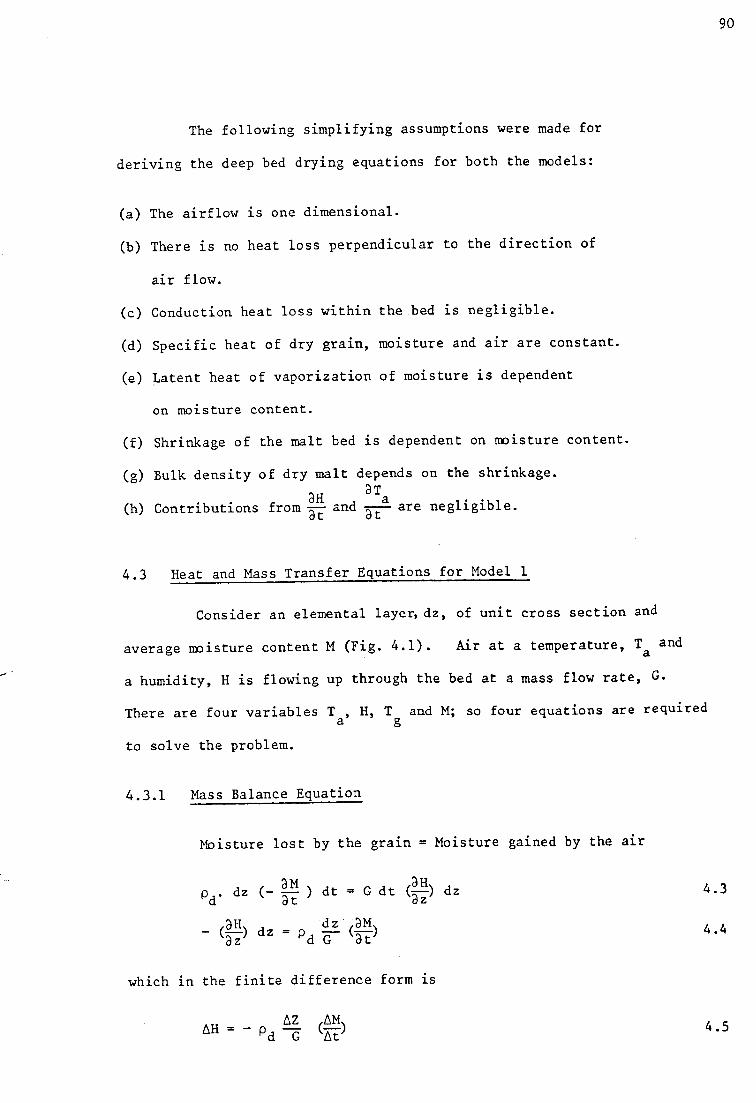
90
The following simplifying assumptions were made for
deriving the deep bed drying equations for both the models:
(a) The airflow is one dimensional.
(b) There is no heat loss perpendicular to the direction of
air flow.(c) Conduction heat loss within the bed is negligible.
(d) Specific heat of dry grain, moisture and air are constant.
(e) Latent heat of vaporization of moisture is dependent
on moisture content.
(f) Shrinkage of the malt bed is dependent on moisture content.
(g) Bulk density of dry malt depends on the shrinkage.dH dTa(h) Contributions from at and ~ are negligible.
4.3 Heat and Mass Transfer Equations for Modell
Consider an elemental layer, dz, of unit cross section and
average moisture content M (Fig. 4.1). Air at a temperature, T anda
a humidity, H is flowing up through the bed at a mass flow rate, G.
There are four variables T , H, T and M; so four equations are requireda g
to solve the problem.
4.3.1 Mass Balance Equation
Moisture lost by the grain = Moisture gained by the a1r
Pd. dz (- dM ) dt = G dt (dH) dzdt dZ
_ (dR) dz = P dz· (dM)dZ d G dt
4.3
4.4
which in the finite difference form 1S
flHflZ=-P -d G 4.5

91
4.3.2 Drying Rate Equation
The single exponential equation ~n differential equation
form is given by
dM = -k (M - Me)dt
which in the finite difference form ~s
t.M = -k (M - Me) t.t
4.6
4.7
when M is replaced by M +- t.M/2, the equation becomes
-k (M - M )t.H e
= t.t(1 + (k/2) t.t)
The Page equation can be written as
M - MIn ( e ) u
= -ktH - M0 e
1
[ +Ln (M - M / kJ ut = e )
eq M - M0 e
4.8
4.9
4.10
Where t ~s the equivalent drying time.eq
This equivalent time, teq, is the time required on the new drying curve
to dry to the present moisture content. The Page equation in the
differential equation form incorporating t ~seq
dM u-l
dt- (M - M ) k u (t + ~t)e eq 4.11
Equation 4.11 ~n the finite difference form is
t.M= - (M - M ) k u (t + ~t)u-l ~te eq 4.12

92
4.3.3 Heat Balance Equation
Change in entha1phy of air = Change in entha1phy of grain
The change 1n entha1phy of air
= G.nt [(C •T + C • H. T + L .H) - (C (T + 6.T )pa a pw a a pa a a
+ C (H + 6.H) (T + 6.T ) + L (H + 6.H~pw a a a ~ 4.13
The change 1n entha1phy of gra1n
= Pd.6.z[T (C +"C 1.M) - «T +6.T )(C + C l(M+6.M)~g pg P g g pg p ~
b. . A 6.z (6.M)Su st1tut1ng uH = - Pd G 6.t
4.14
1n Eqn. 4.13 and equating equation
4.13 and equation 4.14 g1ves
[tsz 6.MG.6.t - 6.Ta (Cpa + Cpw (H - Pd IG . 6.t ) + Pd
= Pd. 6.z[Tg• nM.Cp1 + 6.Tg (Cpg + Cp1 (M + nM) ~
6.zG
6.M (C .T + La)]nt pw a
4.15
Equation 4.15 gives
[- Pd· 6.znT 6.T (C + C (M + 6.M) )a G. 6t g pa pI
Pd. 6zTg) ]+ . nM (C • T + L - C /G. 6.t pw a a pI
6Z(C + C (H - Pd • -Gpa pw
6.M ) )6t 4.16
4.3.4 Heat Transfer Rate Equation
Heat transfer rate between air and grain =" Change in
sensible heat of grain + (Entha1phy in evaporated moisture -
Entha1phy of moisture prior to evaporation).

93
h .!::.z [(T +cv a ~ !::.T) - (T +!!::.T)]!::.ta g g
= Pd' tsz, tJ.T (C + C • M) + Pd !::.z(- tJ.H) (L + C Tg pg pI g pw a - C 1- T )p g4.17
2 (T - T ) +!::.T -!::.Ta gag2,Pd !::.T 2Pd tJ.M
= -h- _J_ (C + Cp1M) --- (L + C . T - Cpl' T ) 4.18!::.t pg h tJ.t g p~v a g
tV cv
Let A = 2 (T - T )a gB = (C + C I'M)pg p y =
b.Ta -A + !::.Tg
2BPd 2Pd b.M( 1 + h .tJ.t) - h' b.t • Y
cv cv4.19
Let EPd·!::.z
= (C + C (H ---pa pw GtJ.M) )!::.t
Equation 4.16 now reduces to the formPd' b.zc.a.z eb.Ta = - (!::.T (B + C l' b.M) - b.M.F)g p
4.20
Equating equation 4.19 and equation 4.20
2 BPd 2Pd• !::.z-A + tJ.T (1 + h !::.t)- h • b.t • Yg cv cv
= 4.21
Equation 4.21 g~ves
A b.M [ 2Y + !::.z • F ]+ Pd' b.t h 'G.B.tJ.T =g + Pd [2B !::.z !::.M)]1 + G.E. ( B + Cpl'b.t h cv
4.22

94
4.3.5 Method of Solution
The bed is divided into a number of layers so that the properties
of the material are constant or nearly so within each layer. The time
interval should be small enough for the air conditions to be constant at
the inlet to and exit from the layer. But for economy of computing time,
a compromise between the acceptability of the results and intervals must
be used.
Having selected t.z and t.t, drying constant, k, and equilibrium
moisture content, Me' at the inlet air conditions are determined. The
change in moisture content in the first layer during the time interval 6t
is computed from either equation 4.8 or equation 4.12. The change in
gra1n temperature, 6T , and the change in air temperature, t.T , areg a
calculated from equations 4.22 and 4.20 respectively. The change in air
humidity t.H is given by equation 4.5. This process is repeated layer by
layer until the top of the bed is reached. For each time increment bed
depth, z, and dry bulk density, Pd are assumed to be constant.
of each time increment, the amount of bed shrinkage is calculated from the
At the end
estimated mean moisture content using equation 2.32, and dry bulk density
is recalculated simply considering the volume occupied by the bed and the
initial estimate of the weight of dry matter. The amount of shrinkage
is used to alter the finite element width, 6z for the next time interval.
This process is repeated for each time increment. When the relative
humidity exceeds 98%, the condensation routine deposits back the moisture
from the over saturated air and avoids this unrealistic situation. The
condensation procedure will be described in the following section.

95
4.3.6 Condensation Procedure
The principle of the condensation procedure is that, whenever
the relative humidity of the air exceeds the maximum permissible
relative humidity, the excess moisture from the air is condensed back
to the grain. Ne11ist (1974) developed an iterative procedure to
find the balance between the air and freely available water. The
principle of his procedure was that whenever the relative humidity
exceeded the saturation value, the moisture that evaporated from the
layer was adjusted until the evaporated moisture gives a temperature
change predicting 100% saturation. He adjusted the evaporated moisture
by using an interpolating polynomial to find the zero of the function
y = f (x) 4.23
where
y = (maximum permissible rh - predicted exhaust rh)
and x = moisture loss, ~.
The condensation procedure used in this study finds the balance
between air and freely available water by a set of three simple steps.
The condensation procedure is illustrated with reference to a skeleton
psychrometric chart in Fig. 4.2. Suppose TaZ and HZ at state 2 have
been predicted from state 1 (Tal' H1).
is in excess of the max~mum permissible relative humidity, RH. Top
achieve T and H at maximum permissible relative humidity, RH 16MIap p p
At state Z the relative humidity
is reduced by a small amount which in turn reduces H2 by a small amount
and the new estimates of T and H are predicted by the heat and massa
transfer equations. This process is repeated until the predicted

96
relative humidity is less than the max1mum permissible relative humidity.
Finally, the temperature and humidity at maximum permissible relative
humidity is obtained by the method of bisection and secant method (James,
Smith and Wolford, 1977).
Determination of temperature and relative humidity at maximum
permissible relative humidity is finding the zero of the function
y = f (x) 4.24
where
y = (predicted exhaust relative humidity
- maX1mum permissible relative humidity)
and x = moisture loss, flM
The zero of the function y = f (x) is obtained in the following three
steps:
(i) !till!is reduced by a small increment fixuntil the function
is of opposite sign using the method of incremental search.
(ii) An approximate root of the function is obtained by the
bi-section method.
(iii) A more accurate root of the function is determined by the
secant method until Iyl = If (x)! is less than 0.1% RH •P
T and H in all the steps are recalculated using the heat and massa
transfer equations.
Nellist (1974) observed that the setting of maX1mum permissible
relative humidity in excess of 98% caused the exhaust relative humidity
to oscillate from layer to layer because of the steepness of the equilibrium

97
moisture content curve. In later versions of his programme he
allowed the maximum permissible relative humidity and the maximum
relative humidity for the evaluation of M to be set independentlye
to control layer to layer oscillation. In this study these provisions
were incorporated in the programmes.
4.3.7 The Computer Programme
The programme is presented ~n Appendix 4.1. Some of the
important features of the programme are summarised below:
(i) Inlet air temperature and humidity, and air flow rate
could be used as time dependent arrays and interpolated
linearly to initialize inlet air conditions and
air flow rate at the start of each time iteration.
(ii) Initial moisture content and temperature profiles could
be used as depth dependent arrays and interpolated linearly
to initialize the layer conditions.
(iii) Bed depth, depth increments and dry bulk density were
adjusted automatically in the programme for shrinkage of
the bed.
(iv) A modified condensation routine has been incorporated
in the model.
(v) The programme would provide an error message if the
condensation routine fails to find the zero of the functiony = f (x).
4.4 Heat and ~lass Transfer Equations for Model 2
Consider an element of the bed (z, z+dz) and of unit cross
section with air flow, G, from z to z+dz (Fig. 4.1). There are

98
four unknowns: moisture content, M, humidity, H, air temperature, Ta,and grain temperature, Tg. Thus, two conservation equations and tworate equations are made resulting four equations.
4.4.1 Mass Balance Equation
In unit time the flow of moisture into the element is
GH (z )
and out of the element is
GH (z + dz)
The difference between these is moisture added to air from grain.Thus, for unit time
(z + dz) - GH (z) aM dzGH = -P - .d at
using Taylor series expansion for H terms and ignoring all terms2of dz and higher, this reduces to
G aHaz dz = . dz 4.25
cancelling dz
G aH =az
aM-Pd at 4.26
In the finite difference form equation 4.26 is
~H~z = ( ~M )
~t 4.27
With reference to the grid In Fig. 4.3
( ~M ) ~z~t 4.28

99
4.4.2 Drying Rate Equation
The single exponential equation 1n differential form is
d}1dt = -k (M -M )
e 4.29
Integrating this equation from State 1 to State 2 (Fig. 4.3)
M2 - M -k (t2-tl)e = e 4.30~
- }fe
since t2 - t = ~t1
+ M (l_e-k~t)e 4.31
Again the Page equation from Eqn. 4.12 can be written as
M2 = M - (M - M ) ku (t + ~t) u~l~t1 1 e eq 4.32
4.4.3 Heat Balance Equation
Change in enthalphy of a1r
= convective heat transfer to the gra1n
- heat carried by the vapour to the air.
Heat flowing into the element (z, z + dz) 1n unit time 1S
G [(C + C H (z ) ) • T (z)pa pw a + L • H (z)]a
and heat flowing out is
G [(C + C H (z + dz) T (z + dz) + La H (z + dz)]pa pw a

100
The difference is equal to the difference between the convective
heat transfer to the grain and the heat carried by the vapour tothe air.
G [(C + C H (z + dz) ) T (z + dz) + L .H (z + dz)]pa pw a a
- G [(C + C H (z) ) T (z) + L H (z)1pa pw a a
-h (T - T ) dz - (p C 3M T + 3M L ) dz= pwat Pd atcv a g d g a 4.33
Applying the Taylor serl.es expansion and neglecting higher orderterms.
3T 3H 3T 3Hdz ]G [c a dz + C T dz + C H~ dz + Lpa 3z pw a 3z pw 3z a 3z
- T ) dz - ( Pd C 3M T 3M L ) dz= -h (T at + Pd atcv a g pw g a 4.34
3H Pd ( 3M )Substituting = - -3z G 3t
3T 3M 3MH) a - C T - P LG (C + C pw Pd a d apa pw 3 z 3t 3t
= hcv (T - T ) - P C 3M aMd pw T - P -a g at g d at La 4.35
Equation 4.35 gives
3M (T - T )3T (-h + C Pd . at ),ew a sa cv3z G (C + C H)pa pw
Let P - (h - iJd . C 3M) / G (C + C H)= pw 3t pa pwcv
4.36

101
Assuming P and Tg constant over the interval 6z (Fig. 4.3), equation4.36 reduces to the form
dTa
dz= P (T
a T )g 4.37
Integrating equation 4.37 from State 2 to State 4, one gets
Ta4 - T P (z4 - z )g= e 2
Ta2 - Tg
Since z - z2 = 6z4
Ta4 Ta2P.6z
+ T (1 P.6z)= e - ea
4.38
4.39
4.4.4 Heat Transfer Rate Equation
Change of entha1phy of grain
= convective heat transfer to gra~n
heat supplied to evaporate the moisture to the air
At the beginning of the time step, dt, the grain heat is
P (C + Cpl. M (t) ) Tgd pg
and at t + dt is
Pd (Cpg + Cpl. M (t + dt) ) . Tg (t + dt)
The difference is equal to the difference between the heat transferred
convectively to the grain and the heat required to evaporate the moisture
+ Cpl. M (t + dt) ) . Tg (t; + d t ) - (Cpg + Cpl. M (t ) ) . Tg (t)]
3M (C T + L ) dt 4 4(Ta - Tg) dt + Pd at pw g g . 0= h.cv

102
Applying the Taylor series expansion and ignoring higher terms
3TP (C + C M) _gd pg pl 3t
hcv3M(T - T ) + Pd (L + (C - C l).T ) ~a g g pw p g ot
4.41
Equation 4.41 gives
aT h (T - T )__ g = cv a g
at Pd(C + C 1.M)pg p+
Pd (L + (C - C 1) T ) ~Mg pw P g ot 4.42Pd (C + C 1 . M)pg P
Let pI = - h IPd
(C + Cpl . M)cv pg
Assuming pI and Q constant over the time interval dt
dT__£ = pI (T - T ) + Qdt g a
4.43
Integrating from State 1 to State 2 (Fig. 4.3)
[ ] ep I ( t 2 - t 1)Tg2 = Tgl - (PITa - Q) Ip' + (PITa - Q) I pI 4.44
Since = 6t
+ (P I T - Q)a
(1 - e Pl6t) I pi 4.45
103
4.4.5 Method of Solution
Depth and time increments should be small for the reasons
mentioned in section 4.3.5. The method of calculation is described
with reference to the grid in Fig. 4.3. Having selected ~z and ~t,drying constant, k, and equilibrium moisture content, M are determinede'for mean air temperature and relative humidity over the time interval~t (itate 1 to state 2). Moisture content at state 2 is determined
from state 1 using either equation 4.31 or equation 4.32. Takingmean air temperature, mean moisture content and mean drying rate over
the interval ~t (state 1 to state 2), the grain temperature at state 2
relative to state 1 is calculated using the equation 4.45. Air temperatureat state 4 1S estimated fro~ equation 4.39 using the conditions at state 2
aMfor values of at ' Tg and H.
state 4 using equation 4.28 and the moisture gradient value at state 2.
Air humidity is estimated from state 2 to
If the relative humidity at state 4 is less than 98%, the moisture content
at state 4 is determined 1n the same way as before from state 3. Graintemperature at state 4 is calculated from state 3 using equation 4.45taking mean aIr temperature, mean moisture content and mean drying rate
over the time interval ~t (state 3 to state 4) •. Air temperature is then
recalculated using mean grain temperature and mean humidity over the depth
increment ~z (state 2 to state 4) and relative humidity is also recalculated.
Relative humidity is again checked and if still below 98% the iteration is
complete. When the air temperature gradient is high, ~z is halved until
the criterion (~T3 < 30e) on the temperature change is satisfied ( a limit
of 7 halvings is imposed).
bed is reached and the whole cycle is repeated for each time step.
The iteration is repeated until the top of the
104
For each time increment bed depth, z and dry bulk density,
Pd, are assumed to be constant. At the end of each time increment,
the amount of bed shrinkage is calculated from the estimated mean
moisture content using equation 2.32 and dry bulk density ~s recalculated
simply considering the volume occupied by the bed and the initial estimateof the weight of dry matter. The amount of shrinkage is used to alterthe finite element width f:,z for the next time interval.
is repeated for each time increment.This process
When the relative humidity exceeds 98%, the condensation
routine deposits back the moi~ture on the previous node. Air andgra~n temperatures are adjusted for this condensation on the'previous
node. The condensation procedure used in this model is the same as
that described in Section 4.3.6.
4.4.6 Computer Programme
The programme is presented in Appendix 4.2. An exponential
approximation similar to Ingram's model and a solution of the set of
equations using central difference values updated by an iteration has
been incorporated in the programme. This programme adjusts automatically
the depth increment f:,z by halving when the temperature gradient is high
and continues up to 7 halvings if the change criterion is not satisfied.
The rest of the additional features are the same as described in the
section 4.3.7.
4.5. Preliminary Tests with the Programmes
During the development stage of the model, the programmes for
both the models were tested using the equations developed in the earlier
chapters 2 and 3, and the input data for a kiln trial obtained from

105
commercial kiln data of Chapman (1982). The input was incomplete,so, the missing data was assumed on the basis of typical conditionsduring kilning of malt (Chapman, 1982). Initial moisture content(d.b.), initial grain temperature, and dry bulk density were assumed
o 3to be 78.507., 18 C and 392.15 kg/m . Both models gave similarpredictions. The comparison between the prediction and the kiln trialis presented in the section 5.3.2.
4.5.1 Sensitivity Analysis
A series of tests were conducted to find the effects of the
variation of heat transfer coefficient and latent heat of vaporizationof moisture. No significant effect was found in the resulting air
temperature and mean moisture content predictions. These observationsagree with the observations of Nellist (1974). Air temperature in theequation for the drying constant (Eqn. 3.45) was replaced with grain
temperature and no significant effect was observed. This confirms theobservation of Boyce (1966). .The dry bulk density significantly affected
the air temperature and mean moisture content variation with time. Highdry bulk density caused high mean moisture content and slow passage of the
heating front. This indicated that assuming constant dry bulk density
for shrinking material would predict rapid passage of the heating front.
The stability of both the models with respect to heat transfer
coefficient was partly due to the low specific heat of grain and the
relatively high air flow rate.
respect to latent heat of vaporization of moisture contained in the grain
was partly due to the small value of ~~ and relatively high air flow rate.
The stability of both the models with

106
Chapter 5
DEEP BED DRYING EXPERIMENTS AND COMMERCIAL KILN SI~~JLATION
The validity of a model should be judged by how we ll it servesits purpose. A model is sound and defendable if it accomplishes what1S expected of it. No model either in physical or social sciences isan exact representation of "reali ty" . Models then should not be judgedon an absolute scale but on a relative scale. The model predictionsof temperature and moisture content should be judged against the present
state of the art and the utility of the models to the biochemists and
engineers for quality improvement, energy conservation and efficient use ofkilning plant.
Deep bed drying experiments were conducted to test the validity
of the two models developed in Sections 4.3 and 4.4. Deep bed drying
experiments are costly and laborious and a limited number of experiments
were performed in the laboratory, keeping in mind the possible future
applications. The variables considered in the deep bed drying experiments
are temperature, mass flow rate and relative humidity of the air, weight
of bed, moisture content and depth of bed. Inlet temperature, relative
humidity, and mass flow rate of air were kept constant and all the variables
were monitored during the deep bed tests conducted.
5.1 Apparatus
The experimental set up for the deep bed drying of malt is shown
i n Fig. 5.1. The drying bin was a rectangular box of 250 mm x 250 mm
cross-section and 750 mm deep. The bin was fitted with a plenum chamber
and stood on a balance. The fan, heater, moisturisingcolumn and air flow
measuring equipment were those used for the thin layer drying experiments
as described in Section 3.3.

107
The front of the box was subdivided into seven separatelyremovable sections. When the drying was stopped these could be
removed in turn, starting at the top, to enable sampling. The jointsbetween these sections were made air tight with adhesive tape. To
minimize the convection and radiation loss, a cottage type insulated cover
was placed on top of the bin. The inside of the cottage type cover was
covered with aluminium foil. The cover caused the air leaving the
gra1n to flow down through the annular space between the cover and thebox.
To measure temperatures at different positions 1n the bed shielded
thermocouples supported by thin horizontal rods running across the box
were located at the centre of the cross section (Fig. 5.2). The thermo-couples were shielded in a perforated plastic tube. This method provedunsatisfactory due to the formation of channels during the shrinkage of
the bed. Subsequently a different technique was used (Nellist, 1983) and
the method proved quite satisfactory. In this improved method the thermo-couples of required length were suspended from a 'star' shaped support,which was gradually lifted to the desired position step by step, duringthe filling of the bin with grains layer by layer (Fig. 5.3) • Thisresulted in a malt bed free to contract and slide over the vertically
running thermocouples. The thermocouples were not shielded, as it was
considered reasonable to assume grain and air temperatures equal and shielding
may have impeded shrinkage.
The balance had a capacity of 50 kg and was graduated to 20 g.
As the balance was of the beam type fitted with a balance pan for counter
weights, the eOffect of connecting the flexible tube could be eliminated.

108
The balance gives the correct change of weight as long as the force
exerted by the air flow on the bed remains. constant.
5.2 Experimerttal ·Ptocedure
Green malt used for deep bed drying experiments was obtained
from a maltings at Gainsborough. It was sent directly from the
germination chamber and loaded for deep bed drying on arrival. Five
experiments were conducted. Three experiments were conducted placing
shielded thermocouples at central positions supported by the thin rods
across the box and no top cover was used to minimize the effect of air
draught and radiation loss. Later, two experiments were conducted
employing the suspended thermocouple technique of temperature measurement
and wi th the cottage type cover on the top of the bed.
Before starting any experimental run, the whole of the apparatus
and monitoring equipment was operated with a dummy deep grain bed for
at least three hours to stabilize the air flow and inlet air conditions.
Mass flow rate of air and inlet conditions were adjusted to the values to
be used in the deep bed experiment.
The drier bin was filled layer by layer with previously weighed
grains which were sealed in plastic bags, one for each layer. For the
improved technique, the 'star' support was lifted step by step from the
bottom along with the filling of the bin. The weight of the grain bed,
including the box was adjusted by counter weights.
When it was clear that the air temperature, relative humidity
and airflow rate, had been s tabj lized and the drying bin had been filled,
the flexible tube was immediately disconnected from the dummy bed and

109
connected to the actual bed. Very quickly the air flow was adjusted
if required and the balance was adjusted to zero using lead shot. The
data logger was then operated to record air temperatures at intervals
of 30 minutes. The time for each 200 g of moisture removal was noted
and the balance was re-adjusted to zero us~ng weights. At the same
time a careful check was kept on the air flow rate, if necessary a small
adjustment was made.
of the experiment.
The process was repeated during the whole period
At the end of the experiment the final weight of the grains was
measured and the grain bed was emptied layer by layer by a flat sampler
that could be pushed into the bed. The moisture content of the grains
at the desired layers was determined using three samples per layer and
according to the method in Appendix 3.1.
5.3 Results and Discussion
Deep bed drying was carried out with the malt variety Triumph.
The results of the deep bed drying experiments are shown in Figs. 5.4 to
5.6. The bed depth of all the experiments was sufficient to establish
the three drying zones normally observed in deep bed drying. The drying
zone was bounded by a dry zone and an undry zone and the drying rate of
the bed was constant. Wheri the drying front emerged from the top of the
bed, the drying rate of the bed decreased gradually until the bed was fully
dried to equilibrium moisture content (Figs. 5.4 and 5.5). In the undry
zone the pseudo-wet bulb temperature was approximately equal to the wet-bulb
temperature of the air leaving the drying zone.

110
5.3.1 Comparison of the Simulation with Experimental Results
Laboratory deep bed drying experiments were conducted to assess
the accuracy of the predictions of the models. The following three
variables were selected to assess the validity of the models.
(1) Mean moisture content variation with time
(2) Moisture content distribution at termination
(3) Air temperature variation with time and position.
5.3.1.1 Mean Moisture Content Variation with Time
Both the models predicted linear variation of mean moisture
content until the drying zone emerged and then predicted gradually
decreasing drying rate of the bed. The predictions of both the models
were very close to each other. The comparison of the predicted mean
moisture content with experimental results is shown in Fig. 5.4.
Final mean moisture content calculated from the final experimental
moisture content distribution agreed quite well with the predicted final
mean moisture content. The difference between the predicted final mean
moisture content and the observed final mean moisture content was possibly
due to the change in the upward thrust of the air on the balance. Although
the mass flow rate of air was almost constant, the upward thrust might
have been slightly affected by the change of porosity and bed depth.
However, the agreement between the predicted and experimental mean moisture
content for all the five experiments was good.
5.3.1.2 Moisture Content Distribution
The drying zone was bounded by a dry zone and an undry zone in
experimental run 2, 3 and 5 at the time of termination (Figs. 5.5 (b)

111
5.5 (c) and 5.5 (e) ). The predictions of both mode Is were very close
and predicted a slightly higher moisture content in front of the dryingzone. An excellent agreement between the predicted and observed moisture
content distribution was found when the drying zone has already passed the
top of the bed. The agreement between the predicted and observed moisture
content distribution for all the five experiments was good (Fig. 5.5).
5.3.1.3 Air Temperature Variation with Time and Position
In the first three tests, air temperature was measured USIng
shielded thermocouples placed centrally and supported by thin rods acrossthe bin at regular intervals. The predictions of both the models were
very close to each other and the predicted temperatures did not agree with
the experimental results. A comparison of the predicted and experimental
results is shown in Figs. 5.6 (a) to 5.6 (c). The experimental temperatureswere higher than the predicted ones. The perforated tubes shielding the
thermocouples and the thin rods would have affected the shrinkage of the
bed. It seems likely that this may have caused some channelling of the
air allowing the hot air to proceed more rapidly.
This technique was abandoned. Another two deep bed experiments
were conducted using the suspended thermocouple technique. The agreemen t
between the predicted and experimental temperatures was very good. The
comparisons of the predicted and observed temperature is shown in Figs.
5.6 (d) to 5.6 (e). However, if the shrinkage is not included In the
models, this caused the models to predict a more rapid passage of the
heating front (Fig. 5.7). A number of researchers (O'Callaghan et al.
1971, Nellist, 1974, and Chinnan et al. 1978) have not included shrinkage
and they also report an over estimate of air temperature rise. The agreement
between the predicted and observed pseudo wet bulb temperature was excellent.

112
5.3.2 Comparison of the Simulation with Kiln Data
Commercial kiln experimental data was available but the data
only contained temperature variation with time and position. The dataavailable is presented in Fig. 5.8. The data on initial grain temperature
and initial moisture content had to be assumed and there was a certain
anomaly on inlet a~r temperatures. The anomaly exists between the on-bed
air temperatures presented in Figs. 5.8 (a) and 5.8 (c). In order to be
consistent with Fig. 5.8 (c), this on-bed temperature was used.
5.3.2.1 Temperature Variation with Time and Position
The predicted temperatures compared with the industrial data is
shown in Fig. 5.9. Both the computer programs appea~ed to be quite adequate
during the initial period of drying, but the difference between the predicted
and observed results was gradually increasing in the later period. However,
the agreement between the predicted and observed pseudo-wet bulb temperature
was quite good. It is very difficult to make any definite comment on this
disagreement because of insufficient information on the kiln experiment.
However, the overall agreement ~n the early stages ~s good.
5.4 Computing Time
Computer CPU time required for model-2 was considerably higher
than that required for model-I. For example, the CPU time for model-l
for predicting experimental run-4 was 58.34 seconds whereas model-2 required
101.15 CPU seconds.
5.5 Validity of the Models
The validity of the models should be judged against their purposes.
Forrester (1968) has mentioned "Model validity is a relative matter. The

113
usefulness of a mathematical simulation model should be judged in
compar~son with mental image or other abstract model which would beused instead."
No model has been reported to be validated against theexperimental data of malt. Although models have been developed foragricu1t_ura1 crops, most of them have been reported to be validated
for a shallow depth of bed about 0.3 m. No model has been reportedthat predicts the temperature changes with a reasonable amount of
accuracy for the bed depths encountered in malt drying. Both themodels developed can predict moisture content and temperature changes
with a reasonable amount of accuracy. There is no difference between
the two models for practical purposes. These facts justify the
validity of the models.
5.6 Application of Model
The main objectives of this section is to illustrate the
use of the programme in the commercial kilning of malt, and the
programme was applied to simulate a typical commercial kilning cycle.
This cycle was detailed by the technical staff of a malting company.
5.6.1 Operating Procedure
The kiln was simulated so as to satisfy the following
requirements of operating procedure as encountered in the commercial
kilning of malt:
1. The initial temperature during the first 12 hours r~ses
65°C.linearly from 55 to The flow rate was adjusted
°so that the off bed temperature reached 40 C after 12
hours.

114
2. The temperature then nses linearly from 65 to 750e
over the next 6 hours.
3. The temperature is then set at 800e for a minimum of
2 hours or until the mean moisture content reaches
equilibrium condition.
The programme (model 2) was used to simulate the
above operating procedure for gas fired! indirect fired and
recirculating conditions. For simulating gas fired conditions,
the moisture from combustion was taken as 0.4 g/kg air/lOoe increasein temperature. Most of the kilns are gas fired and the recirculationwas considered for gas fired conditions only. The recirculationwas set at 75% of kiln air through flow and began when the off bed
relative humidity dropped to 95%.
The other parameters required for the simulation were
set at the following typical values:
Initial moisture content %, (d.b.) 76.3. °eGraLn temperature,
Bulk density, kg/m318.0
608.0°eAmbient air temperature, 10.0
Ambient aLr humidity, kg/kg2Air flow rate, kg/min m
0.0058
23.412Bed cross sectional area, m 55.0
Bed depth, m 1.0

115
5.6.2 Results
The results of the simulation for gas fired, indirect
fired and recirculating conditions are presented under the headings.of mean moisture content, moisture content at three levels, temperature
at three levels, and energy consumption and drying time.
Mean Moisture Content
During the early stage of drying the mean moisture content
for gas fired conditions was slightly higher than that of indirect
fired conditions (Fig. 5.10). The major effect was on equilibrium
moisture content due to the addition of moisture of combustion.
Recirculated gas firing increased mean moisture content further but
finally this reached the same equilibrium moisture content as gas
firing but required a longer time to reach the equilibrium moisture
content (Fig. 5.11).
Moisture Content at Three Levels
Moisture content variations with time at the bottom layer,
0.5 m and the top layer were compared for all the three cases. Moisture
content variation was almost identical for gas and indirect heating
except for the final states. Moisture content variations for gas and
recirculated gas firing are presented in Fig. 5.12. It is interesting
to note that rewetting occurs at the bottom layers where the relative
humidity of the drying a1r 1S higher than the equilibrium relative
humidity of the grain. Moisture content variations for all the three
conditions during the final stages, showing the details of the curves
as they approach equilibrium moisture content, are shown in Fig. 5.13.

116
Temperature at Three Levels
Temperature variation with time at the bottom layer
0.5 m and the top layer were compared for all the cases and it was
found to be almost identical for gas and indirect firing. Temperature
variations for only gas and recirculated gas firing are presented in
Fig. 5.14. The rewetting phase during recirculation is reflected
by a temperature rise in the air. This is due to the release of
the latent heat of adsorption. It would be quite interesting to verify
this effect experimentally.
Energy Consumption and Drying Time
The energy consumption for drying 1S higher for gas
firing than that of either indirect firing or recirculated gas and
the drying time to reach the same final moisture content is higher
for recirculated gas than that of either gas or indirect firing.
The effects of the regimes are summarised as follows:
Item Gas Indirect(direct fired)
RecirculatedGas
Eq. moisture content %, (d.b.) 4.46 4.08 4.46
Time to reach the moisturecontent of 4.5% (d.b.), min 1066 1216 1440
Energy consumption for dryingto 4.5% (d.b.), kJ/tonne*
62.58xlO 62.18xlO 61.88xlO
Although the programme can be refined, this section has
demonstrated a little of how it might be used and indicated the phenomena
the programme is required to simulate.
* Wet malt (bulk density = 608 kg/m3)

117
Chapter 6
DISCUSSION AND CONCLUSION
The objective of this research was to develop a mathematical
simulation model for deep bed drying of malt to provide design data and
data on temperature and moisture content histories at different depths.
The work was carried out under four main headings. The results of
each of the sections have been discussed in detail in the relevant
section. The essential features of the theoretical and experimental
results of each of the main sections are now drawn together and their
general implications are discussed. Finally, suggestions are put
forward so as to provide possible directions of future research.
6.1 Physical and Thermal Properties of Malt
The physical and thermal properties of physical dimension,
1000 gra~n weight, bulk density, dry bulk density and specific heat,
were determined experimentally in the moisture content range 4.80 - 41.66%,
(w.b.) and each of these properties, except bulk density, was found to
be linearly dependent on moisture content. The correlation was more
effective when moisture content was expressed on a wet basis. There
does not appear to be any physical theory to explain this, the correlations
are purely empirical.
The ratio of latent heat of malt to latent heat of free water
was determined from three isotherms at SoC, 2SoC and 4SoC covering
relative humidities in the range, 11.2 - 97.0%, on the theoretical basis
of the Clausius-Clapeyron equation (Othmer, 1940). It was expressed
as a function of moisture content (d.b.) in the form proposed by
Gallaher (1951). This ratio increases rapidly at very low moisture

118
content. Since Gallaher's form of equation 1S not based on any
physical model, any extrapolation below 5.5% (d.b.) moisture content
should be treated with caution. Shrinkage of malt during drying
was determined experimentally. and found to be a non-linear function
of moisture reduction. Although the proposed equation is better than
the linear relationship proposed by previous workers, the proposed
equation has been supported by only two experimental runs and does
not give a very good fit to the experimental data. The volumetric
heat transfer coefficient of malt in the temperature range 50.S -
70.SoC and for air flow rates ranging from 0.35 to 0.62 kg/m2 sec
was determined experimentally and an equation was developed as a
function of air flow rates.
6.2 Thin Layer Drying of Malt
Thin layer drying experiments for the malt variety Triumpho 0were conducted with alr temperatures ranging from 30.3 C to 90.2 C
and relative humidity ranging from 2.4% to 79.2%. An iterative least
squares procedure was developed to fit the single exponential equation,
the double exponential equation and the Page equation to the thin
layer drying data. The double exponential equation always gave the
best fit, but the double exponential equation could not be fitted to
all experimental runs. The programme failed to converge to all the
experimental runs mainly due to the fact that the programme finds a
local unconstrained minimum. In the case of fitting the double
exponential equation there was more than one minimum and the starting
values caused convergence to a minimum which was physically unrealistic
but mathematically possible. In addition, the drying constants and

119
the proportion of the two components of the double exponential
equation were found to vary randomly. The Page equation was better
than the single exponential equation. However, the difference between
the standard error of estimate of these two equations was small.
The single exponential equation is physically more justified since
it is of the mathematical form of the first term of the solution
to the diffusion equation. The single exponential equation was found
to describe the thin layer drying of malt adequately and this was
probably due to the degradation in the endosperm and cell walls of
the germinated barley, causing the resistance to the drying to be
mainly concentrated at the testa and pericarp, i.e. at the outer
surface of the kernel.
The drying constant was expressed as a function of alr
temperature by an Arrhenius type equation for the normal drying range
of the malt kilning process and the extrapolation of the drying
constant above 900C for production of dark malt should be treated
with caution. Dynamic equilibrium moisture content was expressed
as a function of alr temperature and relative humidity. The modified
Smith equation and the Chung and Pfost equation were fitted to the
derived dynamic equilibrium moisture content data. The Chung and
Pfost equation gave the correct overall shape over the entire practical
range, but it showed small temperature effect. An examination of
the plots of the logarithm of the change in free energy Vs. moisture
content of the isotherms for corn (Chung and Pfost, 1967) reveals that
these plots are almost parallel to one another. On the basis of this

120
observation, the Chung and Pfost equation was modified to include a
further temperature effect and this improved the fit to the data.
This equation gave the correct overall shape over the entire practical
range and this equation might be expected to g~ve more realistic
values as it included the temperature effect.
6.3 SimUlation of Deep Bed Drying
Two mathematical models were developed to describe the
moisture content and temperature changes with position and time during
the deep bed drying of malt. Model 1 is similar to the Newcastle
Model described by Nellist and Model 2 1S similar to the Michigan
State University Model described by Ingram. The shrinkage of the
malt bed, variation of the dry bulk density and a modified condensation
procedure have been incorporated ~n both models. Both the models
have been programmed in FORTRAN. Both the programmes can be adapted
easily for the use of alternative thin layer equations and fluctuating
inlet conditions.
Model 2 takes considerably more computing time ~n compar~son
with Modell. Model 2 has been formulated in terms of the governing
differential equations. A solution procedure using an exponential
approximation similar to the Ingram's model and the use of central
difference values updated by an iteration to the solution of the set of
equations makes the second model better suited to more extreme conditions.
The modified condensation routine finds the balance between
a~r and freely available water by three simple steps. The difference
between the predicted and maximum permissible relative humidity has been

121
expressed as a function of moisture loss. A small interval
containing the root of the function is found by incremental search.
An approximate root 1S determined by the method of bisection and
finally a more accurate root is determined by the secant method.
A series of tests were conducted to find the effects of
the variation of heat transfer coefficient and latent heat of
vaporization of moisture. No significant effect was observed 1n
the resulting air temperature and mean moisture content. The
variation of dry bulk density considerably affected the mean moisture
content and temperature variation with time. High dry bulk density
caused high mean moisture content and slow passage of the heating
front.
6.4 Deep Bed Drying Experiments and Commercial Kiln Simulation
Five deep bed experiments were conducted in the laboratory
to assess the accuracy of the model predict~ons. Bed depth was 0.75 m
and inlet a1r conditions were maintained almost constant. Drying times
varied from 260 mln to 615 mln and initial moisture content varied
from 62.5 to 76.3%, (d.b.). Shielded thermocouples supported by thin
rods were used to measure air temperatures during the first three
experiments but this technique proved unsatisfactory, possibly due to
the channelling of air. The last two experiments were conducted using
the suspended thermocouple technique of temperature measurement and
were found to be quite satisfactory.
Both the models were validated by comparing the model
predictions with the experimental data. The mean moisture content
and moisture content profile predictions of both the models were found
122
to be in good agreement with experimental results for all the
deep bed experiments. The predicted air temperature for the first
three experiments did not agree with the experimental results possibly
due to the channelling of alr. The predicted air temperature for
the last two experiments were in very good agreement with the
experimental results. Both the models predicted the initial period
of drying for commercial kiln data adequately, but later the difference
between the predicted and observed results increased gradually. This
might be due to insufficient data, a discrepancy in the data and
possibly recirculation in the latter period of the drying.
In general both the models can predict the temperature and
moisture content changes with time and position with reasonable
accuracy for the conditions tested. There is a need for further
testing over a wider range of variables. Practically there is no
difference between the predictions of the two models, Modell takes
less computing time than Model 2.
Model 2 was used to simulate a typical commercial kilning
cycle detailed by the technical staff of a malting company. The effects
of gas fired, indirect fired and recirculated gas fired conditions were
considered. Final equilibrium moisture content for gas fired conditions
is higher than that of indirect fired conditions. Final equilibrium
moisture content for the recirculating condition was the same as that of
the gas fired condition but required a longer time to reach. Rewetting
and increase of air temperature due to the release of heat of adsorption
during the early phase of recirculation were predicted. Energy consumption
for kilning of malt with recirculation was lowest and the highest was for
the direct fired condition.

123
6.5 Future Work
A limited number of experiments have been conducted on the
shrinkage of a malt bed and the effects of loading and compaction have
not been considered in terms of dry bulk density and shrinkage. Further
work on dry bulk density and shrinkage considering the effect of loading
and compaction would be quite useful for the simulation of the deep
bed drying of malt. Specific heat and heat transfer coefficients have
little effect on the variation of temperature and mean moisture content,
and the expressions for these properties have been developed for the
whole range of malting process. Further work on these two variables
does not seem to be justified. Although the latent heat of malt
appeared to have little effect on the distribution of temperature and
mean moisture content, the value of this property increases rapidly at
very low moisture content. Since malt is dried to 2.4 - 4% moisture
content (d.b.) and the use of the expression for latent heat needs
extrapolation below 5.5% moisture content (d.b.), the data below this
moisture content would be quite useful.
The drying constant was determined for a temperature rangeo 030.3 e to 90.2 e. The prediction and experimental data (Fig. 3.12)
show that an extrapolation above 900e might cause serious error in the
use of the equation for drying constant. No thin layer drying was
conducted above 80% relative humidity. So, further work on thin layer dryingofor low relative humidity and high temperature (above 90 e) and high
relative humidity (above 80%) and low temperature would be quite useful
for simulation over a wider range. The air flow resistance of a malt
bed changes during drying and affects the air flow depending on the

124
fan characteristics, which in turn affects temperature and moisture
content distribution in the bed. Further work on air flow resistance
considering the effect of loading and compaction woulg be quite useful
in the model prediction and economy of the malting plant.
Model 2 takes considerably more computing time. Further
theoretical work to improve the numerical technique using the exponential
approximation and central difference scheme without iteration is needed.
Further experimental work on deep bed drying ln the laboratory and
commercial kiln for similar conditions would be useful to assess the
limitations and indicate where development is required.
Simulation of a commercial kilning shows a rewetting and
an lncrease of temperature due to release of heat of adsorption during
the early stage of recirculation. Further work on rewetting and its
effect on temperature variation during kilning of malt would be quite
useful ln the simulation of kilning of malt with recirculation. Once
the programme has been refined, further theoretical work should be
conducted to investigate the effects of different rates of recirculation
after the break within one kiln and the effects of reuse of post break
air from one kiln for pre-break drying on another kiln. It should be
emphasised that before any further development the benefits of the model
should be realized by the malsters and biochemists and should be applied
to the malting industry.
Finally, the value of the programme depends on its application
an the industry. This will require more precise specifications by the
malsters and biochemists of their requirements. The simulation can then
help achieve the quality requirements whilst minimising energy use.

125
REFERENCES
1. ALAM, A. Hygroscopicity and thermal properties of soybeans.Trans. am. Soc. agric. Engrs., 1973, 707-709
2. ALANIS, E.; SARAVIA, L.; ROVETTA, L. Measurement of rock pileheat transfer coefficients. Solar Energy, 1977, 19, 571-572
3. ALLEN, J.R. Application of grain drying theory to the dryingof maize and r~ce. J. agric. Engng. Res., 1960, 5 (4), 363-385
4. BABBIT, J.D. Observations on the adsorption of water vapourby wheat. Can. J. Res., 1949, 27 (F), 55-72
5. BAILEY, P.H. High temperature drying of cereal grain. M.Sc.Thesis, University of Newcastle upon Tyne, 1972
6. BAKKER-ARKEMA, F.W.; ROSENAU, J.R.; CLIFORD, W.H. The effectof grain surface area on the heat and mass transfer rates infixed and moving beds of biological products. Trans. am. Soc.agric. Engrs., 1971, 14 (5), 864-867
7. BAKKER-ARKEMA, F.W.; BRICKET, W.G.; PATTERSON, R.J. Simultaneousheat and mass transfer during the cooling of a deep bed ofbiological products under varying inlet air conditions. J. agric.Engng. Res., 1967, 12 (4), 297-307
8. BAKKER-ARKEMA, F.W.; EVANS, T.W. Michigan State Universitygrain drying methods. A.S.A.E. Paper No. 70-832
J 9. BARKER, J.J. Heat transfer in packed beds. Ind. Engng. Chern.,1965, 57 (4), 43-49
10. BARRE, H.J.; BAUGHMAN, G.R.; HAMDY, M.Y. Application of thelogarithmic model to cross-flow deep bed drying. Trans. am. Soc.agric. Engrs., 1971, 1061-1064
11. BAUGHMAN, G.R.; HAMDY, M.Y.; BARRE, H.J.simulation of deep bed drying of grain.Engrs., 1971, 1058-1060
Analog computerTrans. am. Soc. agric.
12. BECKER, H.A.; SALLANS, H.R. A study of internal moisture movementin the drying of wheat. Cereal Chern., 1955, 32, 212-226
13. BECKER, H.A.; SALLANS, H.R. A study of the desorption isothermsof wheat at 250C and 50oC. Cereal Chern., 1956, 33 (2), 79-91
14. BLOOME, P.D.; SHOVE, G.C. Near equilibrium simulation of shelledcorn drying. Trans. am. Soc. agric. Engrs., 1971, 14 (4),709-712
15. BOWDEN, P.J.; LAMOND, W.J.; SMITH, E.A. Simulation of near-ambient grain drying. 1. Comparison of simulations with experimentalresults. J. agric. Engng. Res., 1983, 28 (4), 279-300

126
16. BOYCE, D.S. Grain moisture and temperature changes withposition and time during through drying. J. agric. Engng.Res., 1965, 10 (4), 333-341
17. BOYCE, D.S. Heat and moisture transfer in ventilated graln.Ph.D. Thesis, University of Newcastle upon Tyne, 1966
18. BOYCE, D.S. Heat and moisture transfer in ventilated graln.J. agric. Engng. Res., 1966, 11 (4), 255-265
19. BROOKER, D.B.; BAKKER-ARKEMA, F.W.; HALL, C.W. Drying cerealgrains. AVI Publishing Company, 1974
20. BROWNE, D.A. Variation of bulk density of cereals withmoisture content. J. agric. Engng. Res., 1962, 7, 288-290
21. CHAPMAN, J. Private Communication, 1982
22. CHINNAN, M.S.; YOUNG, J.H. A study of diffusion equationsdescribing moisture movement in peanut pods - 1. Comparisonof vapour and liquid diffusion equations. Trans. am. Soc. agric.Engrs., 1977, 539-546
23. CHINNAN, M.S.; YOUNG, J.H. A study of diffusion equationsdescribing moisture movement in peanut pods. II. Simultaneousvapour and liquid diffusion of moisture. Trans. am. Soc.agric. Engrs., 1977, 749-753
24. CHINNAN, M.S.; YOUNG, J.H. Computer simulation of bulk dryingof peanut pods. Trans. am. Soc. agric. Engrs., 1978, 354-360 and 366
j
25. CHUNG, D.S.; CONVERSE, H.H. Effect of moisture content on somephysical properties of gralns. Trans. am. Soc. agric. Engrs.,1971, 612-620
26. CHUNG, D.S.; PFOST, H.B. Adsorptionby cereal grains and their products.change of adsorption and desorption.1967 10 (4)~ 549-551 and 555
and desorption of water vapourPart I: Heat and free energyTrans. am. Soc. agric. Engrs.,
27. CHUNG, D.S.; PFOST, H.B. Adsorption and desorption of water vapourby cereal grains and their products. Part II: Development of thegeneral isotherm equation. Trans. am. Soc. agric. Engrs., 1967,10 (4), 552-555
28. CHU, S.T.; HUSTRULID, A. Numerical solution of diffusion equations.Trans. am. Soc. agric. Engrs., 1968, 11 (6), 705-708
29. CHU, S.T.; HUSTRULID, A. General charac teristics of variablediffusivity process and the dynamic equilibrium moisture content.Trans. am. Soc. agric. Engrs., 1968, 11 (6), 709-710 and 715
30. COLBURN, A.P. A method of correlating forced convection heattransfer data and a comparison with fluid friction. Inst. ch. Engrs.,1933, 29, 174-209

127
31. CRANK, J. The mathematics of diffusion. Oxford UniversityPress•,"1979.
32. DAY, D.L.; NELSON, G.L. Desorption isotherms for wheat.Trans. am. Soc. agric. Engrs., 1965, 8 (2), 293-297
33. DISNEY, R.W. The specific heat of some cereal grains.Cereal Chern., 1954, 31, 229-239
34. ENERGY AUDIT SERIES - 15. The malting industry. Departmentof energy and department of industry. Nov. 1981.
35. FORRESTER, J.W. Principles of systems. Second preliminaryedition. MIT Student Centre, 1968.
36. FORTES, M.; OKOS, M.R.; BARRET, J.R. Heat and mass transferanalysis of·intra-kerne1 wheat drying and rewetting. J. agric.Engng. Res., 1981, 26, 109-125
37. FORTES, M.; OKOS, M.R .. A non-equilibrium thermodynamicsapproach to transport phenomena in capillary porous media.Trans. am. Soc. agric. Engrs., 1981, 756-760
38. FORTES, M.; OKOS, M.R; Non-equilibrium thermodynamics approachto heat and mass transfer in corn kernels. Trans. am. Soc.agric. Engrs., 1981, 761-769
39. FURNAS, C.C. Heat transfer from a gas stream to a bed ofbroken solids. Trans. am. Iris t, ch. Engrs. 1930, 24, 142-169
40. GALLAHER, G.L. A method of determining the latent heat ofagricultural crops. Agric. Engng., 1951, 34 and 38
41. GAMSON, B.W.; THODOS, G.; HOUGEN, O.A. Heat, mass and momentumtransfer in the flow of gases through granular solids. Trans.am. Inst. ch. Engrs., 1943, 39, 1-35
42. GILL, P.E.; MURRAY, W. Algorithms for the solution of thenon-linear least-squares problems. SIAM Journal of NumericalAnalysis, 1978, 15 (5) 977-992
43. GREIG, D.J. The determination of the rate constant in thinlayer drying of agricultural crops. J. agric. Engng. Res., 1971,15 (2), 106-110
44. GUSTAFSON, R.J.; HALL, G.E. Equilibrium moisture content ofshelled corn from 50 to 1550F. Trans. am. Soc. agric. Engrs.1974, 17, 120-124
45. GUSTAFSON, R.J.; HALL, G.E.shelled corn during drying.523-525
Density and porosity changes ofTrans. am. Soc. agric. Engrs., 1972,

128
46. HALL, C.W.; RODRIGUEZ-ARIAS, J.H. Application of Newton'soequation to moisture removal from shelled corn at 40 - 140 F.
J. agric. Engng. Res., 1958, 3, 275-280
47. HALL, C.W. Drying farm crops. Lyall Book Depot. Ludhiana,India, 1970.
48. HAMDY, M.Y., BARRE, H.J.deep bed drying of grain.l3 (6), 752-757
Analysis and hybrid simulation ofTrans. am. Soc. agric. Engrs., 1970,
49. HASWELL, G.A. A note on the specific heat of r1ce, oats andtheir products. Cereal Ch. 1954, 31, 341-342
50. HENDERSON, S.M. A basic concept of equilibrium moisture.Agric. Engng. 1952, 29-32
51. HENDERSON, S.M.; PABIS, S. Grain drying theory. I. Temperatureeffect on drying coefficient. J. agr1C. Engng. Res., 1961, 6 (3),169-174
52. HENDERSON, J.M.; HENDERSON, S.M. A computational procedure fordeep bed drying analysis. J. agric. Engng. Res., 1968, 13 (2),87-95
53. HUKILL, W.V. Basic principles in drying corn and sorghum.Agric. Engng. 1947, 28 (8), 335-340
54. HUKILL, W.V. Grain drying, Chapter 13 in Storage of cereal grainsand their products edited by Christensen, C.M. Am. Associationof Cereal Chemists., 1974.
55. HUSSAIN, A.; CHEN, C.S.; CLAYTON, J.T. Simultaneous heat and massdiffusion in biological materials. J. agric. Engng. Res., 1973,18, 343-354
56. INGRAM, G.W. Deep bed drier simulation with intra-particle moisturediffusion. J. agric. Engng. Res., 1976, 21, 263-272
57. INGRAM, G.W.drying ratesexpressions.SIN/204
A general method for deep bed dryer simulation withdetermined by the diffusion equation or empiricalN.I.A.E. Scottish Station, Departmental Note No.
58. JAMES, M.L.; SMITH, G.M.; WOLFORD, J.C. Applied numerical methodsfor digital computation with FORTRAN AND CSMP. Harper and Row,publishers, 1977.
59. JOHNSTON, J.H. St. Physical factors affecting the kilning of barleyand malt. J. Inst. Brew., 1954, 60, 318-340
60. KACHRU, R.P.; OJHA, T.P.; KURUP, G.T. Drying characteristics ofIndian paddy varieties. J. agr ic. Engng. (ISAE). 1971,8 (1),16-23

129
61. KACHRU, R.P.; ~~TTHES, R.K. Kinetics of batch drying ofdeep bed rough rice using dimensional analysis. CerealChern., 1976, 53 (1), 61-71
62. KAZARIAN, E.A.;Trans. am. Soc. HALL, C.W. Thermal properties of graln.
agric. Engrs., 1965, 8, 33-49
63. KREITH, F. Principles of heat transfer. Third edition.Intext Educational Publishers, New York, 1973 •
.64. LEWIS, W.K. The rate of drying of solid materials. J. Ind.Engng ..Chem., 1921, 13 (5), 427-432
65. LbF, G.O.G.; HAWLEY, R.W. Unsteady state heat transfer betweenair and loose solids. Ind. Engng. Chern., 1948, 40 (6), 1061-1070
66. LOGAN, R.K. A discussion of the kiln efficiency. J. Inst.Brew. 1954, 60, 340-343
67. LUIKOV, A.V. Heat and mass transfer in capillary porous bodies.Pergamon Press. 1966.
68. LUIKOV, A.V. Heat and mass transfer. Mir Publishers, Moscow,1980.
69. MATOUK, A.M. Heat and moisture movements during low temperaturedrying and storage of maize grain. Ph.D. Thesis, University ofNewcastle upon Tyne, 1976.
70. McEWEN, E; SIMMONDS, W.H.C.; WARD, G.T. The drying of wheatgrain. Part III: Interpretation in terms of biological structure.Trans. Instn. Chern. Engrs., 1954, 32, 115-120
71. McEWEN, E.; O'CALLAGHAN, J.R. Through drying of deep beds ofwheat grain. The Engineer, 1954, Dec. 10, 817-819
72. McLEOD, M. The physiology of malting - a review. J. Inst. Brew.,1967,73, 146-161
73. MENZIES, D.J. Heat and mass transfer relationships in the dryingof grass. Ph.D. Thesis, University of Newcastle upon Tyne, 1971.
74. MILES, S.R. The relation between the moisture content and thetest weight of corn. J. am. Soc. Agronomy., 1937, 29, 412-418
75. MISRA, R.N.; YOUNG, J.H. Numerical solution of simultaneousmoisture diffusion and shrinkage during soybean drying. Trans. am.Soc. agric.Engrs., 1980, 1277-1282.
76. MISRA, M.K.; BROOKER, D.B. Thin layer drying and rewettingequations for shelled yellow corn. Trans. am. Soc. agric. Engrs.,1980, 1254-1260.

130
77. MOREY, R.V.; KEENER, H.M.; THOMPSON, T.L.; WHITE, G.M.;BAKKER-ARKEME, F.W. The present status of grain dryingsimulation. A.S.A.E. Paper No. 78-3009
78. MOREY, R.V.; CLOUD, H.A.; GUSTAFSON, R.J.; PETERSEN,. D.W.Evaluation of the feasibility of solar energy grain drying.Trans. am. Soc. agric. Engrs., 1979, 22, 409-417.
79. MORITA, T; SINGH, R.P.short grain rough rice.1979, 630-636.
Physical and thermal properties ofTrans. am. Soc. agric. Engrs.
80. MUIR, W.E.; VIRAVANICHA I, S. Specific heat of wheat, J. agr~c.Engng. Res., 1972, 17, 338-342
81. NARZISS, L. Die technogie der malzbareitung. Ferdinand enke.Bertag, Stuttgart, 1976, P294
82. NELLIST, M.E. The drying of ryegrass seeds in deep layers.Ph.D. Thesis, University of Newcastle upon Tyne, 1974.
83. NELLIST, M.E. Exposed layer drying of ryegrass seeds.J. agric. Engng. Res. 1976, 21, 49-66
84. NELLIST, M.E. Private Communication, 1983.
85.
86.
87.
88.
89.
90.
91.
92.
NEWMAN, A.B. The drying of porous solids: diffusion and surfaceemission equations. Trans. am. Inst. Chem. Engrs., 1931,203-220.
O'CALLAGHAN, J.R. Drying of wheat grain: Effects of air conditionon through drying. M.Sc. Thesis, University of Durham, 1954.
O'CALLAGHAN, J.R.; MENZIES, D.J.; BAILEY, P.H. Digital simulationof agricultural drier performance. J. agric. Engng. Res., 1971,16 (3), 223-244.
OTHMER, D.F. Correlating vapour pressure and latent heat data.Ind. Engng. Chem., 1940, 32 (6), 841-856
PABIS, S.; HENDERSON, S.M. Grain drying theory: II A criticalanalysis of the drying curve for shelled maize. J. agric. Engng.Res. 1961, 6 (4), 272-277
PABIS, S; HENDERSON, S.M. Grain drying theory: III. The air/grain temperature relationship, J. agric. Engng. Res., 1962,7 (1), 21-26
PICHLER, H.J. Sorption isotherms of gra~n and rape (Translation).J. agric. Engng. Res., 1957, 159-165
PIXTON S W . HENDERSON S The mo;sture content - equilibrium, .. , ,. ...relative humidity of malt. Unpublished report, Ministry ofAgriculture, Fisheries and Food, Slough Laboratory, England, 1981

131
93. PIXTON, S.W.; HOWE, R.W. The suitability of various lineartransformations to represent the sigmoid relationship ofhumidity and moisture content. J. stored prod. Res., 1983,19 (1), 1-18
94. PFALZNER, P.M. The specific heat of wheat. Can. J. Tech. 1951,29, 261-298
95. POMERANZ, Y. Scanning electron microscopy of the endospermof malted barley. Cereal Chern. 1972, 49 (1), 5-6, 9-11, 18-19
96. ROGERS,_ G.F.C.; MAYHEW, Y.R. Engineering thermodynamics workand heat transfer, Third edition, Longman, London, 1980.
97. ROGERS, G.F.C.; MAYHEW, Y.R. Thermodynamic and transport propertiesof fluids (S.I. units). Third edition. Basil Blackwell, Oxford,1980.
98. SIEBEL, F. Specific heats 'of various products. Ice and Refrigeration1892, 2, 256-257 (cited by Nuri Mohsenin. Thermal properties offoods and agricultural materials, P 26-27, Gordon and Breach, 1980)
99. SCHUMANN, T.E.W. Heat transfer: A liquid flowing through a porousprlsm. J. Frankline Inst. 1929, Sept. 405-416.
100. SFAT, M.R. Bio-engineering principles of malt kilning. The brewersdigest, 1965, July, 50-54
101. SHARAF-ELDEEN, Y.I.; HAMDY, M.Y.; KEENER, H.M. Mathematicaldescription of drying fully exposed grains. A.S.A.E. Paper No.79-3034
102. SHARAF-ELDEEN, Y.I.; HAMDY, M.Y.; BLAISDELL, J.L. Mathematicalsimulation of drying fully exposed ear corn and its components.A.S.A.E. Paper No. 79-6523
103. SHARAF-ELDEEN, Y.I.; BLAISDELL, J.L.; HAMDY, M.Y. A model of earcorn drying. Trans. am. Soc. agric. Engrs., 1981, 1261-1265, 1271
104. SHARMA, A.D.; KUNZE, O.R.; TOLLEY, H.D. Rough rice drying as atwo-compartment model. Trans. am. Soc. agrlc. Engrs., 1982, 221-224
105. SHARMA, S.C.; MUIR, W.E. Simulation of heat and mass transferduring ventilation of wheat and rapeseed bulks. Can. Agric. Engng.1974, 16 (1), 41-44
106. SHERWOOD, T.K. Application of theoretical diffusion equationsto the drying of solids. Trans. am. lnst. Chern. Engrs. 1931, 27,190-202
107. SHIPLEY, J.H.; CAMBELL, W.B.; MAAS, O. The heat content of wateradsorbed on cellulose, Can. J. Res., 1939, 17 (B), 40-50

132
108. SIMMONDS, W.C.H.; WARD, G.T.; McEWEN, E.grain. Part I: The mechanism of drying.Engrs. 1953, 31 (3)~ 265-278
The drying of wheatTrans. Instn. Chern.
109. SMITH, S.E. The sorption of wat er vapour by high polymers.J. am. chern. Soc., 1947, 69, 646-651
110. SMITH, E.A. Simulation of grain drying when air-flow is non-parallel. J. agric. Engng. Res., 1982, 27, 21-23
Ill. SPENCER, H.B. A mathematical simulation of grain drying.J. agric. Eng~g. Res., 1969, 14 (3), 226-235
112. SPENCER, H.B. A revised model of wheat drying process. J. agric.Engng. Res., 1972, 17 (1), 189-194
113. STEFFE, J.F.; SINGH, R.P. Liquid diffusivity of rough ricecomponents. Trans. am. Soc. agric. Engrs., 1980, 767-774
114. STITT, F.; KENNEDY, E.K. Specific heats of dehydrated vegetablesand egg powder. Food Research, 1945, 10, 426-436
115. STROHMAN, R.D.; YOEGER, R.R. A new equilibrium moisture contentequation. Trans. am. Soc. agric. Engrs., 1967, 10 (5), 675-677
116. STURGESS, L.M.; KNELL, C.J. British malting barley: Supply anddemand. Home-grown Cereal Authority, London, 1978.
117. THOMPSON, R.A.; ISAACS, G.W. Porosity determinations of grainsand seeds with an air comparison pycnometer. Trans. am. Soc.agric. Engrs., 1967, 693-696.
118. THOMPSON, T.L.; PEART, R.M.; FOSTER, G.H. Mathematical simulationof corn drying - A new model, Trans. am. Soc. agric. Engrs., 1968.11 (4), 582-586
119. THOMPSON, T.L. Temporary storage of high moisture shelle~ cornusing continuous aeration. Trans. am. Soc. agric. Engrs., 1972,15 (2), 333-337
120. TROEGER, J.M.; HUKILL, W.V.rate of fully exposed corn.1153-1162
Mathematical description of the dryingTrans. am. Soc. agric. Engrs. 1971,
121. TUERLINC~~, G.; BERCK}~NS, D.; GOEDSEELS. V. Desorption isothermsof malt. Brauwissenschaft, Jahrgang 35, Heft 3/1982
122. VAN ARSDEN, W.B. Simultaneous heat and mass transfer in a non-isothermal system: through-flow drying in the low moisture range.Am. Inst. Chern. Engng~, 1955, Chern. Engng. Progress SymposiumSeries No. 16, Mass-Transfer, 47-58

133
123. VAN REST, D.J.; ISAACS, G.W. Exposed layer drying rates ofgrain. Trans. am. Soc. agric. Engrs., 1968, 11 (2), 236-239
124. VEMUGANTI, G.R.; PFOST, H.B. Physical properties related todrying of 20 food grains.A.S.A.E. Paper No. 80 - 3539
125. WANG, C.Y.; RUNSEY, T.R.; SINGH, R.P. Convective heat transferin packed bed of rice. A.S.A.E. Paper No. 79 - 3040
126. WANG, C.Y.; SINGH, R.P. A single 1ayer·drying equation forrough rice. A.S.A.E. Paper No. 78-3001
127. WATSON, E.L.; BHARGAVA, V.K. Thin layer drying studies on wheat.Can. J. agric. Engng., 1974, 16 (1), 18-22
128. IfflSTERMAN , P.W.; WHITE, G.M.; ROSS, I.J. Relative humidity effecton high temperature drying of shelled corn. Trans. am. Soc. agric.Engrs., 1973, 1136-1139
129. WHITE, G.M.; ROSS, I.J.; WESTERMAN, P.W. Drying rate and qualityof white shelled corn as influenced by dew point temperature.Trans. am. Soc. agric. Engrs., 1973, 16 (1), 118-120
130. WHITE, G.M.; BRIDGES, T.C.; LOEWER, O.J.; ROSS, I.J. Thin layerdrying model for soybeans, Trans. am. Soc. agric. Engrs., 1981,1643-1646
131. WHITE, G.M.; ROSS, I.J.; PONELEIT, C.G. Fully exposed drying ofpopcorn. Trans. am. Soc. agric. Engrs., 1981, 466-468, 475
132. WILEMAN, R.H. Shrinkage of artificially dried seed corn. Agric.Engng., 1941, July, 256.
133. WOODFORDE, J.; LAWTON, P.J. Drying cereal grain in beds sixinches deep. J. agric. Engng. Res. 1965, 10 (2), 146-171
134. WRATTEN, F.T.; POLE, W.D.; CHESNESS, J.L.; BAL, S.; RAMARAO, V.Physical and thermal properties of rough rice. Trans. am. Soc.agric. Engrs., 1969, 12 (6), 801-803
135. YOSHIDA, F.; RAMASWAMI, D.; HOUGEN, O.A. Temperatures and partialpressures at the surfaces of catalyst particles. A.I. Ch. E.Journal. 1962, 8 (1), 5-11