decision tree classification and k means clustering with weka - 10bm60040 - vgsom
DESCRIPTION
This term paper would explain the methods of classifying and clustering data using Weka an open source data mining and analysis tool. This paper would explore two methods namely Decision tree classification and K Means clustering of data. However the tool can be used for many other methods of analysis.TRANSCRIPT
Decision Tree Classification andK Means Clustering Using Weka
Kumar Abhishek (10BM60040)
Keywords:
Data mining, decision tree, K Means, Weka.
Abstract:
This term paper would explain the methods of classifying and clustering data using Weka an open source data mining and analysis tool. This paper would explore two methods namely Decision tree classification and K Means clustering of data. However the tool can be used for many other methods of analysis.
Vinod Gupta School of Management, IIT Kharagpur 1

IntroductionIdentifying patterns in data and being able to make predictions based on the patterns plays significant role in all aspects of an industry or an individual business. A plethora of methods and tools are available. This paper is an attempt to introduce two such methods namely Decision tree classification and K Means clustering using a tool called Weka.
Decision TreesThis is a method of classification of data. The ultimate aim is to predict where a target variable would lie. We start with a data collection and make the system learn about the various classes. Later this model can be used to predict where a new variable would fit in. Splitting the source data into subsets based on some rules does it. This process is called recursive partitioning as it is repeated for each subset of data. It is repeated till further partitioning does not add any value to predictions. All the variables have the same value at a particular node. There are various algorithms available for performing partitions like CART, C4.5 and J48.
Advantages Simple to understand and interpret. Requires little data preparation. Able to handle both numerical and categorical data. Possible to validate a model using statistical tests. Robust. Performs well even if its assumptions are somewhat violated by
the true model from which the data were generated. Performs well with large data in a short time.
Limitations Trees can get very complex. Sometimes trees can become prohibitively large. Information from a tree is biased towards attributes with more levels.
K Means ClusterThis method of data analysis aims to partition n observations into k clusters in which each observation belongs to the cluster with the nearest mean. Following are the basic steps of the process:
For each data point calculate the distance from the data point to each cluster.
If the data point is closest to its own cluster, leave it where it is. If the data point is not closest to its own cluster, move it into the closest cluster.
Repeat the above step until a complete pass through all the data points results in no data point moving from one cluster to another.
At this point the clusters are stable and the clustering process ends. The choice of initial partition can greatly affect the final clusters that
result, in terms of inter-cluster and intra cluster distances and cohesion.
Vinod Gupta School of Management, IIT Kharagpur 2

Advantages With a large number of variables, K-Means may be computationally faster
than hierarchical clustering (if K is small). K-Means may produce tighter clusters than hierarchical clustering,
especially if the clusters are globular.
Limitations Euclidean distance is used as a metric and variance is used as a measure
of cluster scatter. The number of clusters k is an input parameter: an inappropriate choice
of k may yield poor results. That is why, when performing k-means, it is important to run diagnostic checks for determining the number of clusters in the data set.
Data SetA bank has collected data for 100 customers and categorized them into either group 1 or 0. The attributes for which data is collected are:
Salary Commission Age Elevel Car Zipcode Hvalue - Highest value of loan Hyears – Number of years of repayment Loan
Vinod Gupta School of Management, IIT Kharagpur 3

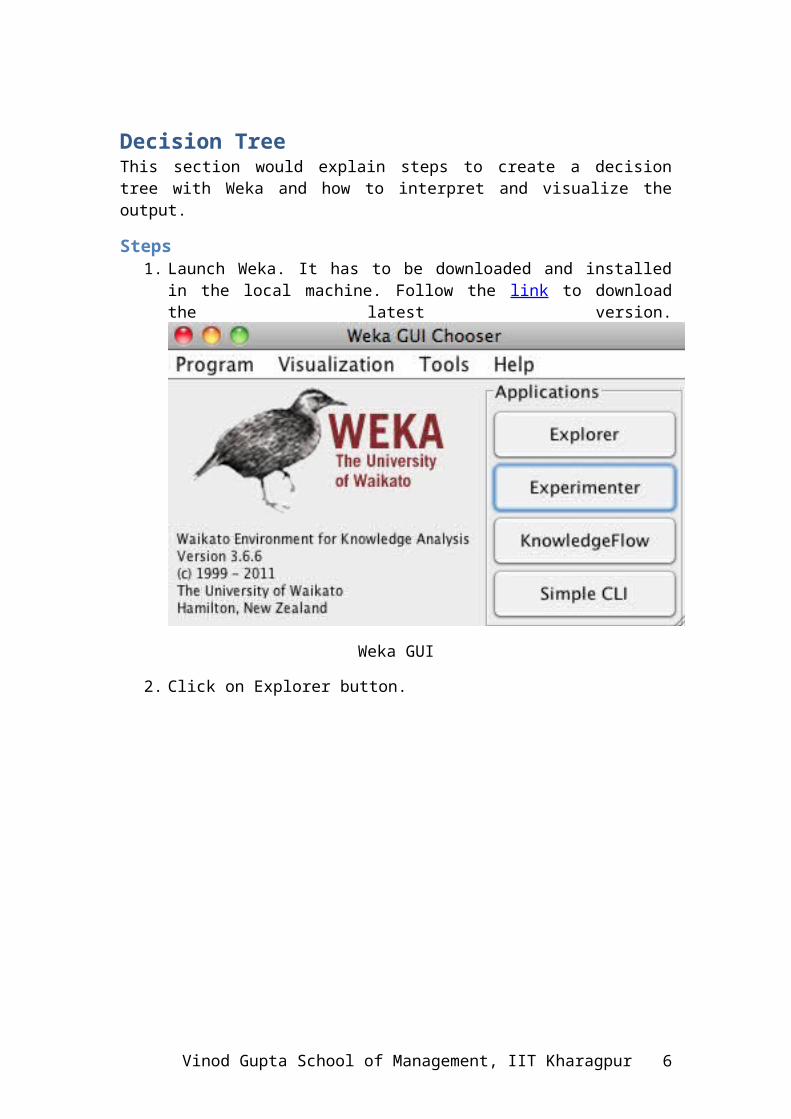
Decision TreeThis section would explain steps to create a decision tree with Weka and how to interpret and visualize the output.
Steps1. Launch Weka. It has to be downloaded and installed in the local machine.
Follow the link to download the latest version.
Weka GUI
2. Click on Explorer button.
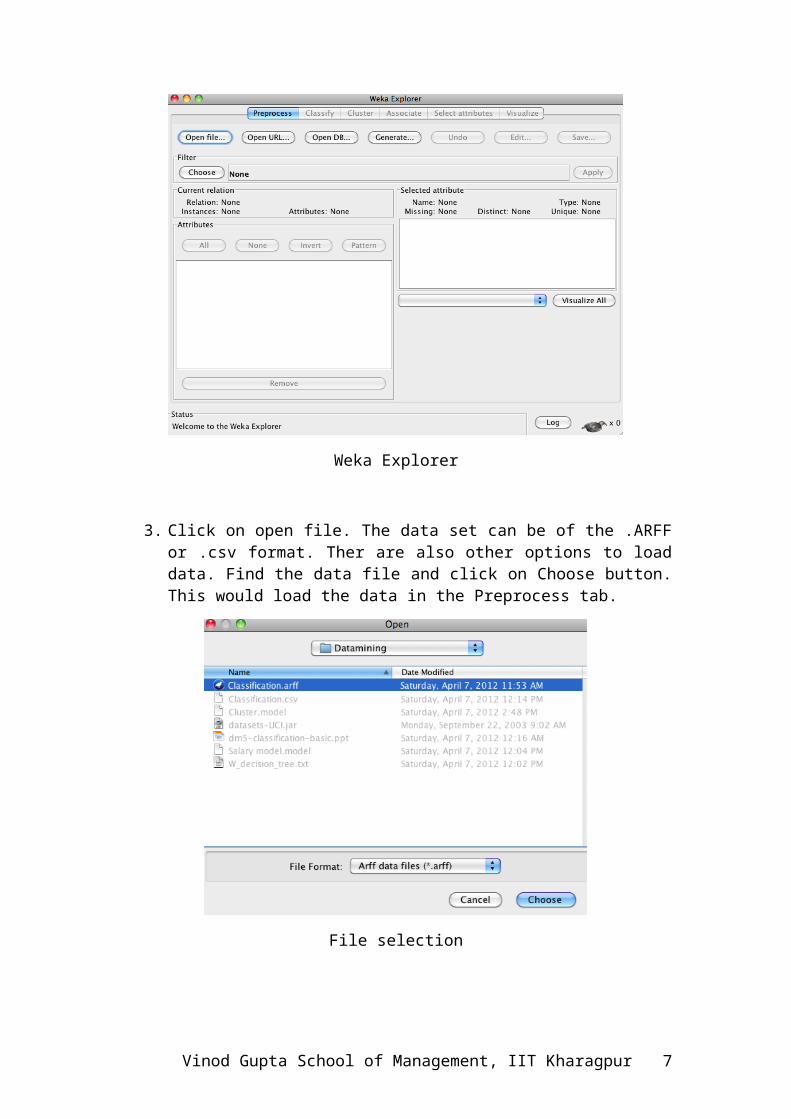
Weka Explorer
Vinod Gupta School of Management, IIT Kharagpur 4

3. Click on open file. The data set can be of the .ARFF or .csv format. Ther are also other options to load data. Find the data file and click on Choose button. This would load the data in the Preprocess tab.
File selection
Preprocess tab
4. Go to Classify tab. From the Classifier section Click on the Choose button. Select the J48 rule from the list. Let the rest of the options be as shown in figure. Weka makes reasonable assumptions for parameters. Then click on the start button.
Vinod Gupta School of Management, IIT Kharagpur 5
Output window
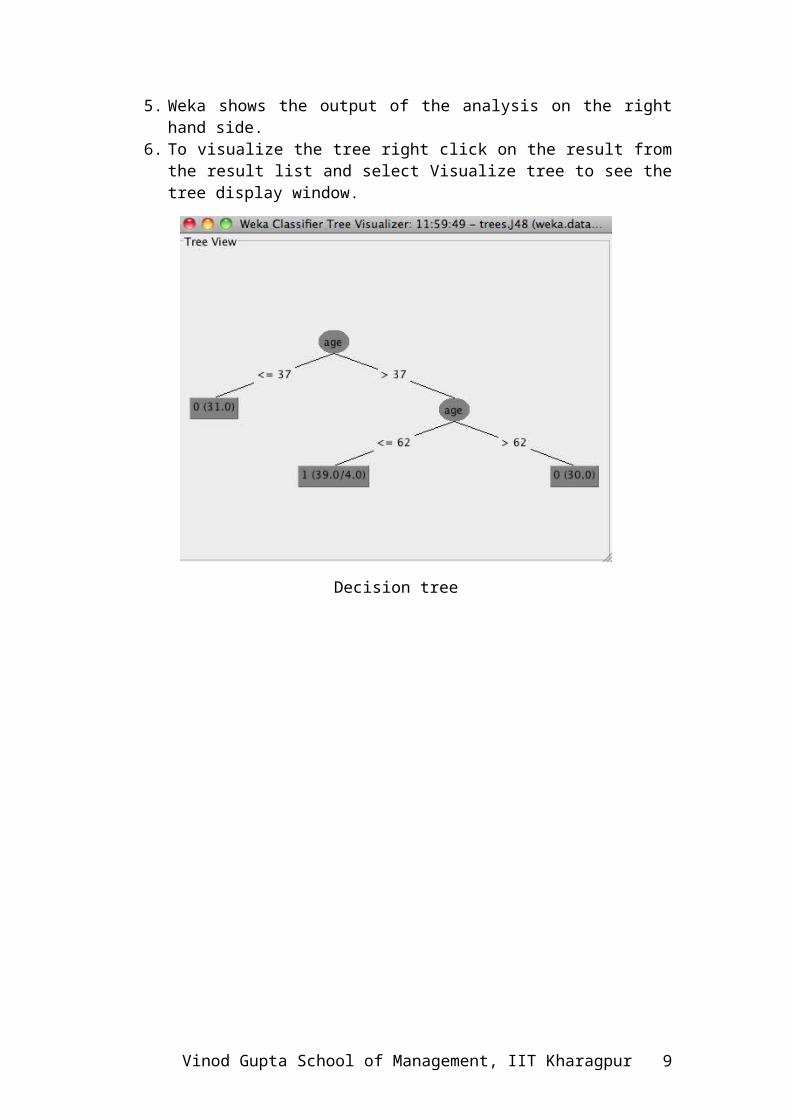
5. Weka shows the output of the analysis on the right hand side.6. To visualize the tree right click on the result from the result list and select
Visualize tree to see the tree display window.
Decision tree
Vinod Gupta School of Management, IIT Kharagpur 6
Output=== Run information ===Scheme:weka.classifiers.trees.J48 -C 0.25 -M 2Relation: weka.datagenerators.classifiers.classification.Agrawal-S_1_-n_100_-F_1_-P_0.05Instances: 100Attributes: 10 salary commission age elevel car zipcode hvalue hyears loan groupTest mode: 10-fold cross-validation
=== Classifier model (full training set) ===
J48 pruned tree------------------
age <= 37: 0 (31.0)age > 37| age <= 62: 1 (39.0/4.0)| age > 62: 0 (30.0)
Number of Leaves : 3
Size of the tree : 5
Time taken to build model: 0.05 seconds
=== Stratified cross-validation ====== Summary ===
Correctly Classified Instances 93 93 %Incorrectly Classified Instances 7 7 %Kappa statistic 0.8472Mean absolute error 0.0977Root mean squared error 0.2577Relative absolute error 21.4022 %Root relative squared error 53.9683 %Total Number of Instances 100
=== Detailed Accuracy By Class ===
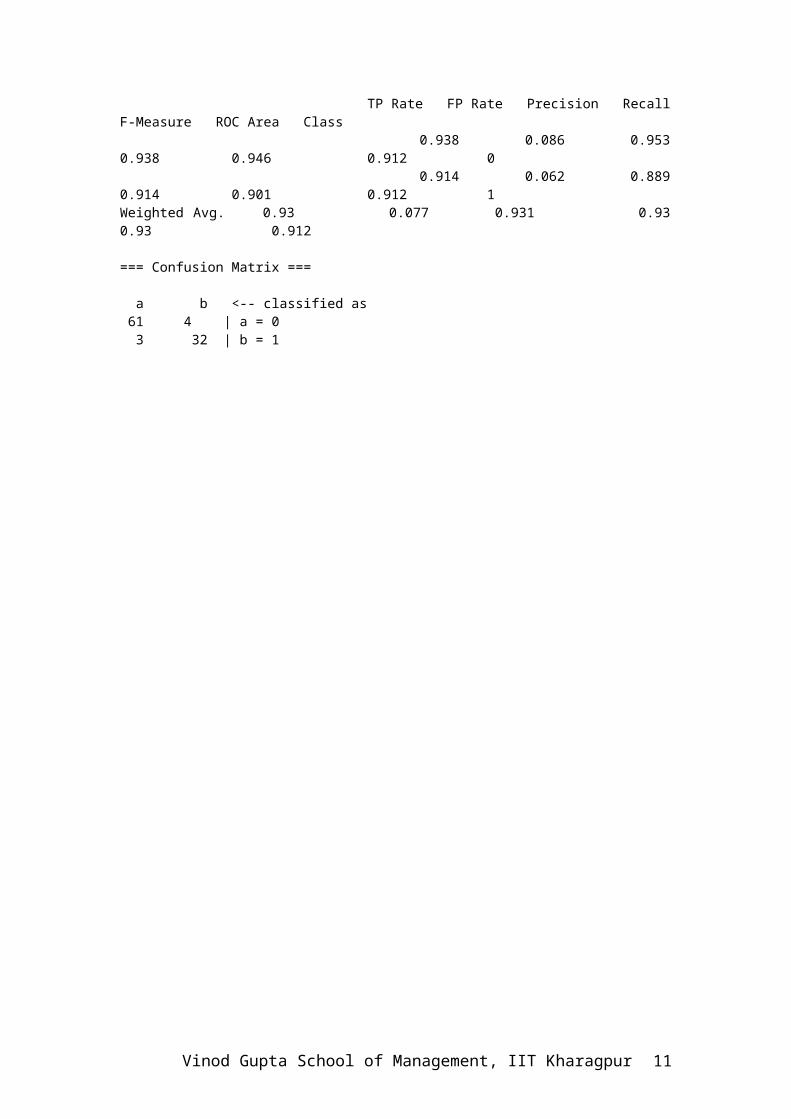
TP Rate FP Rate Precision Recall F-Measure ROC Area Class 0.938 0.086 0.953 0.938 0.946 0.912 0 0.914 0.062 0.889 0.914 0.901 0.912 1Weighted Avg. 0.93 0.077 0.931 0.93 0.93 0.912
=== Confusion Matrix ===
a b <-- classified as 61 4 | a = 0 3 32 | b = 1
Vinod Gupta School of Management, IIT Kharagpur 7

Interpretation of outputThe previous section shows the complete output. At the beginning is a summary of the dataset. Cross validation was used to evaluate it. Attributes of data set are also shown.
Then under the J48 Pruned tree. The textual decision tree is shown. Splits are made based on the age attribute. In the tree structure, a colon introduces a class label that has been assigned to a particular leaf, followed by the number of instances that reach that leaf, expressed as decimal number. Thus at age <= 62 level 39.0/4.0 means that 39 instances reached the leaf out of which 4 are classified incorrectly. Number of leaves and size of tree are mentioned which in this case are 3 and 5 respectively.
The next part of the output gives the tree’s predictive performance. As seen 7% (7 out of 100) instances are classified incorrectly. At the end confusion matrix is given. From there we can see that 64 instances of group 0 and 32 instances of group 1 are correctly classified. 4 instances of group 0 are incorrectly assigned to group 1 and 3 instances of group 1 are assigned to group 0.
Kappa statistic is used to measure agreement between predicted and observed categorization of dataset, while correcting for an agreement that occurs by chance. In this case it is around 84%.
Vinod Gupta School of Management, IIT Kharagpur 8
K Means ClusterThis section would explain the K means clustering. The data set would be same as the one used in the decision tree. Here the customers would be clustered on their similarities into groups.
Steps1. Follow the steps till step 3 in the decision tree process to load and
prepare data in Weka. Go to the cluster tab by pressing the Cluster button on the top of Weka window.
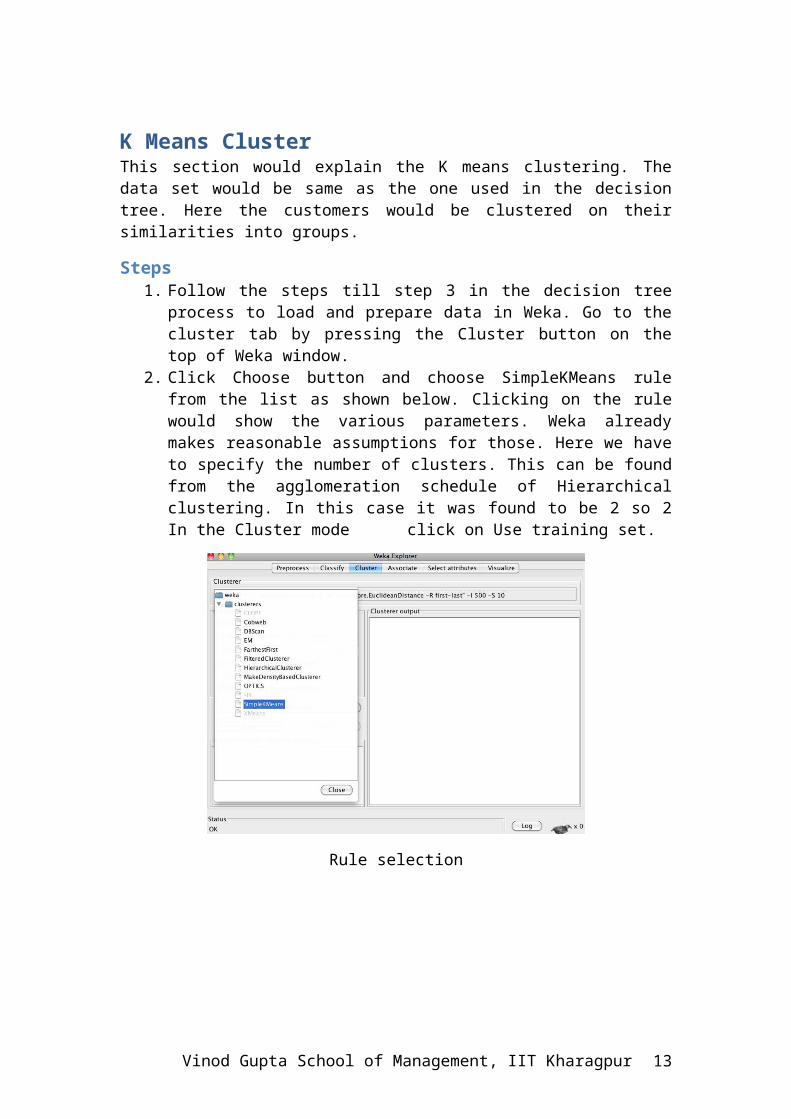
2. Click Choose button and choose SimpleKMeans rule from the list as shown below. Clicking on the rule would show the various parameters. Weka already makes reasonable assumptions for those. Here we have to specify the number of clusters. This can be found from the agglomeration schedule of Hierarchical clustering. In this case it was found to be 2 so 2 In the Cluster mode click on Use training set.
Rule selection
Number of clusters
Vinod Gupta School of Management, IIT Kharagpur 9

3. Click on the Start button to generate output as shown below.
Output
4. Right click on the result for options and select Visualize cluster assignments to get the visualization of results as shown below.
Cluster assignments
Vinod Gupta School of Management, IIT Kharagpur 10
Output=== Run information ===
Scheme: weka.clusterers.SimpleKMeans -N 2 -A "weka.core.EuclideanDistance -R first-last" -I 500 -S 10Relation: weka.datagenerators.classifiers.classification.Agrawal-S_1_-n_100_-F_1_-P_0.05Instances: 100Attributes: 10 salary commission age elevel car zipcode hvalue hyears loan groupTest mode: evaluate on training data
=== Model and evaluation on training set ===
kMeans======Number of iterations: 4Within cluster sum of squared errors: 313.23293708458965Missing values globally replaced with mean/mode
Cluster centroids: Cluster#Attribute Full Data 0 1 (100) (55) (45)================================================salary 76506.8492 93821.2199 55344.8406commission 22893.0265 13121.7237 34835.73age 49.57 49.5455 49.6elevel 2 4 0car 6 8 10zipcode 1 2 0hvalue 130829.1991 131134.2686 130456.3364hyears 16.71 16.9636 16.4loan 250972.2305 257594.1869 242878.7283group 0 0 0
Time taken to build model (full training data): 0.03 seconds
=== Model and evaluation on training set ===
Clustered Instances
0 55 ( 55%)1 45 ( 45%)
Vinod Gupta School of Management, IIT Kharagpur 11
Interpretation of outputThe output of Weka shows that Euclidean distance was used with two clusters. Result of clustering is shown in the table with rows that are attribute names and columns that correspond to the cluster centroid. Number of instances is mentioned in parentheses at the top of the table. Each table entry is either mean (numeric value) or mode (nominal value) of the corresponding attribute for the cluster in that column.
Characteristics of clusters: Average ages of both clusters are same (49 yrs. approx.) However people of cluster 0 earn more than the other cluster. People of first cluster take more loans. Loan tenure is almost similar at 16 years. People of cluster 0 are more educated.
ConclusionThere are numerous other analyses available for users in Weka. Here however only two of them were shown. Weka also provides easy and efficient ways to visualize results.
Vinod Gupta School of Management, IIT Kharagpur 12
BibliographyWitten, I. H., Frank, E., & Hall, M. A. (2012). Data Mining - Practical Machine Learning Tools and Techniques (2rd Edition ed.). Morgan Kaufmann.
Wikipedia. (2012, March 28). Decision_tree_learning. Retrieved April 6, 2012, from Wikipedia: http://en.wikipedia.org/wiki/Decision_tree_learning
Wikipedia. (2012, April 7). K-means_clustering. Retrieved April 9, 2012, from Wikipedia: http://en.wikipedia.org/wiki/K-means_clustering
Hall, M., Frank, E., Holmes, G., Pfahringer, B., Reutemann, P., & Witter, I. H. (2009). The WEKA Data Mining Software: An Update. 11 (1).
Vinod Gupta School of Management, IIT Kharagpur 13