decentralization’s effects on education, health and agriculture outcomes… sto… · ·...
TRANSCRIPT

Decentralization’s effects on education, health and agriculture outcomes, and
on distribution: Evidence from Ethiopia
Qaiser Khan1 Jean-Paul Faguet2
Christopher Gaukler3 Wendmsyamregne Mekasha4
15 June 2014
Abstract
Decentralization is meant to improve public services, but relatively few studies examine this question empirically. We explore the effects of decentralization on education, health and agriculture outcomes in Ethiopia using an original database covering all of the country’s woredas (i.e. local governments), which will itself eventually be an important contribution of this paper. Ethiopia is an interesting case study for two big reasons: (i) It is the fastest growing country in Africa and one of the 5 fastest-growing in the world; and (ii) Since decentralizing the country has made significant progress towards its MDGs and in reducing poverty. We show that decentralization improved net enrolments in education, access to basic services in health such as antenatal care, contraception, vaccination rates, and deliveries by skilled birth attendants, and contributed to greater agricultural productivity in cereals, vegetables, enset, coffee and fruits.
Keywords: decentralization, education, health, agriculture, public investment, Ethiopia, local government
JEL: H41, H75, H77, 01
1 Ethiopia Country Office, World Bank, Africa Avenue (Bole Road), Addis Ababa. 2 Department of International Development and STICERD, London School of Economics, Houghton Street, London WC2A 2AE, UK, +44-20-7955-6435 (o), 7955-6844 (f), [email protected] (contact author) 3 Ethiopia Country Office, World Bank, Africa Avenue (Bole Road), Addis Ababa. 4 Ethiopia Country Office, World Bank, Africa Avenue (Bole Road), Addis Ababa.

1. Introduction
With 90 million inhabitants, 90+ ethnic and linguistic groups, and a sustained growth rate
of over 10% in recent years, Ethiopia is a big, diverse, important developing country. The
country’s social and geographic diversity, combined with a federal structure and sincere
decentralization5 pursued since the early 1990s, make it an ideal context in which to study the
effects of decentralization on social services and outcomes in key sectors such as education,
health and agriculture, as well as their distribution. This paper does so with an original database
of woreda (read “municipal”) economic, social and demographic characteristics that the authors
painstakingly constructed from official sources.
The evidence that Ethiopia can offer is especially welcome in light of the inconclusive
nature of the empirical evidence accumulated over the past four decades. This is especially true
of the older decentralization literature from the 1960s-1990s. Consider the broadest surveys of
that work. Rondinelli, Cheema and Nellis (1983) note that decentralization has usually
disappointed its partisans. Most developing countries implementing decentralization experienced
serious administrative problems. Although few comprehensive evaluations of the benefits and
costs of decentralization efforts have been conducted, those that were attempted indicate limited
success in some countries but not others. A decade and a half later, surveys by Piriou-Sall
(1998), Manor (1999) and Smoke (2001) are slightly more positive, but with caveats about the
strength of the evidence in decentralization’s favor. Manor notes that the evidence, though
extensive, is still incomplete, but ends his study with the opinion that ‘while decentralization …is
no panacea, it has many virtues and is worth pursuing’. Smoke, by contrast, finds the evidence
5 Sincere decentralization is defined as reform that effectively devolves power and resources from central to subnational levels of government, as opposed to insincere reforms that leave power resources at the center. For a more detailed discussion, see Faguet (2012).

mixed and anecdotal, and asks whether there is empirical justification for pursuing
decentralization at all. Given the sheer size of this literature, the lack of progress is surprising.
By contrast, more recent empirical studies distinguish themselves in two important ways:
(i) They are often technically more sophisticated than the older, more case-study based literature,
as developing-country datasets have improved enormously over recent decades; and (ii) They are
generally more positive about decentralization’s potential. Only five recent studies that we know
of address the link between decentralization and substantive outcomes directly and with rigorous
quantitative evidence. These include Escaleras and Register (2012), who find that fiscal
decentralization is associated with lower natural disaster death rates, implying more effective
preparation and/or responses to natural disasters by countries with decentralized governments.
Clark (2009) applies regression discontinuity to a natural experiment from Britain to show that
schools that opt out of the centralized educational regime – in effect decentralizing themselves –
enjoy large increases in student achievement. Galiani, Gertler and Schargrodsky (2008) find that
decentralization of school control from central to provincial governments in Argentina had a
positive impact on student test scores. The poorest, however, did not gain, and indeed may have
lost. Barankay and Lockwood (2007) find that greater decentralization of education to Swiss
cantons is associated with higher educational attainment, especially for boys. And Faguet and
Sánchez (2013) find that decentralization improved enrollment rates in public schools and access
of the poor to public health services in Colombia. In both sectors, small increases in own-shares
of spending led to surprisingly large increases in the access of the poor. The evidence implies
that decentralization provided local officials with the information and incentives required to
allocate resources responsively according to voters’ needs, and improve the impact of public
expenditures. This study hopes to add empirical evidence from a low income country with large,

important decentralization and public investment programs, where results are potentially
significant.
Ethiopia is a particularly good context in which to study the decentralized provision of
primary services for three reasons: (1) The country’s size and recent development experience
give it a natural importance in the development community; (2) Its geographic and socio-cultural
diversity are amongst the highest in the world, providing natural sources of variation that a study
such as this can exploit analytically; and (3) Local services are supported by the Promotion of
Basic Services program, the biggest donor-financed program in the world.
Ethiopia has achieved impressive development results in recent years. That progress
includes rapid and significant improvements in basic service delivery indicators. An Overseas
Development Institute study (2010) noted that Ethiopia is making the third-fastest improvements
of any country towards reaching the Millennium Development Goals (MDGs). The latest
Ethiopia Demographic and Health Survey data show that child mortality has fallen from 123 per
thousand in 2005 to 88 in 2010, and primary net enrollment rates rose from 68 percent in
2004/2005 to 82 percent in 2009/2010. Such progress on basic service delivery is coupled with
an impressive growth record over the past decade. GDP grew on average 11 percent per year
during 2004/5-2009/10, according to official estimates. Initially led by agriculture, growth has
become more broad-based, with a rising contribution from the mining, services and
manufacturing sectors. While growth has slowed recently, it still remains among the highest in
the world. Based on official data, the population below the national absolute poverty line fell
from 38.7 percent in 2004/2005 to 29.6 percent in 2011. Ethiopia achieved the MDG-4 (Child

Mortality) target earlier this year, ahead of schedule, and appears to be on track to reach the other
MDGs by 20156.
Ethiopia is also home to a great diversity of ecological zones and ethnic and linguistic
groups. Its vast system of mountains and highland plateaus is bisected by the Great Rift Valley,
itself surrounded by lowland steppes and semi-deserts. In the east are remote deserts containing
some of the hottest human settlements on earth, while to the south there are tropical forests.
With 93 officially recognized mother tongues and 98 ethnicities by the Ethiopian census, the
country is also one of the most ethno-culturally diverse societies on earth. Detailed information
on such environmental and social characteristics disaggregated to woreda level makes Ethiopia a
rich context for the study of a broad range of development issues.
Decentralization is henceforth defined as the devolution by central government of
authority over specific functions, together with the administrative, political and economic
attributes that these entail (e.g., tax-raising, expenditure, and decision-making powers), to
democratic regional and local governments that are independent of the center within a legally
delimited geographic and functional domain. The rest of this paper is organized as follows.
Section two discusses the Ethiopian decentralization program within the broader historical
context of its long imperial, centralizing tradition, and provides descriptive statistics for public
investment flows to education, health and agricultural services. Section three discusses the
dataset and presents our methodology. Section four examines decentralization’s effects on
services and outcomes in the same three sectors, as well as their distribution, with econometric
evidence. Section five concludes.
6 UNICEF 2013 Committing to Child Survival: A Promise Renewed. Progress Report 2013 , New York, UNICEF.

2. Centralization and decentralization in Ethiopia
2.1 History and background
The ethnic composition of Ethiopia is the result of a turbulent history. As it consolidated
itself during the medieval period, the country was comprised primarily of the Tigray, Agaw and
Amhara peoples. With Menelik II’s ascension to the throne in 1889, a period of territorial
expansion began, whose base was the province of Shoa in the current region of Amhara. Areas
consisting of today’s Beneshangul-Gemuz, Gambella, Southern Nations and Nationalities, Afar,
Oromia and Somali regions were brought under the feudal system of the Ethiopian empire.
Following the battle of Adwa in 1896 and the resulting European recognition of Ethiopian
statehood, a series of border treaties with the surrounding colonial powers were signed. The
modern Ethiopian state was born.
Relations between the newly integrated areas and the historic center of the empire were
troubled. Menelik sent governors from the center to administer the periphery, but owing to the
structural weakness of the center, successive Ethiopian governments did not command effective
control over the peripheries. Similarly, exploitative economic policies caused visible
marginalization, relative under-development, and less integration among the border regions
within Ethiopia.7 This hold of the center over the peripheries continued to increase. According to
noted Ethiopian historian Bahru Zewde:
The period after 1941 witnessed the apogee of absolutism. The tentative beginnings in this direction of the pre-1935 years matured into untrammeled autocracy. The power of the state reached a limit unprecedented in Ethiopian history.8
7 Mulugeta, Allehone, Issues of Security and Conflict, in the Ethiopian Frontiers: Notes on State Policies and Strategies, in Report of Ethiopia National Workshop - Conflict in the Horn: Prevention and Resolution, (OSSREA Publications), (2002). 8 Zewde, Bahru, A History of Modern Ethiopia 1855-1974, Addis Ababa: Addis Ababa University Press, (1991).

The revised constitution of 1955 solidified the absolute powers of the emperor, claiming “His
dignity… inviolable and His power… indisputable”. It also entrenched Amharic as sole the
official language and the Ethiopian Orthodox Church as the national religion.
The period of socialist rule (1974-1991) saw no diminution in the center’s hold over the
peripheries and no change in the prevailing economic policies of exploitation. Despite the
regime’s appeal to a socialist ideology, the Derg was identified with an “Amhara suppresser‟ by
the nationalist liberation movements.9 Any conduct promoting ethnic individualism, and thereby
challenging the state’s integrity, was outlawed.
The victory of the Ethiopian People’s Revolutionary Democratic Front over the Derg in
1991 saw the reversal of over a hundred years of ethnic homogenization. As Chistopher Clapman
says:
The overthrow of the Mengistu government in May 1991 amounted to more than the collapse of a particular regime. It effectively marked the failure of a project, dating back to Menelik’s accession in 1889 of creating a ‘modern’ and centralized Ethiopian state around a Shoan core.10
Ethnic federalism now came to the fore in Transitional Charter, which allowed the rights to self-
determination of the country’s various “nations and nationalities”. Like the Charter, a new
constitution in 1995 recognized the rights of ethnic self-determination up to succession. It also
created a federal government with nine regional states divided along ethno-lingustic lines –
Tigray, Afar, Amhara, Oromia, Somali, Beneshangul-Gemuz, South Nations, Nationalities and
Peoples, Gambella, and Harari.
9 Weldemariam, Alemayehu F, Greater Ethiopia: Evolution of a Pluralist Politico-Legal System in a Pluralist Polity, Department of Polictial Science, Faculty of Social and Behavioural Sciences, Leiden University, (2011). 10 Clapham, Christopher, “Ethnicity and the National Question in Ethiopia”, in Peter Woodward and Murray Forsyth (eds.) Conflict and Peace in the Horn of Africa: Federalism and its Alternatives, (Brookfield: Darmouth publishing co.), (1994).

Economic integration and equitable development become a primary focus of the new
government. Meles Zenawi, the president of the Federal Democratic Republic of Ethiopia,
declared in 1997 that:
It is only through fast economic growth that is broadly shared by the population that we can hope for sustainable peace. And, therefore, one of the most important pillars of our program is fast economic growth that is equitable and broadly shared among the population.11 The government adopted a policy of affirmative action towards developing regions
whereby Beneshangul-Gemuz, Gambella, Afar and Somali would be provided preferential
treatment in terms of budget allocation and increased enrollment in higher education. Even now,
however, developing regions still remain to be fully integrated into the economy of the Ethiopian
state. The legacy of centralization left few residents of today’s developing regions involved in
running their region’s administrative structures.
Until recently there remained little investment in social and physical infrastructure.
Slowly, the emergence of local native elite officially in charge of the regions, better investment
in education, health, infrastructure and others have shown the positive outcomes of the
federalization of Ethiopia.12 The preferential treatment of previously disadvantaged ethnic
groups within Ethiopia is helping to create a more equitable distribution for development to take
place.
Decentralization of political, administrative and fiscal authority to regional and local
governments has been fundamental to this affirmative action strategy. The Government has a
strong commitment to decentralization and building a federal state, as enshrined in the 1995
Federal Constitution. While the first wave of decentralization started only 20 years ago, the 11 Meles Zenawi, “Premier’s speech at Butare National University in Rwanda”, in The Ethiopian Herald, (December 13, 1997). 12 Adegehe, Asnake, Federalism and ethnic conflict in Ethiopia : a comparative study of the Somali and Benishangul-Gumuz regions, (2009).

process should be seen as a work in progress for which the underpinning institutional
arrangements for success are evolving and continue to require focused support.
2.2 The Ethiopian decentralization program
To date, Ethiopia has seen two rounds of decentralization. The first round (devolution)
took place during the transitional period from 1991 to 1994. This Proclamation devolved state
powers to geographically-defined ethno-linguistic groups and associated pieces of legislation
were also passed creating regional and woreda (district) councils. As necessary, regions could
decide to establish zones as intermediaries between regional and district administrations. In
addition to giving them the right to self-determination, these new regional units were granted a
range of executive, legislative, and judicial powers within their defined regions, and exercised
jurisdiction over matters of social and economic development as well as basic service delivery.
Accordingly, regions were to create the necessary internal institutional arrangements, including:
a council; an executive committee; a judicial administration office; a public prosecution office;
an audit office; a police and security office; and a service and development committee.
Proclamation No. 7/1992 stipulated the regional governing units' revenue sources; these
included: tax revenues derived within their jurisdictions; fiscal transfers from the central
government; domestic borrowing; and other sources of income. The latter category was specified
in Proclamation No. 33/1992. However, due to capacity constraints, the regional governments
were yet unable to carry out their revenue assignments; as such, they were highly-dependent on
grants from the central government to meet their new expenditure obligations in the social
sectors.
In spite of what appears to be a rather elaborate set of governing arrangements, these new
regional governments remained subordinate to the central government. While the regional

councils were accountable to citizens living within their regional borders, legally they were also
responsible to Council of Representatives of the central government.
The promulgation of the 1995 Federal Constitution signified the beginning of Ethiopia's
second round of decentralization. The Constitution affirmed the roles and functions of federal vs.
regional government. While the federal government retained authority over a broad range of
functions and responsibilities (e.g., fiscal and monetary policy, international trade), the regions
and woredas were given responsibility for ensuring basic service delivery in their respective
jurisdictions. The federal government retained authority over setting policies and standards in
each of the major social service delivery sectors.
In 2002, decentralization was extended to the woreda level with woreda governments
expected to take on the bulk of service delivery responsibilities. Woredas receive block grants
from their respective regional governments which, like the federal-regional grants, are also
governed by formulas set by the regional governments and use broadly similar methodologies to
those used in federal-regional grants.
2.3 Descriptive statistics
The resource implications of this second round of decentralization were significant. Table
1 shows the evolution of federal block grants (FBGs) to regions over time. Regions further
devolve a large portion of these grants to woredas, although detailed data on this is not yet
available.13 We see that FBGs rose from 13% of total federal expenditures in 1999/00 to 40% in
2012/13, even as total federal expenditure more than tripled. The result is a huge increase in
funds available to regions in excess of 300%. Interestingly, FBGs fell as a proportion of total
regional expenditures from a peak of 88% to just over half, as new central transfers came on
13 Data on woreda-level transfers and expenditures are currently only available for 2008-2011, and so omitted here. The next version of this paper should fully incorporate woreda-level data from 2001-2012.

stream and subnational governments developed their own tax bases, implying even more
resources for regions and woredas.
Table 1: Federal block grants (FBGs) to regions
Sources: Ministry of Finance & Economic Development, National Bank of Ethiopia
N.B. Years are according to the Gregorian (i.e. Western), and not Ethiopian, calendar.
How have subnational governments spent these increasing flows? Figure 1 shows the
sectoral breakdown for a typical year, in this case 2011. Education takes the largest share at
62%, followed by agriculture and health in a distant near-tie for second place, at 18% and 17%
respectively. Together these three sectors account for 97% of total expenditure, with expenditure
on water & sanitation and roads summing to only 3%. This broadly accords with the pattern of
Year (Ethiopian calendar)
Federal block grant to
regions (USD millions)
Total federal government expenditures
(USD millions)
FBG as % of federal
expenditures
FBG as % of total regional expenditures
1993/94 1,4081994/95 1,5131995/96 1,4981996/97 445 1,605 28% 75%1997/98 444 1,645 27% 78%1998/99 414 2,029 20% 77%1999/00 299 2,259 13% 65%2000/01 426 2,221 19% 77%2001/02 450 2,129 21% 77%2002/03 527 2,147 25% 75%2003/04 583 2,614 22% 79%2004/05 635 2,616 24% 79%2005/06 815 2,518 32% 79%2006/07 1,065 3,067 35% 88%2007/08 1,464 3,756 39% 85%2008/09 1,589 3,940 40% 86%2009/10 1,517 4,116 37% 80%2010/11 1,587 4,207 38% 81%2011/12 1,721 4,689 37% 61%2012/13 1,954 4,895 40% 54%

expenditure across developing countries, which typically prioritize education and health above
other sectors.
Figure 1: Woreda-level expenditures by sector, 2011
Source: Ministry of Finance & Economic Development
Have such expenditures affected education and health outcomes of interest? Are they
having an effect on Ethiopia’s development more broadly? Figure 2 shows the evolution of
education expenditures at the regional and woreda levels (left axis), plotted against the net
enrollment rate (right axis) between 1993-2012. We see a notable rise in education expenditure
throughout this period, with a clear acceleration after about 2005, when regional governments
begin devolving significant sums to woredas. This is associated with a steady, four-fold rise in
the net enrollment rate from under 20% to over 80%, again with an upward surge in 2005.

Figure 2: Growth in subnational education expenditures & net enrollment rate, 1993-2012
Source: Ministry of Finance & Economic Development
Figures 3-6 plot the same expenditure data against changes in the rates of vaccination
against measles and DPT, the rate of detection of TB, and the fertility rate. The data for these
variables are being cleaned and corroborated, and still contain gaps and erratic features that we
are working to fix. But even so the overall patterns are striking. In figure 3 we see the measles
vaccination rate, previously stagnant around 30%, begin a secular rise in 2003 from 27% to 68%
by 2011. This coincides with Ethiopia’s second round of decentralization to woredas. The DPT
vaccination rate (figure 4) similarly begins rising in 2002, from 28% to 65% in 2010. The rate of
detection of TB (figure 5) shows an even longer and more dramatic rise, from 11% in 1995 to
68% in 2011. And Ethiopia’s fertility rate – a variable that, across countries and cultures, moves
slowly in response to broad demographic and economic factors – declines markedly from 7.1
live births per woman in 193 to 4.8 in 2011 (figure 6). In all of these cases, greater
decentralization of health expenditure appears be to associated with improving indicators of
0
10
20
30
40
50
60
70
80
90
0
2000
4000
6000
8000
10000
12000
14000
16000
1990 1995 2000 2005 2010 2015
PercentEthiop
ian Birr
Regional expenditure Woreda expenditures
Total expenditures Net enrollment rate

health system outputs, such as vaccination rates, as well as substantive outcomes, such as
fertility.
Figure 3: Growth in subnational health expenditures & measles vaccination rate, 1993-2012
Source: Ministry of Finance & Economic Development
0
10
20
30
40
50
60
70
80
0
1000
2000
3000
4000
5000
6000
1993 1998 2003 2008Regional expenditures Woreda expenditures
Total expenditures Measles vaccination rate

Figure 4: Growth in subnational health expenditures & DPT vaccination rate, 1993-2012
Source: Ministry of Finance & Economic Development
Figure 5: Growth in subnational health expenditures & TB detection rate, 1993-2012
Source: Ministry of Finance & Economic Development
0
10
20
30
40
50
60
70
0
1000
2000
3000
4000
5000
6000
year
1993
1994
1995
1996
1997
1998
1999
2000
2001
2002
2003
2004
2005
2006
2007
2008
2009
2010
2011
Regional expenditures Woreda expenditures
Total expenditures DPT vaccination rate
0
10
20
30
40
50
60
70
80
0
1000
2000
3000
4000
5000
6000
1990 1995 2000 2005 2010 2015
PercentEthiop
ian Birr
Regional expenditures Woreda expenditures
Total expenditures TB detection rate

Figure 6: Growth in subnational health expenditures & declining fertility, 1993-2012
Source: Ministry of Finance & Economic Development
Unfortunately, the data for agriculture is in a worse state than other sectors, and so figure
7 only plots the 2008-2011 period. Just as in health and education, agricultural expenditures
increased rapidly over this period. Concomitant with this increase, the percentage of fields that
use extension services more than doubled. This occurs entirely within the second phase of
Ethiopian decentralization, to woredas.
3
3.5
4
4.5
5
5.5
6
6.5
7
7.5
0
1000
2000
3000
4000
5000
6000
1990 1995 2000 2005 2010 2015
Fertility ra
te
Ethiop
ian Birr
Regional expenditures Woreda expenditures
Total expenditures Fertility rate

Figure 7: Growth in subnational agriculture expenditures & extension services, 2008-2011
Source: Ministry of Finance & Economic Development
What do these descriptive statistics tell us? Firm conclusions must await the more
rigorous evidence presented below. The preceding figures are no more than suggestive. But
what they suggest is that rapidly rising decentralized expenditures in education, health and
agriculture have led to significant increases in public sector outputs, such as education
enrollments and vaccinations against communicable diseases, as well as substantive outcomes
such as fertility. And for some of these indicators, improvements accelerate from the early-
2000s onwards, with Ethiopia’s second round of decentralization to woredas. Are these changes
due to decentralization itself, or to the increase in expenditures that coincided with
decentralization? We cannot distinguish between these possibilities from the descriptive
statistics above, but our more detailed, analytical results below can.
3. Data and Methodology
3.1 Data

One reason an analysis of this sort has not been undertaken until now is the absence of
woreda-level data on local economic, demographic, fiscal and other characteristics. Indeed, it is
difficult to overstate the difficulty of doing subnational empirical work on Ethiopia. When we
began this project, relatively little subnational data was collected, the data was often of poor
quality, and few attempts were made to systematize the results into any obviously comparable
framework. A few illustrations are telling. Fiscal data on subnational expenditures in health,
education, agriculture, water, and roads were until very recently available only for EFY 2003.
Their geographic identifying codes and names did not match those of census data, whose
geographic codes and names vary in unpredictable but pervasive ways from fiscal data. The last
census counted some 740 woredas, zones, and regions, but the fiscal dataset included more than
850. Consolidating these two yielded a dataset of 989 subnational units, 250 more than in the
census. Many woredas were listed under the same name, and geographic codes in both data sets
were not unique. Missing data abounded.
The database that the team has constructed includes woreda-level data from five
ministries – Health, Education, Agriculture, Water and Energy, and Finance and Economic
Development – as well as the Central Statistical Agency (CSA), the Disaster Risk Management
and Food Security Sector of the Ministry of Agriculture. As standardization of woreda codes and
the transliteration of Amharic names into Latin script is not yet consistent between ministries in
Ethiopia, much time was dedicated to matching woredas from various sources into a single
format. For consistency, the team used the Population and Housing Census of Ethiopia (2007)
codes as its base.
The database includes year-on-year expenditures by sector, and key results by sector, and
information on ethnicity, poverty, rainfall, frequency of droughts, and a number of other control

variables. Regional data on per capita capital expenditures and zonal data on crop yields have
also been included. Moving forward, we intend to update the database yearly, with yearly results
from each sector incorporated as they become available. Building the database required for this
report has required a huge amount of work and improvisation on the part of the team undertaking
the empirical analysis. It is our hope that this dataset will in time become a useful tool for
researchers and students elsewhere in Africa and beyond.
3.2 Methodology
Our primary objective is to assess the effect of woreda-level expenditures for
decentralized sectors on key sector outputs and outcomes. Ethiopian fiscal rules create a strong
association between woreda-level spending in agriculture, education, and health, and key service
outputs such as the numbers of agriculture extension workers, teachers, and health extension
workers. The causal chain between our right hand side variables (“inputs”) and our left hand
side variables (“outputs” or “outcomes”, depending on data availability) is depicted in figure 8
below. It is useful to keep these relationships in mind when interpreting the econometric results
that follow.

Figure 8: Conceptual model of causality for woreda expenditure
Our intention is to use panel regressions to investigate the effects of decentralization on
outputs and outcomes in education, health and agriculture. But the current lack of woreda level
data from the pre-decentralization period restricts us to simple time-series estimations with
nationally aggregated data over the past 20 years, which includes both pre and post-
decentralization data. We then corroborate these results with woreda-level data from 2008-2011
inclusive, all of which is in the post-decentralization period. Here we estimate cross-time pooled
regressions in order to evaluate the impact of per capita sector expenditure, controlling for
rural/urban percentage and ethnicity, on various output and outcome variables of interest. For
agriculture, where reliable local outcome data are unavailable, we revert to zonal level data on
outcomes. By taking the average per capita woreda spending on agriculture as a proxy for
services offered by agriculture extension workers, zonal outcome data can be used to assess
spending effectiveness. Data constraints prevent us from analyzing water supply and roads. But
Outcomes
Teachers & Health/ Agriculture Extension workers hired
Spending for salaries of Teachers & Health/ Agriculture Extension workers
Direct impact: •Net enrollment ratio •Pupil-teacher ratio •Gains in literacy
• Increased life expectancy
•Lower infant mortality
• Increased agricultural income
Outputs Delivery Inputs
Catalytic impact: •Number of children
vaccinated •Women receiving
ANC •Number of people
using contraception •Agricultural yields

the latter two sectors account for only 3% of total woreda-level spending, implying that our
sectoral focus is appropriate. Additionally, national household surveys such as the Demographic
and Health Survey (DHS) and the Agriculture Sample Survey are used to complement our
analysis from the woreda-level database. Results using household data confirm those from our
woreda database, which relies on administrative data.
The analysis consists of three key stages. Stage I is a simple time-series OLS estimation
as follows:
Ot = α + β1Et + β2Dt + β3Tt + β4Et*Dt + εt (1)
Where O captures key education and health outcomes, expressed as rates; E is expenditures in
each sector; D is a dummy variable that equals 0 before Ethiopia decentralized to woredas and 1
after; and T is a simple trend variable, all subscripted by year t. We expect sectoral expenditures
to positively affect sectoral outcomes, and hence to be statistically significant with the correct
sign. If decentralization affects outcomes generally, through administrative, political, or other
channels, then we expect the dummy variable to be significant and larger in effect. But if
decentralization’s main channel of influence is via local discretion over resource allocation, as
opposed to more general effects, then we expect the interaction term to take over significance
when it is added to the model.
Stage II follows the approach of Faguet (2012) and Faguet and Sánchez (2013),
examining the relationship between woreda-level spending in each sector on results in those
sectors. We estimate
lnOmt = α + ζlnEmt + βRm + δCm+ ηlnKmt + τt + εmt (2)
where lnO captures key outcomes in each sector through variables such as the net enrollment rate
or antenatal care usage. E is yearly expenditure per capita in the relevant sector; K is capital

expenditure per capita; R is the percentage of rural population in each woreda; τ is a year
variable to control for the time series effect in this cross time pooled data set; and C is a vector of
demographic controls, including population percentages of certain historically disadvantaged
ethnicities that we focuses on, indexed by woreda m and year t. R and C are census variables,
and thus treated as time-invariant.
Log transformations are very commonly used in order to reduce the effect of extreme
values on results. But interpreting the coefficients of log-transformed data is not
straightforward. Log transformations are often useful for data that exhibit right (positive)
skewness, and where the variability of residuals increases for larger values of the dependent
variable. When a variable is log transformed, note that simply taking the anti-log of your
parameters will not properly back transform into the original metric used.14
We also estimate a linear version of (2), as follows:
Omt = α + ζEmt + βRm + δCm + ηKmt + τt + εmt . (3)
We further add a quadratic term for expenditure to (3), in order to check for decreasing marginal
returns, as follows:
Omt = α + ζEmt + λEmt2 + βRm + δCm+ ηKmt+ τt + εmt (4)
For all the above equations, it is expected δO/δE ≥ 0 and δO/δK ≥ 0. Similarly δlnO/δlnE
≥ 0 (that the first partial derivatives) while in Equation (3) δ2O/δ2E ≤ 0 (the second partial
derivate). The expected results imply a positive association between the dependent variable and
the independent variable, per capita woreda expenditures in each sector.
14 For a clear, concise treatment of this topic, see Jing Yang Interpreting Coefficients in Regression with Log-Transformed Variables, StatNews #83, June 2012, Cornell Statistical Consulting Unit, Cornell University, Ithaca, NY. Available at: http://www.cscu.cornell.edu.

Finally, stage III compensates for a lack of woreda-level data on agriculture by using
household-level DHS data to estimate a Probit limited dependent variable model, using the
following specification:
Pi,q = α + ρζlnEmt + δVm + εmt (5)
where Pi,q is whether household “i” in quintile “q” adopts improved techniques, measured as “1”
for “yes” and “0” for “no”. Em,t is per capita expenditure on agricultural extension workers, and
Vm,t is a vector of control variables, including rainfall.
4. Results
We eventually intend use panel regressions to investigate the effects of decentralization
on outputs and outcomes in education, health and agriculture. But the current lack of woreda
level data from the pre-decentralization period restricts us to simple time-series estimations with
nationally aggregated data over the past 20 years, and full panel estimations using woreda-level
data from 2008-2011 inclusive. Realizing this approach is distinctly second-best, we verify these
findings with household data from DHS 2005 and 2011 surveys, where we use limited dependent
variable (primarily probit) regressions to investigate health and education outcomes. These
results corroborate ourmain findings, but are not presented here for lack of space. We hope that
this combination of results can tell us something of interest about the effects of decentralization
on public service provision in Ethiopia. But we do not pretend that our results are ideal, nor a
direct test of the questions we want answered. With luck, better estimations will be possible
soon.
Nationalresults�
What do national regression results reveal about the links between decentralization and
improvements in Ethiopia's public services? Table 2 contains results from our national database

for education. The regression in the first column shows that education expenditure increases the
net enrollment rate, but decentralization to woredas has an independent, statistically significant
effect. Adding a trend variable removes significance from these first two terms. But when we
interact education expenditures with the woreda decentralization dummy (column 3), all four
terms are significant. Our interpretation of these results is that it is decentralized expenditures
that are driving improvements in Ethiopia's enrollment rates, as distinct from education
expenditures more generally, or some other – perhaps political or administrative – aspect of
decentralization.
Table 2: Decentralization’s effect on education outputs
Table 3 shows results for health. In column 1 we see that health expenditures appear to
drive improvements in DPT vaccinations, but the decentralization dummy is insignificant.
Adding a trend variable does not alter this result, and the trend variable is also insignificant.
When we add an interaction term for health expenditures and woreda decentralization, by
contrast, only this last term approaches significance, and the other three are not. This implies
Education
1 2 3Education expenditure 0.00254 *** -0.00046 -0.01329 *
(0.0007) (0.0005) (0.0064)Woreda decentralization 20.76349 *** -0.22921 -22.52787 * dummy (5.2258) (3.3025) (11.4241)Trend 3.93361 *** 5.41707 ***
(0.4641) (0.8453)Education expenditure x 0.01178 * decentralization dummy (0.0058)constant 30.42987 *** 9.88411 *** 15.93700 ***
(2.9859) (2.7265) (3.8791)R-squared 0.8610 0.9773 0.9828Prob > F 0.0000 0.0000 0.0000N 18 18 18
*,**,*** = coefficients significant at the 10%, 5% and 1% levelsOLS estimations; standard errors in parentheses
Net Enrollment Rate (NER)

weakly that decentralized expenditure might improve the DPT vaccination rate, as distinct from
health expenditure more generally, or other aspects of decentralization. But the evidence is at
best suggestive. Columns 4-6 provide similar results for the measles vaccination rate. Once
again, health expenditure is significant in the first model but the decentralization dummy is not,
and de-trending the data does not change this (columns 4-5). When we add the interaction term
(column 6), however, the results mirror those for education. Decentralized expenditure appears
as the strong driver of improvements in Ethiopia's measles vaccinations, as distinct from health
expenditures more generally, or other aspects of decentralization.
Table 3: Decentralization’s effect on health outputs
Fertility is a different sort of health indicator. As opposed to vaccination rates, which are
direct outputs of government policy and can be directly influenced by government decisions,
fertility is a substantive outcome of interest in any population. But fertility decisions are in the
gift of mating couples, and only indirectly affected by policy. As a demographic variable,
fertility commonly changes much more slowly year by year, across countries, cultures, and
Health
1 2 3 4 5 6Health expenditure 0.00591 ** 0.00936 ** -0.10810 0.00812 *** 0.00907 ** -0.13535 **
(-0.0025) (0.0035) (0.0715) (0.0022) (0.0032) (0.0613)Woreda decentralization 1.07761 12.70117 -49.31069 -0.69042 2.53872 -73.70757 ** dummy (6.4351) (10.3539) (38.9754) (5.6393) (9.5665) (33.4155)Trend -1.70519 1.58259 -0.47372 3.56875 *
(1.2102) (2.3068) (1.1182) (1.9778)Education expenditure x 0.11135 0.13691 ** decentralization dummy (0.0677) (0.0580)constant 38.54104 *** 46.72068 *** 69.52584 *** 35.87509 *** 38.14747 *** 66.18742 ***
(3.6858) (6.8225) (15.3104) (3.2300) (6.3036) (13.1264)R-squared 0.3639 0.4341 0.5206 0.5519 0.5569 0.6767Prob > F 0.0214 0.0247 0.0198 0.0011 0.0039 0.0013N 20 20 20 20 20 20
*,**,*** = coefficients significant at the 10%, 5% and 1% levelsOLS estimations; standard errors in parentheses
DPT Vaccination Rate Measles Vaccination Rate

regions of the world. This makes this a more ambitious test of the effects of decentralization.
Hence we are wary of finding any effect of decentralization on fertility, which – even if
significant – we would expect to be small.
What does the evidence show? Table 4 provides the results of our estimations. As for our
education results, both the health expenditure and decentralization dummy variables are
associated with decreasing fertility (column 1). The trend variable is also significant (column 2),
but unlike all of the other education and health models, adding this does not reduce the
significance of the other two variables. But when we add the interaction term (column 3), only
the trend variable remains significant. We interpret this as weak evidence that health expenditure
and decentralization broadly construed contributed to falling fertility levels in Ethiopia.
Table 4: Decentralization’s effect on health outcomes
Stepping back from the detail, these results are broadly what the theory of
decentralization would predict. They imply that decentralization is improving performance of the
public education and health sectors, specifically by raising enrollments in Ethiopia’s schools and
Health
1 2 3Health expenditure -0.00041 *** -0.00015 *** -0.00011
(0.0001) (0.0000) (0.0006)Woreda decentralization -0.87300 *** -0.26937 *** -0.24898 dummy (0.1348) (0.0665) (0.2946)Trend -0.09698 *** -0.09814 ***
(0.0081) (0.0182)Education expenditure x -0.00004 decentralization dummy (0.0005)constant 6.88965 *** 7.33326 *** 7.32593 ***
(0.0743) (0.0442) (0.1126)R-squared 0.9304 0.9933 0.9933Prob > F 0.0000 0.0000 0.0000N 19 19 19
OLS estimations; standard errors in parentheses*,**,*** = coefficients significant at the 10%, 5% and 1% levels
Fertility Rate

increasing the rate of vaccination against measles. The main channel for this appears to be local
decisions over decentralized expenditures. But we must remember that the data on which these
results are based are still incomplete, at a higher level of aggregation then we would like, and
probably still contain errors. Further work with more, and more detailed, data is required.
Post‐DecentralizationWoredaExpenditures:Education
A large share of local government resources are used to hire primary school teachers.
According to the Demographic and Health Survey, between 2005 and 2011 the primary net
enrollment rate increased from 68 percent to 82 percent, and the primary completion rate rose
from 34 to 49 percent. (Secondary education expenditure is split between woredas and regions,
and so has not yet been included in the analysis.) We focus here on the association between
woreda level per capita education expenditures on enrolment rates, and pupil-teacher ratios. We
do not consider non-salary recurrent costs in education, which come from other levels of
government15; but this may not matter since in basic education teacher costs are more than 90%
of total recurrent costs. We also consider impact of the capital costs such as school buildings
which can drive enrolments. Capital expenditure is based on per capita expenditures at the
regional level, since most capital spending is done there. The data is cross time pooled data, and
a variable for time was included to isolate the time series effects from other effects. Other control
variables were percent rural and ethnicity of the woreda (which is a good proxy for historical
lags in development). The results in Table 5 are from the log-linear regressions, which we
consider to be best form because they eliminate the effects of extreme values and allow for
declining returns to scale. Linear regressions and quadratic regressions were also estimated but
not reported here. They are in Annex B.
15 For example education quality is supported under GEQIP (General Education Quality Improvement Project funded by the Government, World Bank, DFID, USAID and many others.

Table 5: Effect of Log of Per Capita Education Expenditure on Log of Education Outcomes
Independent Variable
Dependent Variable/ Indicator
Coefficient/(SE) Significance
Log of Expenditure Log of Net Enrollment Rate
0.2705 (.0281)
***
Log of Pupil-Teacher Ratio
-0.2242 (.0203)
***
Notes: Based on Cross-time pooled dataset from 2008-2011. Standard errors given in parenthesis. Significance is defined as: *** at 1% level. Number of Observations: 2583 for NER and 2695 for PTR.
The study considered two education-related indicators – the Net Enrollment Rate (NER)
and Pupil Teacher Ratio (PTR). For both, there is a strong significant relationship with woreda-
level per capita recurrent expenditure, when controlling for the effects of rural/urban percentage
and ethnicity. Table 5 presents the main coefficients of interest from our regression analysis. For
every additional Ethiopia Birr per capita in woreda education spending, NER increases by
0.20%. These results are all significant at the 1% level, as well as robust to changes in
specification. Similar results are seen with the PTR.

Post‐DecentralizationWoredaExpenditures:Health
Table 6: Effect of Log of Per Capita Health Expenditure on Health Outcomes Indicator Coefficient/(SE) Significance
Log of Expenditure Log of Penta 3 vaccinations
-0.0611 (0.0271)
**
Log of Penta 3 vaccinations on expenditure lagged one year
0.1050
(.0370)
***
Log of Antenatal Care
0.0784 (0.0341)
**
Log of Contraceptive Acceptance Rate
-0.0250 (0.0404)
NS
Log of Contraceptive Acceptance on expenditure lagged one year
0.1373 (.0487)
***
Log of Deliveries by Skilled Birth Attendants
0.2438 (0.0732)
***
Notes: Based on cross-time pooled dataset from 2008-2011. Standard errors given in parenthesis. Significance is defined as: *** at 1% level and ** at 5% level. Number of Observations: 1,664 for Penta 3, 2,277 for ANC, 2,243 for Contraceptive acceptance rate and 2,154 for Deliveries by skilled birth attendants.
Another significant share of local resources is used for health, mainly for hiring frontline
community health workers called health extension workers (HEWs). HEWs do not provide
extensive curative services. Their main purpose is threefold: to promote behavioral change
leading to the adoption of healthy lifestyle practices among members in their community; to act
as a referral mechanism for complicated cases, such as difficult pregnancies or severe child
malnutrition, to be brought to a Health Center for treatment by trained health professionals; and
to provide periodically schedulable services, the most important among them are immunization,
family planning (insertion of contraceptive implants) and antenatal care. Regarding maternal
health, HEWs are supposed to mobilize women to seek skilled care by “Skilled Birth
Attendants”. This title is reserved for nurses, health officers, trained midwives and physicians.

While taking up a smaller percentage of expenditure, these positions are nonetheless funded from
the local level budget.
This study considered the association of expenditure on four health-related outcomes –
the Penta3 vaccination rate, percentage of pregnant women who received Antenatal Care (ANC),
Contraceptive Acceptance Rate (CAR), and percentage of Deliveries by Skilled Birth Attendants
(DelSBA). Each is directly related to local-level health expenditure. Table 6 presents the results.
As for education, the data is cross time pooled data and variable for time was also included to
isolate the time series effects from other effects. Other control variables were per capita capital
expenditures (at the regional level) percent rural and ethnicity of the woreda (which is a good
proxy for historical lags in development. The results in Table 6 are from the log-linear
regressions, which we consider best form because it eliminates the effects of extreme values and
allows for declining returns to scale. Linear regressions and quadratic regressions were also
estimated, and are reported in the Annex.
The results show that increased health expenditures by woredas improve rates of Penta 3
vaccinations, women receiving antenatal care, contraceptive use, and deliveries by SBAs. All of
these results are significant at the 1% level, and all are robust to changes in specification. Again
as for education, we only consider per capita woreda level spending which covers health
extension workers and health center staff. Non-salary and capital costs are not covered, but
clearly can also impact final results. HEWs can convince mothers to immunize their children, but
the immunization must also be available; these are financed separately.
All of these indicators are directly related to the responsibilities of HEWs, where the
majority of local level recurrent health expenditure is directed. In terms of vaccination rates,
HEWs are the frontline workers meant to mobilize the community during immunization

campaigns. They also are the first source for pregnant women to seek ANC services, as well as
being the primary spokespeople informing the community of the importance of contraception in
family planning. While not technically “skilled birth attendants”, their focus on referral of
pregnancies to those professionals in health centers impacts the proportion of women who are
able to give birth with a trained provider.
A smaller percentage of local health expenditure is directed to the health center level. By
federal mandate, each of the 3,000 health centers is supposed to be staffed by one to three health
officers, depending on the characteristics of the host community. Each health officer is backed
up by a team of about four nurses. There is also at least one trained midwife at each health
center. While each of the indicators assessed could be subject to a mixture of influences between
HEWs and health center staff, the majority of the effect for all except deliveries by skilled birth
attendant would be expected to come from HEWs. Deliveries by SBAs would be influenced
more equally by both HEWs and health center staff.
Post‐DecentralizationWoredaExpenditures:Agriculture
Ethiopia relies heavily on agriculture. It comprises almost half of the country’s GDP and
employs around 80% of its people. The government and donors support the agriculture sector by
financing recurrent costs at woreda level. The majority of these costs are directed towards the
employment of development agents (DAs). DAs are trained workers who provide extension
services by teaching community members the benefits of improved farming techniques. Such
techniques can include the use of improved seeds and fertilizer, and the importance of irrigation
and erosion prevention, among others.

AssociationofExtensionServiceswithProductivity
As in health and education, agricultural expenditure increased rapidly between 2008 and
2011. Concomitant with this increase, the percentage of fields that use extension services has
more than doubled. When cross-time pooled regressions are run on agricultural data between
2008 and 2011, there is a significant effect of zonal agriculture expenditure on a variety of
improved farming techniques (Table 7). The regressions control for the same aspects as those for
health and education – the percentage of the population that is rural, and the ethnic composition
of the zone. Here the deviation in rainfall for both the current and previous year from the average
rainfall between 1996 and 2011 at zonal level is also included as a predictor. In all regressions
where an agricultural variable is included on the left-hand side, both the current year’s as well as
the previous year’s deviation from average rainfall is a significant predictor.
Table 7: Effect of One birr per Capita spending on Agriculture Extension workers on usage of Farmers’ Extension Services
Indicator Coefficient/(SE) Significance Field using Extension Services 0.0008
(0.0004) **
Field using Improved Seeds 0.0002 (0.0001)
*
Field using Fertilizer 0.0007 (0.0003)
**
Notes: Based on Probit models. Cross-time pooled data drawn from Agricultural Sample Survey data from 2008-2011, pooled at zonal level. Number of observations: 191. Controls include current and previous years’ deviations from average rainfall (calculated as the average between 1996 and 2011), zonal poverty rate, percentage of the zone’s population that is rural, and the same ethnic groupings as used in the regressions above. Standard errors given in parenthesis. Significance is defined as: ** at 5% level and * at 10% level.
Although the effects appear to be relatively small, the results show that for several
aspects of improved farming techniques there are significant and positive associations with zonal
per capita agriculture spending. For every additional USD 1 per capita spent, for example, the
probability that a field in that zone will benefit from extension services increases by about 0.2%
(assuming and exchange rate of ETB20/USD). Specifically, usage of fertilizer and improved

seeds has smaller coefficients but remain positively significant. Irrigation is one technique that is
not associated with higher agriculture spending. This could be due to higher capital costs
associated with irrigating fields, and would therefore be dependent more on a particular zone’s
expenditure in the water sector.
Figure 9: Quantity of Production (quintales) by Crop Type, 2011
Notes: Other includes hops and chat. The chart does not include sugar, which is not often grown on
private land.
Figure 9 shows the overall basket of crops produced by Ethiopian private farmers in 2011
by production quantity, measured in quintales. Cereals, which include barley, teff, wheat,
sorghum, maize, oats, and rice, make up almost three-quarters of production. A further 15%
consists of pulses (e.g. beans, chick peas and lentils) and root crops (e.g. potatoes, carrots and
onions). Enset, fruit crops and coffee, which are more geographically confined, represent a
smaller proportion of overall production.
The overall objective of agriculture spending is to increase the productivity of farmers’
fields. Productivity is measured by yield, which is the ratio of quintals produced per hectare of
land cultivated. Cross-time pooled regressions between 2008 and 2011, with the log of yield of a
specific category of crop as the dependent variable, show strong positive relationships with log

per capita recurrent agricultural spending and crop yields. The control variables were - the
percentage of the population that is rural, the zone’s overall poverty rate, the deviation of the
zone’s rainfall for the current and past year from the average, and ethnic composition (this latter
variable helps account for geographical heterogeneity in crops’ production).
Of the eight groups of crops grown in Ethiopia, five show positive and significant
relationships with agricultural spending (table 8). These five represent about 85% of the
production in the country. These results, combined with the effect of agriculture spending on
extension services given above, imply that local agricultural investment is playing an important
role in increasing farmer productivity levels. A caveat here is the role is only catalytic because
the actual productivity increase depends on a range of the private and public spending as well as
investments in infrastructure, which are not included here.

Table 8: Association of Log of Per Capita spending on Agriculture Extension workers with Yield
Independent Variable Dependent Variable/Indicator (Yield in Quintales/Hectare)
Coefficient/(SE) Significance
Log Linear Regression Estimates Log of Expenditure Log of Cereal yield 0.128
(0.0257) ***
Log of Pulses Yield 0.020 (0.0455)
NS
Log of Root Crops yield 0.320 (0.1080)
NS
Log of Vegetables yield 0.583 (0.0674)
***
Log of Oilseeds yield -0.118 (0.0851)
NS
Log of Enset Yield 2.397 (0.2315)
***
Log of Fruits Yield 1.791 (0.1360)
***
Log of Coffee Yield 1.267 (0.1302)
***
Notes: Cross-time pooled data drawn from Agricultural Sample Survey data from 2008-2011, pooled at zonal level. Number of observations: 167 for cereals, 159 for pulses, 152 for root crops, 167 for vegetables, 151 for oilseeds, 90 for enset, 162 for fruits and 137 for coffee. Standard errors given in parenthesis. Significance is defined as: *** at 1% level and NS is not significant.
5. Conclusions
National evidence presented here suggests that decentralization is improving the performance
of Ethiopia’s public education and health services, specifically by raising school enrollments and
increasing the rate of vaccination against measles. The main channel for these changes appears to be
local decisions over decentralized expenditures. But we must remember that the data on which these
results are based are still incomplete, at a higher level of aggregation then we would like, and
probably still contain errors. Further work with more, and more detailed, data is required.
Disaggregated, woreda-level data from a shorter period in the post-decentralization period
confirm these results in much greater detail. Decentralized expenditures in education, health and
agriculture is associated with increases in the net enrollment rate, pupil teacher ratio, Penta 3
vaccinations, percentage of women receiving antenatal care, contraceptive acceptance rate, and the
percentage of deliveries by skilled birth attendants. Our estimates imply that an incremental dollar of

local expenditure has significant real effects, on the order of a 3.6% increase in the net enrollment
rate, or an 11.3% increase in deliveries by skilled birth attendants.
It is difficult to overstate the difficulty of doing subnational empirical work on Ethiopia.
Creating the database required for this report has required a huge amount of work and improvisation
on the part of the research team. A major output of this study is the production of a standardized
database of woreda-level expenditures and characteristics, which will be made public. The data will
be combined with new data coming from ongoing data collection financed by donors, and will also
be used to prepare future studies in this line of research. It is our hope that this dataset will in time
become a useful tool for researchers and students elsewhere in Africa and beyond.

References
Assefa, Fisshea Federalism and the Accommodation of Diversity in Ethiopia, Eclipse Press, Addis Ababa, Third Edition 2010
Barankay, I. and Lockwood, B. 2007. Decentralization and the productive efficiency of government: Evidence from Swiss cantons. Journal of Public Economics, 91: 1197–1218.
Batina, R.G. and Ihori, T. 2005. Public goods: theories and evidence. New York: Springer.
Besley, T. and Coate, S. 2003. Centralized versus decentralized provision of local public goods: A political economy approach, Journal of Public Economics, 87: 2611-37.
Bevan, Phillipa, Catherine Dom and Alula Pankhurst. 2010. Long-term Perspectives of Development Impacts in Rural Ethiopia: Wide Stage One Final Report, Mokoro Limited, Oxford.
Boone, P. and J.P. Faguet. 1998. “Multilateral Aid, Politics and Poverty: Past Failures and Future Challenges”, chapter 2 in R. Grant and J. Nijman (eds.). The Global Crisis in Foreign Aid, Syracuse: Syracuse University Press, 11-26.
Cassette, A. and Paty, S. 2010. Fiscal decentralization and the size of government: A European country empirical analysis. Public Choice, 143: 173–189.
Ceballos, M. and Hoyos, D. 2004. Tendencias del comportamiento electoral y descentralización en los municipios de Colombia, 1988-2000. Crisis States Programme Working Paper No. 57, London School of Economics.
Central Statistical Agency of Ethiopia (CSA) Voice of the Central Statistical Agency, Various Issues.
Clark, D. (2009) The performance and competitive effects of school autonomy. Journal of Political Economy, 117(4): 745-782.
Devarajan, S., Khemani, S. and Shah S. 2009. The politics of partial decentralization. In Ahmad, E. and Brosio, G. (Eds.). Does decentralization enhance service delivery and poverty reduction? Cheltenham: Edward Elgar.
Dowding, K. and John, P. 1994. Tiebout: A survey of the empirical literature. Urban Studies, 31 (4/5): 767-97.
Dom, Catherine and Stephen Lister with Manos Antoninis. 2010. An Analysis of Decentralization in Ethiopia, Mokoro Ltd., Oxford.
Eldon, Jack, Abebe, Cunningham and Bibby. 2011. Options for Support to Service Delivery in Ethiopia’s Developing Regional States, draft report.
Escaleras, M. and Register, C.A. 2012. Fiscal Decentralization and Natural Hazard Risks. Public Choice, 151, 1, 165-183.
Faguet, J.P. 2013. “Decentralization and Governance.” World Development, 53: 2-13. http://dx.doi.org/10.1016/j.worlddev.2013.01.002

Faguet, J.P. 2012. Decentralization and Popular Democracy: Governance from Below in Bolivia. Ann Arbor: University of Michigan Press.
Faguet, J.P. 2004. “Why So Much Centralization? A Model of Primitive Centripetal Accumulation.” LSE-STICERD Development Economics Discussion Paper No. 43.
Faguet, J.P. 2000. “Decentralization and Local Government Performance: Improving Public Service Provision in Bolivia”, Revista de Economía del Rosario, 3(1): 127-176.
Faguet, J.P. and Z. Ali. 2009. “Making Reform Work: Institutions, Dispositions and the Improving Health of Bangladesh.” World Development, 37: 208–218.
Faguet, J.P. and F. Sánchez. 2013. “Decentralization and Access to Social Services in Colombia.” Public Choice. DOI 10.1007/s11127-013-0077-7.
Faguet, J.P. and F.B. Wietzke. 2006. “Social Funds and Decentralization: Optimal Institutional Design.” Public Administration and Development, 26(4): 303-315.
Galiani, S., Gertler, P. and Schargrodsky, E. 2008. School decentralization: Helping the good get better, but leaving the poor behind. Journal of Public Economics, 92: 2106–2120.
Garcia, Marito and Andrew Sunil Rajkumar. 2008. Achieving Better Service Delivery in Through Decentralization in Ethiopia, Working Paper No. 131, World Bank, Washington.
Gonçalves, S. 2013. The effects of participatory budgeting on municipal expenditures and infant mortality in Brazil. World Development. http://dx.doi.org/10.1016/j.worlddev.2013.01.009
Granados, C. and F. Sánchez. 2013. Water Reforms, Decentralization and Child Mortality in Colombia, 1990-2005. World Development. In Press.
IPE Global. 2010. Evaluation and Design of Social the Social Accountability Component of the Protection of Basic Services Project, New Delhi.
Krishan, Pramila and Manasa Patnam, 2013 “Neighbours and Extension Agents in Ethiopia: Who matters more?” in American Journal of Agriculture Economics 96(1): 308-327
Manor, J. 1999. The political economy of democratic decentralization. Washington, DC: World Bank.
Oates, W. 1972. Fiscal federalism. New York: Harcourt Brace.
Ostrom, E. and Whitaker, G.P. 1973. Does local community control of police make a difference? Some preliminary findings. American Journal of Political Science, 17: 48-76.
Ostrom, E., Schroeder, L. and Wynne, S. 1993. Institutional incentives and sustainable development: Infrastructure policies in perspective. Boulder: Westview Press.
Piriou-Sall, S. 1998. Decentralisation and Rural Development: A Review of Evidence. Manuscript, Washington, DC.
Prohl, S. and Schneider, F. 2009. Does decentralization reduce government size? A quantitative study of the decentralization hypothesis. Public Finance Review, 37(6): 639-664.
Prud’homme, R. 1995. On the Dangers of Decentralisation. World Bank Research Observer, 10: 210-226.

Putnam, R.D. 1993. Making Democracy Work: Civic Traditions in Modern Italy (Princeton: Princeton University Press).
Ragasa, Catherine, Guush Berhane, Fanayae Tadesse and Alemayehu Seyoum Taffesse 2012 Gender Differences in Access to Extension Services and Agriculture Productivity, Ethiopia Strategy Support Program (ESSP) Ethiopia Development Research Institute (EDRI) and International Food Policy Research Institute (IFPRI) ESSP Working Paper 49
Rondinelli, D.A., Cheema, G.S. and Nellis, J. 1983. Decentralisation in Developing Countries: A Review of Recent Experience. Staff Working Paper No.581, World Bank, Washington, DC.
Reynolds, Robert C. and Buli Edjeta. 2011. Strengthening Grievance Redress Mechanisms for the Protection of Basic Services Program in Ethiopia, Addis Ababa.
Samoff, J. 1990. Decentralisation: The Politics of Interventionism. Development and Change, 21: 513-530.
Selam Development Consultants. 2013. Financial Transparency and Accountability Implementation Assessment Report, Addis Ababa.
Smoke, P. 2001. Fiscal Decentralisation in Developing Countries: A Review of Current Concepts and Practice. Democracy, Governance and Human Rights Programme Paper No. 2, UNRISD, Geneva.
Solomon, Negussie. 2008. Fiscal Federalism in the Ethiopian Ethnic-based Federal System, Forum of Federations, Addis Ababa.
Tassew Woldehanna, Eyasu Tsehaye and Ruth Hill. Forthcoming. The Distributional Impact of Fiscal Policy in Ethiopia. Contribution to a Global Study of Fiscal Incidence led by Nora Lustig, World Bank, Washington DC
Tiebout, C. M. 1956. A pure theory of local expenditures. Journal of Political Economy, 64:416-24.
Treisman, D. 2007. The architecture of government: Rethinking political decentralization. New York: Cambridge University Press.
Vaillancourt, Francois. 2013. Sharing central revenues with regions: an examination of principles and practices in the context of the PBS (Ethiopia) program, World Bank, Addis Ababa.
Wang, Huihui. G.N.V. Ramana, Jie Huang and Bekele Chaka (forthcoming) Ethiopia Universal Health Care Case Study, World Bank, Washington, DC
World Bank Ethiopia. 2011. An Assessment of Public Finance Management Systems in Woreda Governments, Addis Ababa.
World Bank. 2010. Financial Transparency and Accountability Initiative in Ethiopia: Progress and Way Forward, Addis Ababa.

Annex 1: Data Summary
Variable Obs Mean Std. Dev. Min MaxOutcome
Net enrollment rate 18 52.43 20.53 19 79DPT vaccination 20 45.80 13.43 27 65Measles vaccination 20 44.75 14.02 22 68Fertility rate 19 6.10 0.79 5 7
ExpenditureEducation expenditures 20 3783.70 3934.14 628 14182Health expenditures 20 1136.15 1309.77 229 5025Education expenditure x woreda decentralization 20 3232.85 4339.50 0 14182 dummyHealth expenditure x woreda decentralization 20 962.10 1425.15 0 5025 dummyTrend 21 11.00 6.20 1 21Woreda decentralization dummy 21 0.52 0.51 0 1

Annex 2: Detailed Regression Results from Post-Decentralization Woreda Database Stage 1: Education Linear Regression
Dependent variable: Net Enrollment Rate
Independent variables: OLS
Yearly expenditure per capita in Education 0.045 (0.0091)
Yearly regional per capita Capital Expenditure 174.331 (1580.6640)
Percentage of rural population -12.283* (6.7861)
Ethnicity controls
Nuwer -7.387 (24.1886)
Anyiwak -11.089 (27.8701)
Gumuz -16.048 (24.4713)
Konso -48.182 (44.7173)
|Hist. Adv. -0.967 (7.2677 )
Somalie -62.222*** (10.1186)
Affar 77.755*** (11.4409)
Other Small -13.178 (8.5432)
Time controls
T zero -3.548*** (1.2457)
T one -4.863*** (.9834)
T two -0.301 (0.6894)
T three Omitted
Constant 104.449*** (9.4504)
Quadratic Regression
Dependent variable: Net Enrollment Rate
Independent variables: OLS
Yearly expenditure per capita in Education 0.025 (0.0223)
Yearly expenditure per capita in Education Squared -0.00005 (0.00003)
Yearly regional per capita Capital Expenditure 55.277 (1583.27)
Percentage of rural population -10.394

(6.8810) Ethnicity controls
Nuwer -8.569 (24.1212)
Anyiwak -13.453 (27.8232)
Gumuz -18.196 (24.4323)
Konso -48.041 (44.5685)
|Hist. Adv. -1.193 (7.2454 )
Somalie -61.075*** (10.1151)
Affar -77.279*** (11.4079)
Other Small -13.489 (8.5172)
Time controls T zero -2.438*
(1.4520)
T one -3.952*** (1.1585)
T two 0.087 (0.7375)
T three Omitted
Constant 100.071*** (9.8686)
Log Linear Regression
Dependent variable: Log Net Enrollment Rate
Independent variables: OLS
Log yearly expenditure per capita in Education 0.270*** (0.0280)
Log yearly regional per capita Capital Expenditure -35.212 (23.2644)
Percentage of rural population 0.120 (0.0830)
Ethnicity controls Nuwer -0.168
(0.2855)
Anyiwak -0.545* (0.3307)
Gumuz -0.316 (0.2900)
Konso -0.452 (0.5269)
|Hist. Adv. 0.026 (0.0859 )
Somalie -0.923*** (0.1215)

Affar -1.619*** (0.1357)
Other Small -0.145 (0.1007)
Time controls T zero 0.098***
(0.0236)
T one 0.059*** (0.0185)
T two 0.041 (0.0111)
T three Omitted
Constant 3.039*** (0.1906)
Cross-time pooled regressions with robust standard errors; standard errors in parentheses; *, **, *** = coefficients significant at the 10%, 5% and 1% levels
Linear Regression
Dependent variable: Pupil-Teacher Ratio
Independent variables: OLS
Yearly expenditure per capita in Education -0.024 (0.0199)
Yearly regional per capita Capital Expenditure 8000.899*** (2800.951)
Percentage of rural population 15.676 (4.7215)
Ethnicity controls Nuwer -3.408
(13.6348)
Anyiwak -32.619* (17.6828)
Gumuz -21.557 (14.7049)
Konso -18.551 (26.2358)
|Hist. Adv. -15.588*** (4.1635 )
Somalie 39.245*** (6.1928)
Affar -26.338*** (7.1540)
Other Small -7.671 (4.7664)
Time controls T zero 6.381**
(2.6909)
T one 1.990

(2.1899) T two 4.038**
(1.6336)
T three Omitted
Constant 43.085*** (8.1009)
Quadratic Regression
Dependent variable: Pupil-Teacher Ratio
Independent variables: OLS
Yearly expenditure per capita in Education -0.110*** (0.0403)
Yearly expenditure per capita in Education Squared 0.0002** (0.00006)
Yearly regional per capita Capital Expenditure 7472.043*** (2805.786)
Percentage of rural population 12.328** (4.9101)
Ethnicity controls Nuwer -0.908
(13.6528)
Anyiwak -34.057** (17.6673)
Gumuz -17.969 (14.7562) Konso -18.807 (26.1966) |Hist. Adv. -14.821***
(4.1692 )
Somalie 35.936*** (6.3310)
Affar -28.423*** (7.1947)
Other Small -7.151 (4.7640)
Time controls T zero 3.476
(2.9395)
T one -0.288 (2.3785)
T two 3.067* (1.6798)
T three Omitted
Constant 53.924*** (9.2286)
Log Linear Regression
Dependent variable: Pupil-Teacher Ratio
Independent variables: OLS
Log yearly expenditure per capita in Education -0.224*** (0.0202)
Log yearly regional per capita Capital Expenditure 85.212*** (19.7773)

Percentage of rural population 0.202*** (0.0363)
Ethnicity controls
Nuwer 0.139 (0.1117)
Anyiwak -0.718*** (0.1364)
Gumuz -0.378 (0.1189)
Konso -0.315 (0.2126)
|Hist. Adv. -0.238*** (0.0334 )
Somalie 0.122** (0.0498)
Affar -0.618*** (0.0582)
Other Small -0.136*** (0.0386)
Time controls T zero -0.033
(0.0203)
T one -0.088*** (0.0159)
T two 0.000 (0.0106)
T three Omitted
Constant 4.914*** (0.1251)
Cross-time pooled regressions with robust standard errors; standard errors in parentheses; *, **, *** = coefficients significant at the 10%, 5% and 1% levels Stage 1: Health Linear Regression
Dependent variable: Penta3 Vaccination Rate
Independent variables: OLS
Yearly expenditure per capita in Education -0.063*** (0.0233)
Yearly regional per capita Capital Expenditure -1447.151 (1315.3060)
Percentage of rural population 8.677*** (1.8676)
Ethnicity controls Nuwer -64.966***
(6.4810)
Anyiwak -53.901*** (8.3259)
Gumuz -44.426*** (7.3255)

Konso -50.230** (24.1339)
|Hist. Adv. -9.565*** (2.0970 )
Somalie -51.458*** (2.7817)
Affar -47.295*** (3.2447)
Other Small -13.755*** (2.4127)
Time controls T zero -9.362***
(1.2211)
T one -3.007** (1.2684)
T two -6.915*** (0.8858)
T three Omitted
Constant 91.697*** (3.1549)
Quadratic Regression
Dependent variable: Penta3 Vaccination Rate
Independent variables: OLS
Yearly expenditure per capita in Education -0.122*** (0.0395)
Yearly expenditure per capita in Education Squared 0.0003* (0.0001)
Yearly regional per capita Capital Expenditure -1431.498 (1315.529)
Percentage of rural population 8.152*** (1.8899)
Ethnicity controls
Nuwer -64.123*** (6.4999)
Anyiwak -55.78*** (8.3911)
Gumuz -43.354*** (7.3510)
Konso -49.085** (24.1561)
|Hist. Adv. -9.581*** (2.0974 )
Somalie -51.333*** (2.7833)
Affar -46.810*** (3.2567)
Other Small -13.546*** (2.4160)
Time controls
T zero -9.963***

(1.2633) T one -3.535***
(1.2994)
T two -7.166*** (0.8955)
T three Omitted
Constant 93.646*** (3.3278)
Log Linear Regression
Dependent variable: Penta3 Vaccination Rate
Independent variables: OLS
Log yearly expenditure per capita in Education -0.061** (0.0270)
Log yearly regional per capita Capital Expenditure -43.230 (37.8668)
Percentage of rural population 0.182*** (0.0512)
Ethnicity controls
Nuwer -1.939*** (0.1816)
Anyiwak -1.048*** (0.2274)
Gumuz -0.701*** (0.2067)
Konso -0.592 (0.6551)
|Hist. Adv. -0.125** (0.0607 )
Somalie -1.048*** (0.0796)
Affar -1.076*** (0.0915)
Other Small -0.223*** (0.0694)
Time controls
T zero -0.193*** (0.0416)
T one -0.104** (0.0428)
T two -0.142 *** (0.0296)
T three Omitted
Constant 4.689*** (0.1379)
Cross-time pooled regressions with robust standard errors; standard errors in parentheses; *, **, *** = coefficients significant at the 10%, 5% and 1% levels

Linear Regression
Dependent variable: Antenatal Care
Independent variables: OLS
Yearly expenditure per capita in Education 0.026 (0.0313)
Yearly regional per capita Capital Expenditure -249.548 (1711.0580)
Percentage of rural population -10.849*** (2.4200)
Ethnicity controls Nuwer -56.384***
(8.5451)
Anyiwak -44.982*** (10.2385)
Gumuz -59.973*** (9.1047)
Konso -42.666 (30.2839) |Hist. Adv. -13.034***
(2.5008 )
Somalie -41.722*** (3.4255)
Affar -59.354*** (4.0043)
Other Small -13.486*** (2.8967)
Time controls T zero -13.198***
(1.6319)
T one -6.886*** (1.6671)
T two -4.589*** (1.2176)
T three Omitted
Constant 96.300*** (4.0269)
Quadratic Regression
Dependent variable: Antenatal Care
Independent variables: OLS
Yearly expenditure per capita in Education 0.086 (0.0532)
Yearly expenditure per capita in Education Squared -0.0003 (0.0002)
Yearly regional per capita Capital Expenditure -238.134 (1711.9540)
Percentage of rural population -10.305*** (2.4525)
Ethnicity controls
Nuwer -57.340*** (8.5779)

Anyiwak -43.322*** (10.3145)
Gumuz -61.090*** (9.1462)
Konso -43.918 (30.3276)
|Hist. Adv. -13.080*** (2.5029)
Somalie -41.852*** (3.4293)
Affar -59.895*** (4.0262)
Other Small -13.747*** (2.9050)
Time controls
T zero -12.542*** (1.6965)
T one -6.326*** (1.7131)
T two -4.323*** (1.2316)
T three Omitted
Constant 94.305*** (4.2712)
Log Linear Regression
Dependent variable: Antenatal Care
Independent variables: OLS
Log yearly expenditure per capita in Education 0.078** (0.0341)
Log yearly regional per capita Capital Expenditure -36.054 (47.8480)
Percentage of rural population -0.011 (0.0671)
Ethnicity controls
Nuwer -2.787*** (0.2403)
Anyiwak -0.807*** (0.2774)
Gumuz -1.290*** (0.2545)
Konso -0.579 (0.8457)
|Hist. Adv. -0.156** (0.0700 )
Somalie -0.901*** (0.0961)
Affar -1.839*** (0.1127)
Other Small -0.237*** (0.0813)

Time controls
T zero -0.232*** (0.0499)
T one -0.150*** (0.0496)
T two -0.124 *** (0.0350)
T three Omitted
Constant 4.249*** (0.1706)
Cross-time pooled regressions with robust standard errors; standard errors in parentheses; *, **, *** = coefficients significant at the 10%, 5% and 1% levels
Linear Regression
Dependent variable: Contraceptive Acceptance rate
Independent variables: OLS
Yearly expenditure per capita in Education -0.052* (0.0287)
Yearly regional per capita Capital Expenditure -1371.507 (1583.1580)
Percentage of rural population -11.900*** (2.2773)
Ethnicity controls
Nuwer -64.900*** (7.8045)
Anyiwak -45.951*** (9.5779)
Gumuz -57.212*** (8.3646)
Konso -10.295 (28.6759)
|Hist. Adv. -5.363** (2.3429)
Somalie -61.431*** (3.302)
Affar -53.855*** (3.7462)
Other Small -12.126*** (2.7181)
Time controls
T zero -14.651*** (1.4963)
T one -8.743*** (1.4947)
T two -3.260*** (1.0739)

T three Omitted
Constant 83.648*** (3.7609)
Quadratic Regression
Dependent variable: Contraceptive Acceptance rate
Independent variables: OLS
Yearly expenditure per capita in Education -0.012 (0.0493)
Yearly expenditure per capita in Education Squared -0.00023 (0.0002)
Yearly regional per capita Capital Expenditure -1351.924 (1583.894)
Percentage of rural population -11.527*** (2.3092)
Ethnicity controls
Nuwer 65.492*** (7.8317)
Anyiwak -45.000*** (9.6311)
Gumuz -57.931*** (8.4008)
Konso -11.154 (28.7083)
|Hist. Adv. -5.396** (2.3444)
Somalie -61.430*** (3.3037)
Affar -54.207*** (3.7654)
Other Small -12.297*** (2.7251)
Time controls
T zero -14.187*** (1.5666)
T one -8.350*** (1.5451)
T two -3.075*** (1.0896)
T three Omitted
Constant 82.290*** (4.0021)
Log Linear Regression
Dependent variable: Contraceptive Acceptance rate
Independent variables: OLS
Log yearly expenditure per capita in Education -0.025 (0.0403)
Log yearly regional per capita Capital Expenditure -59.955 (55.6050)

Percentage of rural population -0.124 (0.0799)
Ethnicity controls
Nuwer -4.864*** (0.2766)
Anyiwak -1.777*** (0.3285)
Gumuz -1.813*** (0.2954)
Konso -0.111 (1.0139)
|Hist. Adv. -0.073 (0.0828 )
Somalie -2.786*** (0.1169)
Affar -2.134*** (0.1332)
Other Small -0.325*** (0.0963)
Time controls
T zero -0.385*** (0.0579)
T one -0.258*** (0.0559)
T two -0.0938** (0.0385)
T three Omitted
Constant 4.481*** (0.2021)
Cross-time pooled regressions with robust standard errors; standard errors in parentheses; *, **, *** = coefficients significant at the 10%, 5% and 1% levels
Linear Regression Dependent variable: Delivery by Skilled Birth Attendant
Independent variables: OLS
Yearly expenditure per capita in Education 0.066*** (0.0287)
Yearly regional per capita Capital Expenditure 328.600 (1211.0980)
Percentage of rural population -22.745*** (1.7421)
Ethnicity controls
Nuwer -15.830*** (5.9881)
Anyiwak -19.264*** (7.4207)
Gumuz -17.340*** (6.2405)

Konso -3.805 (20.9835)
|Hist. Adv. -4.326** (1.7805)
Somalie -10.021*** (2.5271)
Affar -9.327*** (2.8013)
Other Small -5.143** (2.0568)
Time controls
T zero -3.308*** (1.1900)
T one -4.626*** (1.2333)
T two 1.012 (0.9168)
T three Omitted
Constant 40.980*** (2.8922)
Quadratic Regression
Dependent variable: Delivery by Skilled Birth Attendant
Independent variables: OLS
Yearly expenditure per capita in Education 0.068* (0.0389)
Yearly expenditure per capita in Education Squared -0.00001 (0.0001)
Yearly regional per capita Capital Expenditure 330.274 (1211.889)
Percentage of rural population -22.726*** (1.7685)
Ethnicity controls
Nuwer -15.862*** (6.0100)
Anyiwak -19.204** (7.4858)
Gumuz -17.374*** (6.2652)
Konso -3.847 (21.0059)
|Hist. Adv. -4.327** (1.7815)
Somalie -10.024*** (2.5288)
Affar -9.344*** (2.8147)
Other Small -5.152** (2.0616)
Time controls
T zero -3.285***

(1.2422) T one -4.607***
(1.2694)
T two 1.021 (0.9270)
T three Omitted
Constant 40.911*** (3.0919)
Log Linear Regression
Dependent variable: Delivery by Skilled Birth Attendant
Independent variables: OLS
Log yearly expenditure per capita in Education 0.243*** (0.0732)
Log yearly regional per capita Capital Expenditure -72.666 (98.6972)
Percentage of rural population -0.705*** (0.1456)
Ethnicity controls
Nuwer -2.556*** (0.5012)
Anyiwak -2.182*** (0.5980)
Gumuz -1.106** (0.5242)
Konso -0.223 (1.7985)
|Hist. Adv. 0.019 (0.1486)
Somalie -0.758*** (0.2109)
Affar -1.310*** (0.2378)
Other Small -0.186 (0.1726)
Time controls
T zero -0.123 (0.1011)
T one -0.408*** (0.0990)
T two -0.000 (0.0700)
T three Omitted
Constant 2.477*** (0.3672)
Probit regressions with robust standard errors in parentheses; Predicted probabilities with unconditional standard errors in parentheses. *, **, *** = coefficients significant at the 10%, 5% and 1% levels

Stage 1: Agriculture Log Linear Regression
Dependent variable: Cereal Yield
Independent variables: OLS
Log yearly expenditure per capita in Agriculture 0.128*** (0. 0489)
Percentage of rural population -0.414* (0.2205)
Rainfall controls
Average rainfall 0.000 (0.0008)
Deviation from average rainfall 0.001** (0.0007)
Deviation from average rainfall (lagged) 0.002*** (0.0007)
Regional dummies
Tigray 4.576 (9.0103)
Afar 3.544 (8.5370)
Amhara 3.522 (8.9863)
Oromia 3.951 (8.9503)
Somali 11.307 (9.2046)
Beneshangul Gemuz 17.258 (18.0467)
SNNP 3.502 (8.9883)
Gambella Omitted
Regional dummies x Average rainfall
Tigray x Avg RF 0.000 (0.0009)
Afar x Avg RF Omitted
Amhara x Avg RF 0.000 (0.0009)
Oromia x Avg RF 0.000 (0.0008)
Somali x Avg RF -0.010*** (0.0027)
Beneshangul Gemuz x Avg RF -0.011 (0.0128)
SNNP x Avg RF 0.000 (0.0008)
Gambella x Avg RF Omitted

Regional dummies x Poverty rate
Tigray x Poverty rate -0.020 (0.0182)
Afar x Poverty rate Omitted
Amhara x Poverty rate -0.003 (0.0058)
Oromia x Poverty rate 0.002 (0.0063)
Somali x Poverty rate -0.078*** (0.0200)
Beneshangul Gemuz x Poverty rate -0.036 (0.0438)
SNNP x Poverty rate 0.000 (0.0025)
Gambella x Poverty rate 0.102 (0.2498)
Constant -1.510 (8.9315)
Cross-time pooled regressions with robust standard errors; standard errors in parentheses; *, **, *** = coefficients significant at the 10%, 5% and 1% levels Dire Dawa and Hara omitted due to small scale of agriculture in these regions
Log Linear Regression
Dependent variable: Pulses Yield
Independent variables: OLS
Log yearly expenditure per capita in Agriculture -0.020 (0.0645)
Percentage of rural population 0.105 (0.2456)
Rainfall controls
Average rainfall 0.001 (0.0014)
Deviation from average rainfall 0.001 (0.0010)
Deviation from average rainfall (lagged) 0.001 (0.0010)
Regional dummies
Tigray 3.165 (2.126)
Afar 0.918 (1.1132)
Amhara 2.115 (1.9126)
Oromia 3.184* (1.8845)
Somali 3.569 (3.0569)
Beneshangul Gemuz 39.151* (20.4730)
SNNP 2.462

(1.9117) Gambella Omitted
Regional dummies x Average rainfall
Tigray x Avg RF -0.001 (0.0015)
Afar x Avg RF Omitted
Amhara x Avg RF 0.000 (0.0014)
Oromia x Avg RF -0.001 (0.0014)
Somali x Avg RF -0.002 (0.0036)
Beneshangul Gemuz x Avg RF -0.030* (0.0166)
SNNP x Avg RF -0.001 (0.0014)
Gambella x Avg RF Omitted
Regional dummies x Poverty rate
Tigray x Poverty rate -0.012 (0.0196)
Afar x Poverty rate Omitted
Amhara x Poverty rate -0.008 (0.0063)
Oromia x Poverty rate -0.010 (0.0070)
Somali x Poverty rate -0.027 (0.0265)
Beneshangul Gemuz x Poverty rate -0.126** (0.0563)
SNNP x Poverty rate 0.002 (0.0027)
Gambella x Poverty rate Omitted
Constant -0.213 (1.8785)
Cross-time pooled regressions with robust standard errors; standard errors in parentheses; *, **, *** = coefficients significant at the 10%, 5% and 1% levels Dire Dawa and Hara omitted due to small scale of agriculture in these regions
Log Linear Regression
Dependent variable: Root Crop Yield
Independent variables: OLS
Log yearly expenditure per capita in Agriculture 0.320 (0.2266)
Percentage of rural population -0.082 (0.7218)
Rainfall controls

Average rainfall 0.000 (0.0032)
Deviation from average rainfall 0.002 (0.0039)
Deviation from average rainfall (lagged) 0.010 (0.0039)
Regional dummies
Tigray 0.739 (5.2598)
Afar Omitted
Amhara 0.314 (4.4270)
Oromia 0.579 (4.4138)
Somali -1.041 (5.5139)
Beneshangul Gemuz 4.842 (43.2237)
SNNP 0.626 (4.4447)
Gambella Omitted
Regional dummies x Average rainfall
Tigray x Avg RF 0.000 (0.0036)
Afar x Avg RF Omitted
Amhara x Avg RF 0.000 (0.0033)
Oromia x Avg RF 0.000 (0.0033)
Somali x Avg RF 0.003 (0.0069)
Beneshangul Gemuz x Avg RF -0.003 (0.0351)
SNNP x Avg RF 0.000 (0.0033)
Gambella x Avg RF Omitted
Regional dummies x Poverty rate
Tigray x Poverty rate 0.012 (0.0618)
Afar x Poverty rate Omitted
Amhara x Poverty rate -0.008 (0.0170)
Oromia x Poverty rate -0.009 (0.0211)
Somali x Poverty rate Omitted
Beneshangul Gemuz x Poverty rate -0.006

(0.1203) SNNP x Poverty rate -0.016**
(0.0074)
Gambella x Poverty rate Omitted
Constant 2.431 (4.5185)
Cross-time pooled regressions with robust standard errors; standard errors in parentheses; *, **, *** = coefficients significant at the 10%, 5% and 1% levels Dire Dawa and Hara omitted due to small scale of agriculture in these regions
Log Linear Regression
Dependent variable: Vegetable Yield
Independent variables: OLS
Log yearly expenditure per capita in Agriculture 0.582*** (0.1330)
Percentage of rural population -0.110 (0.5548)
Rainfall controls
Average rainfall 0.001 (0.0021)
Deviation from average rainfall 0.001 (0.0020)
Deviation from average rainfall (lagged) -0.003 (0.0021)
Regional dummies
Tigray 32.703 (22.4893)
Afar 34.322 (22.5041)
Amhara 32.568 (22.4326)
Oromia 33.773 (22.3465)
Somali 10.227 (22.9840)
Beneshangul Gemuz 35.983 (43.4964)
SNNP 31.791 (22.4365)
Gambella Omitted
Regional dummies x Average rainfall
Tigray x Avg RF -0.002 (0.0024)
Afar x Avg RF -0.005 (0.0042)
Amhara x Avg RF -0.002 (0.0022)
Oromia x Avg RF -0.002 (0.0021)

Somali x Avg RF 0.031*** (0.0067)
Beneshangul Gemuz x Avg RF -0.005 (0.0306)
SNNP x Avg RF 0.001 (0.0021)
Gambella x Avg RF Omitted
Regional dummies x Poverty rate
Tigray x Poverty rate 0.004 (0.0618)
Afar x Poverty rate Omitted
Amhara x Poverty rate -0.003 (0.0145)
Oromia x Poverty rate -0.034** (0.0159)
Somali x Poverty rate 0.185*** (0.0490)
Beneshangul Gemuz x Poverty rate -0.036 (0.1049)
SNNP x Poverty rate -0.004 (0.0064)
Gambella x Poverty rate 0.919 (0.6237)
Constant -29.575 (22.3062)
Cross-time pooled regressions with robust standard errors; standard errors in parentheses; *, **, *** = coefficients significant at the 10%, 5% and 1% levels Dire Dawa and Hara omitted due to small scale of agriculture in these regions
Log Linear Regression
Dependent variable: Oil seeds Yield
Independent variables: OLS
Log yearly expenditure per capita in Agriculture -0.118 (0.1899)
Percentage of rural population -0.229 (0.6220)
Rainfall controls
Average rainfall -0.008*** (0.0024)
Deviation from average rainfall -0.001 (0.0034)
Deviation from average rainfall (lagged) -0.001 (0.0036)
Regional dummies
Tigray -43.523* (25.2816)
Afar -38.156 (24.0540)

Amhara -42.608* (25.2609)
Oromia -42.904* (25.1993)
Somali -41.315* (24.3306)
Beneshangul Gemuz -52.981 (44.3822)
SNNP -44.061* (25.2585)
Gambella Omitted
Regional dummies x Average rainfall
Tigray x Avg RF 0.008*** (0.0027)
Afar x Avg RF Omitted
Amhara x Avg RF 0.008*** (0.0025)
Oromia x Avg RF 0.008*** (0.0025)
Somali x Avg RF Omitted
Beneshangul Gemuz x Avg RF 0.017*** (0.0025)
SNNP x Avg RF 0.009*** (0.0025)
Gambella x Avg RF Omitted
Regional dummies x Poverty rate
Tigray x Poverty rate 0.017 (0.0450)
Afar x Poverty rate Omitted
Amhara x Poverty rate 0.001 (0.0144)
Oromia x Poverty rate 0.007 (0.0186)
Somali x Poverty rate Omitted
Beneshangul Gemuz x Poverty rate 0.012 (0.1041)
SNNP x Poverty rate 0.000 (0.7084)
Gambella x Poverty rate -1.044* (0.7084)
Constant 45.731* (25.1903)
Cross-time pooled regressions with robust standard errors; standard errors in parentheses; *, **, *** = coefficients significant at the 10%, 5% and 1% levels Dire Dawa and Hara omitted due to small scale of agriculture in these regions
Log Linear Regression
Dependent variable: Enset Yield
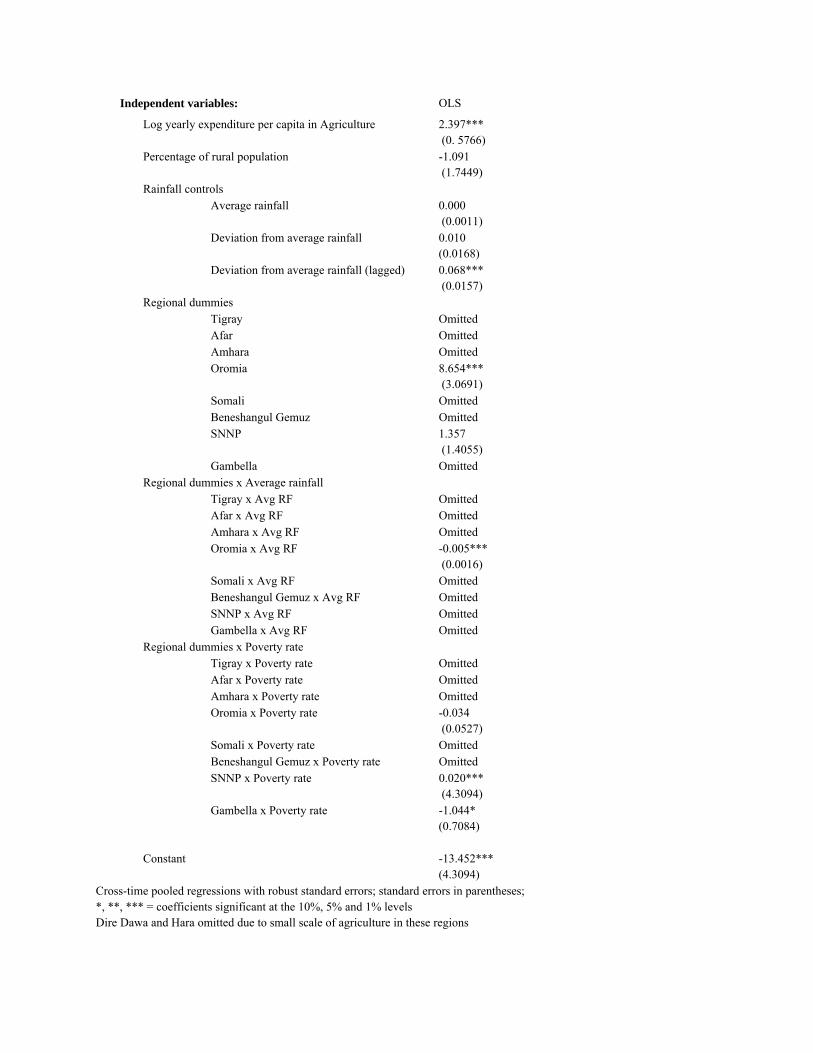
Independent variables: OLS
Log yearly expenditure per capita in Agriculture 2.397*** (0. 5766)
Percentage of rural population -1.091 (1.7449)
Rainfall controls Average rainfall 0.000
(0.0011)
Deviation from average rainfall 0.010 (0.0168)
Deviation from average rainfall (lagged) 0.068*** (0.0157)
Regional dummies Tigray Omitted Afar Omitted Amhara Omitted Oromia 8.654***
(3.0691)
Somali Omitted Beneshangul Gemuz Omitted SNNP 1.357
(1.4055)
Gambella Omitted Regional dummies x Average rainfall Tigray x Avg RF Omitted Afar x Avg RF Omitted Amhara x Avg RF Omitted Oromia x Avg RF -0.005***
(0.0016)
Somali x Avg RF Omitted Beneshangul Gemuz x Avg RF Omitted SNNP x Avg RF Omitted Gambella x Avg RF Omitted Regional dummies x Poverty rate Tigray x Poverty rate Omitted Afar x Poverty rate Omitted Amhara x Poverty rate Omitted Oromia x Poverty rate -0.034
(0.0527)
Somali x Poverty rate Omitted Beneshangul Gemuz x Poverty rate Omitted SNNP x Poverty rate 0.020***
(4.3094)
Gambella x Poverty rate -1.044* (0.7084)
Constant -13.452*** (4.3094)
Cross-time pooled regressions with robust standard errors; standard errors in parentheses; *, **, *** = coefficients significant at the 10%, 5% and 1% levels Dire Dawa and Hara omitted due to small scale of agriculture in these regions

Log Linear Regression
Dependent variable: Fruit Yield
Independent variables: OLS
Log yearly expenditure per capita in Agriculture 1.790*** (0.2669)
Percentage of rural population -0.794 (0.9149)
Rainfall controls Average rainfall 0.000
(0.0006)
Deviation from average rainfall 0.002 (0.0048)
Deviation from average rainfall (lagged) 0.028*** (0.0050)
Regional dummies Tigray -2.459
(3.3924)
Afar 4.850* (2.8878)
Amhara -0.309 (0.9558)
Oromia 2.933** (1.2536)
Somali -5.032 (6.4944)
Beneshangul Gemuz -108.598** (55.213)
SNNP Omitted Gambella Omitted Regional dummies x Average rainfall Tigray x Avg RF 0.001
(0.0019)
Afar x Avg RF -0.009 (0.0059)
Amhara x Avg RF 0.001 (0.0013)
Oromia x Avg RF -0.002** (0.0008)
Somali x Avg RF 0.005 (0.0090)
Beneshangul Gemuz x Avg RF 0.087* (0.0448)
SNNP x Avg RF Omitted Gambella x Avg RF Omitted Regional dummies x Poverty rate Tigray x Poverty rate 0.002
(0.0665)
Afar x Poverty rate Omitted Amhara x Poverty rate -0.023
(0.0213)
Oromia x Poverty rate -0.019 (0.0267)

Somali x Poverty rate 0.113 (0.0727)
Beneshangul Gemuz x Poverty rate 0.288* (0.1537)
SNNP x Poverty rate 0.014 (0.0093)
Gambella x Poverty rate Omitted
Constant -4.019*** (1.4968)
Cross-time pooled regressions with robust standard errors; standard errors in parentheses; *, **, *** = coefficients significant at the 10%, 5% and 1% levels Dire Dawa and Hara omitted due to small scale of agriculture in these regions
Log Linear Regression
Dependent variable: Coffee Yield
Independent variables: OLS
Log yearly expenditure per capita in Agriculture 1.267*** (0. 2342)
Percentage of rural population -0.777 (0.7845)
Rainfall controls
Average rainfall 0.000 (0.0005)
Deviation from average rainfall -0.001 (0.0048)
Deviation from average rainfall (lagged) 0.029*** (0.0049)
Regional dummies
Tigray Omitted
Afar Omitted
Amhara -0.632 (0.8110)
Oromia 2.014* (1.0696)
Somali 1.43** (0.6380)
Beneshangul Gemuz -18.760 (46.6977)
SNNP Omitted
Gambella Omitted
Regional dummies x Average rainfall
Tigray x Avg RF Omitted
Afar x Avg RF Omitted
Amhara x Avg RF 0.000 (0.0011)
Oromia x Avg RF -0.001*** (0.0007)

Somali x Avg RF Omitted
Beneshangul Gemuz x Avg RF 0.014 (0.0379)
SNNP x Avg RF Omitted
Gambella x Avg RF Omitted
Regional dummies x Poverty rate
Tigray x Poverty rate Omitted
Afar x Poverty rate Omitted
Amhara x Poverty rate -0.012 (0.0180)
Oromia x Poverty rate 0.004 (0.0228)
Somali x Poverty rate Omitted
Beneshangul Gemuz x Poverty rate 0.068 (0.1300)
SNNP x Poverty rate 0.007 (0.0082)
Gambella x Poverty rate Omitted
Constant -4.095*** (1.3591)
Cross-time pooled regressions with robust standard errors; standard errors in parentheses; *, **, *** = coefficients significant at the 10%, 5% and 1% levels Dire Dawa and Hara omitted due to small scale of agriculture in these regions Stage 3: Agriculture
Dependent variable: Any Improved Technique, 2011
Independent variables: Probit Predicted Probability
Yearly expenditure per capita in Agriculture 0.0033 (0.00029)
Poverty rate 0.0075** (0.00295)
Rainfall controls
Average rainfall -0.00078*** (0.00007)
Deviation from average rainfall 2011 -0.00306*** (0.00046)
Deviation from average rainfall 2010 0.0090*** (0.00043)
Regional dummies
Tigray omitted
Afar -5.1478*** (0.58951)
Amhara -2.8538*** (0.13734)
Oromia -0.02614 (0.14042)
Somali -1.1050 (2.79749)

Beneshangul Gemuz -28.8422*** (5.38058)
SNNP -0.9599 (0.14272)
Gambella 40.0622 -
Regional dummies x Average rainfall
Tigray x Avg RF omitted
Afar x Avg RF omitted
Amhara x Avg RF 0.0031*** (0.00007)
Oromia x Avg RF -0.00001 (0.00007)
Somali x Avg RF -0.0025 (0.00408)
Beneshangul Gemuz x Avg RF 0.0234*** (0.00434)
SNNP x Avg RF 0.0005*** (0.00008)
Gambella x Avg RF 0.0022*** 0.00066
Regional dummies x Poverty rate
Tigray x Poverty rate omitted
Afar x Poverty rate 0.1298*** (0.01668)
Amhara x Poverty rate -0.0027 (0.00304)
Oromia x Poverty rate -0.0207*** (0.00307)
Somali x Poverty rate -0.0016 (0.02692)
Beneshangul Gemuz x Poverty rate 0.0446*** (0.01563)
SNNP x Poverty rate -0.0010 (0.00298)
Gambella x Poverty rate -1.4040 -
Quintile
Smallest/Poorest omitted 0.0003*** (0.00002)
Second/Poorer 0.0445*** (0.01386)
0.0003*** (0.00003)
Middle/Middle 0.3727*** (0.01282)
0.0005*** (0.00004)
Fourth/Richer 0.5961*** (0.01265)
0.0006*** (0.00005)
Largest/Richest 0.8211*** (0.01280)
0.0008*** (0.00007)
Constant -1.7225*** (0.15902)