debt raising and refinancing costs - aer
TRANSCRIPT

pwc.com.au
EnergyNetworksAssociation:Debt financingcosts
Energy Networks
Association
June, 2013

Disclaimer
This Report has been prepared by PricewaterhouseCoopers Australia (PwC) at the requestof the Energy Networks Association ("ENA") in our capacity as advisors in accordancewith the engagement contract between ENA and PwC dated 21 May 2013 ("the Contract").
This document is not intended to be utilised or relied upon by any persons other than theENA and its members, nor to be used for any purpose other than that articulated in theTerms of Reference contained in the Contract, replicated in this report. Accordingly, PwCaccept no responsibility in any way whatsoever for the use of this report by any otherpersons or for any other purpose.
The information, statements, statistics and commentary (together the "Information")contained in this report have been prepared by PwC from publicly available material. PwChave not sought any independent confirmation of the reliability, accuracy or completenessof this information. It should not be construed that PwC has carried out any form of auditof the information which has been relied upon.
Accordingly, whilst the statements made in this report are given in good faith, PwC acceptno responsibility for any errors in the information provided by the ENA, to the extent itdid, or other parties nor the effect of any such errors on our analysis, suggestions orreport.

1 Executive Summary
Background and scopeThe Energy Networks Association (ENA) engaged PricewaterhouseCoopers to estimate thetotal debt financing costs for a benchmark efficient network service provider (NSP), wheredebt financing is defined to include the raising of new debt, and the refinancing of existingmaturing debt. The ENA requested us to provide details of the following costs:
Direct transaction costs associated with a debt financing including but not limitedto, costs such as upfront establishment fees paid to financiers and/or to arrangingparties, legal fees, road-show costs, the credit rating fee applied directly to thefinancing transaction, trustee fees, registrar fees; and
Indirect transaction costs associated with a debt financing including but not limitedto, early financing costs, early redemption costs, and commitment fees associatedwith the maintenance of liquidity reserves.
Compensation for benchmark debt raising costsUnder Australia’s regulatory framework, compensation is required for the efficient costs thatare incurred in undertaking the financing of the business. The benchmark assumption is thatthe regulated business is fully financed by corporate bonds with a term to maturity atissuance of 10 years.1 This assumption greatly simplifies the analysis of the cost of debt, andof debt raising transaction costs, with the implicit assumption that the cost (includingtransaction costs) of different forms of debt actually used are not materially different. Theresults presented in this report assume a benchmark term of debt (bonds) at issuance of 10years, and that one-tenth of the bonds are re-financed each year.
During the past decade a benchmark of 12.5 bppa (bppa), representing direct costs of debtraising, was developed and applied by a number of Australian regulators. However, since2004 the Australian Energy Regulator (AER) has applied a methodology that is based onempirical observations of direct debt raising costs, and this has resulted in the adoptedvalues in the range of 8 to 10 bppa depending on the size of the regulated business. Followingthe GFC and resulting changes in international finance, it is worth re-visiting thismethodology to assess whether it is still appropriate.
In order to apply the methodology used by the AER, it is necessary to identify the benchmarksize of bond issue, since some costs are issue specific (and so depend upon the total numberof bond issues required to refinance the required quantity of debt). When estimating directdebt raising transaction costs for Powerlink in 2011 (based on 5 years of data to 2010), wefound that the median size of domestic bond issue was $250 million. Updating the analysisfor more recent data spanning the years 2008-13, we found that the median bond issuancesize has stayed at $250 million.
Indirect costs associated with financing are costs that would be incurred by the benchmarkefficient entity, and being consistent with the required rate of return objective in the NERand Rule 87 of the National Gas Rules, requires compensation.2 These costs are prudent
1 There isn’t a strict term to maturity specified in the new NER’s DNSP economic regulation provisions, however the new NER’s
transitional arrangements in Section 6.5.2 of Chapter 11 specifies that for business who are regulated under the transitionalarrangements, and therefore not new arrangements, will use a term to maturity of 10 years.
2 See, or example: AEMC (15 November, 2012), Final Position Rules: Amendments to the National Gas Rules, [5] Rule 87; andNational Electricity Rules, Section 55, Economic Regulation of Transmission Services, 6A.6.2.
Executive Summary
Energy Networks AssociationPwC ii
financial risk management practices as well as requirements, to the extent that it avoidsundesirable credit rating action, imposed by the credit rating agencies.
Maintain a liquidity reserve – Specifically, credit rating agencies require corporateborrowers to hold a certain quantity of liquid reserves (i.e. spare funding capacity) inexcess of their known funding requirements. The liquidity reserves normally take theform of committed but unused funding facilities from banks, for which there areupfront establishment costs and on-going fees.
Re-finance ahead of the re-financing date – Credit rating agencies require a corporateborrower to manage its refinancing risk prudently to mitigate refinancing risk andavoid any negative ratings action. Standard & Poor’s specifically requires borrowers tohave any upcoming refinancing requirements finalised at least 3 months ahead of therefinancing date.3 For a bond refinancing, this means that for three months businesseswill pay a spread between the interest cost of the new bonds (i.e. the bonds that willrefinance the maturing bonds in three months’ time) and the cash rate earned on theproceeds from the new bonds.
Direct financing transaction costsWe identified a standard debt issuance size and benchmark term to maturity, to estimate arange of transaction costs based on the required size of the debt component of the regulatedasset base. Table 1 summarises our findings in relation to the associated debt raisingtransaction costs.
The estimates in Table 1 are based on the standard bond issue size, and assumed term tomaturity at issuance. The two major categories of direct costs are:
The base arrangement fee that is paid to the organisation responsible for the bondissue to prepare and market the issue; and
Other direct debt raising transaction costs (such as legal costs, rating and agency fees).
These costs are expressed in terms of an equivalent bppa.4
The most material direct transaction cost is the fee that is paid to an organisation to arrangethe bond issue (that is, marketing the bond issue and securing the interest of bond investors).Since there is no transparent publicly available data source for bonds issued in Australia, likethe AER, we relied on bond arrangement fee data for Australian firms issuing bonds in theUS over the period 2008 to 2013.5 We used a 5 year window as this is the approach that hasbeen applied by the AER in the past. It is a period that is long enough to get a meaningfulsample of observations, and to inform about current costs in the market, but not so long as tobe out of date. The global financial crisis has had an impact during this period, particularly2008-2009, but we have undertaken sensitivity tests that have indicated a similar level ofarrangement fees pre- and post-2009.
Using the Bloomberg data service, we initially identified 1,673 Australian corporate bondissues in the US during that period, but eliminated bonds that were not corporate issuers, notinvestment grade, or did not provide arrangement fee data. This left a sample of 33 bonds.
3 Standard & Poor’s, (22 April, 2008), Refinancing And Liquidity Risks Remain, But Australia’s Rated Corporates Are Set ToClear The Debt Logjam.
4 We have used a notional discount rate of 10 per cent to arrive at a bppa estimate
5 Specifically, the period covered was from April 2008 to April 2013.

Executive Summary
Energy Networks AssociationPwC iii
As well as arrangement fees, bond issuers also bear a range of other fees or costs. Weestimated these other fees by interviewing:
Legal firms – for estimates of issuer and debt arranger legal counsel fees;
Rating agencies – for estimates of initial credit rating fees, annual surveillance feesand up-front bond issue fees; and
Banks – for annual registrar fees.
As in our previous report for Powerlink, we found that after the elimination of outliers, therewas no relationship between the annualised arrangement fee and issuance size, the term tomaturity, or credit rating. This implies that the arrangement fee rises approximately directlyin proportion to term of issuance.6
We estimated debt raising costs based on assuming 1 and 10 notional debt issues (the latterimplying a debt level of $2,500 million). Applying the methodology, the debt raisingtransaction cost estimate for a benchmark firm depends on the value of notional benchmarkdebt that is being raised, as this determines the number of bond issues required.
Direct transaction costs break down into the following categories:
Category 1: Fees incurred for each issue that are proportionate to the size of thetransaction – the same irrespective of the size of the NSP in bppa terms (e.g. thearrangement fee).
Category 2: Fees incurred for each issue that are independent of the size of the issue –increase as issue size is assumed to increase.
– If all NSPs have the same size issues these fees will be the same (in bppa terms)across NSPs.
– If smaller NSPs are constrained (by re-financing risk) to make smaller debtissues, these costs may he higher for smaller NSPs.
Category 3: Costs independent of the value/number of debt issues and are commonacross NSPs – these costs (on a bppa basis) will be higher for the smaller NSP (e.g. thecost of a Master Bond Program).
In comparison with our previous (2011) report for Powerlink, we found the corporate bondraising transaction cost to be higher, at 10.8 basis points (1 bond) to 9.9 basis points (10bonds), which was mainly due to a higher estimated arrangement fee. Our 2011 reportestimated a transaction cost of 9.7 bppa for a single issue, with 7.2 basis points of this beingthe arrangement fee.7 In the present study we found a 10.8 bppa bond issuance cost for asingle issue, of which 8.5 bppa was due to the arrangement fee. Hence, most of the 1.1 bppaincrease is due to the increase in the estimate of the arrangement fees.
6 PwC, (April, 2011), Powerlink debt and equity raising costs, pp.16 and 17.
7 PwC, (April, 2011), p.4
Executive Summary
Energy Networks AssociationPwC iv
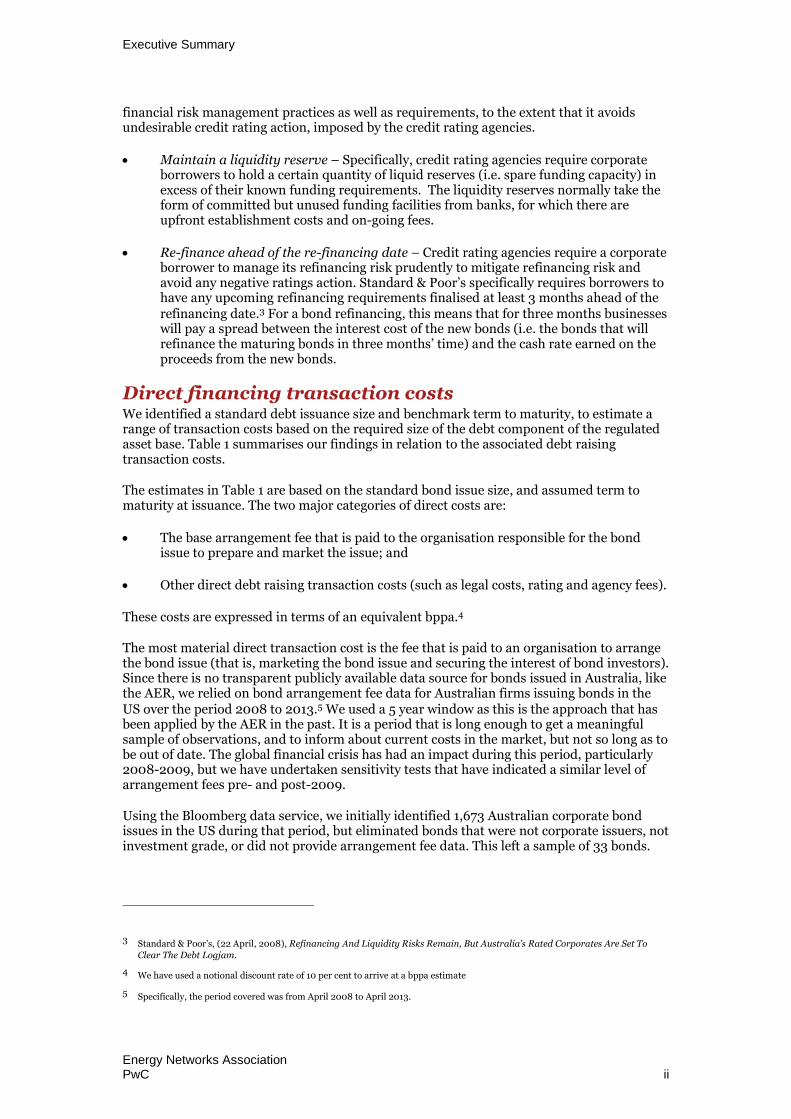
Table 1 Direct costs: standard benchmark debt raising transaction costs
1 issue 10 issues
Amount raised $250m $2,500m
Arrangement fee (bppa) 8.5 8.5
Other costs (bppa) 2.2 1.4
Total cost (bppa) 10.8 9.9
Source: PwC analysis based on Bloomberg, Loan Connector and interviews with banks, credit rating agencies andlegal firms.
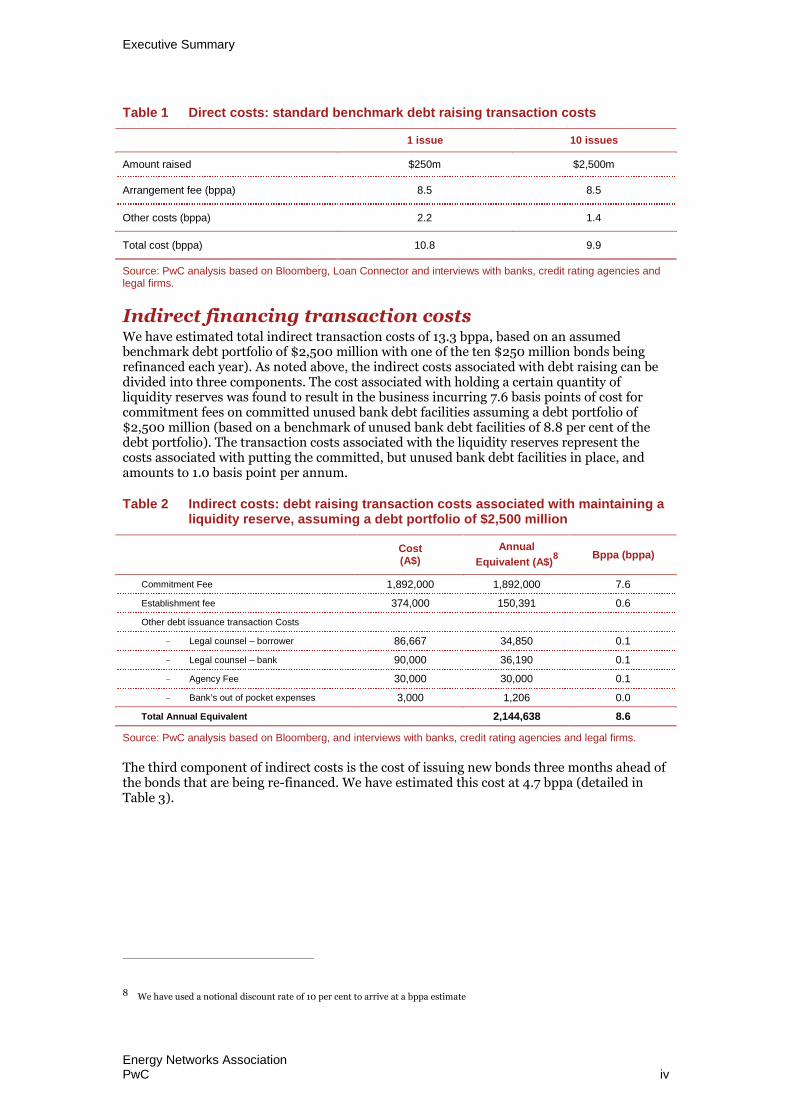
Indirect financing transaction costsWe have estimated total indirect transaction costs of 13.3 bppa, based on an assumedbenchmark debt portfolio of $2,500 million with one of the ten $250 million bonds beingrefinanced each year). As noted above, the indirect costs associated with debt raising can bedivided into three components. The cost associated with holding a certain quantity ofliquidity reserves was found to result in the business incurring 7.6 basis points of cost forcommitment fees on committed unused bank debt facilities assuming a debt portfolio of$2,500 million (based on a benchmark of unused bank debt facilities of 8.8 per cent of thedebt portfolio). The transaction costs associated with the liquidity reserves represent thecosts associated with putting the committed, but unused bank debt facilities in place, andamounts to 1.0 basis point per annum.
Table 2 Indirect costs: debt raising transaction costs associated with maintaining aliquidity reserve, assuming a debt portfolio of $2,500 million
Cost(A$)
Annual
Equivalent (A$)8 Bppa (bppa)
Commitment Fee 1,892,000 1,892,000 7.6
Establishment fee 374,000 150,391 0.6
Other debt issuance transaction Costs
Legal counsel – borrower 86,667 34,850 0.1
Legal counsel – bank 90,000 36,190 0.1
Agency Fee 30,000 30,000 0.1
Bank’s out of pocket expenses 3,000 1,206 0.0
Total Annual Equivalent 2,144,638 8.6
Source: PwC analysis based on Bloomberg, and interviews with banks, credit rating agencies and legal firms.
The third component of indirect costs is the cost of issuing new bonds three months ahead ofthe bonds that are being re-financed. We have estimated this cost at 4.7 bppa (detailed inTable 3).
8 We have used a notional discount rate of 10 per cent to arrive at a bppa estimate
Executive Summary
Energy Networks AssociationPwC v
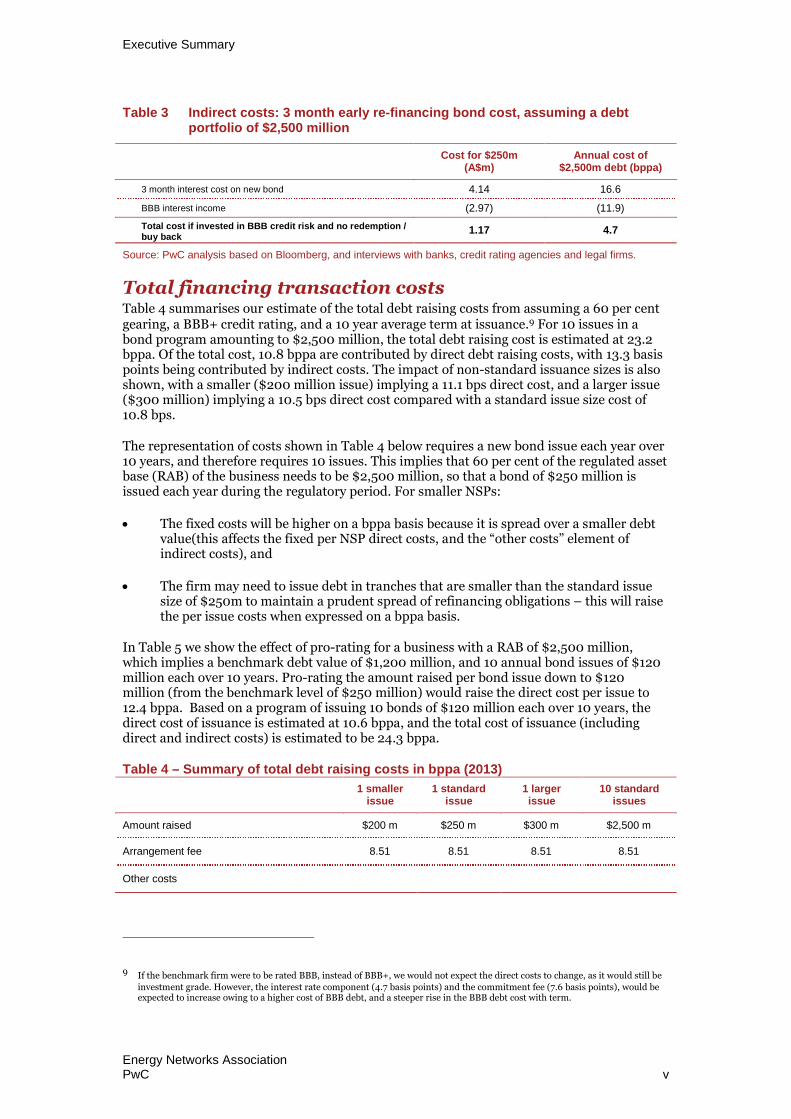
Table 3 Indirect costs: 3 month early re-financing bond cost, assuming a debtportfolio of $2,500 million
Cost for $250m(A$m)
Annual cost of$2,500m debt (bppa)
3 month interest cost on new bond 4.14 16.6
BBB interest income (2.97) (11.9)
Total cost if invested in BBB credit risk and no redemption /buy back
1.17 4.7
Source: PwC analysis based on Bloomberg, and interviews with banks, credit rating agencies and legal firms.
Total financing transaction costsTable 4 summarises our estimate of the total debt raising costs from assuming a 60 per centgearing, a BBB+ credit rating, and a 10 year average term at issuance.9 For 10 issues in abond program amounting to $2,500 million, the total debt raising cost is estimated at 23.2bppa. Of the total cost, 10.8 bppa are contributed by direct debt raising costs, with 13.3 basispoints being contributed by indirect costs. The impact of non-standard issuance sizes is alsoshown, with a smaller ($200 million issue) implying a 11.1 bps direct cost, and a larger issue($300 million) implying a 10.5 bps direct cost compared with a standard issue size cost of10.8 bps.
The representation of costs shown in Table 4 below requires a new bond issue each year over10 years, and therefore requires 10 issues. This implies that 60 per cent of the regulated assetbase (RAB) of the business needs to be $2,500 million, so that a bond of $250 million isissued each year during the regulatory period. For smaller NSPs:
The fixed costs will be higher on a bppa basis because it is spread over a smaller debtvalue(this affects the fixed per NSP direct costs, and the “other costs” element ofindirect costs), and
The firm may need to issue debt in tranches that are smaller than the standard issuesize of $250m to maintain a prudent spread of refinancing obligations – this will raisethe per issue costs when expressed on a bppa basis.
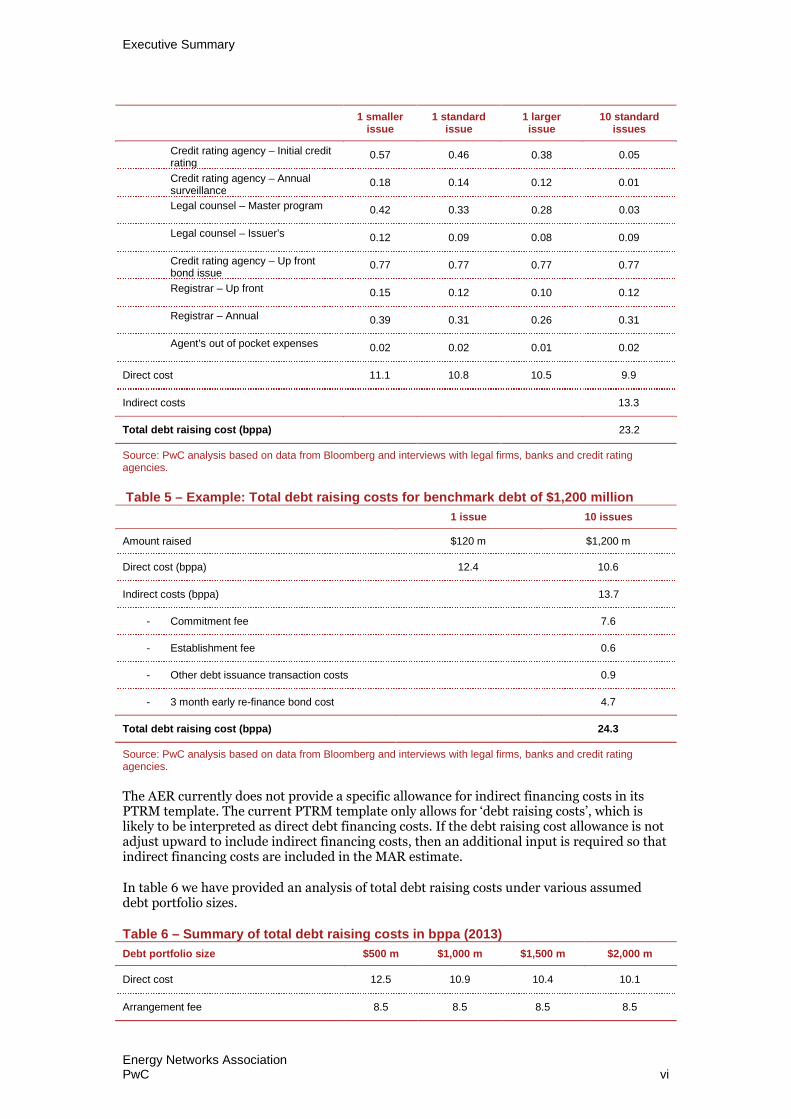
In Table 5 we show the effect of pro-rating for a business with a RAB of $2,500 million,which implies a benchmark debt value of $1,200 million, and 10 annual bond issues of $120million each over 10 years. Pro-rating the amount raised per bond issue down to $120million (from the benchmark level of $250 million) would raise the direct cost per issue to12.4 bppa. Based on a program of issuing 10 bonds of $120 million each over 10 years, thedirect cost of issuance is estimated at 10.6 bppa, and the total cost of issuance (includingdirect and indirect costs) is estimated to be 24.3 bppa.
Table 4 – Summary of total debt raising costs in bppa (2013)
1 smallerissue
1 standardissue
1 largerissue
10 standardissues
Amount raised $200 m $250 m $300 m $2,500 m
Arrangement fee 8.51 8.51 8.51 8.51
Other costs
9 If the benchmark firm were to be rated BBB, instead of BBB+, we would not expect the direct costs to change, as it would still be
investment grade. However, the interest rate component (4.7 basis points) and the commitment fee (7.6 basis points), would beexpected to increase owing to a higher cost of BBB debt, and a steeper rise in the BBB debt cost with term.
Executive Summary
Energy Networks AssociationPwC vi
1 smallerissue
1 standardissue
1 largerissue
10 standardissues
Credit rating agency – Initial creditrating
0.57 0.46 0.38 0.05
Credit rating agency – Annualsurveillance
0.18 0.14 0.12 0.01
Legal counsel – Master program 0.42 0.33 0.28 0.03
Legal counsel – Issuer’s 0.12 0.09 0.08 0.09
Credit rating agency – Up frontbond issue
0.77 0.77 0.77 0.77
Registrar – Up front 0.15 0.12 0.10 0.12
Registrar – Annual 0.39 0.31 0.26 0.31
Agent’s out of pocket expenses 0.02 0.02 0.01 0.02
Direct cost 11.1 10.8 10.5 9.9
Indirect costs 13.3
Total debt raising cost (bppa) 23.2
Source: PwC analysis based on data from Bloomberg and interviews with legal firms, banks and credit ratingagencies.
Table 5 – Example: Total debt raising costs for benchmark debt of $1,200 million
1 issue 10 issues
Amount raised $120 m $1,200 m
Direct cost (bppa) 12.4 10.6
Indirect costs (bppa) 13.7
- Commitment fee 7.6
- Establishment fee 0.6
- Other debt issuance transaction costs 0.9
- 3 month early re-finance bond cost 4.7
Total debt raising cost (bppa) 24.3
Source: PwC analysis based on data from Bloomberg and interviews with legal firms, banks and credit ratingagencies.
The AER currently does not provide a specific allowance for indirect financing costs in itsPTRM template. The current PTRM template only allows for ‘debt raising costs’, which islikely to be interpreted as direct debt financing costs. If the debt raising cost allowance is notadjust upward to include indirect financing costs, then an additional input is required so thatindirect financing costs are included in the MAR estimate.
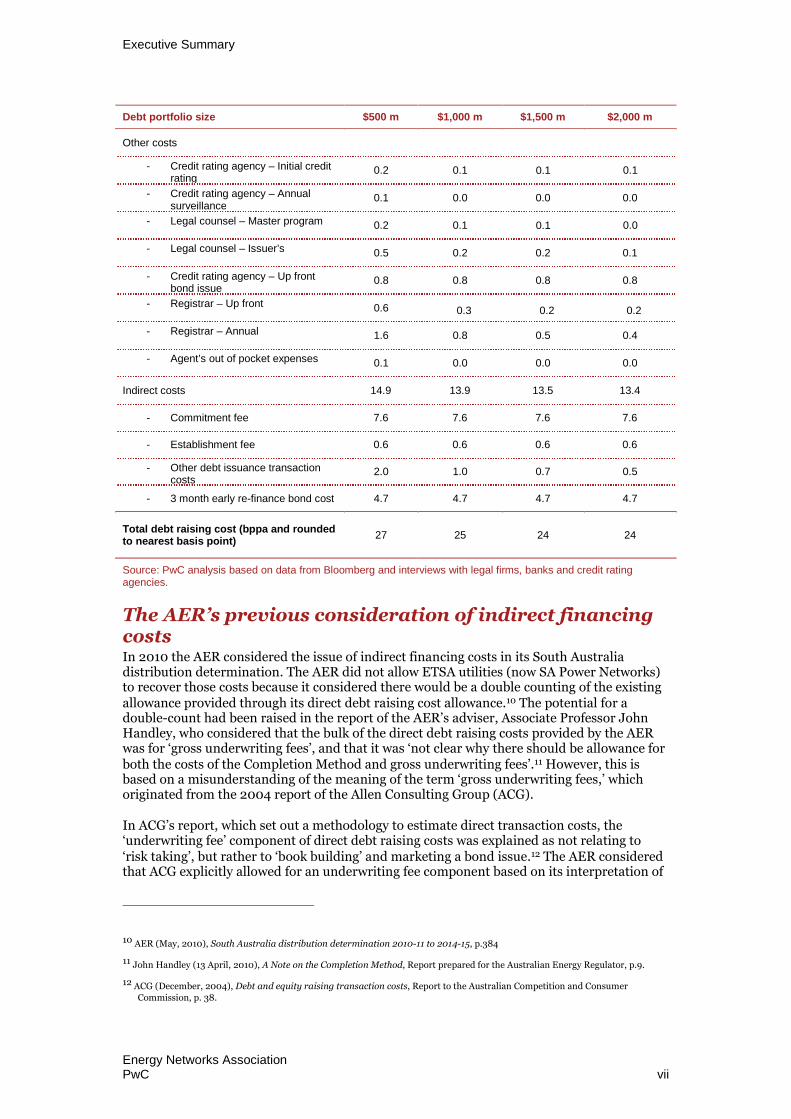
In table 6 we have provided an analysis of total debt raising costs under various assumeddebt portfolio sizes.
Table 6 – Summary of total debt raising costs in bppa (2013)
Debt portfolio size $500 m $1,000 m $1,500 m $2,000 m
Direct cost 12.5 10.9 10.4 10.1
Arrangement fee 8.5 8.5 8.5 8.5
Executive Summary
Energy Networks AssociationPwC vii
Debt portfolio size $500 m $1,000 m $1,500 m $2,000 m
Other costs
- Credit rating agency – Initial creditrating
0.2 0.1 0.1 0.1
- Credit rating agency – Annualsurveillance
0.1 0.0 0.0 0.0
- Legal counsel – Master program 0.2 0.1 0.1 0.0
- Legal counsel – Issuer’s 0.5 0.2 0.2 0.1
- Credit rating agency – Up frontbond issue
0.8 0.8 0.8 0.8
- Registrar – Up front 0.6 0.3 0.2 0.2
- Registrar – Annual 1.6 0.8 0.5 0.4
- Agent’s out of pocket expenses 0.1 0.0 0.0 0.0
Indirect costs 14.9 13.9 13.5 13.4
- Commitment fee 7.6 7.6 7.6 7.6
- Establishment fee 0.6 0.6 0.6 0.6
- Other debt issuance transactioncosts
2.0 1.0 0.7 0.5
- 3 month early re-finance bond cost 4.7 4.7 4.7 4.7
Total debt raising cost (bppa and roundedto nearest basis point)
27 25 24 24
Source: PwC analysis based on data from Bloomberg and interviews with legal firms, banks and credit ratingagencies.
The AER’s previous consideration of indirect financingcostsIn 2010 the AER considered the issue of indirect financing costs in its South Australiadistribution determination. The AER did not allow ETSA utilities (now SA Power Networks)to recover those costs because it considered there would be a double counting of the existingallowance provided through its direct debt raising cost allowance.10 The potential for adouble-count had been raised in the report of the AER’s adviser, Associate Professor JohnHandley, who considered that the bulk of the direct debt raising costs provided by the AERwas for ‘gross underwriting fees’, and that it was ‘not clear why there should be allowance forboth the costs of the Completion Method and gross underwriting fees’.11 However, this isbased on a misunderstanding of the meaning of the term ‘gross underwriting fees,’ whichoriginated from the 2004 report of the Allen Consulting Group (ACG).
In ACG’s report, which set out a methodology to estimate direct transaction costs, the‘underwriting fee’ component of direct debt raising costs was explained as not relating to‘risk taking’, but rather to ‘book building’ and marketing a bond issue.12 The AER consideredthat ACG explicitly allowed for an underwriting fee component based on its interpretation of
10 AER (May, 2010), South Australia distribution determination 2010-11 to 2014-15, p.384
11 John Handley (13 April, 2010), A Note on the Completion Method, Report prepared for the Australian Energy Regulator, p.9.
12 ACG (December, 2004), Debt and equity raising transaction costs, Report to the Australian Competition and ConsumerCommission, p. 38.

Executive Summary
Energy Networks AssociationPwC viii
ACG’s description of the component of debt raising cost termed ‘gross underwriting fees’ andto allow a further underwriting element would involve a double-count.13
However, a careful reading of the ACG report shows that the term ‘gross underwriting’ wasnot meant to represent the traditional ‘risk taking’ view of underwriting, but instead referredto the ‘book building’ process and preparation and marketing of the issue by the debtarranger. The reason that the ACG paper used the term ‘gross underwriting fee’ is simplythat this was (and continues to be) the terminology used by the Bloomberg service torepresent those bond book building and marketing costs charged by investment banks.
Hence, on a correct interpretation of the term ‘Gross underwriting fees’, it becomes apparentthat the AER erroneously concluded that the direct debt raising cost allowance estimatedusing ACG’s methodology compensates for refinancing plan costs. The indirect costsassociated with early refinancing and the direct costs of debt financing are separate costs thatdo not overlap.14
13 AER (May 2010), p.383.
14 The author of the ACG (2004) report is also the author of this report, therefore there is no presumption being made on this issue.
Contents
1 Executive Summary i
2 Scope of report 1
3 Analytical framework 3
4 Direct debt raising transaction costs 14
5 Indirect debt raising transaction costs 20
6 Conclusion: total debt raising transaction costs 25
Appendix A Terms of reference 28
Appendix B CVs 30
2 Scope of report
2.1 ScopeThe Energy Networks Association (ENA) engaged PricewaterhouseCoopers to quantify thetotal debt financing costs for a benchmark efficient network service provider (NSP), wheredebt financing is defined to include the raising of new debt and the refinancing of existingmaturing debt. The ENA requested us to estimate the following costs:
Direct transaction costs associated with a debt financing including but not limitedto, costs such as upfront establishment fees paid to financiers and/or to arrangingparties, legal fees, road-show costs, the credit rating fee applied directly to thefinancing transaction, trustee fees, registrar fees; and
Indirect transaction costs associated with a debt financing including but not limitedto, early financing costs, early redemption costs, and commitment fees associatedwith the maintenance liquidity reserves.
We were requested to provide the estimates of direct and indirect transaction costs assumingthe financing is undertaken by an efficient NSP maintaining gearing (debt to RAB) at 60 percent, and a credit rating of BBB+ (the current AER benchmark).
2.1.1 Indirect Transaction CostsThe ENA noted that indirect transaction costs may be defined as costs that an NSP incurs tomaintain a BBB+ credit rating that therefore support an efficient interest cost and efficientdirect costs incurred by an NSP in relation to its financing.
In considering the indirect transaction costs incurred by a NSP, the ENA requested us toconsider the policies of the rating agencies, in particular the liquidity risk management andrefinancing risk management policies. NSPs are required to adhere to such policies tomaintain the BBB+ rating that supports all their debt financing activity. For example, inmore recent years, Standard & Poor’s has adopted a liquidity risk score that requires acertain level of available financing to be held by a NSP. The cost of this financial support,liquidity support, is an indirect cost to the NSP.
NSPs also have risk policies that enable them to maintain a BBB+ credit rating by ensuringcommitted financing is available well in advance of any maturing debt. The ENA requestedus to capture such costs within the pool of indirect transaction costs.
2.1.2 Annualised CostsOnce we have determined all direct and indirect financing transaction costs, the ENArequested us to estimate an annualised total debt financing cost for an efficient NSP,assuming that the NSP raises 10 year financing and that 1/10th of the financing is refinancedeach year - i.e. a rolling 10 year approach to financing the NSP debt. We were also requestedto indicate whether there are any further considerations that ought to be taken into accountwhen determining the benchmark efficient debt financing cost; for example the size of thenetwork service provider.
Note that the precise terms of reference can be found in Appendix A.
2.2 Outline of reportThe remainder of this report is structured as follows:
In Chapter 3, we describe the analytical framework, which establishes the regulatorybenchmark financing framework, and discusses some of the key characteristics ofbenchmark financing behaviour for which assumptions are required to estimate directdebt raising costs (i.e. the standard bond issuance size), and indirect debt raising costs(e.g. the benchmark unused committed funding facilities of NSPs).

Scope of report
Energy Networks AssociationPwC 2
Chapter 4 provides estimates of the two key components of direct debt raising costs,namely the arrangement fees, which are estimated based on Bloomberg data forAustralian bond issues in the US, and the ‘other’ costs, which we have estimated basedon interviews with market participants including credit rating agencies, law firms andbanks.
Chapter 5 provides estimates of the two major sources of indirect costs incurred byNSPs, which are the costs associated with maintaining a liquidity reserve (i.e. unusedcommitted funding facilities), and the Standard & Poor’s-imposed requirement to havefinalised arrangements for re-financing in place at least three month prior to thematurity of the maturing debt.
In Chapter 6 we sum the estimated direct and indirect costs for an NSP to provide anestimate of the total debt financing costs, and show how this estimate varies with theassumed size of businesses and the assumed size of each debt issue.

Analytical framework
Energy Networks AssociationPwC 3
3 Analytical framework
3.1 IntroductionIn this chapter, we set out the analytical framework as the basis for the analysis in laterchapters. We discuss the nature of the regulatory framework, which establishes targetbenchmarks, and issues relating to the estimation of direct and indirect transaction costsassociated with debt raising.
We begin by discussing the characteristics of the benchmark entity that should be applied inestimating a debt risk premium, debt raising transaction costs, and the benchmark term ofdebt. Next, we outline the analytical framework that we will apply to analyse direct andindirect debt raising transaction costs.
3.2 Benchmark financing frameworkA central feature of the standard approach to economic regulation in Australia is that theestimate of the regulatory WACC and related matters is based upon benchmarks. Bybenchmarks we mean that a notional value is used for a relevant input, with this valueattempting to mimic the decisions that would be made, or the costs that would be incurred,by a prudent and efficient entity in the circumstances of the regulated businesses, rather thanreflecting the regulated business’s actual decisions or costs.
For the purpose of this report, we have been asked to assume that the notional regulatedentity has gearing of 60 per cent (debt-to-assets), and financed in an efficient manner,reflecting standard industry practice. We have been further requested to assume that thebenchmark credit rating is BBB+, the term of debt at issuance is 10 years, and that 1/10th ofthe debt is re-financed each year.
3.3 Direct debt raising transaction costsOur objective is to estimate the transaction cost in basis points per annum (bppa) terms for aparticular NSP. For convenience, and to simplify the task for the regulator, we assume thatall debt is issued through Australian corporate bonds. We also make the auxiliaryassumption that the cost of all sources of debt (inclusive of transaction costs) for the sameterm move approximately together.
There are three different categories of direct transaction costs, which break down into:
Category 1: Fees incurred for each issue that are proportionate to the size of thetransaction (foreshadow the results in chapter 4). On a bppa basis, these will be thesame irrespective of the size of the NSP.
Category 2: Fees incurred for each issue that are independent of the size of the issue.These fees will be larger as issue size is assumed to increase. If all NSPs issue debt inissues that are of the same size, then these fees will be the same (in bppa terms) acrossNSPs. However, if smaller NSPs are constrained (as a result of managing prudentlytheir future refinancing obligations) to issue debt in smaller issues, then these costsmay he higher for smaller NSPs.
Category 3: Costs that are independent of the value of number of debt issues andcommon across NSPs – these costs (on a bppa basis) will be higher for the smallerNSP.
Hence, we first establish these costs for a large NSP and then show how size affects this. Itfollows that the assumed size of each debt issue (that is, where prudent refinancing does not
Analytical framework
Energy Networks AssociationPwC 4
constrain this) is a matter over which a further benchmark assumption is required, and sothis is discussed next.
3.3.1 The benchmark size of debt issuanceThe standard issuance size is the average amount of debt issued per debt tranche for abenchmark NSP. Debt is usually issued as a portfolio of tranches, of which a single tranchemay comprise a package of multiple tranches separated by characteristics such as maturityand risk. For example, a business may issue a $2 billion debt portfolio, separated by 10 $200million issues of corporate bonds. We consider that the observed behaviour of Australianregulated networks is most relevant for ascertaining this. Hence, the Bloomberg service wasaccessed to compile a list of Australian infrastructure businesses, which produced a list of 12businesses.15 This list was filtered to remove non-network infrastructure businesses (toproduce a more comparable sample), producing a final list of 6 network infrastructurebusinesses:
APA Group;
DUET;
Jemena;
Envestra;
Spark Infrastructure; and
SP Ausnet.
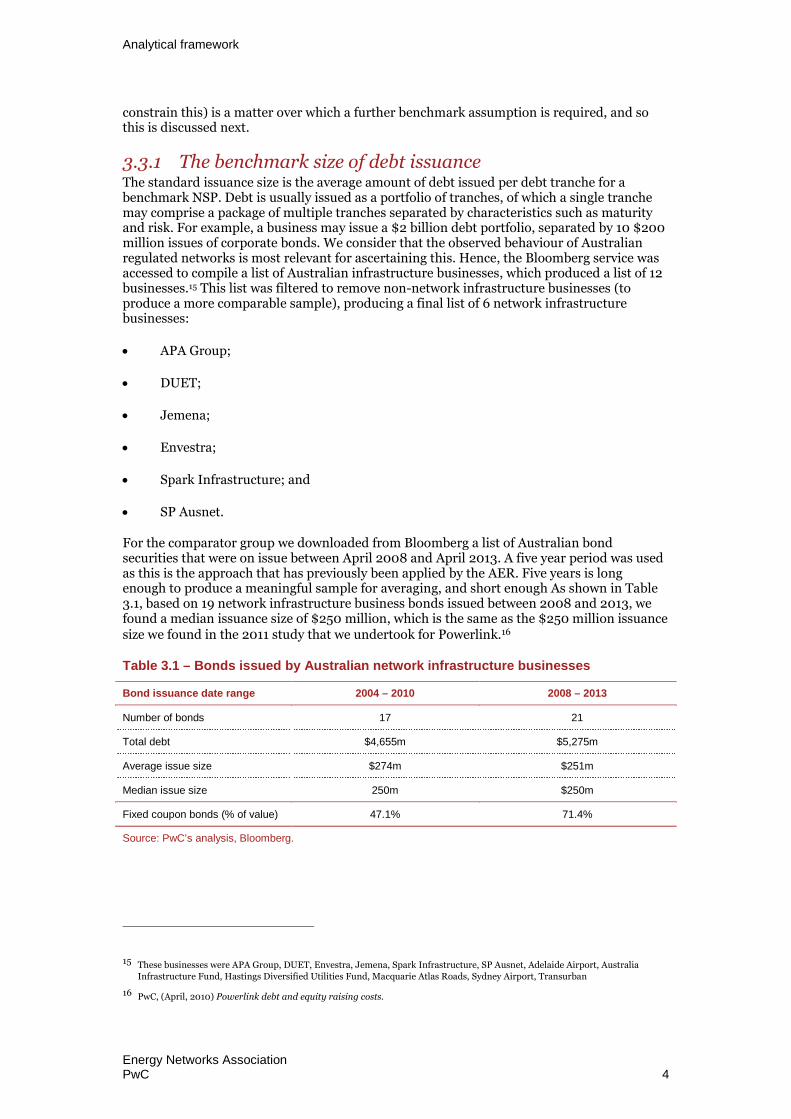
For the comparator group we downloaded from Bloomberg a list of Australian bondsecurities that were on issue between April 2008 and April 2013. A five year period was usedas this is the approach that has previously been applied by the AER. Five years is longenough to produce a meaningful sample for averaging, and short enough As shown in Table3.1, based on 19 network infrastructure business bonds issued between 2008 and 2013, wefound a median issuance size of $250 million, which is the same as the $250 million issuancesize we found in the 2011 study that we undertook for Powerlink.16
Table 3.1 – Bonds issued by Australian network infrastructure businesses
Bond issuance date range 2004 – 2010 2008 – 2013
Number of bonds 17 21
Total debt $4,655m $5,275m
Average issue size $274m $251m
Median issue size 250m $250m
Fixed coupon bonds (% of value) 47.1% 71.4%
Source: PwC’s analysis, Bloomberg.
15 These businesses were APA Group, DUET, Envestra, Jemena, Spark Infrastructure, SP Ausnet, Adelaide Airport, AustraliaInfrastructure Fund, Hastings Diversified Utilities Fund, Macquarie Atlas Roads, Sydney Airport, Transurban
16 PwC, (April, 2010) Powerlink debt and equity raising costs.
Analytical framework
Energy Networks AssociationPwC 5
3.4 Indirect debt raising transaction costsUnder the new rules (clauses 6.5.2 and 6A.6.2 of the National Electricity Rules and Rule 87of the National Gas Rules), the first factor that regard must be paid to when estimating thereturn on debt is ‘the desirability of minimising any difference between the return on debtand the return on debt of a benchmark efficient entity referred to in the allowed rate ofreturn objective.’ Indirect transaction costs are the borne directly by businesses (rather thanpaid in fees to third parties, as is the case for direct costs), which arise as a result of therequirements of credit rating agencies to the extent that it avoids undesirable credit ratingaction. These costs must therefore be recovered under the new National Electricity Rules.
As the benchmark business is assumed to have an investment grade credit rating (e.g.BBB+), it must fulfil the liquidity conditions imposed on it by the credit rating agencies inorder to maintain that credit rating. Hence, the additional financing costs that are incurredby the benchmark firm to maintain liquidity mandated by the credit rating agencies areconsistent with its benchmark credit rating and benchmark gearing levels.
There are two sources of indirect financing costs that require compensation:
1) Requirement to maintain a liquidity reserve
The credit rating agencies (such as Standard & Poor’s and Moody’s) require regulatednetwork infrastructure businesses to hold liquidity reserves in excess of their known fundingrequirements. In order to maintain an investment grade credit rating (i.e. BBB- or above), acorporate is required to maintain liquidity reserves.17 These are usually in the form of unusedbank facilities. There is a cost associated with unused bank facilities (normally representing50 per cent of the bank debt margin, as well as transaction costs to raise the debt).
2) Requirement to re-finance bonds three months ahead of the re-financing date
Standard & Poor’s requires corporate borrowers to address refinancing amounts threemonths ahead of the re-financing date in order to provide greater certainty that the re-financing can be achieved. For an NSP, this means that for three months each year, thebusinesses will need to incur a spread between the interest cost of the bonds and the cashrate earned on the proceeds on the re-financed component of the total debt on issue (i.e. onetenth of the debt on issue, assuming that one tenth of the 10 year term debt is re-financedeach year).
We now consider each of these in turn.
3.4.1 Requirement to maintain corporate liquidityAs indicated above, businesses require liquidity for reasons best summarised by Standard &Poor’s (‘S&P’) in its publication titled, 2008 Corporate Ratings Criteria: AnalyticalMethodology. Requirements for liquidity include, but are not limited to:
Funding unforseen events;
To assist with refinancing, scheduled debt repayments and repayment of theirfinancial obligations; and
Payment of other significant financial obligations (such as, lease obligations,contingent obligations, employee payments/entitlements and tax payments).
17 Then quantitative requirements by S&P is consistent throughout investment grade rating bands.
Analytical framework
Energy Networks AssociationPwC 6
As stated by S&P, the best source of liquidity is surplus cash, together with near cash held onthe balance sheet. This includes, cash and cash equivalents; unused committed bank debt;short and long term bank debt, debt capital market issuances; and equity. The most costefficient manner in which rated corporate entities maintain their minimum liquidity reservesis in the form of unused committed bank facilities.
The rating agencies’ approach to measuring liquidity
Standard & Poor’s
Rating agencies have increasingly focussed on liquidity management when assessing theoverall credit rating of a business. The S&P report titled, Methodology and Assumptions:Liquidity Descriptors for Global Corporate Issuers, dated 28 September 2011, provides aprescriptive outline on how S&P assigns liquidity ratings for corporate issuers. Analysis ofliquidity is undertaken on both a qualitative and quantitative basis.
The qualitative analysis addresses such factors as “the ability to absorb high-impact, low-probability events, the nature of bank relationships, the level of standing in credit markets,and the degree of prudence of the company’s financial risk management”. Liquidityrequirements will vary depending on the business activity and the industry in which thecorporate is involved.
For its quantitative analysis, S&P undertakes ratio analysis, whilst sensitising forecastearnings to ensure that a business has sufficient liquidity to withstand unforseen downwardshocks. The two ratios that S&P focuses on when undertaking this analysis are:
1. A/B: Liquidity sources (A) divided by uses (B); and
2. A-B: Liquidity sources (A) minus uses (B).
Liquidity descriptors
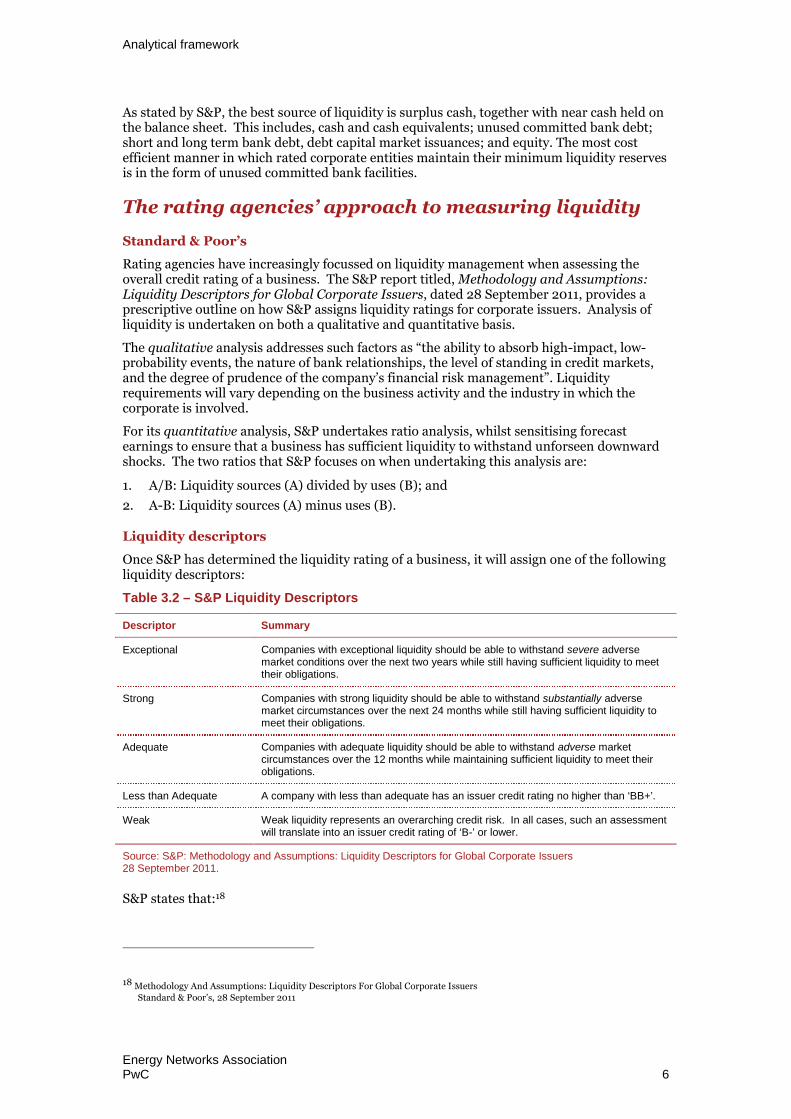
Once S&P has determined the liquidity rating of a business, it will assign one of the followingliquidity descriptors:
Table 3.2 – S&P Liquidity Descriptors
Descriptor Summary
Exceptional Companies with exceptional liquidity should be able to withstand severe adversemarket conditions over the next two years while still having sufficient liquidity to meettheir obligations.
Strong Companies with strong liquidity should be able to withstand substantially adversemarket circumstances over the next 24 months while still having sufficient liquidity tomeet their obligations.
Adequate Companies with adequate liquidity should be able to withstand adverse marketcircumstances over the 12 months while maintaining sufficient liquidity to meet theirobligations.
Less than Adequate A company with less than adequate has an issuer credit rating no higher than ‘BB+’.
Weak Weak liquidity represents an overarching credit risk. In all cases, such an assessmentwill translate into an issuer credit rating of ‘B-’ or lower.
Source: S&P: Methodology and Assumptions: Liquidity Descriptors for Global Corporate Issuers28 September 2011.
S&P states that:18
18 Methodology And Assumptions: Liquidity Descriptors For Global Corporate IssuersStandard & Poor’s, 28 September 2011
Analytical framework
Energy Networks AssociationPwC 7
“For a company to receive a rating of ‘BBB-’ or higher, its liquidity must be scored adequate or stronger.”
We note that all of the below Australian regulated utilities have a liquidity descriptor of“adequate” (see Table 3.4 below).
In addition to other requirements to achieve an “Adequate” liquidity descriptor companiesshould meet the following criteria:
A/B of 1.2x or more. In particular, any upcoming maturities should be manageable.
Positive A-B, even if forecasted EBITDA declines by 15%.
S&P19 states that if the A/B and A-B do not meet the requisite levels, using a six-month timehorizon, but a company meets all other characteristics outlined by S&P, it may still receive aliquidity score of “Adequate”.
Moody’s publication, titled: Moody’s Approach to Assessing the Adequacy of “Liquidity RiskInsurance” (January 2000) describes Moody’s approach to assessing the adequacy of acorporate issuer’s alternative liquidity provisions.
Like S&P, Moody’s analysis is both qualitative and quantitative. Moody’s analysis involves acritical evaluation of the business’ sources and uses of cash. This is tested under a range ofreasonable stress scenarios to assess the ability for the corporate to meet both its operatingneeds and debt obligations.
Unused committed bank debtMaintaining a quantum of committed funding limits in excess of actual utilisation is acommon practice by large corporates, including regulated utilities, for adhering to theirliquidity policies and managing their liquidity risk.
To quantify the amount of liquidity of an efficient NSP, we have looked at the level ofcommitted unused funding limits of a number of non-Government owned, regulated utilitiesin Australia. We have adopted the same benchmark regulated utilities under section 3.3.1.However as DUET and Spark Infrastructure are investment vehicles, we have reviewed theirassets, rather than the fund as a whole. The sample we have used is listed in Table 3.3.
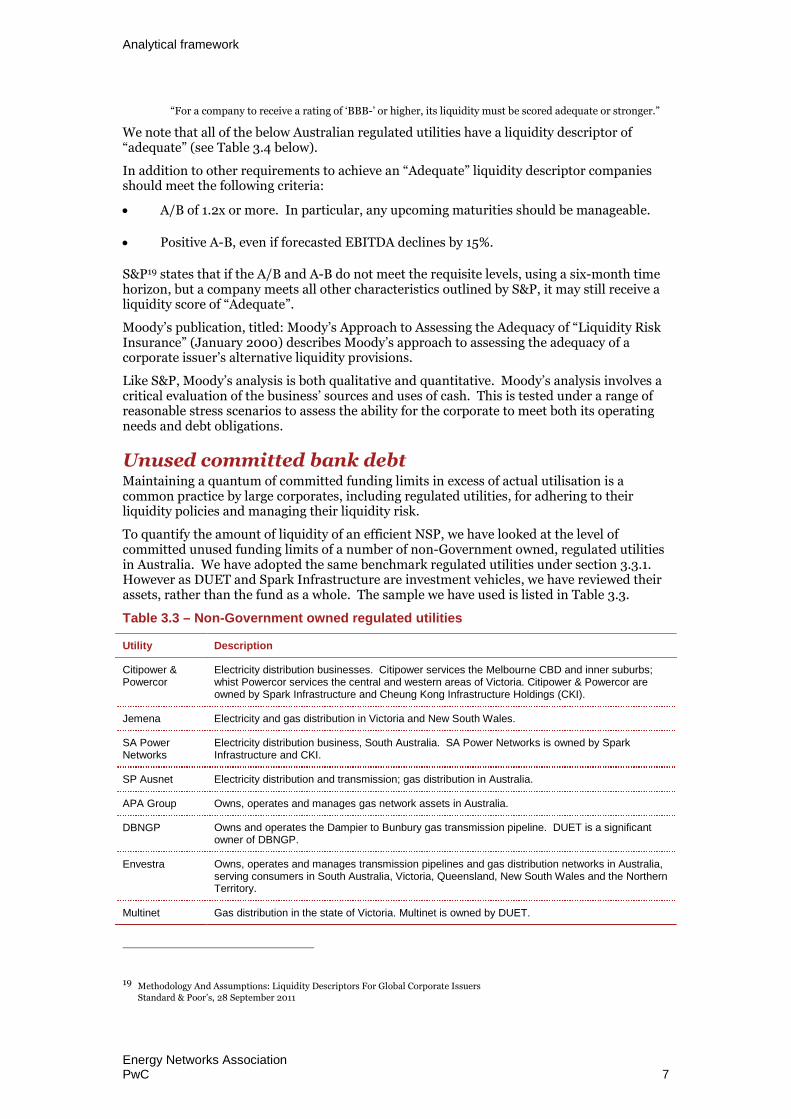
Table 3.3 – Non-Government owned regulated utilities
Utility Description
Citipower &Powercor
Electricity distribution businesses. Citipower services the Melbourne CBD and inner suburbs;whist Powercor services the central and western areas of Victoria. Citipower & Powercor areowned by Spark Infrastructure and Cheung Kong Infrastructure Holdings (CKI).
Jemena Electricity and gas distribution in Victoria and New South Wales.
SA PowerNetworks
Electricity distribution business, South Australia. SA Power Networks is owned by SparkInfrastructure and CKI.
SP Ausnet Electricity distribution and transmission; gas distribution in Australia.
APA Group Owns, operates and manages gas network assets in Australia.
DBNGP Owns and operates the Dampier to Bunbury gas transmission pipeline. DUET is a significantowner of DBNGP.
Envestra Owns, operates and manages transmission pipelines and gas distribution networks in Australia,serving consumers in South Australia, Victoria, Queensland, New South Wales and the NorthernTerritory.
Multinet Gas distribution in the state of Victoria. Multinet is owned by DUET.
19 Methodology And Assumptions: Liquidity Descriptors For Global Corporate IssuersStandard & Poor’s, 28 September 2011
Analytical framework
Energy Networks AssociationPwC 8
Utility Description
UED Distributes electricity to customers in east and south east Melbourne and the MorningtonPeninsula in Victoria. UED is owned by Jemena and DUET.
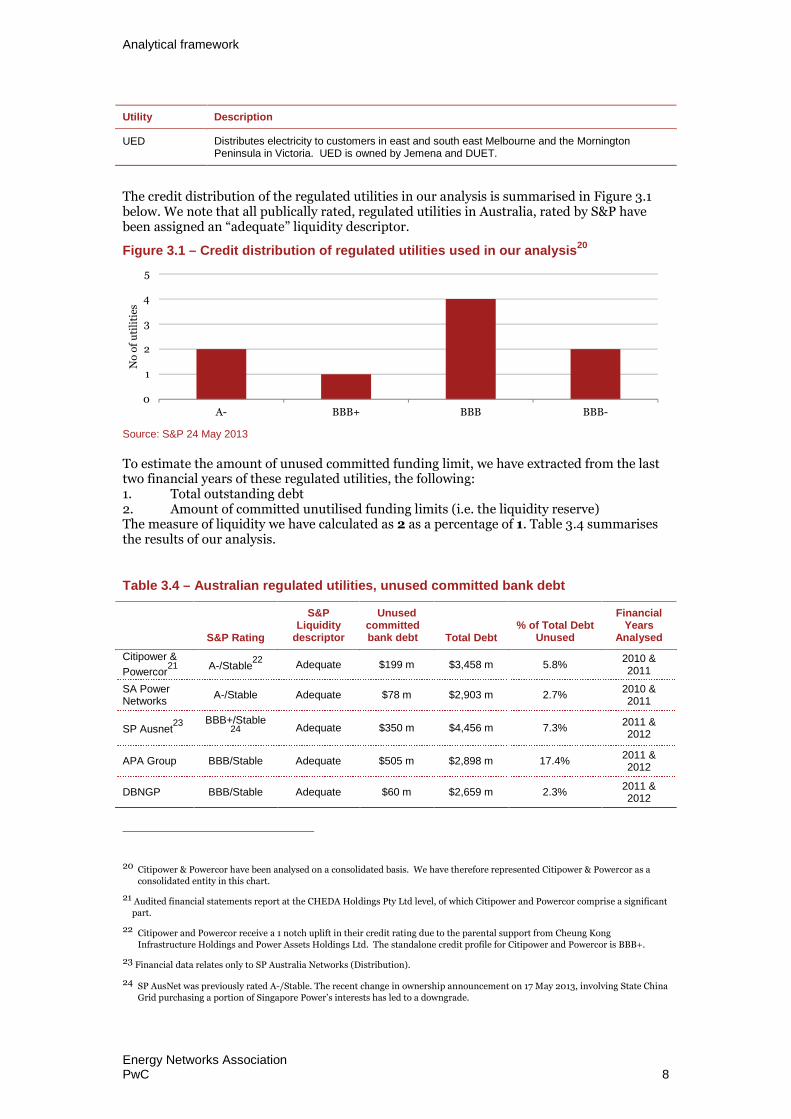
The credit distribution of the regulated utilities in our analysis is summarised in Figure 3.1below. We note that all publically rated, regulated utilities in Australia, rated by S&P havebeen assigned an “adequate” liquidity descriptor.
Figure 3.1 – Credit distribution of regulated utilities used in our analysis20
Source: S&P 24 May 2013
To estimate the amount of unused committed funding limit, we have extracted from the lasttwo financial years of these regulated utilities, the following:1. Total outstanding debt2. Amount of committed unutilised funding limits (i.e. the liquidity reserve)The measure of liquidity we have calculated as 2 as a percentage of 1. Table 3.4 summarisesthe results of our analysis.
Table 3.4 – Australian regulated utilities, unused committed bank debt
S&P Rating
S&PLiquidity
descriptor
Unusedcommittedbank debt Total Debt
% of Total DebtUnused
FinancialYears
Analysed
Citipower &
Powercor21 A-/Stable
22Adequate $199 m $3,458 m 5.8%
2010 &2011
SA PowerNetworks
A-/Stable Adequate $78 m $2,903 m 2.7%2010 &2011
SP Ausnet23 BBB+/Stable
24 Adequate $350 m $4,456 m 7.3%2011 &2012
APA Group BBB/Stable Adequate $505 m $2,898 m 17.4%2011 &2012
DBNGP BBB/Stable Adequate $60 m $2,659 m 2.3%2011 &2012
20 Citipower & Powercor have been analysed on a consolidated basis. We have therefore represented Citipower & Powercor as aconsolidated entity in this chart.
21 Audited financial statements report at the CHEDA Holdings Pty Ltd level, of which Citipower and Powercor comprise a significantpart.
22 Citipower and Powercor receive a 1 notch uplift in their credit rating due to the parental support from Cheung KongInfrastructure Holdings and Power Assets Holdings Ltd. The standalone credit profile for Citipower and Powercor is BBB+.
23 Financial data relates only to SP Australia Networks (Distribution).
24 SP AusNet was previously rated A-/Stable. The recent change in ownership announcement on 17 May 2013, involving State ChinaGrid purchasing a portion of Singapore Power’s interests has led to a downgrade.
0
1
2
3
4
5
A- BBB+ BBB BBB-
No
of
uti
liti
es
Analytical framework
Energy Networks AssociationPwC 9
S&P Rating
S&PLiquidity
descriptor
Unusedcommittedbank debt Total Debt
% of Total DebtUnused
FinancialYears
Analysed
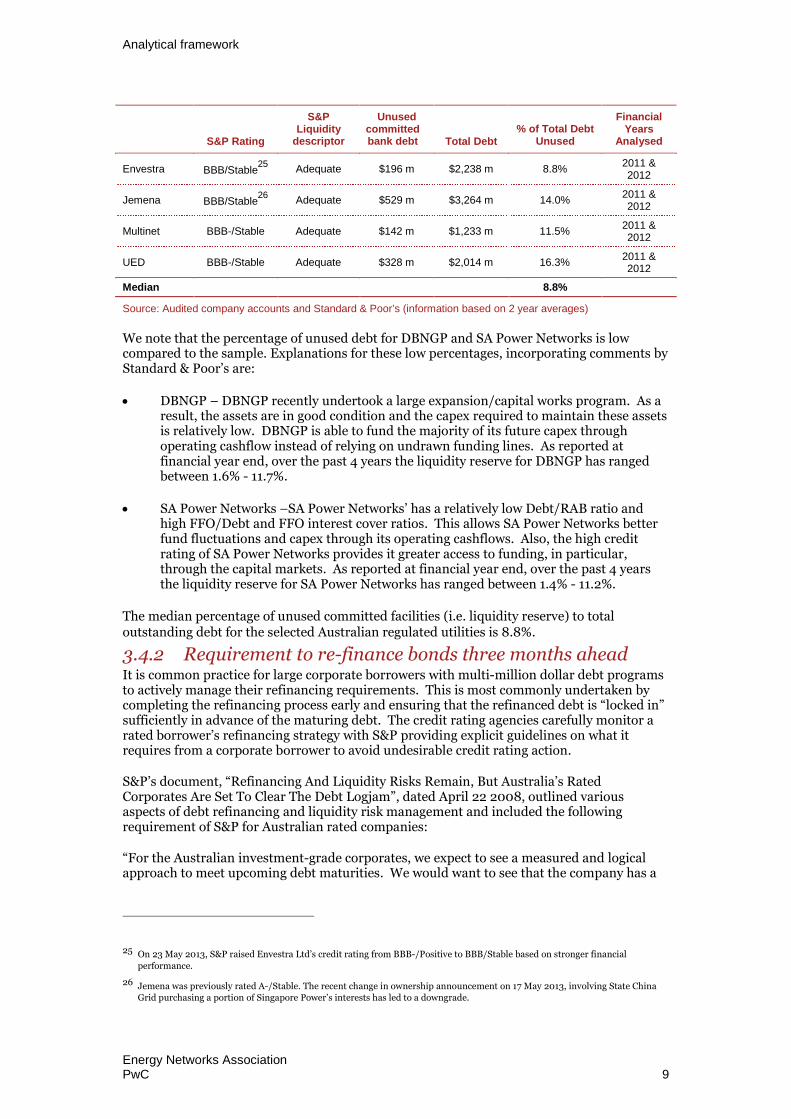
Envestra BBB/Stable25
Adequate $196 m $2,238 m 8.8%2011 &2012
Jemena BBB/Stable26
Adequate $529 m $3,264 m 14.0%2011 &2012
Multinet BBB-/Stable Adequate $142 m $1,233 m 11.5%2011 &2012
UED BBB-/Stable Adequate $328 m $2,014 m 16.3%2011 &2012
Median 8.8%
Source: Audited company accounts and Standard & Poor’s (information based on 2 year averages)
We note that the percentage of unused debt for DBNGP and SA Power Networks is lowcompared to the sample. Explanations for these low percentages, incorporating comments byStandard & Poor’s are:
DBNGP – DBNGP recently undertook a large expansion/capital works program. As aresult, the assets are in good condition and the capex required to maintain these assetsis relatively low. DBNGP is able to fund the majority of its future capex throughoperating cashflow instead of relying on undrawn funding lines. As reported atfinancial year end, over the past 4 years the liquidity reserve for DBNGP has rangedbetween 1.6% - 11.7%.
SA Power Networks –SA Power Networks’ has a relatively low Debt/RAB ratio andhigh FFO/Debt and FFO interest cover ratios. This allows SA Power Networks betterfund fluctuations and capex through its operating cashflows. Also, the high creditrating of SA Power Networks provides it greater access to funding, in particular,through the capital markets. As reported at financial year end, over the past 4 yearsthe liquidity reserve for SA Power Networks has ranged between 1.4% - 11.2%.
The median percentage of unused committed facilities (i.e. liquidity reserve) to totaloutstanding debt for the selected Australian regulated utilities is 8.8%.
3.4.2 Requirement to re-finance bonds three months aheadIt is common practice for large corporate borrowers with multi-million dollar debt programsto actively manage their refinancing requirements. This is most commonly undertaken bycompleting the refinancing process early and ensuring that the refinanced debt is “locked in”sufficiently in advance of the maturing debt. The credit rating agencies carefully monitor arated borrower’s refinancing strategy with S&P providing explicit guidelines on what itrequires from a corporate borrower to avoid undesirable credit rating action.
S&P’s document, “Refinancing And Liquidity Risks Remain, But Australia’s RatedCorporates Are Set To Clear The Debt Logjam”, dated April 22 2008, outlined variousaspects of debt refinancing and liquidity risk management and included the followingrequirement of S&P for Australian rated companies:
“For the Australian investment-grade corporates, we expect to see a measured and logicalapproach to meet upcoming debt maturities. We would want to see that the company has a
25 On 23 May 2013, S&P raised Envestra Ltd’s credit rating from BBB-/Positive to BBB/Stable based on stronger financial
performance.
26 Jemena was previously rated A-/Stable. The recent change in ownership announcement on 17 May 2013, involving State ChinaGrid purchasing a portion of Singapore Power’s interests has led to a downgrade.
Analytical framework
Energy Networks AssociationPwC 10
credible strategy for repaying or refinancing debt maturing up to 18 months ahead. Asmaturities move into the forward 12-month time horizon, we will start placing more weightwithin the short-term rating analysis on the materiality of upcoming maturities and thecompany’s refinancing strategy and execution ability. To avoid negative ratingconsequences, the ideal progression would be:
12-to-18 months ahead of maturity, the company would have a detailed and crediblerefinancing plan (including a contingency plan);
No less than six months ahead of the maturity, the company would havedocumentation substantially in place for the replacement debt issue/s; and
No less than three months ahead of maturity, the refinancing would be essentiallycompleted, committed, or underwritten.”
As such, we have assumed that for an NSP with a debt portfolio comprising 10 year bondissuances, the NSP would need to issue a new bond 3 months in advance of the maturingbonds in order to satisfy the S&P requirement.
Table 3.5 below outlines the costs associated with satisfying Standard & Poor’s refinancingrequirement for an efficient NSP for a borrower refinancing maturing bonds through theissue of new bonds.
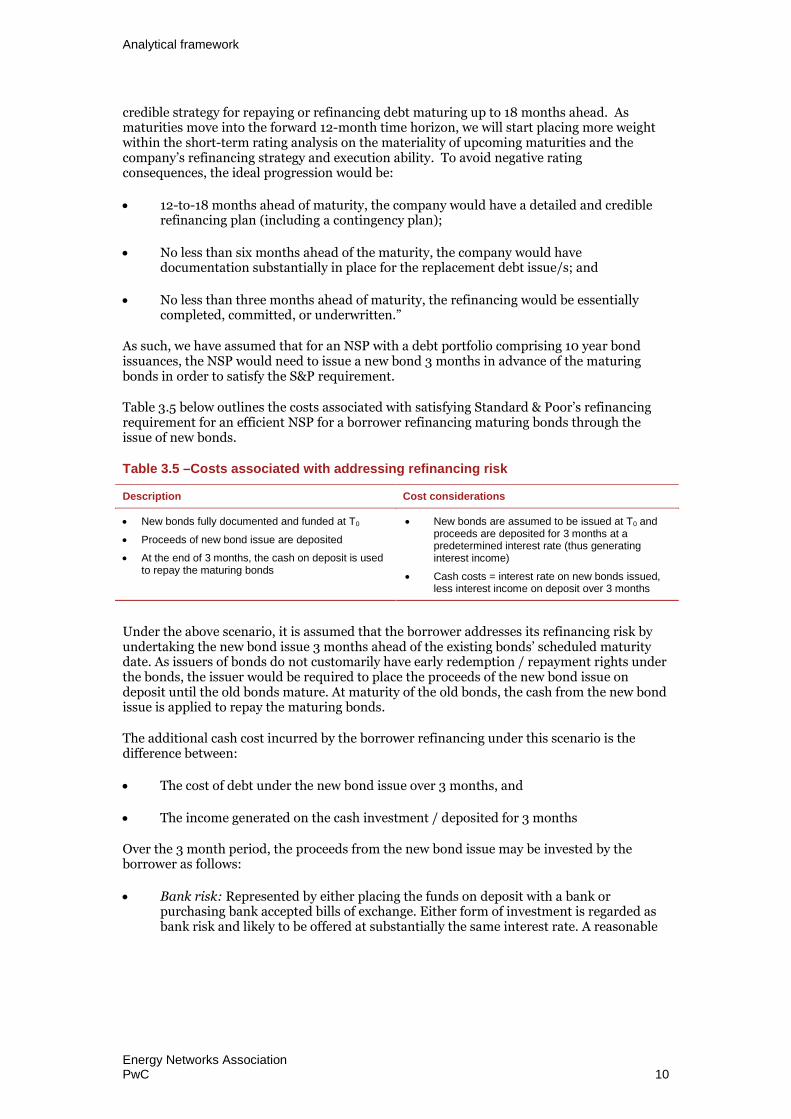
Table 3.5 –Costs associated with addressing refinancing risk
Description Cost considerations
New bonds fully documented and funded at T0
Proceeds of new bond issue are deposited
At the end of 3 months, the cash on deposit is usedto repay the maturing bonds
New bonds are assumed to be issued at T0 andproceeds are deposited for 3 months at apredetermined interest rate (thus generatinginterest income)
Cash costs = interest rate on new bonds issued,less interest income on deposit over 3 months
Under the above scenario, it is assumed that the borrower addresses its refinancing risk byundertaking the new bond issue 3 months ahead of the existing bonds’ scheduled maturitydate. As issuers of bonds do not customarily have early redemption / repayment rights underthe bonds, the issuer would be required to place the proceeds of the new bond issue ondeposit until the old bonds mature. At maturity of the old bonds, the cash from the new bondissue is applied to repay the maturing bonds.
The additional cash cost incurred by the borrower refinancing under this scenario is thedifference between:
The cost of debt under the new bond issue over 3 months, and
The income generated on the cash investment / deposited for 3 months
Over the 3 month period, the proceeds from the new bond issue may be invested by theborrower as follows:
Bank risk: Represented by either placing the funds on deposit with a bank orpurchasing bank accepted bills of exchange. Either form of investment is regarded asbank risk and likely to be offered at substantially the same interest rate. A reasonable
Analytical framework
Energy Networks AssociationPwC 11
interest rate assumption is regarded to be the Bank Bill Swap reference rate (BBSW)27.We note however, that DNSPs are not able to achieve the high retail deposit rates thatare sometimes advertised by the banks. This form of investment is regarded low risk28
and common market practice. The temporary investment of bond proceeds in the formof bank deposit or purchase of bank accepted bills until the old bonds mature is likelyto have neutral credit rating impact on the borrower; or
Government risk: Purchase of 3-month Commonwealth Government Securities. Thisis a lower credit risk strategy to investing in equivalent term to maturity bank-riskdeposit / bank bills. The interest income generated under this option will be lowerthan the bank options due to the lower credit risk profile of the investment. Thetemporary investment of bond proceeds in the form of Commonwealth GovernmentSecurities is likely to have neutral credit rating impact on the borrower.
BBB+ credit risk: A third approach, which we favour, is to adopt an assumption ofBBB+ credit risk, as it would under-compensate the benchmark utility to assume thatonly a BBSW rate is received. While the entity may actually invest in BBSW orCommonwealth Government bonds, and that will create a cash shortfall, on the otherhand the entity gains from adding a lower risk asset to its portfolio. This offsettingeconomic effect can be neutralised by assuming that the business receives the 3 monthBBB+ yield. That is, the benchmark entity would maintain its benchmark risk profilethrough investing in a 3 month BBB+ security
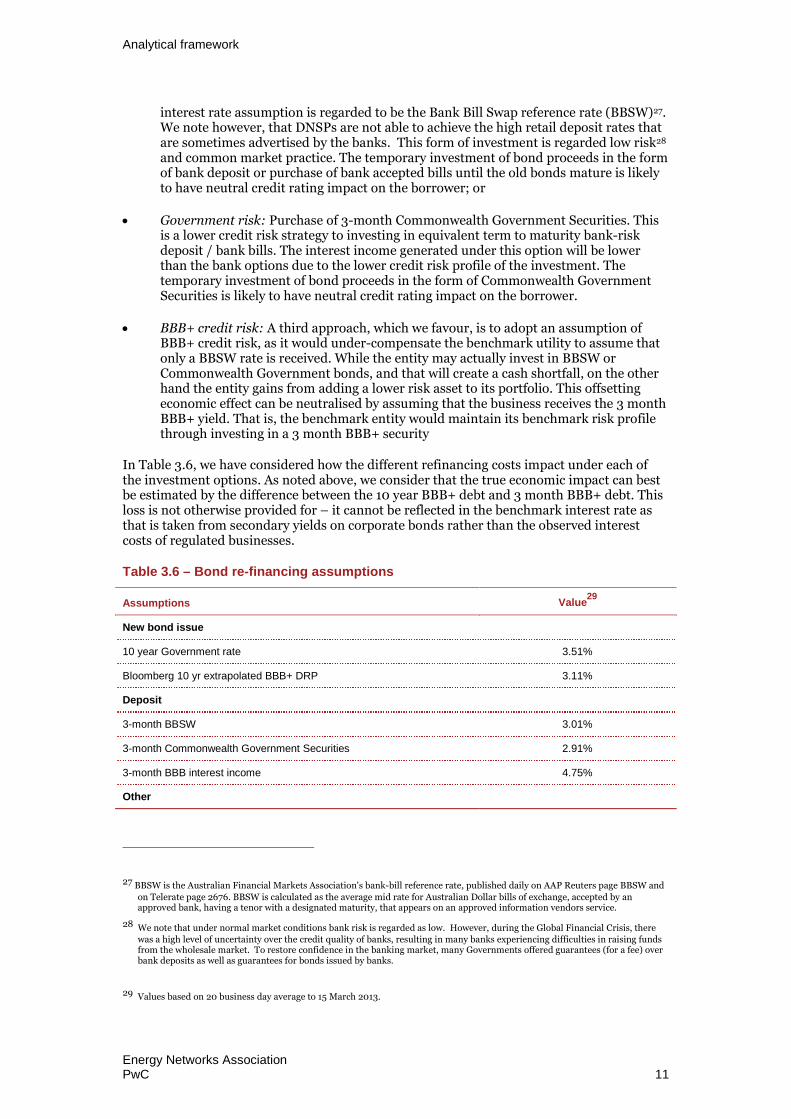
In Table 3.6, we have considered how the different refinancing costs impact under each ofthe investment options. As noted above, we consider that the true economic impact can bestbe estimated by the difference between the 10 year BBB+ debt and 3 month BBB+ debt. Thisloss is not otherwise provided for – it cannot be reflected in the benchmark interest rate asthat is taken from secondary yields on corporate bonds rather than the observed interestcosts of regulated businesses.
Table 3.6 – Bond re-financing assumptions
Assumptions Value29
New bond issue
10 year Government rate 3.51%
Bloomberg 10 yr extrapolated BBB+ DRP 3.11%
Deposit
3-month BBSW 3.01%
3-month Commonwealth Government Securities 2.91%
3-month BBB interest income 4.75%
Other
27 BBSW is the Australian Financial Markets Association's bank-bill reference rate, published daily on AAP Reuters page BBSW and
on Telerate page 2676. BBSW is calculated as the average mid rate for Australian Dollar bills of exchange, accepted by anapproved bank, having a tenor with a designated maturity, that appears on an approved information vendors service.
28 We note that under normal market conditions bank risk is regarded as low. However, during the Global Financial Crisis, therewas a high level of uncertainty over the credit quality of banks, resulting in many banks experiencing difficulties in raising fundsfrom the wholesale market. To restore confidence in the banking market, many Governments offered guarantees (for a fee) overbank deposits as well as guarantees for bonds issued by banks.
29 Values based on 20 business day average to 15 March 2013.

Analytical framework
Energy Networks AssociationPwC 12
Assumptions Value29
Volume (assumption) $250 m
In addition, if 10 year debt is always issued, but the next issue occurs after 9.75 years, thendebt is being refinanced during overlapping periods. This means that any direct transactioncosts would need to be recovered over 9.75 years rather than 10 years. Although this has asmall impact of 0.03 bppa at the standard issuance size, it has been incorporated in ouranalysis.
3.4.3 AER’s previous consideration of indirect costsIn 2010 the AER considered the issue of indirect debt raising costs in its South Australiadistribution determination. The AER did not allow ETSA utilities to recover those costsbecause it considered there would be a double counting of the existing allowance providedthrough its direct debt raising cost allowance.30 The potential for a double-count had beenraised in the report of the AER’s adviser, Associate Professor John Handley, who consideredthat the bulk of the direct debt raising costs provided by the AER was for ‘gross underwritingfees’, and that it was ‘not clear why there should be allowance for both the costs of theCompletion Method and gross underwriting fees’.31 However, this is based on amisunderstanding of the meaning of the term ‘gross underwriting fees,’ which originatedfrom the 2004 report of the Allen Consulting Group (ACG).
In ACG’s report, which set out a methodology to estimate direct transaction costs, the‘underwriting fee’ component of direct debt raising costs was explained as follows:32
Traditionally, as in stockbroking, the underwriting fee represented a reward for risk taking. If the issuewere not sold, the underwriter would take it up and guarantee proceeds to the issuer. With “best efforts”underwriting, a “bookbuild” is undertaken to determine the market-clearing price. The services providedby the lead manager/arranger in terms of a bookbuild are as follows:
Prepares an Information Memorandum (IM) for investors;
Prepares the sales pitch for investors;
Prepares presentation materials;
Undertakes the road show, delivering the presentation to investors;
Facilitates the investors’ due diligence process; and
Communicates the clearing price for each tenor.
The underwriting fee will have some fixed cost elements, such as the writing of an IM. However, there willalso be variable cost elements that rise with the difficulty of the deal. Larger transactions will requiregreater effort as there will more parties involved in terms of selling agents and investors.
The AER argued that ACG’s estimate of direct debt financing costs already incorporated therequested indirect debt refinancing plan costs for two reasons:
30 AER (May, 2010), South Australia distribution determination 2010-11 to 2014-15, p.384
31 John Handley (13 April, 2010), A Note on the Completion Method, Report prepared for the Australian Energy Regulator, p.9.
32 ACG (December, 2004), Debt and equity raising transaction costs, Report to the Australian Competition and ConsumerCommission, p. 38.
Analytical framework
Energy Networks AssociationPwC 13
First, refinancing risk was a known and relevant risk when ACG undertook its study, andtherefore the AER considered it was reasonable to conclude that ACG took into accountthe need for a refinancing plan in its debt raising costs estimate.33
Secondly, the AER considered that ACG explicitly allowed for an underwriting feecomponent based on its interpretation of ACG’s description of the component of debtraising cost termed ‘gross underwriting fees’.34
As is apparent from the above quotation from the ACG report, the term ‘gross underwriting’was not meant to represent the traditional ‘risk taking’ view of underwriting, but insteadreferred to the ‘book building’ process and preparation and marketing of the issue by theinvestment bank. The reason that the ACG paper used the term ‘gross underwriting fee’ issimply that this was (and continues to be) the terminology used by the Bloomberg service torepresent those book building and marketing costs. The term ‘gross underwriting fees’, waspreviously clarified in our 2011 report for Powerlink, as being a term to describe a fee for theplacement of debt securities with buyers (since this is the term used by Bloomberg).35
Hence, on a correct interpretation of the term ‘Gross underwriting fees’, it becomes apparentthat the AER erroneously concluded that the direct debt raising cost allowance estimatedusing ACG’s methodology compensates for refinancing plan costs. The indirect costsassociated with early refinancing and the direct costs of debt financing are separate costs thatdo not overlap. 36
33 AER (May 2010), p.383.
34 AER (May 2010), p.383.
35 PwC ( April, 2011), Debt and equity raising costs, pp.10 to p.11
36 The author of the ACG (2004) report is also the author of this report, therefore there is no presumption being made on this issue.
Direct debt raising transaction costs
Energy Networks AssociationPwC 14
4 Direct debt raisingtransaction costs
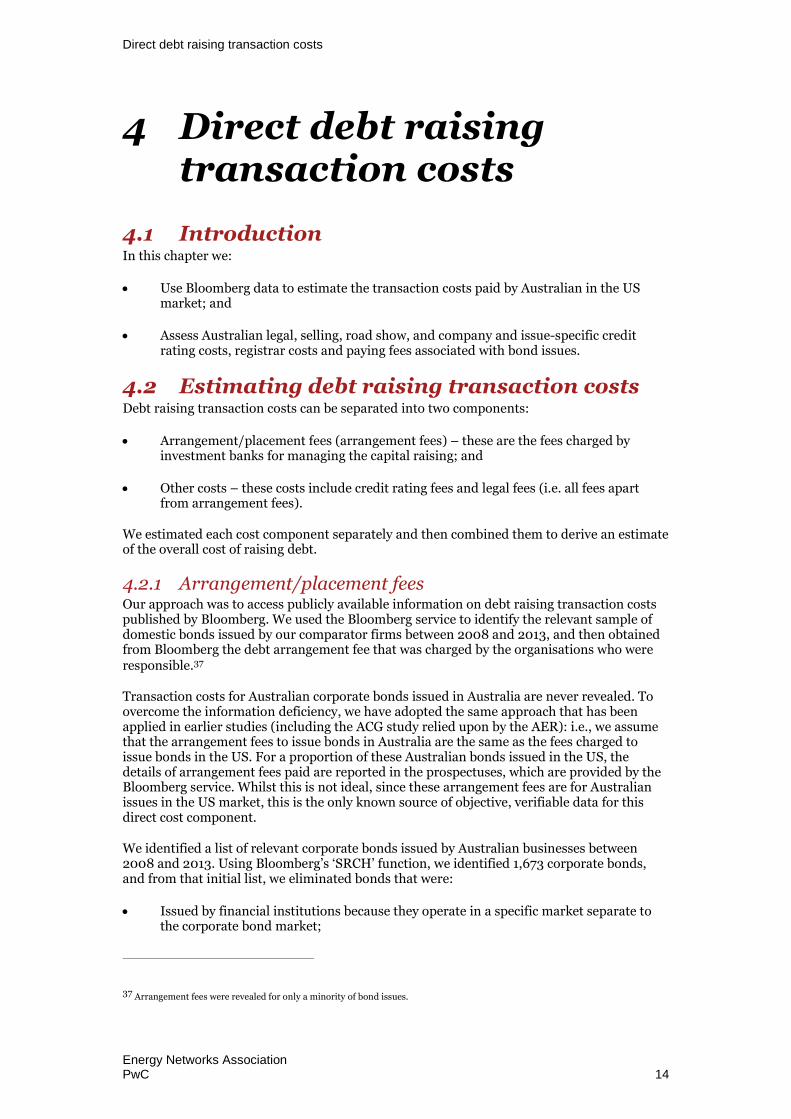
4.1 IntroductionIn this chapter we:
Use Bloomberg data to estimate the transaction costs paid by Australian in the USmarket; and
Assess Australian legal, selling, road show, and company and issue-specific creditrating costs, registrar costs and paying fees associated with bond issues.
4.2 Estimating debt raising transaction costsDebt raising transaction costs can be separated into two components:
Arrangement/placement fees (arrangement fees) – these are the fees charged byinvestment banks for managing the capital raising; and
Other costs – these costs include credit rating fees and legal fees (i.e. all fees apartfrom arrangement fees).
We estimated each cost component separately and then combined them to derive an estimateof the overall cost of raising debt.
4.2.1 Arrangement/placement feesOur approach was to access publicly available information on debt raising transaction costspublished by Bloomberg. We used the Bloomberg service to identify the relevant sample ofdomestic bonds issued by our comparator firms between 2008 and 2013, and then obtainedfrom Bloomberg the debt arrangement fee that was charged by the organisations who wereresponsible.37
Transaction costs for Australian corporate bonds issued in Australia are never revealed. Toovercome the information deficiency, we have adopted the same approach that has beenapplied in earlier studies (including the ACG study relied upon by the AER): i.e., we assumethat the arrangement fees to issue bonds in Australia are the same as the fees charged toissue bonds in the US. For a proportion of these Australian bonds issued in the US, thedetails of arrangement fees paid are reported in the prospectuses, which are provided by theBloomberg service. Whilst this is not ideal, since these arrangement fees are for Australianissues in the US market, this is the only known source of objective, verifiable data for thisdirect cost component.
We identified a list of relevant corporate bonds issued by Australian businesses between2008 and 2013. Using Bloomberg’s ‘SRCH’ function, we identified 1,673 corporate bonds,and from that initial list, we eliminated bonds that were:
Issued by financial institutions because they operate in a specific market separate tothe corporate bond market;
37 Arrangement fees were revealed for only a minority of bond issues.

Direct debt raising transaction costs
Energy Networks AssociationPwC 15
Not investment grade;
Not identified by a credit rating from Standard & Poor’s;
Convertible bonds, because they have equity-like characteristics, and therefore have anissuance cost structure that closely resembles equity issuance; and
Not making issuance cost data publicly available.
Application of the elimination criteria listed above left us with a sample of 33 bonds. Furtherfiltering of the data to only infrastructure or network businesses would have left a sample ofonly 3 (two Telstra Corporation bonds and a Melbourne Airport bond). As we were seeking areliable and robust estimate of bond arrangement fees, we included all 33 bonds to increasethe sample size.
The final step was to record each bond’s arrangement fee and translate it into a bppa (BPPA)value. Bond arrangement fees are generally expressed as an up-front number of basis points.To convert this to an equivalent annual BPPA value, we calculated the annual stream of feesrequired to equate the NPV of that stream to the value of the up-front fee, using a notionaldiscount rate of 10 per cent.
Specific arrangement fee issues analysedPrevious studies have been unable to find a relationship between debt arrangement fees forAustralian bonds issued in the US, and either term at issuance or issuance size. Our 2011study for Powerlink concluded that: 38
there was “…no discernible relationship between the annualised cost and term at issuance.”
and that:39
For the group excluding these four bonds, there was no discernible relationship between the annualisedissue cost and size of issue.
4.2.2 Estimation of the arrangement feeWe found that for Australian businesses issuing in the US the publicly available arrangementfees:
Averaged at 8.5 bppa; and
Were unrelated to issuance size, term at issuance or credit rating.
Australian bonds issued in the US marketFor the period 2008 to 2013 we found that the arrangement fee for Australian companiesissuing corporate bonds in the US is 8.5 bppa. For the full sample of 33 bonds, we estimatedan average arrangement fee of 19.1 bppa. However, this included several outliers rangingbetween 23.7 and 55.3 bppa.40 Removing these outliers, we estimated an averagearrangement fee of 8.5 bppa, which are 1.3 bppa higher than the finding in our earlier studycovering the period to 2010.
38 PwC, Powerlink debt and equity raising costs, April 2011, p17 and p16.
39 PwC, Powerlink debt and equity raising costs, April 2011 , p16
40 Outliers could be the result of the combination of the same arrangement fee as those for standard bonds, charged over a smallerissuance size and term to maturity.
Direct debt raising transaction costs
Energy Networks AssociationPwC 16
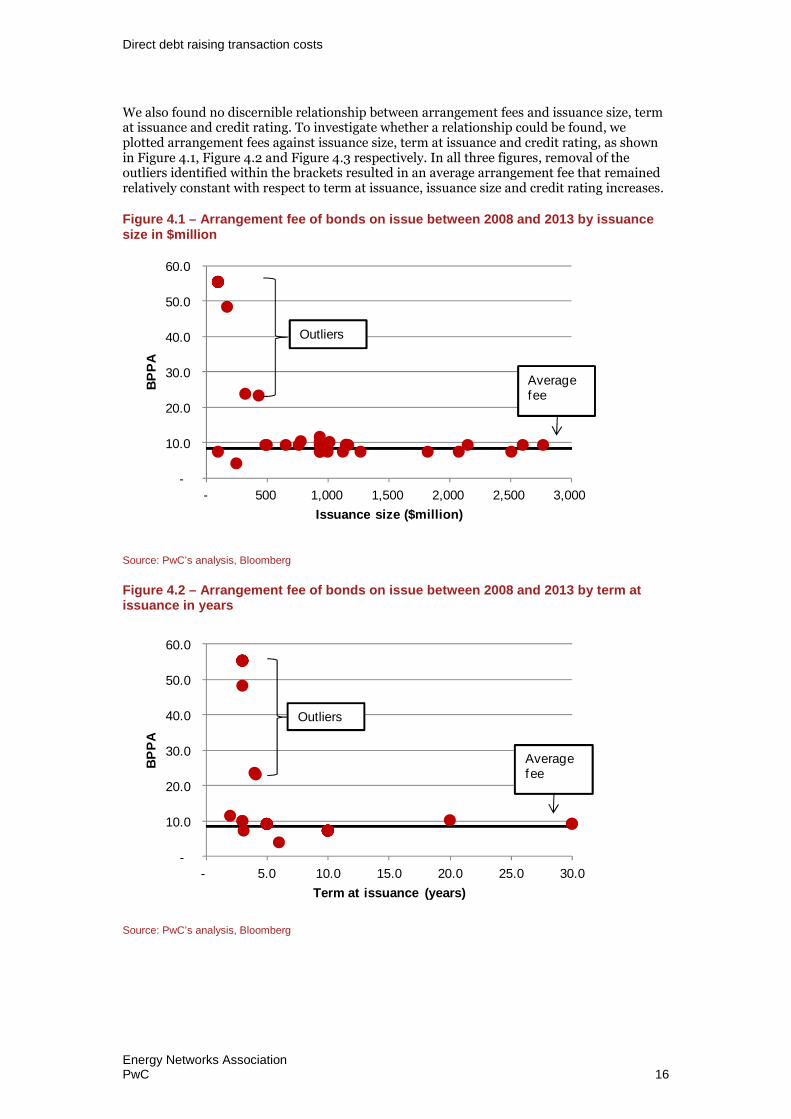
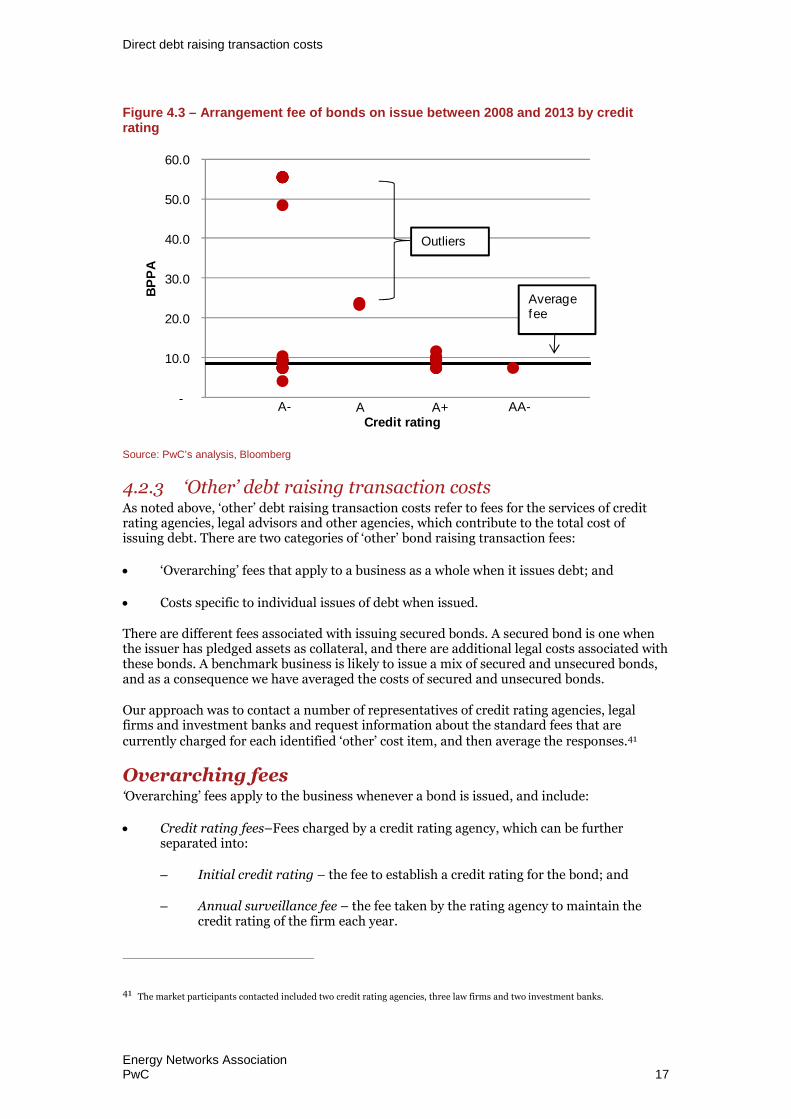
We also found no discernible relationship between arrangement fees and issuance size, termat issuance and credit rating. To investigate whether a relationship could be found, weplotted arrangement fees against issuance size, term at issuance and credit rating, as shownin Figure 4.1, Figure 4.2 and Figure 4.3 respectively. In all three figures, removal of theoutliers identified within the brackets resulted in an average arrangement fee that remainedrelatively constant with respect to term at issuance, issuance size and credit rating increases.
Figure 4.1 – Arrangement fee of bonds on issue between 2008 and 2013 by issuancesize in $million
Source: PwC’s analysis, Bloomberg
Figure 4.2 – Arrangement fee of bonds on issue between 2008 and 2013 by term atissuance in years
Source: PwC’s analysis, Bloomberg
-
10.0
20.0
30.0
40.0
50.0
60.0
- 500 1,000 1,500 2,000 2,500 3,000
BP
PA
Issuance size ($million)
Averagefee
Outliers
-
10.0
20.0
30.0
40.0
50.0
60.0
- 5.0 10.0 15.0 20.0 25.0 30.0
BP
PA
Term at issuance (years)
Averagefee
Outliers
Direct debt raising transaction costs
Energy Networks AssociationPwC 17
Figure 4.3 – Arrangement fee of bonds on issue between 2008 and 2013 by creditrating
Source: PwC’s analysis, Bloomberg
4.2.3 ‘Other’ debt raising transaction costsAs noted above, ‘other’ debt raising transaction costs refer to fees for the services of creditrating agencies, legal advisors and other agencies, which contribute to the total cost ofissuing debt. There are two categories of ‘other’ bond raising transaction fees:
‘Overarching’ fees that apply to a business as a whole when it issues debt; and
Costs specific to individual issues of debt when issued.
There are different fees associated with issuing secured bonds. A secured bond is one whenthe issuer has pledged assets as collateral, and there are additional legal costs associated withthese bonds. A benchmark business is likely to issue a mix of secured and unsecured bonds,and as a consequence we have averaged the costs of secured and unsecured bonds.
Our approach was to contact a number of representatives of credit rating agencies, legalfirms and investment banks and request information about the standard fees that arecurrently charged for each identified ‘other’ cost item, and then average the responses.41
Overarching fees‘Overarching’ fees apply to the business whenever a bond is issued, and include:
Credit rating fees–Fees charged by a credit rating agency, which can be furtherseparated into:
– Initial credit rating – the fee to establish a credit rating for the bond; and
– Annual surveillance fee – the fee taken by the rating agency to maintain thecredit rating of the firm each year.
41 The market participants contacted included two credit rating agencies, three law firms and two investment banks.
-
10.0
20.0
30.0
40.0
50.0
60.0B
PP
A
Credit ratingA- A A+ AA-
Outliers
Averagefee

Direct debt raising transaction costs
Energy Networks AssociationPwC 18
Table 4.1 – Other debt raising transaction costs – Overarching (2013)
Unit Estimated value Source
Credit rating agency –Initial credit rating
Per issue $77,500 Rating agencies
Credit rating agency –Annual surveillance
Per annum in total $35,500 Rating agencies
Source: Interviews with credit rating agencies.
The credit rating fees mentioned above, as well as the ‘other’ bond raising transaction feeslisted below are consistent with our 2010 study and ACG’s 2004 study:42
Master program fees – Legal costs incurred for preparing a bond Master Program,which is used as the base document under which multiple issuances of bonds areundertaken over a period of time (usually 10 years).
Legal fees for the issuer–Fees charged by legal firms for preparing documentation forthe issue of bonds under the Master Program.
Up-front credit rating bond issue fee–Fee charged by the credit rating agency when anew bond is issued.
Registrar costs–Fees charged by bond registry organisations engaged in registeringinvestors in a bond, including:
– Initial set up costs compensating for establishing a registry service for a bond;and
– An annual service fee.
Agent’s out-of-pocket expenses –Out-of-pocket expenses charged by the agents of abank undertaking the bond issue, including travel and accommodation, venue hire,printing etc.
Table 4.2 summarises our findings for each category of cost.
Table 4.2 – Other debt raising transaction costs (2013)
Unit Estimated value Source
Legal counsel – Masterprogram
Per ten years $56,250 Legal firms
Legal counsel – Issuer’s Per issue $15,625 Legal firms
Credit rating agency –Up front bond issue
Per issue 5.2 bps of issue size Rating agencies
Registrar – Up front Per ten years $20,850 Banks
Registrar – Annual Per annum per issue $7,825 Banks
Investment bank’s outof pocket expenses
Per issue $3,000 Estimated
Source: Interviews with legal firms, banks and credit rating agencies.
42 The Allen Consulting Group, (December, 2004), Debt and Equity Raising Transaction Costs.
Direct debt raising transaction costs
Energy Networks AssociationPwC 19
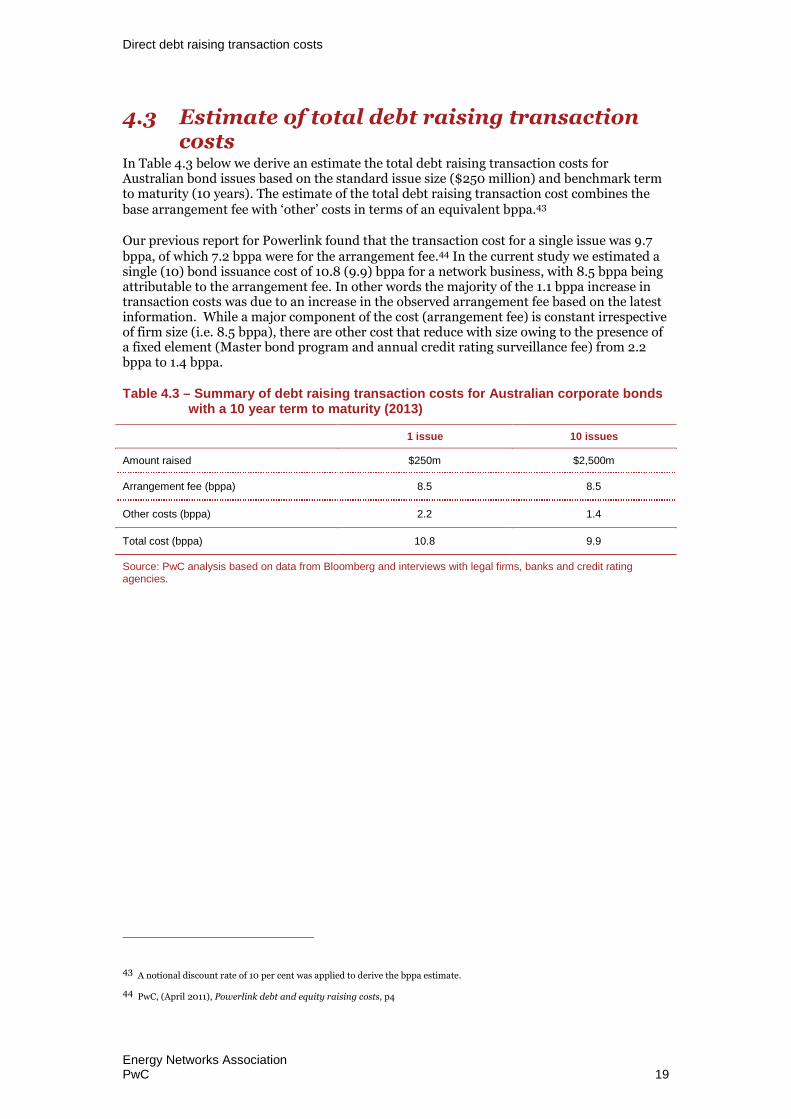
4.3 Estimate of total debt raising transactioncosts
In Table 4.3 below we derive an estimate the total debt raising transaction costs forAustralian bond issues based on the standard issue size ($250 million) and benchmark termto maturity (10 years). The estimate of the total debt raising transaction cost combines thebase arrangement fee with ‘other’ costs in terms of an equivalent bppa.43
Our previous report for Powerlink found that the transaction cost for a single issue was 9.7bppa, of which 7.2 bppa were for the arrangement fee.44 In the current study we estimated asingle (10) bond issuance cost of 10.8 (9.9) bppa for a network business, with 8.5 bppa beingattributable to the arrangement fee. In other words the majority of the 1.1 bppa increase intransaction costs was due to an increase in the observed arrangement fee based on the latestinformation. While a major component of the cost (arrangement fee) is constant irrespectiveof firm size (i.e. 8.5 bppa), there are other cost that reduce with size owing to the presence ofa fixed element (Master bond program and annual credit rating surveillance fee) from 2.2bppa to 1.4 bppa.
Table 4.3 – Summary of debt raising transaction costs for Australian corporate bondswith a 10 year term to maturity (2013)
1 issue 10 issues
Amount raised $250m $2,500m
Arrangement fee (bppa) 8.5 8.5
Other costs (bppa) 2.2 1.4
Total cost (bppa) 10.8 9.9
Source: PwC analysis based on data from Bloomberg and interviews with legal firms, banks and credit ratingagencies.
43 A notional discount rate of 10 per cent was applied to derive the bppa estimate.
44 PwC, (April 2011), Powerlink debt and equity raising costs, p4
Indirect debt raising transaction costs
Energy Networks AssociationPwC 20
5 Indirect debt raisingtransaction costs
5.1 IntroductionIn this chapter, we estimate the indirect costs associated with debt raising by a benchmarkNSP. These costs are divided into costs associated with bank debt (associated with maintainadequate liquidity reserve requirements, as required by the credit rating agencies) and bonds(the funding instrument assumed to be adopted by the NSP to fund the business).
5.2 Bank debt - indirect cost of liquidityreserves
5.2.1 Cost of liquidity reservesIn section3 of the report, we identified that an efficient NSP maintains liquidity reserves inthe form of committed funding in excess of total debt on issue of 8.8%. The commonpractice for maintaining liquidity reserves for corporate borrowers are committed facilitiesprovided by banks. Bond investors do not provide similar commitments. The costcomponents relating to maintaining these committed funding limits are as follows:
1 Commitment Fee – a fee paid to financiers regardless of whether the facility is utilised,for maintaining a legally binding commitment to make funds available to theborrower, if requested by the borrower.
2 Direct transaction costs – these are all the costs associated with a debt financing sucha as upfront establishment fees paid to financiers, arranging fees, credit rating agencyfees and legal fees.
For calculating the cost of maintaining a liquidity reserve we have assumed that the NSPadopts 3 year bank debt facilities with the costs calculated as follows:
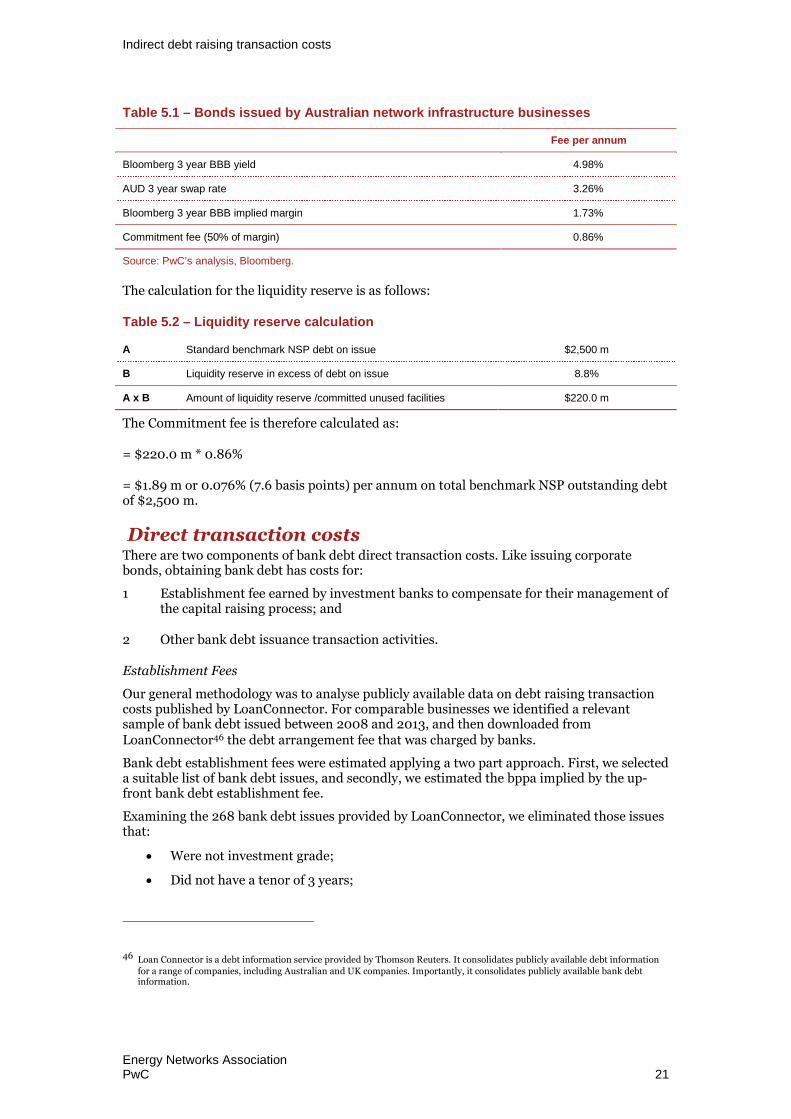
Commitment FeeThe current common market practice in relation to commitment fees is for banks to charge50 per cent of the bank debt margin. The commitment fee is charged on the unused portionof committed funding throughout the life of the facility. Based on the Bloomberg BBB 3 yearcredit curve,45 we have calculated a commitment fee of 0.86%. This is equivalent to 7.6 bppa,assuming a debt portfolio of $2,500 m. A summary of this calculation is provided in Table5.1 below:
45 We have used an average of the 20 business days to 15 March 2013.
Indirect debt raising transaction costs
Energy Networks AssociationPwC 21
Table 5.1 – Bonds issued by Australian network infrastructure businesses
Fee per annum
Bloomberg 3 year BBB yield 4.98%
AUD 3 year swap rate 3.26%
Bloomberg 3 year BBB implied margin 1.73%
Commitment fee (50% of margin) 0.86%
Source: PwC’s analysis, Bloomberg.
The calculation for the liquidity reserve is as follows:
Table 5.2 – Liquidity reserve calculation
A Standard benchmark NSP debt on issue $2,500 m
B Liquidity reserve in excess of debt on issue 8.8%
A x B Amount of liquidity reserve /committed unused facilities $220.0 m
The Commitment fee is therefore calculated as:
= $220.0 m * 0.86%
= $1.89 m or 0.076% (7.6 basis points) per annum on total benchmark NSP outstanding debtof $2,500 m.
Direct transaction costsThere are two components of bank debt direct transaction costs. Like issuing corporatebonds, obtaining bank debt has costs for:
1 Establishment fee earned by investment banks to compensate for their management ofthe capital raising process; and
2 Other bank debt issuance transaction activities.
Establishment Fees
Our general methodology was to analyse publicly available data on debt raising transactioncosts published by LoanConnector. For comparable businesses we identified a relevantsample of bank debt issued between 2008 and 2013, and then downloaded fromLoanConnector46 the debt arrangement fee that was charged by banks.
Bank debt establishment fees were estimated applying a two part approach. First, we selecteda suitable list of bank debt issues, and secondly, we estimated the bppa implied by the up-front bank debt establishment fee.
Examining the 268 bank debt issues provided by LoanConnector, we eliminated those issuesthat:
Were not investment grade;
Did not have a tenor of 3 years;
46 Loan Connector is a debt information service provided by Thomson Reuters. It consolidates publicly available debt informationfor a range of companies, including Australian and UK companies. Importantly, it consolidates publicly available bank debtinformation.

Indirect debt raising transaction costs
Energy Networks AssociationPwC 22
Did not identify their credit Standard & Poor’s credit rating; and
Did not make issuance cost data publicly available.
This left 21 bank debt issues. We then removed bank debt issued by non-infrastructurebusinesses, as this enhanced the relevance of bank establishment fee estimates while stillproviding a sample size of 9 issues.
Bank debt establishment fees, were reported as an up-front fee. When the up-front fee wasreported as a range, we used the middle of the range as the reported up-front fee.
We found that, based on the sample, the establishment fee for 3 year bank debt is 17.0 basispoints.
Applying this fee to 8.8% (liquidity reserve amount) of the total debt portfolio of $2,500 m,this equates to 0.6 bppa.
Other bank debt issuance transaction costs
As in section 4 of this report, our approach when calculating “other bank debt issuance costs”was to contact a number of representatives of legal firms and banks and request informationabout the standard fees that are currently charged for each identified ‘other’ cost item, andthen average the responses.47
Table 5.3 – Other bank debt issuance transaction costs (2013)
Unit Estimated value Source
Legal counsel –borrower
Per issue $86,667 Legal firms
Legal counsel – Banks Per issue $90,000 Legal firms
Agency fee Per issue $30,000 Estimated
Agent’s out of pocketexpenses
Per issue $3,000 Estimated
Source: Interviews with legal firms, banks and credit rating agencies.
Based on a debt portfolio of $2,500 m, this represents an annual fee of 0.0041%48 (0.4 bppa)over 3 years.
Table 5.4 provides a summary of our findings of the total debt costs associated withmaintaining liquidity reserves.
47 The market participants contacted included three law firms and two investment banks.
48 We have used a notional discount rate of 10 per cent to arrive at a bppa estimate.

Indirect debt raising transaction costs
Energy Networks AssociationPwC 23
Table 5.4 Indirect costs: debt raising transaction costs associated with maintaining aliquidity reserve, assuming a debt portfolio of $2,500 million
Cost(A$)
Annual
Equivalent (A$)49 Bppa
Commitment Fee 1,892,000 1,892,000 7.6
Establishment fee 374,000 150,391 0.6
Other debt issuance transaction Costs
Legal counsel – borrower 86,667 34,850 0.1
Legal counsel – bank 90,000 36,190 0.1
Agency Fee 30,000 30,000 0.1
Bank’s out of pocket expenses 3,000 1,206 0.0
Total Annual Equivalent 2,144,638 8.6
Source: PwC analysis based on Bloomberg, and interviews with banks, credit rating agencies and legal firms.
5.3 Bond re-financingCalculation involves three components:
A. 3-months interest expense on the new bond
B. Offsetting interest income generated on monies invested over 3 months
The calculation methodologies of each of these are outlined below.
A. Interest expense: New bond issue, coupon for first 3 months= (10 year Australian Commonwealth Government Security rate + 10 year extrapolatedBloomberg BBB+ Debt Risk Premium50) * Volume / number of quarters in a year
= (3.51% + 3.11%) * $250m / 4 = 6.62% * $250m / 4
= $4.14 m, equivalent to 0.166% (16.6 basis points) per annum assuming a debt portfolio of$2,500 m
B.1 Interest Income (invested in bank credit risk): Interest incomereceived from investment in bank deposit or bank accepted bills atBBSW for 3 months= Volume * 3-month BBSW51 / number of quarters in a year
= $250m * 3.01% / 4
= $1.88 m, equivalent to 0.075% (7.5 basis points) per annum assuming a debt portfolio of$2,500 m.
or
49 We have used a notional discount rate of 10 per cent to arrive at a bppa estimate
50 The 10 year extrapolated Bloomberg BBB+ debt risk premium is calculated on 20 business days to 15 March 2013.
51 3-month BBSW, calculated as the average of the 20 business days to 15 March 2013.
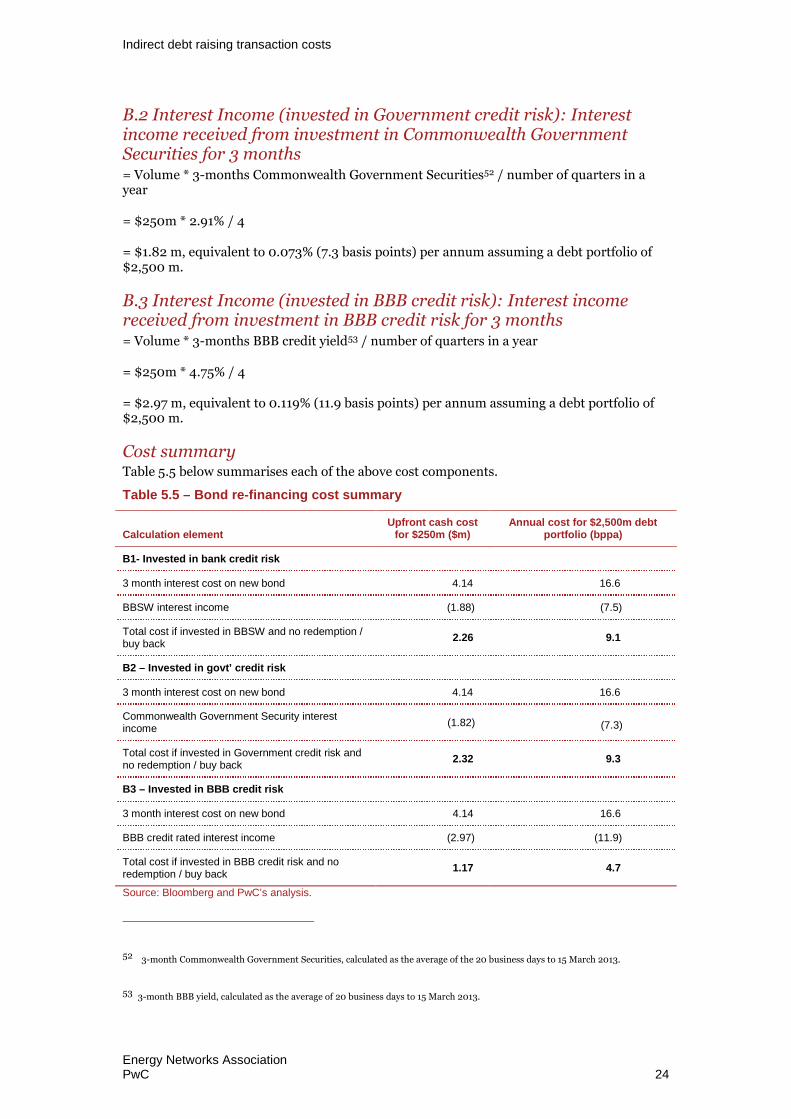
Indirect debt raising transaction costs
Energy Networks AssociationPwC 24
B.2 Interest Income (invested in Government credit risk): Interestincome received from investment in Commonwealth GovernmentSecurities for 3 months= Volume * 3-months Commonwealth Government Securities52 / number of quarters in ayear
= $250m * 2.91% / 4
= $1.82 m, equivalent to 0.073% (7.3 basis points) per annum assuming a debt portfolio of$2,500 m.
B.3 Interest Income (invested in BBB credit risk): Interest incomereceived from investment in BBB credit risk for 3 months= Volume * 3-months BBB credit yield53 / number of quarters in a year
= $250m * 4.75% / 4
= $2.97 m, equivalent to 0.119% (11.9 basis points) per annum assuming a debt portfolio of$2,500 m.
Cost summaryTable 5.5 below summarises each of the above cost components.
Table 5.5 – Bond re-financing cost summary
Calculation elementUpfront cash cost
for $250m ($m)Annual cost for $2,500m debt
portfolio (bppa)
B1- Invested in bank credit risk
3 month interest cost on new bond 4.14 16.6
BBSW interest income (1.88) (7.5)
Total cost if invested in BBSW and no redemption /buy back
2.26 9.1
B2 – Invested in govt’ credit risk
3 month interest cost on new bond 4.14 16.6
Commonwealth Government Security interestincome
(1.82) (7.3)
Total cost if invested in Government credit risk andno redemption / buy back
2.32 9.3
B3 – Invested in BBB credit risk
3 month interest cost on new bond 4.14 16.6
BBB credit rated interest income (2.97) (11.9)
Total cost if invested in BBB credit risk and noredemption / buy back
1.17 4.7
Source: Bloomberg and PwC’s analysis.
52 3-month Commonwealth Government Securities, calculated as the average of the 20 business days to 15 March 2013.
53 3-month BBB yield, calculated as the average of 20 business days to 15 March 2013.

Conclusion: total debt raising transaction costs
Energy Networks AssociationPwC 25
6 Conclusion: total debtraising transaction costs
6.1 Total debt raising costsTable 6.1 below provides a summary of our estimate of the total debt raising costs associatedwith 60 per cent gearing, a BBB+ credit rating and a 10 year average term at issuance. For 10issues in a bond programme amounting to $2,500 million, the total debt raising cost is 23bppa. Of the total amount, 9.9 bppa are contributed by direct debt raising costs, with 13.3basis points contributed by indirect costs.
Table 6.1 – Summary of total debt raising costs (2013)
1 issue 10 issues
Amount raised $250 m $2,500 m
Direct cost (bppa) 10.8 9.9
Indirect costs (bppa) 13.3
Commitment fee 7.6
Establishment fee 0.6
Other debt issuance transaction costs
– Legal counsel – borrower 0.1
– Legal counsel – bank 0.1
– Agency Fee 0.1
– Bank’s out of pocket expenses 0.0
3 month early re-finance bond cost 4.7
Total debt raising cost (bppa rounded to nearest basis point)23
Source: PwC analysis based on data from Bloomberg and interviews with legal firms, banks and credit ratingagencies.
Technically, the representation of costs shown in Table 6.1 requires a new bond issue eachyear over 10 years, and therefore requires 10 issues. This implies that 60 per cent of theregulated asset base (RAB) of the business needs to be $2,500 million, so that a bond of$250 million is issued each year during the regulatory period. Since some regulated networkbusinesses have debt portfolios that are smaller than $2,500 million, the direct costs forthese firms will need to be estimated by pro-rating the 10 bond issues down to match the sizeof benchmark debt implied by the RAB.
In Table 6.2 we show the effect of pro-rating for a business that has a RAB of $2,000 million,which implies a benchmark debt value of $1,200 million, and a benchmark 10 annual bondissues of $120 million each. That is, demonstrating the impact for a business with loweramounts of debt, however continues to refinance a bond every year. Pro-rating the amountraised per bond issue down to $120 million would raise the direct cost per issue to 12.4 bppa.Based on a programme of issuing 10 bonds, the total cost of issuance (including direct andindirect costs) would be 24 bppa.
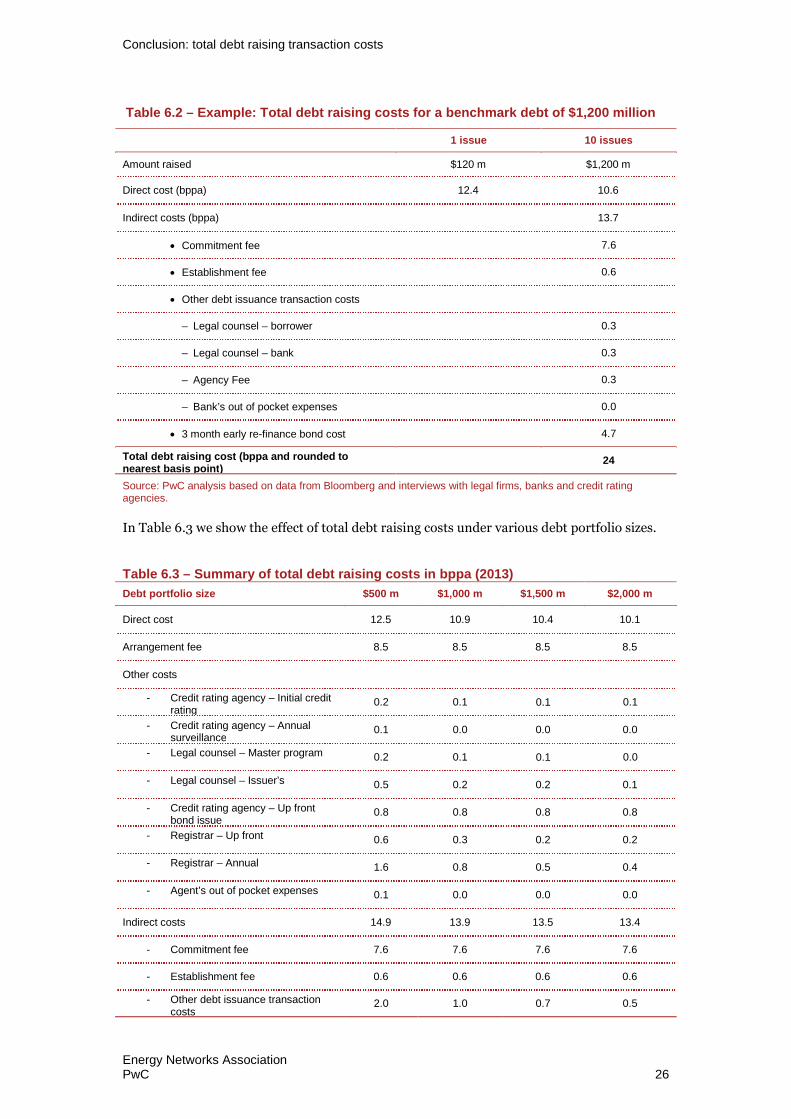
Conclusion: total debt raising transaction costs
Energy Networks AssociationPwC 26
Table 6.2 – Example: Total debt raising costs for a benchmark debt of $1,200 million
1 issue 10 issues
Amount raised $120 m $1,200 m
Direct cost (bppa) 12.4 10.6
Indirect costs (bppa) 13.7
Commitment fee 7.6
Establishment fee 0.6
Other debt issuance transaction costs
– Legal counsel – borrower 0.3
– Legal counsel – bank 0.3
– Agency Fee 0.3
– Bank’s out of pocket expenses 0.0
3 month early re-finance bond cost 4.7
Total debt raising cost (bppa and rounded tonearest basis point)
24
Source: PwC analysis based on data from Bloomberg and interviews with legal firms, banks and credit ratingagencies.
In Table 6.3 we show the effect of total debt raising costs under various debt portfolio sizes.
Table 6.3 – Summary of total debt raising costs in bppa (2013)
Debt portfolio size $500 m $1,000 m $1,500 m $2,000 m
Direct cost 12.5 10.9 10.4 10.1
Arrangement fee 8.5 8.5 8.5 8.5
Other costs
- Credit rating agency – Initial creditrating
0.2 0.1 0.1 0.1
- Credit rating agency – Annualsurveillance
0.1 0.0 0.0 0.0
- Legal counsel – Master program 0.2 0.1 0.1 0.0
- Legal counsel – Issuer’s 0.5 0.2 0.2 0.1
- Credit rating agency – Up frontbond issue
0.8 0.8 0.8 0.8
- Registrar – Up front 0.6 0.3 0.2 0.2
- Registrar – Annual 1.6 0.8 0.5 0.4
- Agent’s out of pocket expenses 0.1 0.0 0.0 0.0
Indirect costs 14.9 13.9 13.5 13.4
- Commitment fee 7.6 7.6 7.6 7.6
- Establishment fee 0.6 0.6 0.6 0.6
- Other debt issuance transactioncosts
2.0 1.0 0.7 0.5
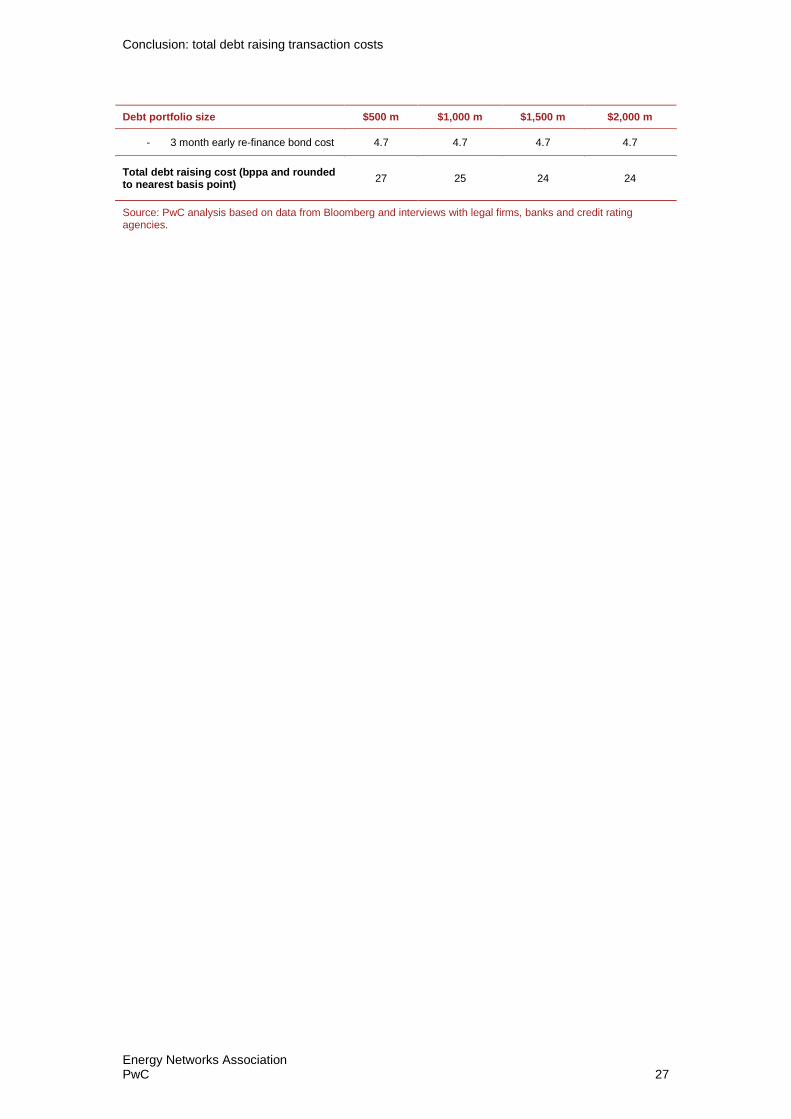
Conclusion: total debt raising transaction costs
Energy Networks AssociationPwC 27
Debt portfolio size $500 m $1,000 m $1,500 m $2,000 m
- 3 month early re-finance bond cost 4.7 4.7 4.7 4.7
Total debt raising cost (bppa and roundedto nearest basis point)
27 25 24 24
Source: PwC analysis based on data from Bloomberg and interviews with legal firms, banks and credit ratingagencies.

Appendix A Terms ofreference
BackgroundThe Australian Energy Regulator (AER) is developing Rate of Return Guidelines that willform the basis of the regulated rate of return applied in energy network decisions. The AERpublished an issues paper in late December 2012 and a formal consultation paper in earlyMay 2013 under the recently revised National Electricity Rules (NER) and National GasRules (NGR).
The AER undertook its last review of the weighted average cost of capital (WACC) in 2009under a previous version of the NER.
As further detailed below, the Energy Network Association (ENA) would like to engage you toestimate the total debt financing costs for a benchmark efficient network service provider(NSP) within the scope of the allowed rate of return objective :
“[t]he rate of return for a [Service Provider] is to be commensurate with the efficientfinancing costs of a benchmark efficient entity with a similar degree of risk as thatwhich applied to the [Service Provider] in respect of the provision of [services]”
Scope of workThe ENA requests you to estimate the following costs:
Direct transaction costs associated with a debt financing including but not limited to,costs such as upfront establishment fees paid to financiers and/or to arranging parties,legal fees, road-show costs, the credit rating fee applied directly to the financingtransaction, trustee fees, registrar fees; and
Indirect transaction costs associated with a debt financing including but not limitedto, early financing costs, early redemption costs, and commitment fees associated withthe maintenance liquidity reserves.
You are requested to provide the estimates of direct and indirect transaction costs assumingthe financing is undertaken by an efficient NSP maintaining gearing (debt to RAB) at 60 percent, and a credit rating of BBB+ (the current AER benchmark).
Indirect Transaction CostsThe ENA notes that indirect transaction costs may be defined as costs that an NSP incurs tomaintain a BBB+ credit rating that therefore support an efficient interest cost and efficientdirect costs incurred by an NSP in relation to its financing.
In considering the indirect transaction costs incurred by a NSP, the ENA requests you toconsider the policies of the rating agencies, in particular the liquidity risk management andrefinancing risk management policies. NSPs are required, to the extent that it avoidsundesirable credit rating action by rating agencies, to adhere to such policies to maintain theBBB+ rating that supports all their debt financing activity. For example, in more recentyears, Standard & Poor’s has adopted a liquidity risk score that requires a certain level ofavailable financing to be held by a NSP. The cost of this financial support, liquidity support,is an indirect cost to the NSP.

Terms of reference
Energy Networks AssociationPwC 29
NSPs also have risk policies that enable them to maintain a BBB+ credit rating by ensuringcommitted financing is available well in advance of any maturing debt. The ENA requestsyou to capture such costs within the pool of indirect transaction costs.
Annualised CostsOnce we have determined all direct and indirect financing transaction costs, the ENArequests you to estimate an annualised total debt financing cost for an efficient NSP,assuming that the NSP raises 10 year financing and that 1/10th of the financing is refinancedeach year - i.e. a rolling 10 year approach to financing the NSP debt. You are also requestedto indicate whether there are any further considerations that ought to be taken into accountwhen determining the benchmark efficient debt financing cost; for example the size of thenetwork service provider.
The ENA requests the consultant to provide a report which must:
Attach these terms of reference;
Attach the qualifications (in the form of a curriculum vitae) of the person(s) preparingthe report;
Identify any current or future potential conflicts;
Comprehensively set out the bases for any conclusions made; and
Only rely on information or data that is fully referenced and could be made reasonablyavailable to the AER or others.
The ENA intends to submit the consultant report to the AER in response to the consultationpaper. Accordingly the report will become a public report.
ContactAny questions regarding this terms of reference should be directed to:
Nick Taylor (Jones Day)
Email: [email protected]
Phone: 02 8272 0500

Appendix B CVs
CVs
Energy Networks AssociationPwC 31
Jeff Balchin
(Incenta Economic Consulting)Managing DirectorMob: 0412 388 372
Jeff is an economist at Incenta Economic Consulting. Jeff has almost 20years of experience in relation to economic regulation issues across theelectricity, gas and airports sectors in Australia and New Zealand andexperience in relation to water, post and telecommunications. He hasadvised governments, regulators and major corporations on issuesincluding the development of regulatory frameworks, regulatory pricereviews, licensing and franchise bidding and market design. Jeff has alsoundertaken a number of expert witness assignments. His particularspecialities have been on the application of finance principles toeconomic regulation, the design of tariff structures, the design ofincentive compatible regulation and the drafting and economicinterpretation of regulatory instruments.
In addition, Jeff has led a number of analytical assignments for firms tounderstand the responsiveness of consumers to changes to prices orother factors (like promotional activities) and to use this information toinform pricing strategy.
Relevant experience – Energy and Resources
Strategic regulatory advisor – he has been a strategic adviser toregulators during a number of major price reviews, including theprecedent setting early Victorian gas and electricity distribution pricereviews (1998, 2001, 2003 and 2006). He has also been retained byregulated businesses to provide strategic advice during majorregulatory reviews, including Australian electricity transmissionbusinesses during several major reviews of their regulatory regime, forgas and electricity businesses during price reviews and for two majorNew Zealand firms (Powerco and Christchurch International Airports)during New Zealand regulatory reviews. Has also assisted a number offirms in relation to unregulated infrastructure, to justify their prices(providers) or to respond pricing proposals (customers) forinfrastructure assets, including Dunedin Airport, Virgin Australia andSunWater.
Review of regulatory regimes – has assisted major utilities during thereview of regulatory regimes, including major assignments for theAustralian electricity network businesses during the drafting andsubsequent review of the regulatory regime for electricity networks.
Regulatory finance issues – he has provided advice on a range offinance issues to regulators and regulate businesses, including majorreviews of equity betas and deriving a benchmark cost of debt andcomplex valuation issues (including the proper specification of targetrevenue formulae). He has also provided extensive advice in relationto regulatory accounting issues, including the treatment of relatedparty arrangements, provisions and revaluation gains, and onmethodologies for allocating costs between activities. Similarly, he hasprovided extensive advice in relation to deriving an allowance fortaxation for regulatory purposes. He has also provided substantialadvice in relation to regulatory asset valuation and depreciationissues.
Cost benefit studies – he has advised in relation to methodologicalissues in quantifying the economic costs and benefits of electricitydistribution and transmission investment, including specific advices
CVs
Energy Networks AssociationPwC 32
on the treatment of green obligations and on the economic benefits ofIT projects to make expanded use of advanced meteringinfrastructure.
Incentive regimes – he has advised on the design of incentives forregulated businesses to minimise cost, undertake efficient serviceimprovement and on the design of price controls (an objective ofwhich is to create an incentive for firms to structure prices efficiently).
Market structure – he was involved in the early debate around marketstructure in the Australian energy sector and assisted in the design ofthe ring fencing arrangements in place for the gas sector. Morerecently, he undertook a major review for the Victorian governmenton the need for continuing with special cross ownership rules for theenergy sector.
Analytical pricing activities – has undertaken assignments for a majorAustralian supermarket and department store to use analyticaltechniques to estimate the sensitivity of sales to prices and otherfactors (including promotional activities) from transactions data basesto assist in pricing strategy and to review the effect of pricingactivities.
Qualifications and memberships
Bachelor Economics (First Class Honours) University of Adelaide
CEDA National Prize for Economic Development]
CVs
Energy Networks AssociationPwC 33
Michael Lawriwsky
(Incenta Economic Consulting)Executive DirectorMob: 0400 002 355
Michael is an Executive Director at Incenta. Previously he was a directorat PricewaterhouseCoopers (Australia), a director and partner in theAllen Consulting Group, and a director – corporate finance in ANZInvestment Bank. He has had a career spanning academia, investmentbanking and economic policy advice. He has had involvement inregulation and market reform in wide a range of businesses spanningenergy, transport, water, gaming and wagering. He has advised on over$15 billion of bids in the Australian energy and transport sectors.
Regulatory and Policy roles:
International Air Services Commission - Between 1997 and 2007Michael was a part-time Commissioner of the International AirServices Commission. The IASC was established in 1992 as anindependent body regulating new entrant airlines and allocatingcapacity to Australian international airlines with an objective ofstrengthening competition.
• Review of Business Programs (Mortimer Report) - In November 1996Dr. Lawriwsky was appointed to the Review of Business Programsunder the leadership of Mr. David Mortimer (Mortimer Report). Thiswas a major review of Government support programs for businesswith a 15 person secretarial staff. The process included public forums,stakeholder interviews with key government and business groups andanalysis of numerous submissions. The report led to the formation ofInvest Australia.
Relevant experience by sector
Regulated gas networks:
Jemena Gas Networks – advice on the appropriate methodology toestimate the cost of debt in relation for gas transmission assets. Thisis part of the WACC proposal for a gas network revenuedetermination.
Essential Services Commission (Victoria) – adviser to the ESC on costof capital issues associated with the 2007-2008 Gas Price Review.
QCA – adviser on cost of capital issues (including beta) in relation toQueensland gas distribution assets.
QCA – adviser on the prepayment of network charges by Envestra.
Allgas – Adviser on regulatory modelling and regulatory outlook forANZ Infrastructure Services in its bid for Allgas.
Envestra – adviser to ESCOSA and Queensland CompetitionAuthority on cost of capital and working capital (prepayment) issuesrelating to Envestra’s 2006 access arrangements in South
Australia and Queensland respectively.
ACCC – advised the ACCC on differentials between BBB and BBB+for a gas utility in connection with an appeal lodged by the EastAustralia Pipeline Limited. ACCC – prepared a report on review ofstudies comparing international regulatory determinations, which

CVs
Energy Networks AssociationPwC 34
was included as Appendix G of ACCC’s submission to ProductivityCommission Review of the National Gas Code.
BHP Billiton – advised BHP Billiton on its submission in response tothe Draft Report of the Productivity Commission Review of theNational Gas Code.
Gas and Fuel (Gascor) – adviser to the company in relation to thepotential purchase of the Wagga Wagga Gas Company from the Cityof Wagga Wagga.
Gas and Fuel (Gascor) – mandated to critique Gascor’s weightedaverage cost of capital calculation used in regulatory tariff setting.
• The USA Gas Utility market – authored this ANZ Securities
monograph examining the regulatory structure and market reforms
introduced into the US gas industry and implications for Australia.
Gas and Fuel Corporation – co-authored this ANZ Securities
monograph
Regulated electricity networks:
Powerlink – adviser to Powerlink on regulatory cost of capitalincluding beta, debt risk premium and on equity and debt raisingtransaction costs.
Aurora Energy – advice to Aurora Energy by writing their debt riskpremium submission to the Australian Energy Regulator
CitiPower and Powercor - advice on the appropriate methodology toestimate the cost of debt in relation for electricity distribution assets,as part of the WACC proposal for an electricity network revenuedetermination.
Independent Market Operator WA – advised the Western Australia’swholesale electricity market operator, the Independent Marketoperator, by advising on the methodology to be used to calculate toestimate Allowance For Funds Used During Construction, and theWACC to be applied in the determination of the maximum reserveprice for generation capacity.
Energy Networks Association, APIA and Grid Australia – adviser onthe AER review of WACC parameters for electricity transmission anddistribution network service providers.
Retail credit support arrangements – advised the Essential ServicesCommission of Victoria on new arrangements for credit support byelectricity retailers.
ETSA Utilities – adviser to the Essential services Commission ofSouth Australia on cost of capital issues.
Energex and Energon – advised the Queensland CompetitionAuthority on cost of capital issues relating to the 2005 accessarrangements of these companies.
Electricity Commission of Papua New Guinea (PNG Power) – leadfinancial/strategic adviser to the PNG Government on thecorporatisation/privatisation of PNG Power, managing a team ofinvestment bankers, lawyers, accountants and regulatory consultants.
CVs
Energy Networks AssociationPwC 35
Electricity Trust of South Australia (ETSA) – lead financial adviser toEdison Mission Energy in their bid for this $3.5 billion electricitydistribution and retailing company, particularly in relation toregulation, valuation, financial modelling and capital structure.
Pacific Gas and Electric Company – lead financial adviser in bids forfour electricity distribution/retailing companies totalling $5.5 billion(United Energy, Powercor, Citipower, Eastern Energy).Electro Power Limited (NZ) – adviser to the company’s board in itsmerger negotiations with the contiguous Central Power Limited,including valuation and capital structure issues.
Energy:
Snowy Hydro – Michael led a team undertaking a comprehensivevaluation analysis of Snowy Hydro, including a cost of capital update.
Snowy Hydro – Adviser to the Snowy Hydro on cost of capital (on-
going annual review). Southern Electric International (US) –
advised on cost of capital with respect to Australian electricity
generation assets.
Energy Developments Limited – float valuation and pricing for thisindependent power project underwritten by ANZ Securities.
Loy Yang A – coordinated a sell-down of $30 million of equity inHorizon Energy Investments to institutional investors.
Southern Hydro Limited – established a consortium of bidders forthis privatisation (Pacific Hydro, Hyder Investments and HastingsFunds Management) and directed financial due diligence/valuation.Including capital structure determination.
Electro Power Limited (NZ) – analysis of the rate of return oninvestment which would be required by investors in the GatewayElectronic Monitoring System (“GEMS”) – a “smart meter”technology.
Road and Rail:
Federal Government Department – Strategic and governance review
QCA – Adviser on the cost of capital issues relating to the Northern
Missing Link railway. QCA – Adviser on cost of capital issues in
relation to the Queensland Rail below rail network – coal price
review. Victorian Department of Transport – adviser on new
techniques for attracting private sector capital to the roads sector
Victorian Auditor General’s Office – Adviser analysing the terms ofthe cost of capital for the financing of the Tulla-Calder freewayextension.
Stagecoach plc – adviser to Stagecoach on cost of capital issuesrelating to bidding for rail infrastructure assets in Victoria.
Adelaide-Darwin railway – adviser on regulatory issues to the ANZInvestment Bank project finance team in relation to this financing.
Ports:
Abbot Point Coal Terminal – regulatory adviser to the consortium
CVs
Energy Networks AssociationPwC 36
comprising CKI and Deutsche Bank (RREEF), which bid for this asset(lead adviser, Macquarie Bank).
Port of Brisbane – regulatory adviser to the Q Ports Holdingsconsortium partners, Industry Funds Management, GlobalInfrastructure Partners, QIC Global Infrastructure and TawreedInvestments, which won this bid and was awarded ‘Best PrivatisationDeal’ and ‘Asian Infrastructure of the Year’ awards (lead advisor,Macquarie Bank). PwC received an award from Infrastructure
Partnerships Australia for the role it played in this transaction.
BHP Billiton – advise on Pilbara ports from a real options perspectivePort of Melbourne Corporation – review of regulatory cost of capitalfor price monitoring by the Essential Services Commission.
Wiggins Island Coal Terminal - adviser to the ANZ Bank and the UserGroup proposing a selffunded expansion of coal loading capacity atthe Port of Gladstone.
Port of Waratah – adviser to Newcastle Coal Infrastructure Group(NCIG) in relation to the Prime Minister’s Taskforce onInfrastructure.
Dalrymple Bay Coal Terminal – Adviser to the QueenslandCompetition Authority on the WACC parameters (including beta) forDBCT.
Port of Brisbane Corporation – strategic adviser to the port, includinga review of strategic options and a valuation of the port’s operations.
Ports of Portland and Geelong – advice on cost of capital to the ANZInvestment Bank team bidding for the assets on behalf of theStrang/Hastings consortium.
Port of Napier (NZ) – reviewer of the valuation of the port by the ANZInvestment Bank Auckland office.
Airports:
New Zealand Airports Association – analysis of airport betas fornegotiations with airlines and the Commerce Commission.
Virgin airlines – advice on cost of capital issues for negotiations withairports on landing charges.
Federal Airports Corporation – directed a seven-month regulatorymodelling, valuation and capital structure analysis of all 22 airportsas part of the Capital Structure Review commissioned by theDepartment of Transport/Department of Treasury.
Brisbane International Airport – lead financial adviser to the Port ofBrisbane Corporation in the course of the successfulSchiphol/CBA/POBC bid in 1997.
Christchurch International Airport – adviser to the airport withrespect to its negotiations with the NZ Commerce Commission on thecost of capital and implications for landing charges.
Water:
Gladstone Area Water Board – adviser to the QueenslandCompetition Authority on the assessment of costs of capitalparameters for the 2005 GAWB price review.
Melbourne Water – adviser to Melbourne Water on its financial
CVs
Energy Networks AssociationPwC 37
strategy, including capital structure, dividend policy and financialbenchmarks.
SA Water – adviser on its capital structure review and review ofdividend policy.
SA Water – adviser on commercialisation, and dividend policy innegotiations with the SA Treasury.
Auckland City Council (NZ) – advice on the corporatisation of waterand waste water assets.
Gippsland Water – adviser on pricing policy with respect to future
capital funding requirements. South Gippsland Water – prepared a
benchmarking analysis of corporate performance relative to peers.
United Water – advised the company on the potential for listing onthe stock exchange pursuant to requirements under the United WaterManagement Contract.
General regulatory assignments:
QCA – adviser on the level of regulated WACCs.
Debt and equity transaction costs – Advised the ACCC on debt andequity transaction costs that could be applied in regulatorydeterminations.
International evidence on regulatory rates of return – Adviser to theACCC on rates of return provided internationally by regulators.
Exceptional circumstances – advised the Queensland CompetitionAuthority on appropriate regulatory responses to exceptionalcircumstances.
Monte Carlo analysis – adviser to a regulatory agency assessing theefficacy of Monte Carlo analysis as a methodology to be employed incost of capital studies for regulatory purposes.
Expert Opinions:
Ferrier Hodgson – Expert opinion on the conduct of an investmentbank advising on a multi-billion dollar merger transaction, whichdestroyed substantial shareholder value and resulted in a default ofbanking covenants.
Essential Services Commission of Victoria – Relative bias in the yieldsof indexed Commonwealth Government Securities when used as aproxy for the CAPM risk free rate.Australian Taxation Office, Commerciality of AAPT’s financialarrangements
Australian Taxation Office, Statement on the financial arrangements ofFuturis Corporation Limited
Qualifications and memberships
Ph.D. B.Ec. (Hons) (University of Adelaide)
Trustee and Chair of the Finance Committee, Shrine of Remembrance
CVs
Energy Networks AssociationPwC 38
Matthew Santoro
(PwC)Managing Director, Joint National Head - Debt & CapitalAdvisoryTel: (03) 8603 4707
Professional qualifications and memberships
• Bachelor of Economics (Honours), University of Adelaide
• Affiliate, Institute of Chartered Accountants
Career summary
Matthew has over 28 years of debt and capital markets experience,comprising over 20 years of corporate and institutional bankingexperience with Deutsche Bank and Citibank and the last eight years inan advisory capacity. Matthew is experienced in a wide range offinancing and fundraising transactions, in particular in the area ofproject financing, acquisition financing, leverage financing, re-financings, property financing and procurement of debt capital marketsinstruments across the Australian, European and USA markets. Hisexperience includes dealings with credit rating agencies such asStandard and Poor’s and Moody’s. Prior to joining PwC, Matthewestablished and was Joint National Head of KPMG’s debt advisorypractice for a period of five years.
Matthew has extensive experience in the utilities and energy sector,having been responsible for structuring, underwriting and syndicatingmulti-billion dollar financings for successful bidders during theprivatisations of the Victorian and South Australian electricityindustries. Debt transactions successfully completed during theseprivatisations cover the full spectrum of the industry; electricitygeneration, gas and electric distribution and gas and electrictransmission and.
Relevant experience
• Debt structuring, arranging and procurement, onshore and offshore
• US Private Placement, Australian and European Bond markets
• Capital management
• Credit rating agencies

CVs
Energy Networks AssociationPwC 39
Steven Hong
(PwC)ManagerPh:03 8603 5073
Mob:0402 377 520
Steven is a Manager in PricewaterhouseCoopers’ Australian Economicspractice with specific experience in regulatory economics and theapplication of economic and financial principles in regulation.
Prior to joining PricewaterhouseCoopers, Steven was a Senior Analyst atthe Australian Competition Consumer Commission, where he wasmainly responsible for providing financial and economic advice inregulatory projects.
Relevant experience
Regional development authority – Steven is currently helpinga development authority build an investment case for a piece ofenergy network infrastructure. Part of the project involvesidentifying the major drivers of investment and the exploringwhether future developments in the drivers will support a case for aregulatory investment.
Energy Networks Association – Steven is currently helping theEnergy Networks Association (ENA) with a strategy for the futurecost of equity. Recent changes to regulatory cost of capitaldetermination procedures allowed the Australian Energy Regulatormore freedom to determine the cost of equity. As a result, the ENAwant to develop a strategy for future cost of equity proposals.
Queensland Competition Authority – Steven is currentlydeveloping a first principles study into the cost of debt. The majorissues behind this study is what yield should long-term debt bepaying that is supported by financial and economic theory andempirical evidence.
Indonesian gas pipeline operator – Steven helped prepare asubmission on the likely return on equity expected by investors onan Indonesian gas pipeline in the past, considering issues such ashow the capital asset pricing model would have been applied andwhether international cost of equity values can be used ascomparators.
Goulburn-Murray Water – Steven helped Goulburn-Murraywater develop its operating and capital expenditure forecasts for itsthird water plan It involved collaborating with the operating,finance and capital expenditure teams within Goulburn-Murraywater so that information can be collated and structured to explainto a regulator the cost forecasts for operating and capitalexpenditure.
Electricity and gas utilities – Development of a methodology toestimate a regulatory debt margin in light of the current uncertaintyof a fair value of long term bonds.
Energy Networks Association – Assisted in producing a reportthat advised on the risks and implications of two possible incentive
CVs
Energy Networks AssociationPwC 40
mechanisms for capex during the AEMC’s review of transmissionframeworks. The two incentive frameworks are ex-post capexreviews and an efficiency carryover mechanism.
Investment consortium – Steven helped advise an investmentconsortium on a bid for a regulated asset. Steven’s major roles wereto: review and identify risks in the asset’s the pricing structure, andreview the regulatory model that were used to project the asset’srevenue in the future
Airline – Steven assisted an airline in providing financialmodelling and regulatory advice to help them negotiate aeronauticalcharges. The issues covered range from depreciation, allowance forfunds used during construction and analysis of pricing models
Resources Company – Steven assisted a resources company innegotiating gas tariffs for a pipeline that is about to be constructed.
Resources Company – Steven helped a resources company re-negotiate gas capacity tariffs by modelling the impact on gas tariffsif they were to be regulated.
Resources Company – Steven assisted a resources company in agas tariff appeal whereby he modelled the impact of varying degreesof cost allocation. The outcome of this work secured a significantcost decrease by way of lower gas tariffs.
Powerco New Zealand – Steven has assisted Powerco in NewZealand in a number of regulatory engagements in relation to theNew Zealand Commerce Commission’s review of inputmethodologies
Dunedin International Airport Limited - Steven has helpedDunedin airport in preparing their pricing proposal to keystakeholders. In this, Steven played a key role in creating aregulatory modelling as well as drafting of the pricing proposal,covering topics such as cost allocation, cost of capital and financialmodelling.
Kimberly Clark Australia – Steven was involved in assisting inproviding advice as to how an initial regulatory asset base would beset for a gas pipeline if it is to be declared.
Powerlink Queensland – Steven helped Powerlink estimate howmuch it would cost to raise debt and equity. Steven is also helping topropose a methodology to estimate a debt risk premium in asituation where there is a lack of reliable information.
Aurora Energy – Steven assisted Aurora Energy by writing theirdebt risk premium submission to the Australian Energy Regulator
Independent Market Operator WA – Steven assisted WesternAustralia’s wholesale electricity market operator, the IndependentMarket operator, by advising on the methodology to be used tocalculate to estimate Allowance For Funds Used DuringConstruction, and the WACC to be applied in the determination ofthe maximum reserve price for generation capacity.
Jemena Gas Networks - Steven assessed the appropriatemethodology to estimate the cost of debt in relation for gastransmission assets. This is part of the WACC proposal for a gasnetwork revenue determination.
Assorted energy companies and regulators – Steven hasprepared advice on the appropriate method to estimate a
CVs
Energy Networks AssociationPwC 41
benchmark cost of debt.
Christchurch International Airport Limited - Steven isregularly engaged to provide advice to Christchurch InternationalAirport Limited in relation to input methodologies as part of aregulatory review undertaken by the New Zealand CommerceCommission.
Air Services Australia - Steven assisted the review of WACCparameters applicable for Air Services Australia
Snowy Hydro Limited - Steven reviewed and updated theregulatory WACC parameters for Snowy Hydro Limited.
Queensland Competition Authority – Steven was involved inassessing the financial model used to support a proposedinfrastructure charges schedule
Queensland Competition Authority – Steven has preparedadvice on the appropriate method to estimate a benchmark cost ofdebt.
Airline - Steven was involved in a high level review of the WACCassumptions and methodologies applied by three airports withrespect to aeronautical pricing.
Essential Services Commission of South Australia - Stevenwas involved in a review on the advantages and disadvantages oftwo methodologies to set an initial regulatory asset base.
Qualifications and memberships
Bachelor of Commerce (Economics) with Honours, University ofMelbourne
Chartered Financial Analyst
Institute of Public Administration, corporate member

pwc.com.au
© 2013 PricewaterhouseCoopers. All rights reserved. In this document, "PwC" refers toPricewaterhouseCoopers a partnership formed in Australia, which is a member firm ofPricewaterhouseCoopers International Limited, each member firm of which is a separate legal entity.