deaths in new zealand: regional and ethnic projections 2014 to 2026 february 2014
TRANSCRIPT
Deaths in New Zealand: Regional and
Ethnic Projections2014 to 2026
February 2014
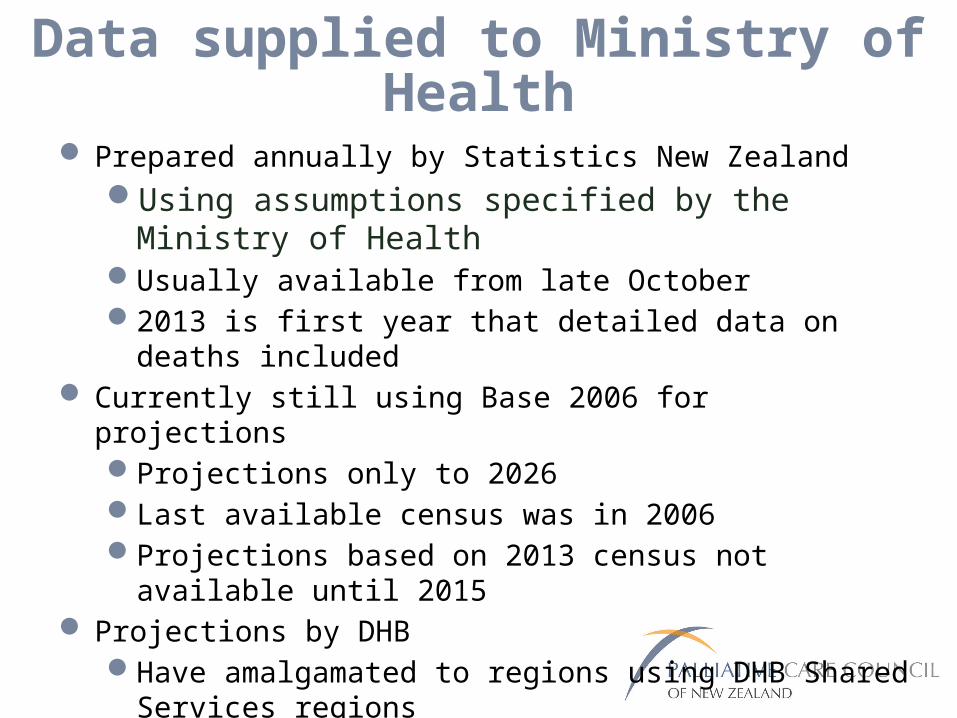
Data supplied to Ministry of Health
Prepared annually by Statistics New ZealandUsing assumptions specified by the Ministry of HealthUsually available from late October2013 is first year that detailed data on deaths included
Currently still using Base 2006 for projectionsProjections only to 2026Last available census was in 2006Projections based on 2013 census not available until 2015
Projections by DHBHave amalgamated to regions using DHB Shared Services
regions Projections by prioritised ethnicity
Māori, Pacific, Asian, Other
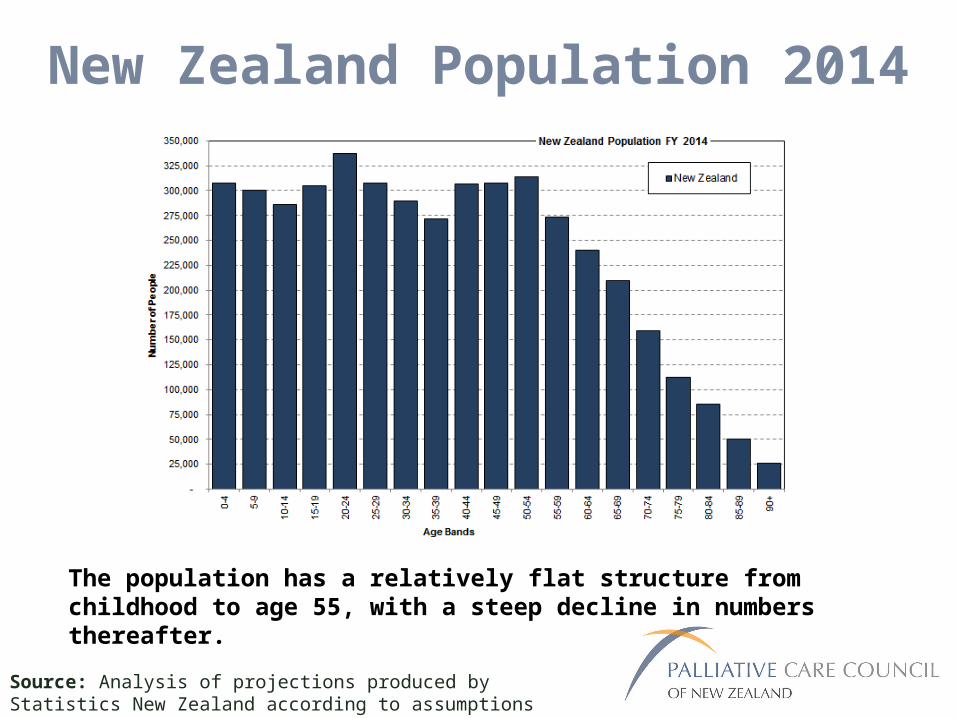
New Zealand Population 2014
The population has a relatively flat structure from childhood to age 55, with a steep decline in numbers thereafter.
Source: Analysis of projections produced by Statistics New Zealand according to assumptions specified by the Ministry of Health
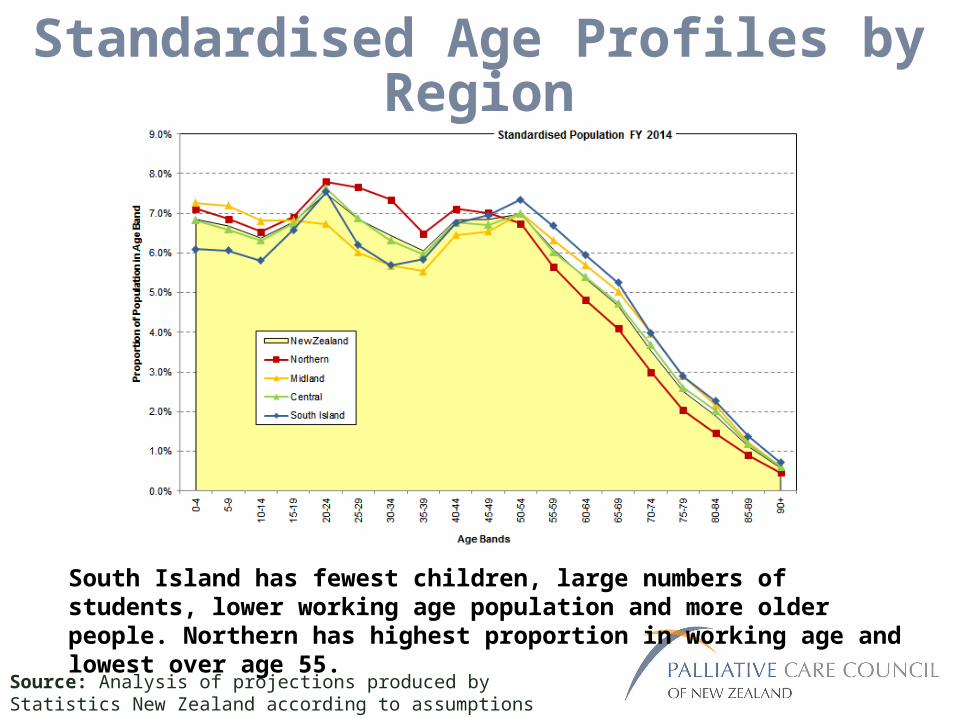
South Island has fewest children, large numbers of students, lower working age population and more older people. Northern has highest proportion in working age and lowest over age 55.
Source: Analysis of projections produced by Statistics New Zealand according to assumptions specified by the Ministry of Health
Standardised Age Profiles by Region
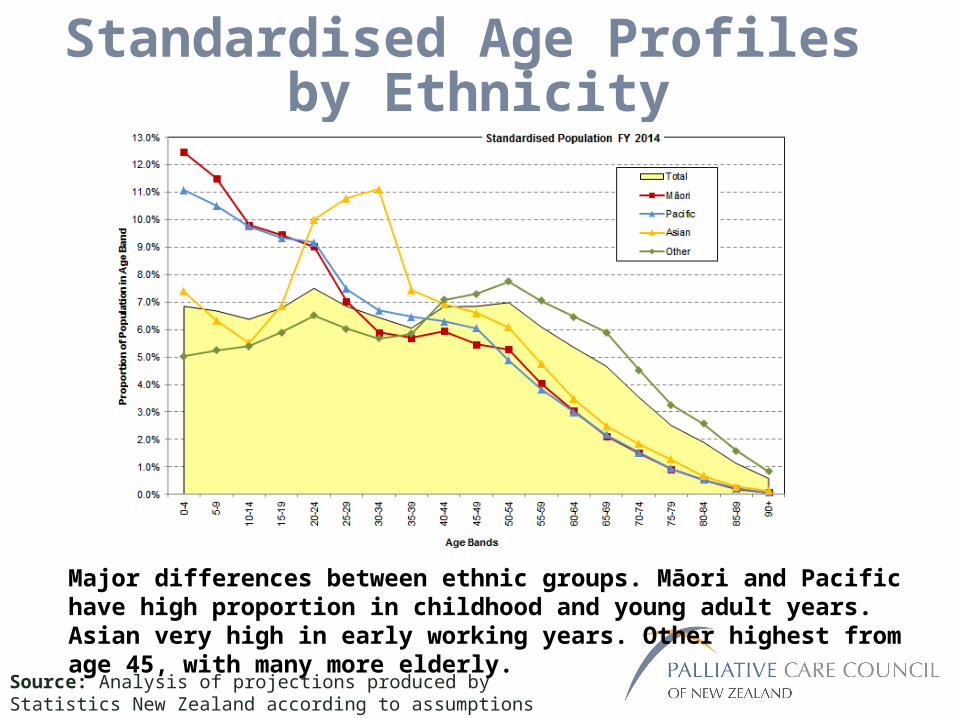
Major differences between ethnic groups. Māori and Pacific have high proportion in childhood and young adult years. Asian very high in early working years. Other highest from age 45, with many more elderly.
Source: Analysis of projections produced by Statistics New Zealand according to assumptions specified by the Ministry of Health
Standardised Age Profiles by Ethnicity
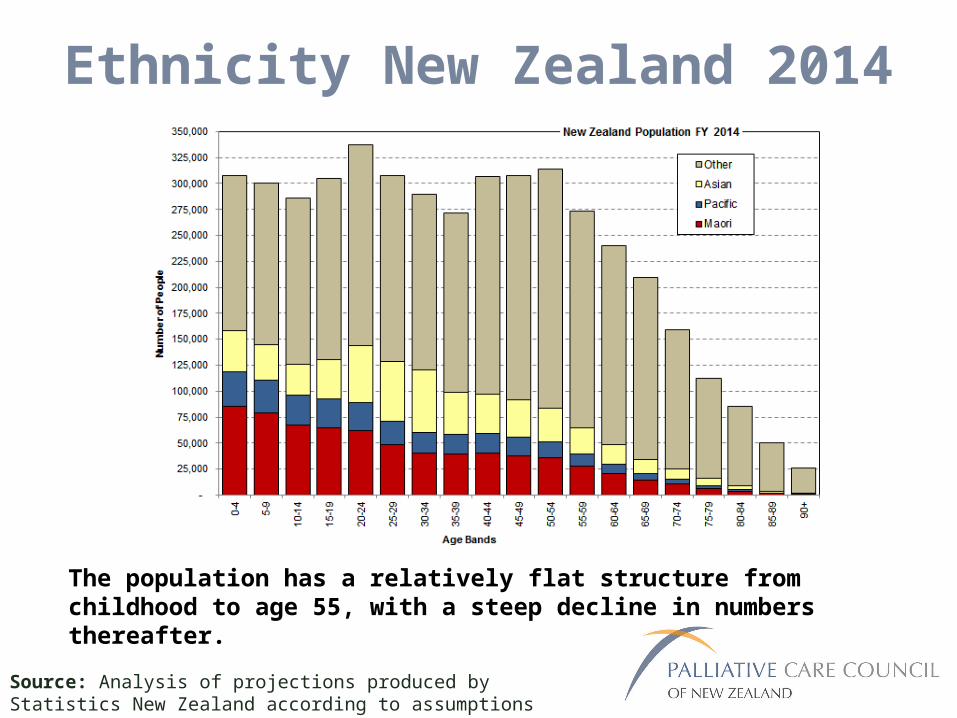
Ethnicity New Zealand 2014
The population has a relatively flat structure from childhood to age 55, with a steep decline in numbers thereafter.
Source: Analysis of projections produced by Statistics New Zealand according to assumptions specified by the Ministry of Health
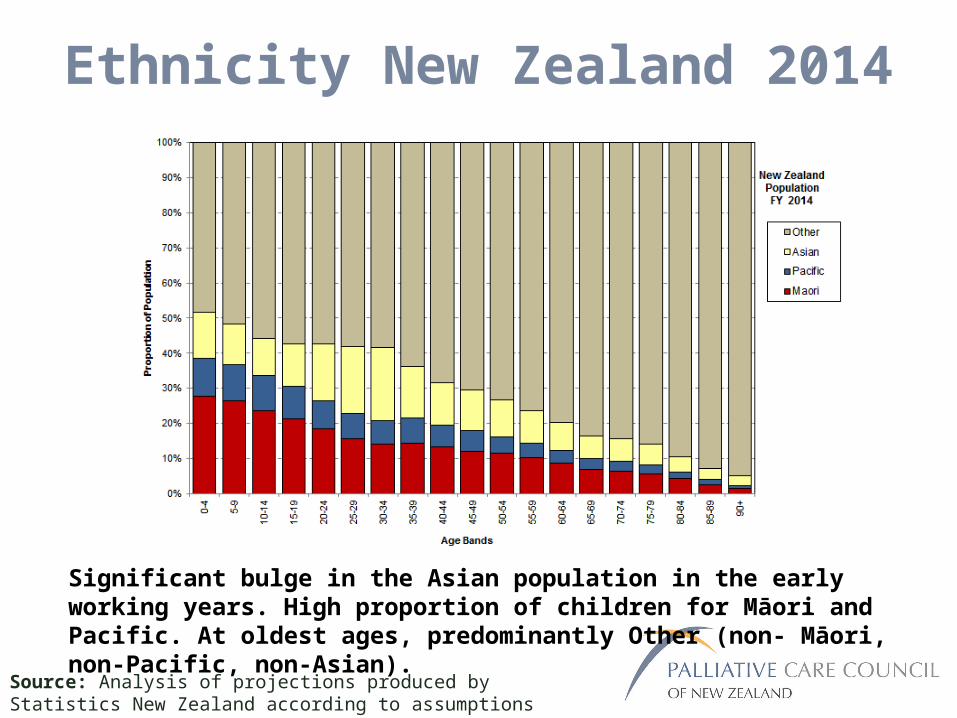
Ethnicity New Zealand 2014
Significant bulge in the Asian population in the early working years. High proportion of children for Māori and Pacific. At oldest ages, predominantly Other (non- Māori, non-Pacific, non-Asian).
Source: Analysis of projections produced by Statistics New Zealand according to assumptions specified by the Ministry of Health
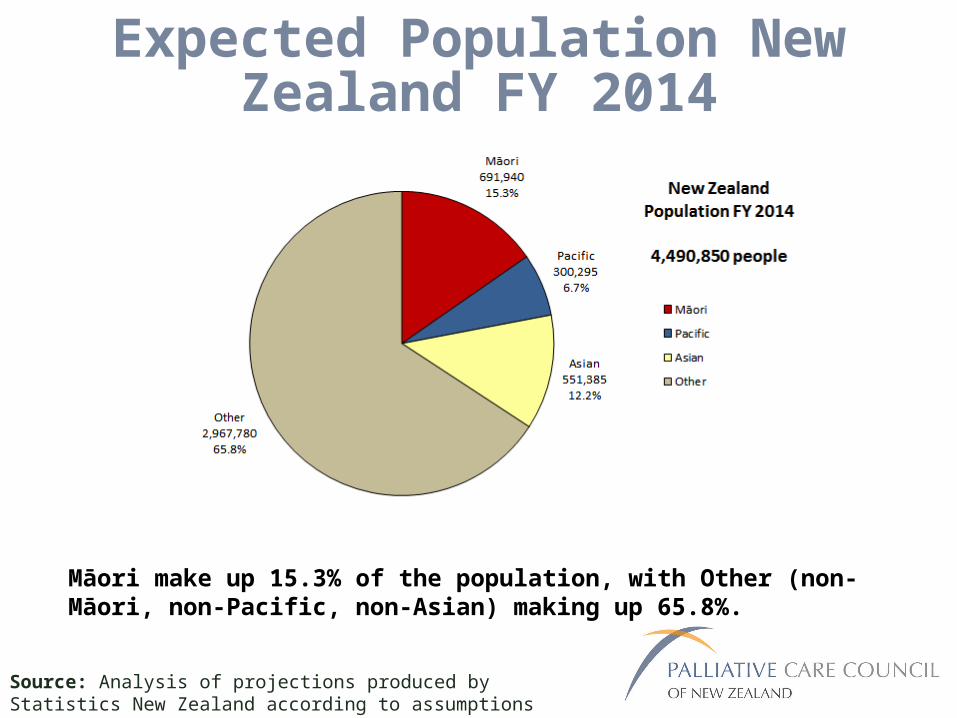
Expected Population New Zealand FY 2014
Māori make up 15.3% of the population, with Other (non- Māori, non-Pacific, non-Asian) making up 65.8%.
Source: Analysis of projections produced by Statistics New Zealand according to assumptions specified by the Ministry of Health
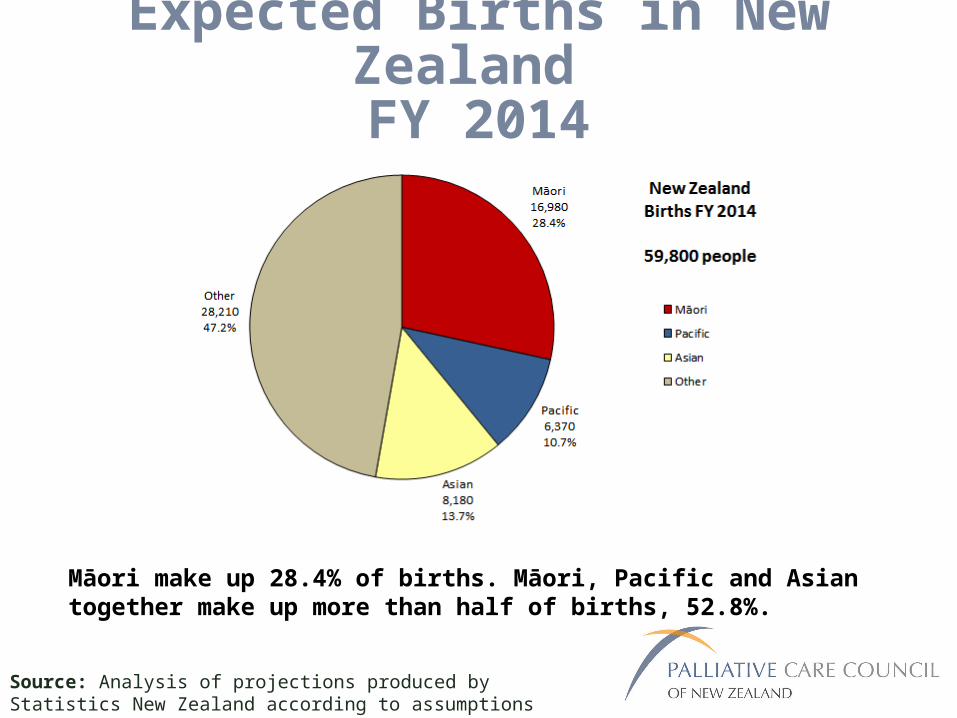
Expected Births in New Zealand FY 2014
Māori make up 28.4% of births. Māori, Pacific and Asian together make up more than half of births, 52.8%.
Source: Analysis of projections produced by Statistics New Zealand according to assumptions specified by the Ministry of Health
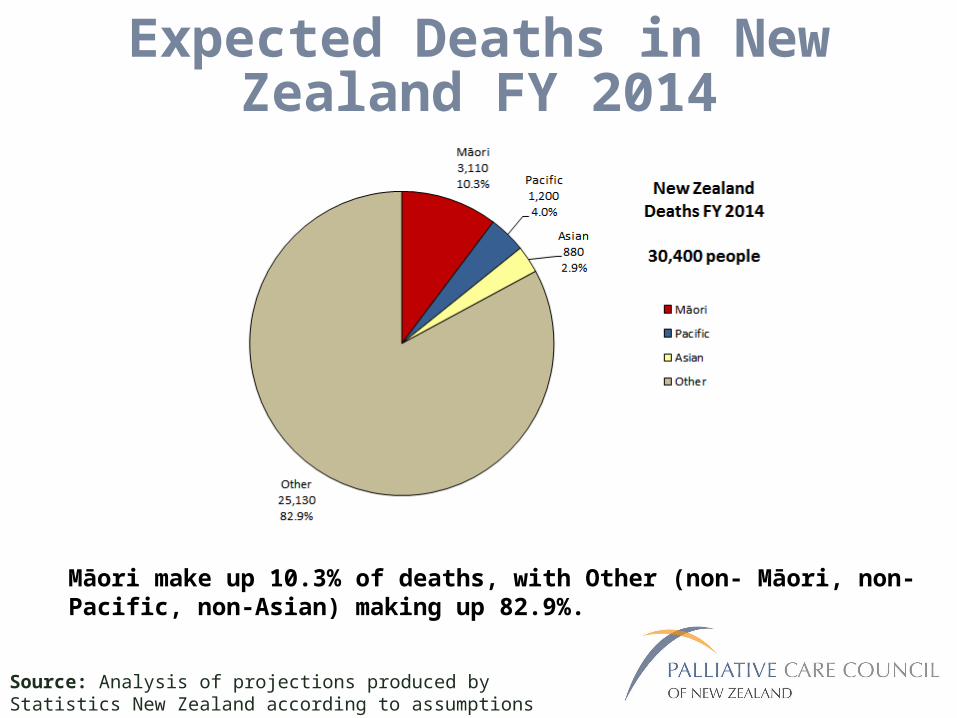
Expected Deaths in New Zealand FY 2014
Māori make up 10.3% of deaths, with Other (non- Māori, non-Pacific, non-Asian) making up 82.9%.
Source: Analysis of projections produced by Statistics New Zealand according to assumptions specified by the Ministry of Health
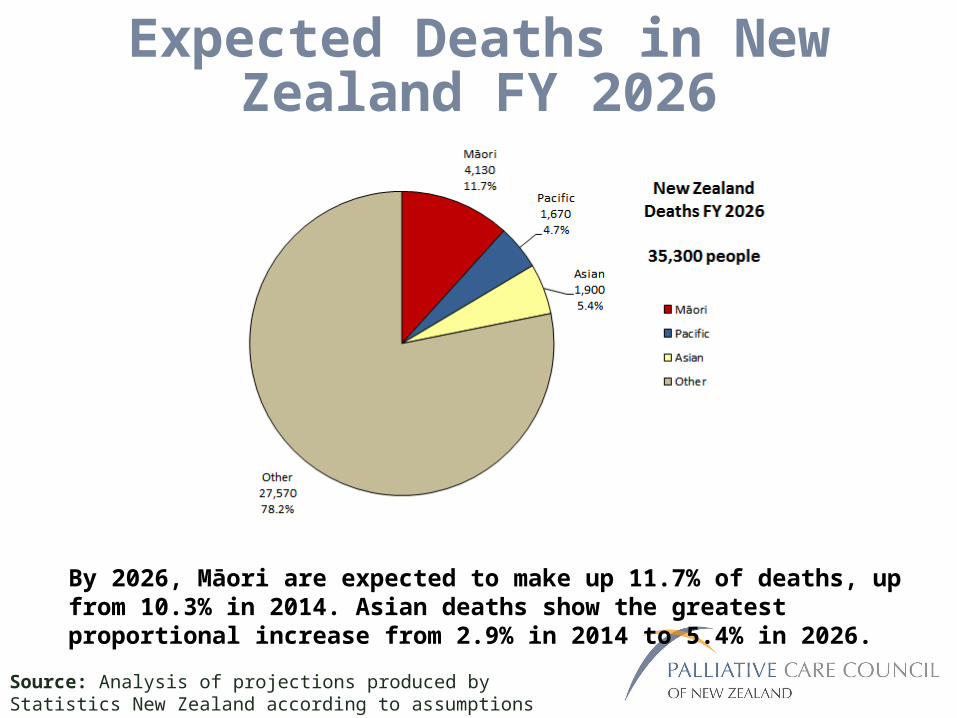
Expected Deaths in New Zealand FY 2026
By 2026, Māori are expected to make up 11.7% of deaths, up from 10.3% in 2014. Asian deaths show the greatest proportional increase from 2.9% in 2014 to 5.4% in 2026.
Source: Analysis of projections produced by Statistics New Zealand according to assumptions specified by the Ministry of Health
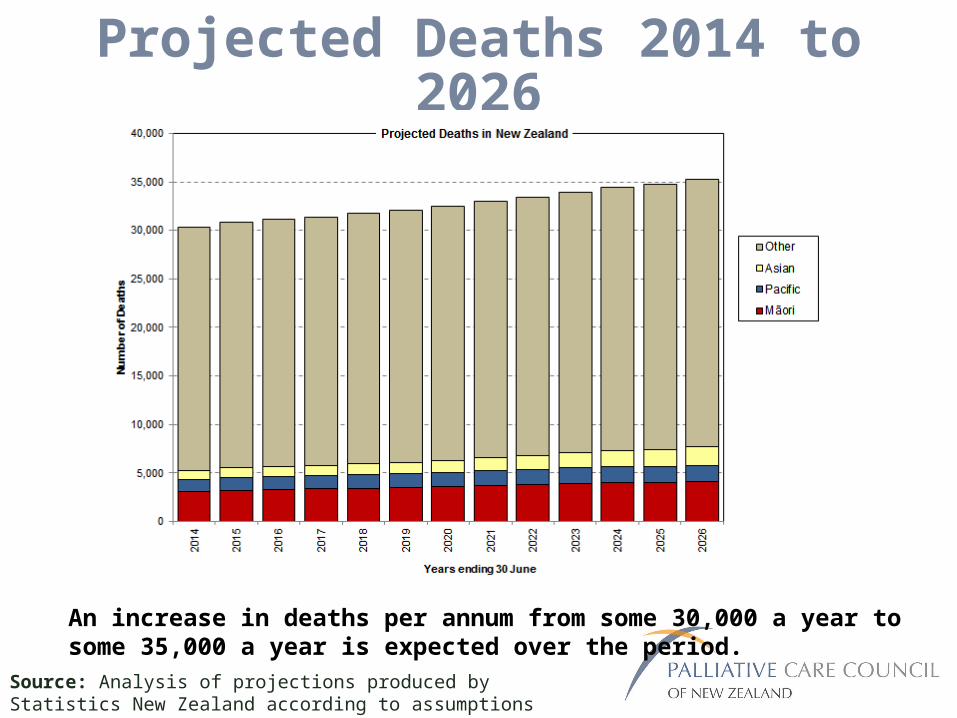
Projected Deaths 2014 to 2026
An increase in deaths per annum from some 30,000 a year to some 35,000 a year is expected over the period.
Source: Analysis of projections produced by Statistics New Zealand according to assumptions specified by the Ministry of Health
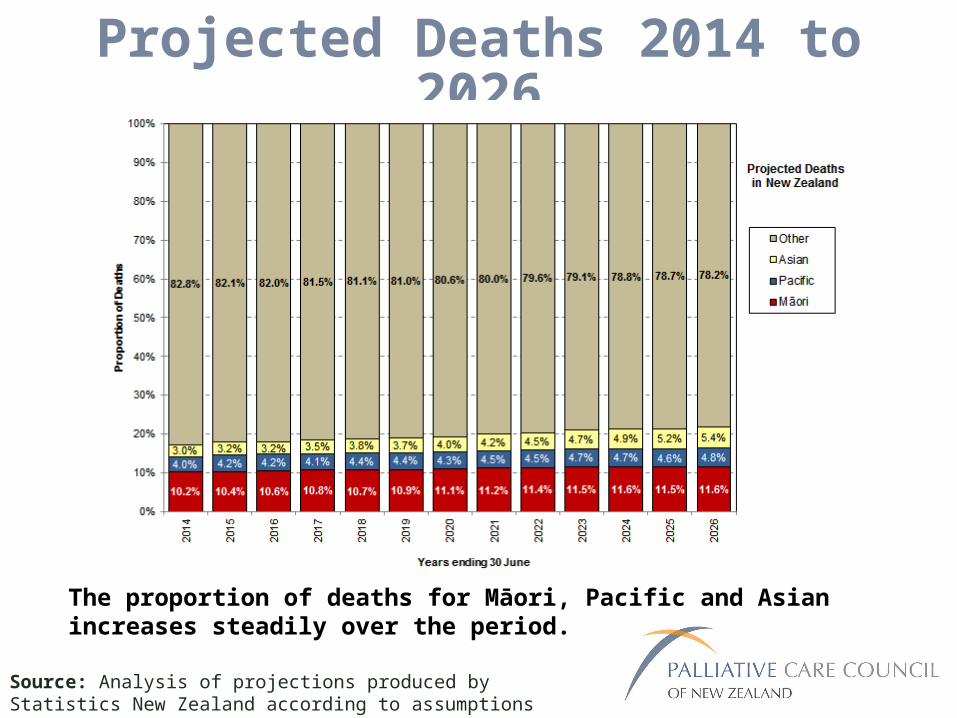
Projected Deaths 2014 to 2026
The proportion of deaths for Māori, Pacific and Asian increases steadily over the period.
Source: Analysis of projections produced by Statistics New Zealand according to assumptions specified by the Ministry of Health
Regional Projections
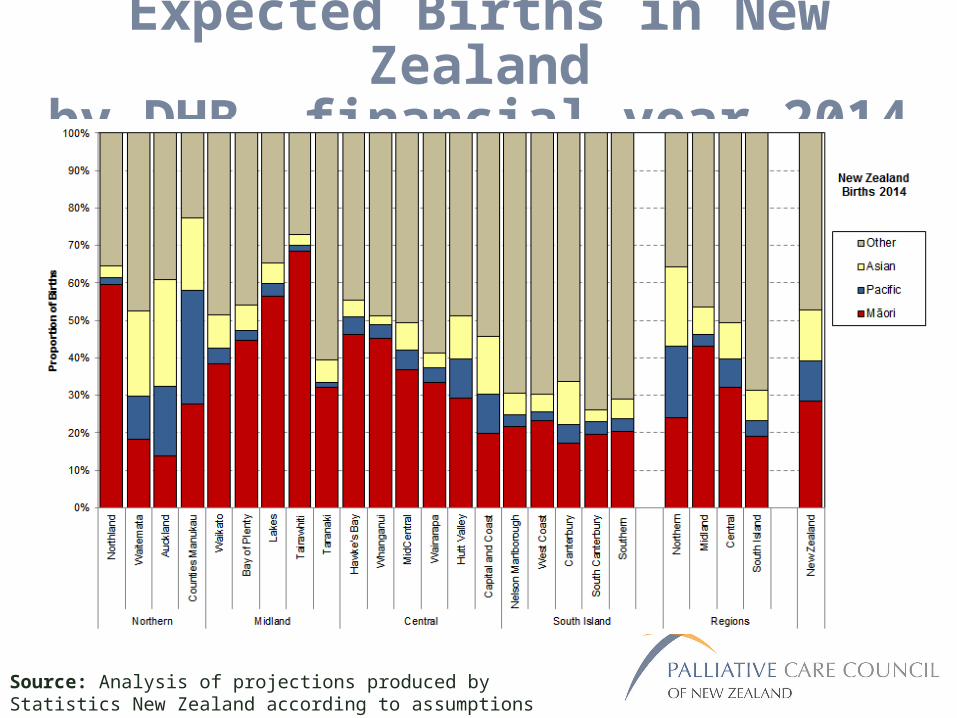
Expected Births in New Zealandby DHB, financial year 2014
T
Source: Analysis of projections produced by Statistics New Zealand according to assumptions specified by the Ministry of Health

Expected Deaths in New Zealand by DHB, financial year 2014
T
Source: Analysis of projections produced by Statistics New Zealand according to assumptions specified by the Ministry of Health

Deaths Relative to Births by Region
Source: Analysis of projections produced by Statistics New Zealand according to assumptions specified by the Ministry of Health
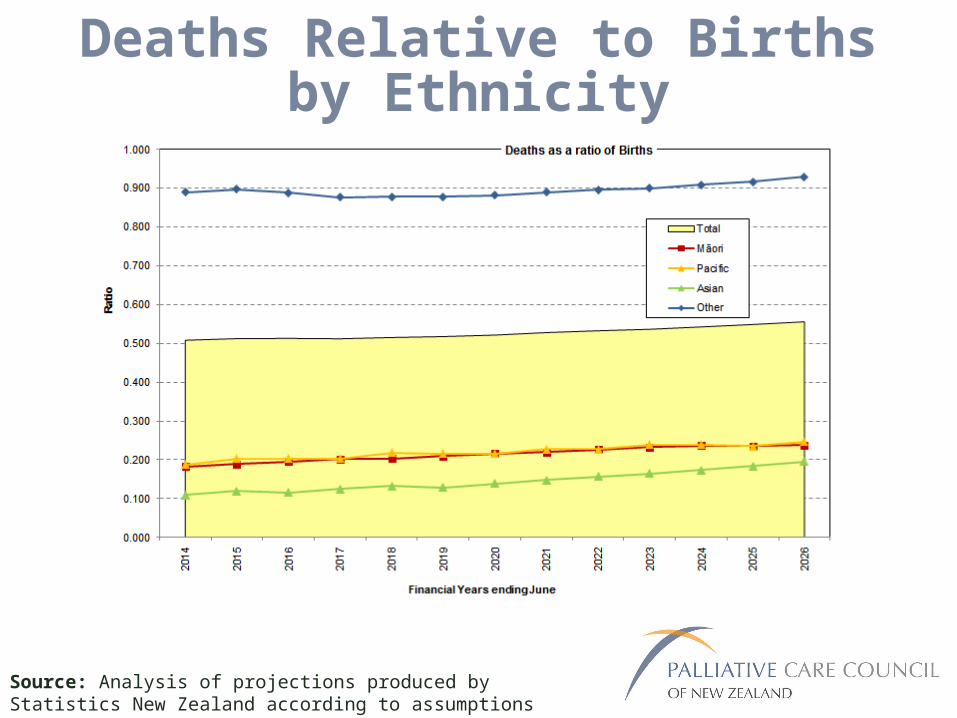
Deaths Relative to Birthsby Ethnicity
Source: Analysis of projections produced by Statistics New Zealand according to assumptions specified by the Ministry of Health
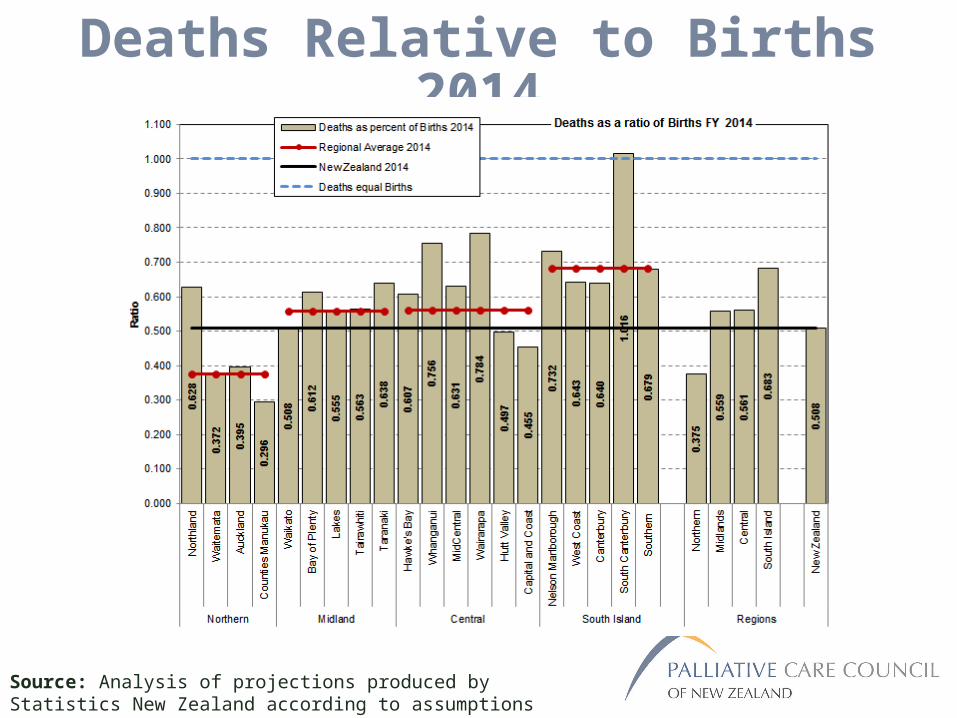
Deaths Relative to Births 2014
Source: Analysis of projections produced by Statistics New Zealand according to assumptions specified by the Ministry of Health
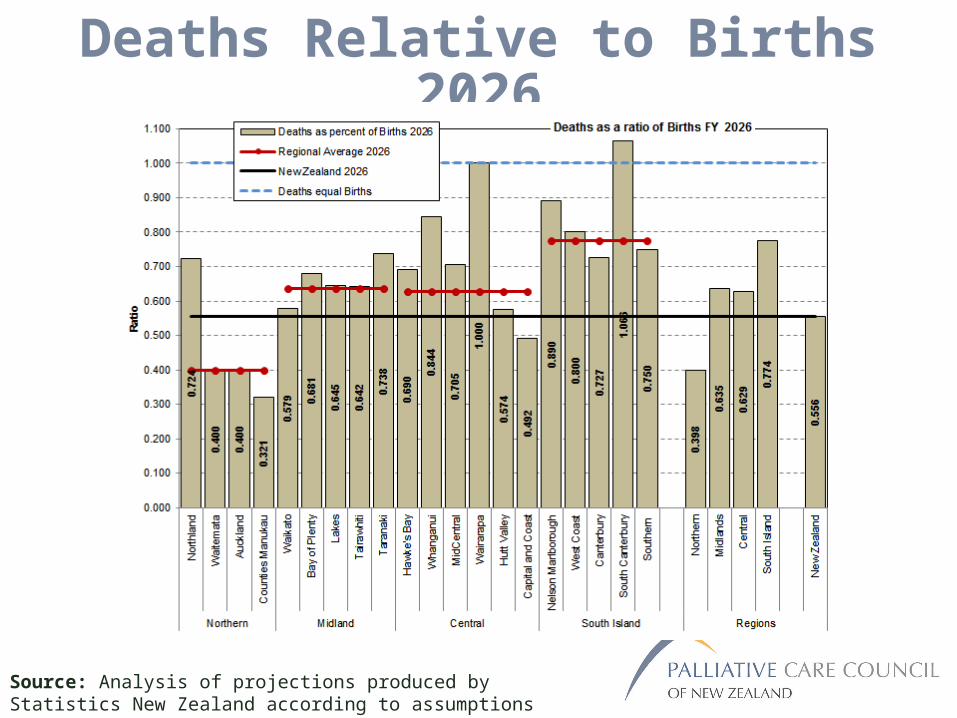
Deaths Relative to Births 2026
Source: Analysis of projections produced by Statistics New Zealand according to assumptions specified by the Ministry of Health
Commentary
Very different patterns of births and deaths by ethnicity in different DHBs and hence regions.
Deaths are expected to exceed births in South Canterbury in 2014. Wairarapa may reach this mark by 2026 and most DHBs will see an increase in the proportion of deaths relative to births.
By 2026, the ratio of deaths to births in the South Island region could be 0.774 (with 1.000 being when deaths equal births).
For New Zealand as a whole, the ratio of deaths to births is expected to increase from 0.508 in 2014 to 0.556 by 2026.
Ageing of Deaths
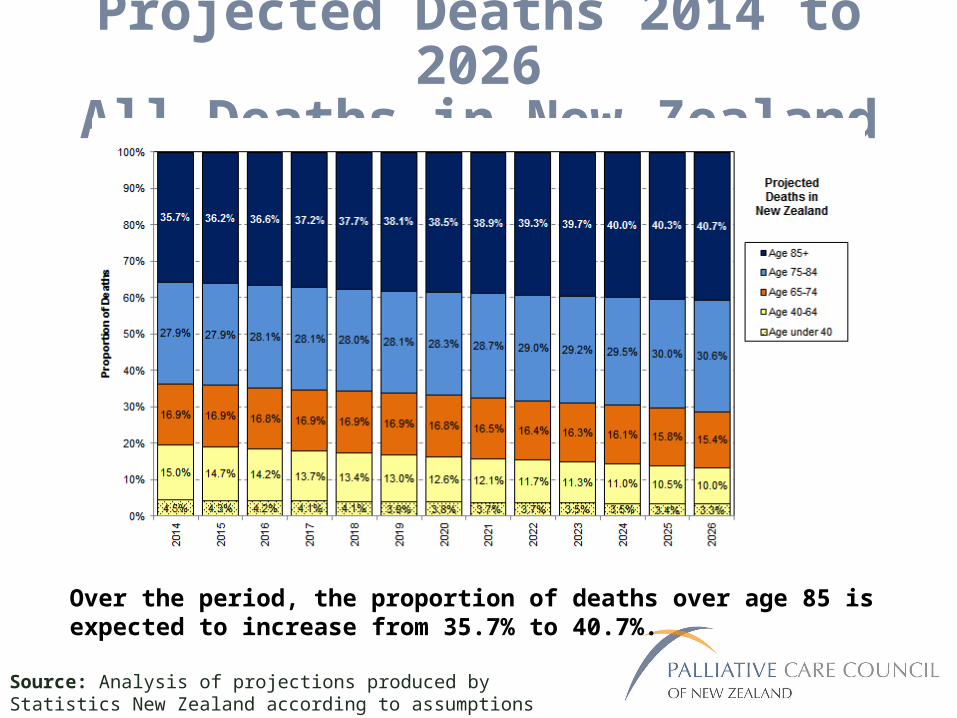
Projected Deaths 2014 to 2026All Deaths in New Zealand
Over the period, the proportion of deaths over age 85 is expected to increase from 35.7% to 40.7%.
Source: Analysis of projections produced by Statistics New Zealand according to assumptions specified by the Ministry of Health
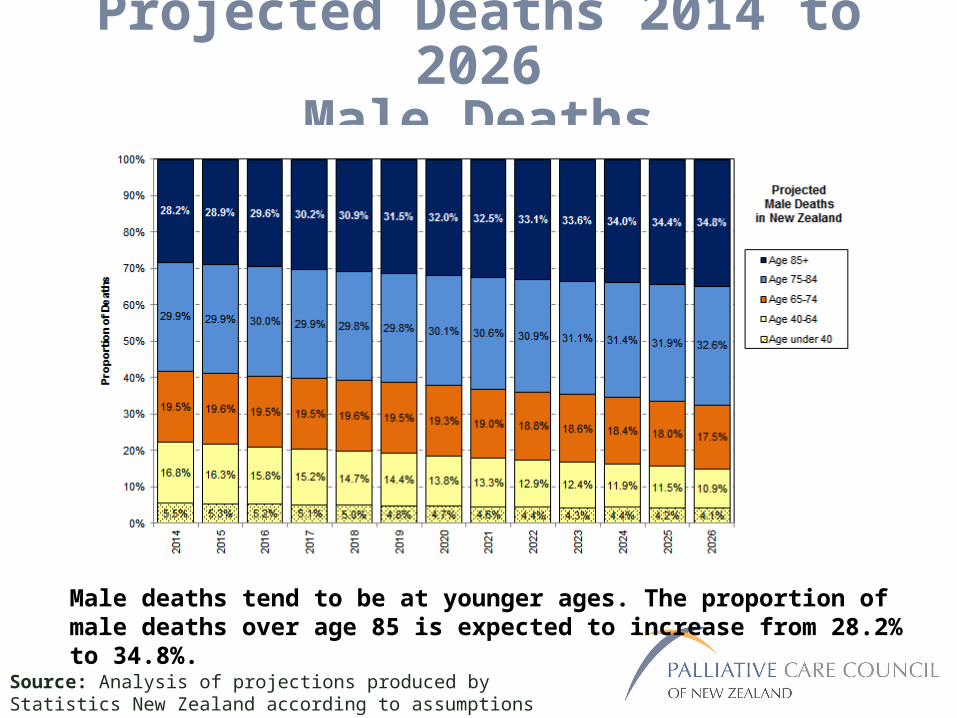
Projected Deaths 2014 to 2026Male Deaths
Source: Analysis of projections produced by Statistics New Zealand according to assumptions specified by the Ministry of Health
Male deaths tend to be at younger ages. The proportion of male deaths over age 85 is expected to increase from 28.2% to 34.8%.
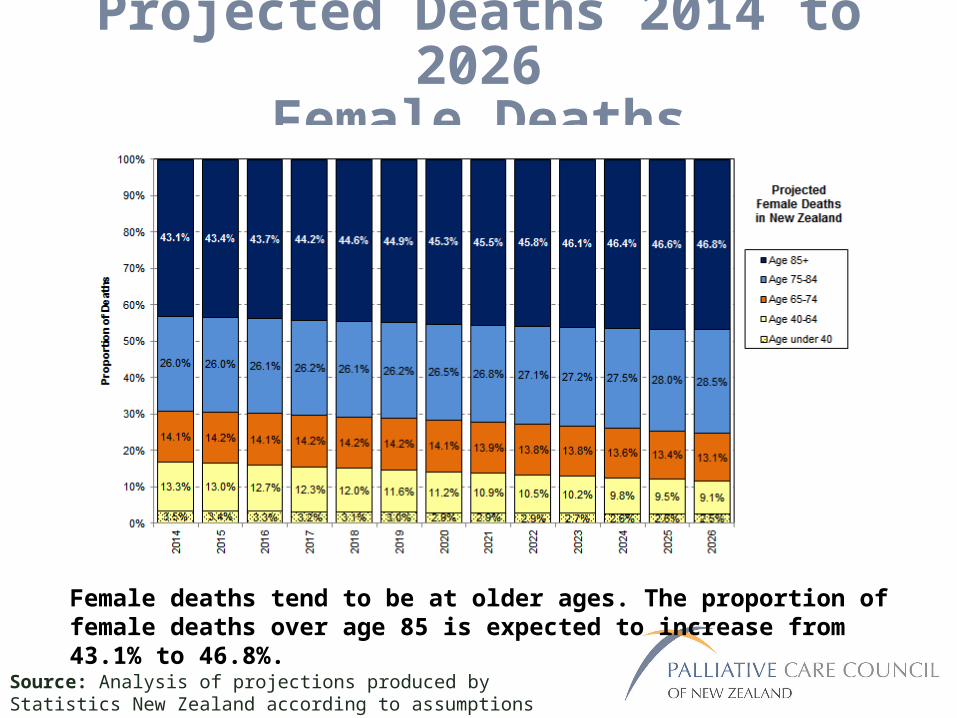
Projected Deaths 2014 to 2026Female Deaths
Source: Analysis of projections produced by Statistics New Zealand according to assumptions specified by the Ministry of Health
Female deaths tend to be at older ages. The proportion of female deaths over age 85 is expected to increase from 43.1% to 46.8%.
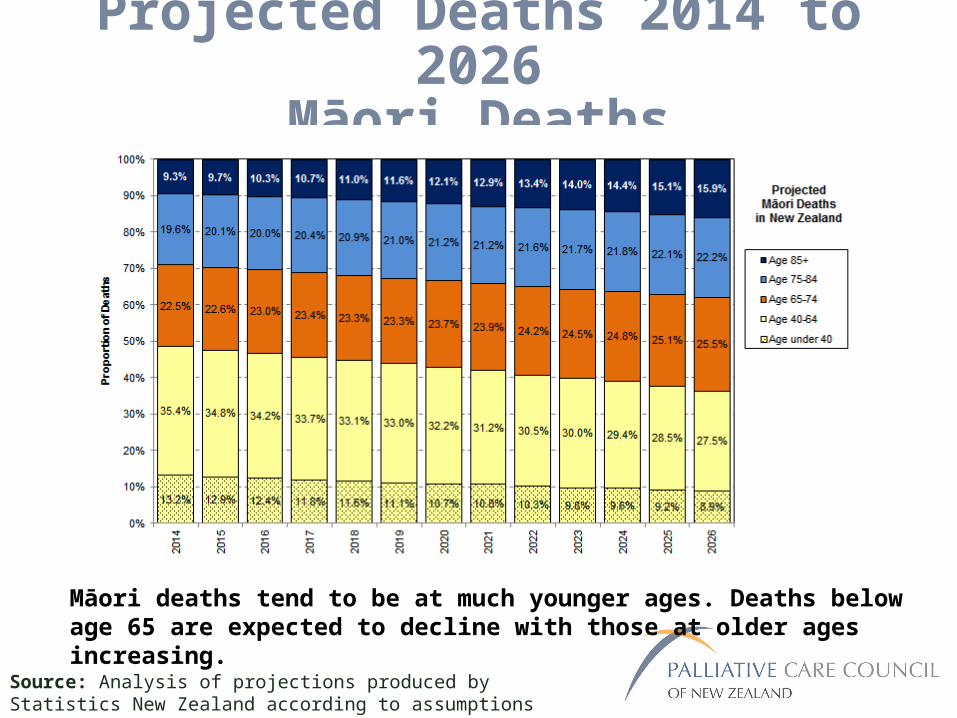
Projected Deaths 2014 to 2026Māori Deaths
Source: Analysis of projections produced by Statistics New Zealand according to assumptions specified by the Ministry of Health
Māori deaths tend to be at much younger ages. Deaths below age 65 are expected to decline with those at older ages increasing.
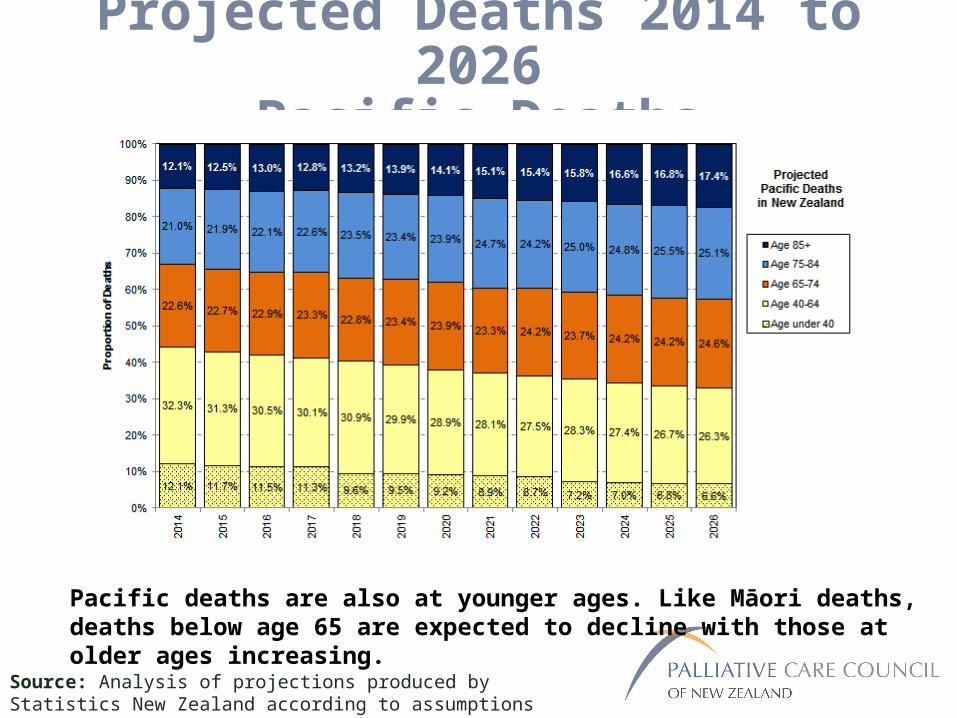
Projected Deaths 2014 to 2026Pacific Deaths
Source: Analysis of projections produced by Statistics New Zealand according to assumptions specified by the Ministry of Health
Pacific deaths are also at younger ages. Like Māori deaths, deaths below age 65 are expected to decline with those at older ages increasing.
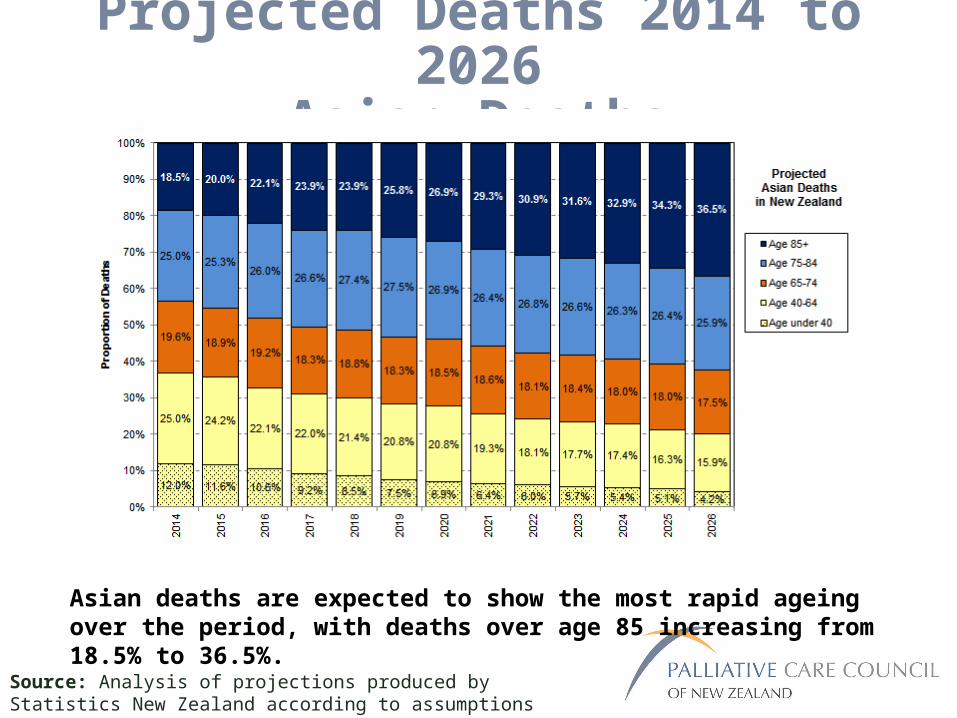
Projected Deaths 2014 to 2026Asian Deaths
Source: Analysis of projections produced by Statistics New Zealand according to assumptions specified by the Ministry of Health
Asian deaths are expected to show the most rapid ageing over the period, with deaths over age 85 increasing from 18.5% to 36.5%.
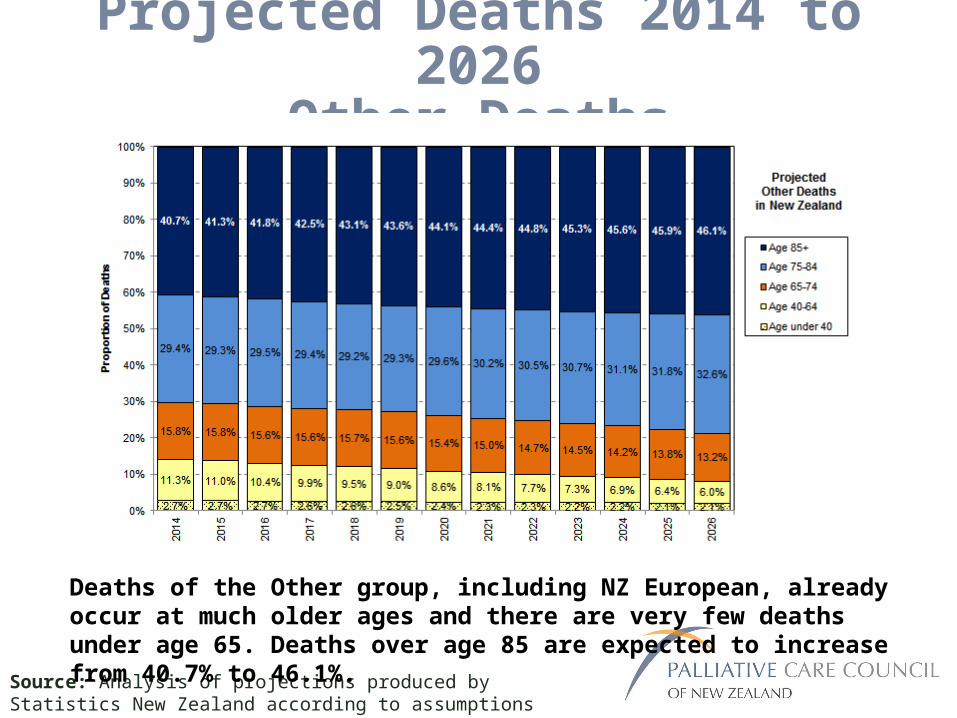
Projected Deaths 2014 to 2026Other Deaths
Source: Analysis of projections produced by Statistics New Zealand according to assumptions specified by the Ministry of Health
Deaths of the Other group, including NZ European, already occur at much older ages and there are very few deaths under age 65. Deaths over age 85 are expected to increase from 40.7% to 46.1%.
Commentary
The age structures of the population for the four ethnic groups are very different. This impacts the age structure of deaths and each ethnicity has a distinctive pattern.
For all ethnic groups, the proportion of deaths at older ages is expected to increase over the period.
The proportion of deaths at older ages is already high for the Other group, which includes NZ European.
The proportion of deaths at older ages will rise rapidly for Māori and Pacific deaths, and most rapidly for Asian deaths.

Change in Numbers of Deaths
Indexed 2014=100
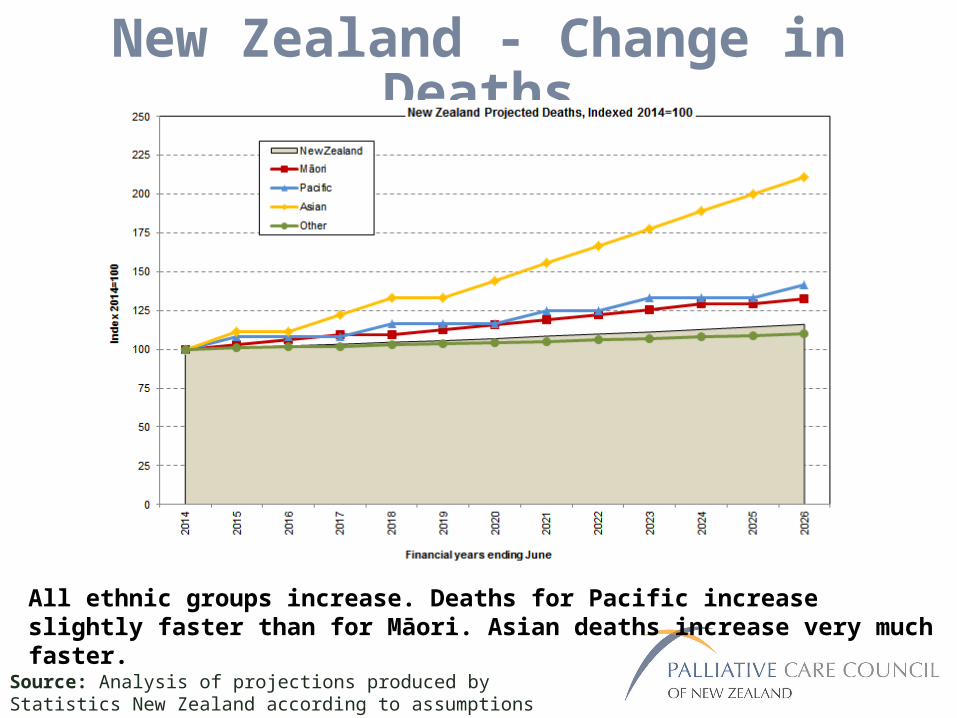
New Zealand - Change in Deaths
Source: Analysis of projections produced by Statistics New Zealand according to assumptions specified by the Ministry of Health
All ethnic groups increase. Deaths for Pacific increase slightly faster than for Māori. Asian deaths increase very much faster.
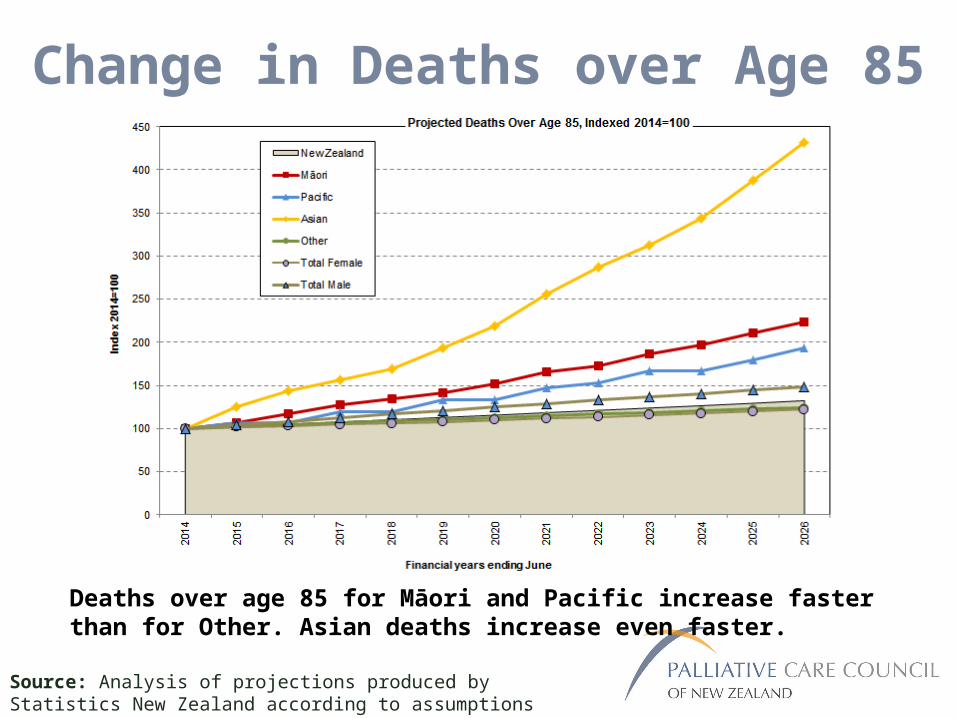
Change in Deaths over Age 85
Source: Analysis of projections produced by Statistics New Zealand according to assumptions specified by the Ministry of Health
Deaths over age 85 for Māori and Pacific increase faster than for Other. Asian deaths increase even faster.
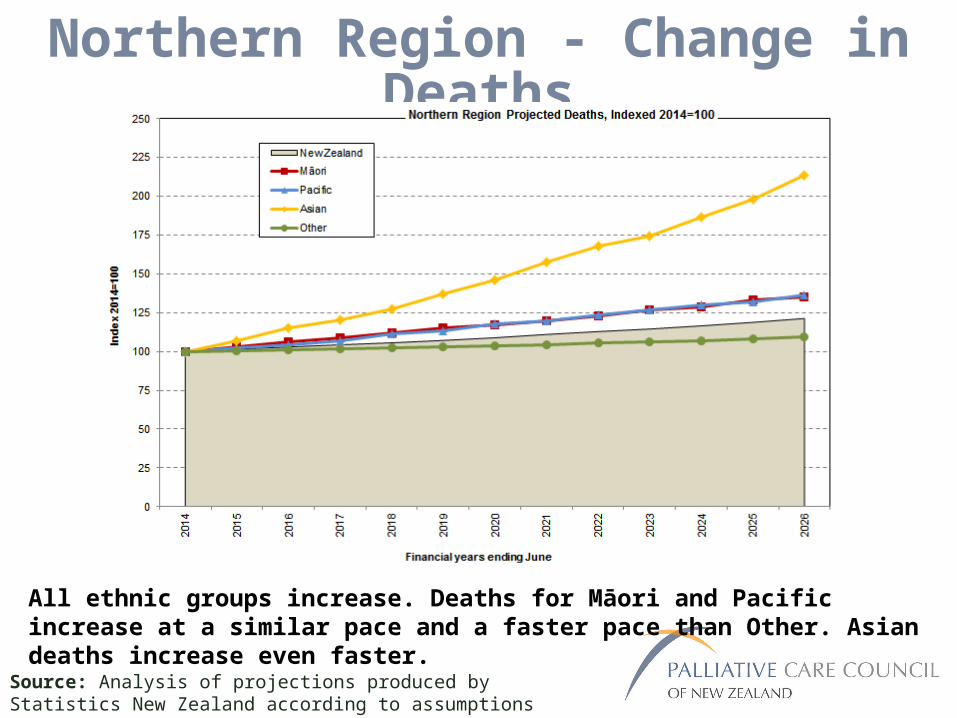
Northern Region - Change in Deaths
Source: Analysis of projections produced by Statistics New Zealand according to assumptions specified by the Ministry of Health
All ethnic groups increase. Deaths for Māori and Pacific increase at a similar pace and a faster pace than Other. Asian deaths increase even faster.
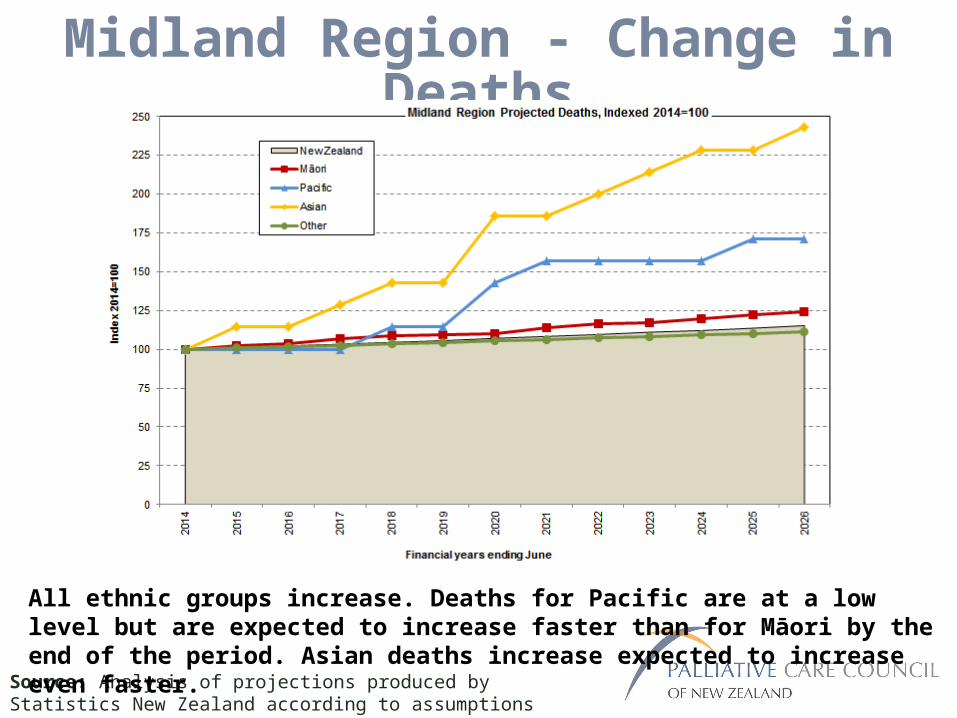
Midland Region - Change in Deaths
Source: Analysis of projections produced by Statistics New Zealand according to assumptions specified by the Ministry of Health
All ethnic groups increase. Deaths for Pacific are at a low level but are expected to increase faster than for Māori by the end of the period. Asian deaths increase expected to increase even faster.
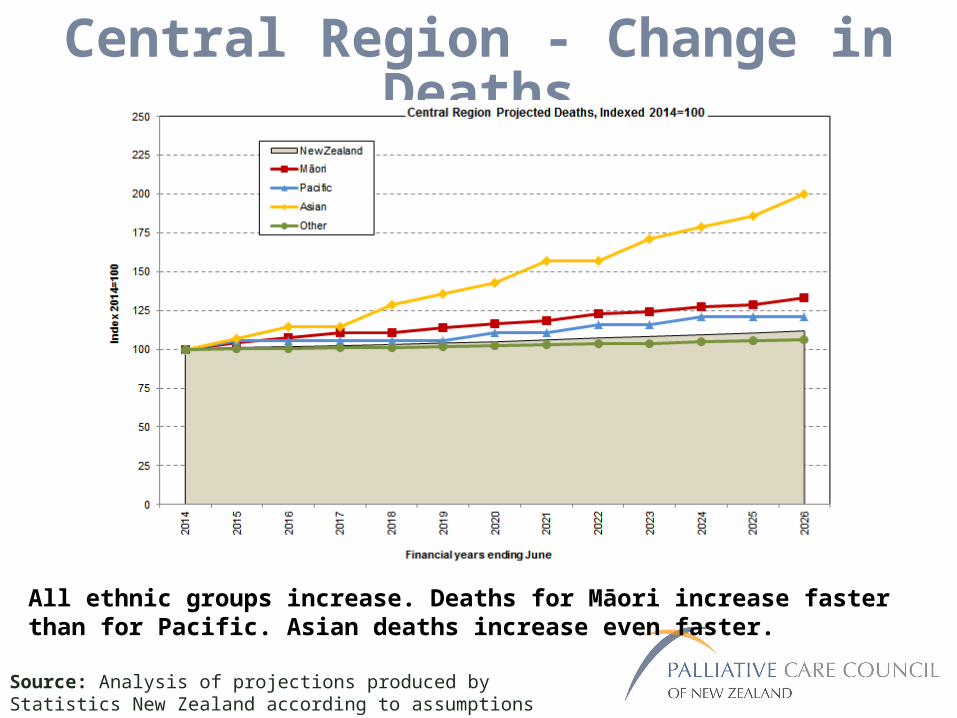
Central Region - Change in Deaths
Source: Analysis of projections produced by Statistics New Zealand according to assumptions specified by the Ministry of Health
All ethnic groups increase. Deaths for Māori increase faster than for Pacific. Asian deaths increase even faster.
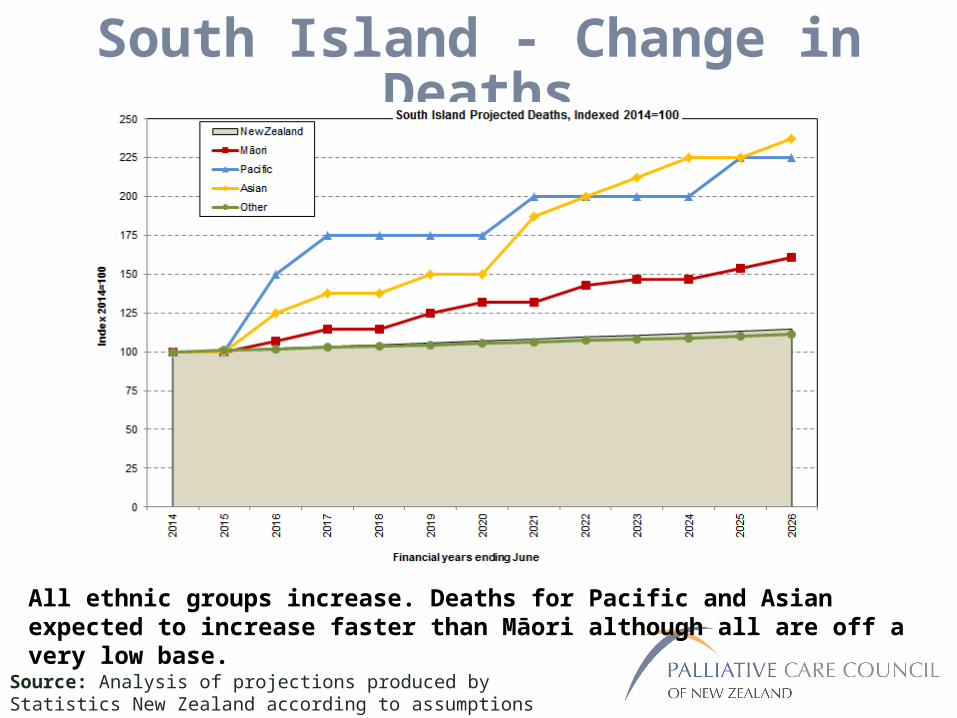
South Island - Change in Deaths
Source: Analysis of projections produced by Statistics New Zealand according to assumptions specified by the Ministry of Health
All ethnic groups increase. Deaths for Pacific and Asian expected to increase faster than Māori although all are off a very low base.
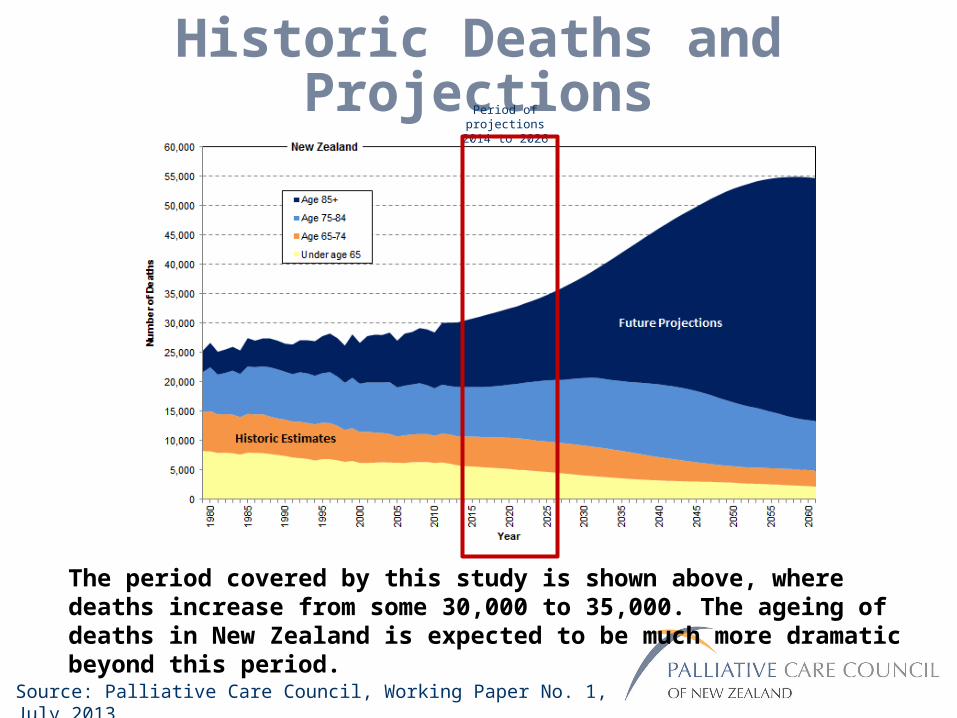
Historic Deaths and Projections
The period covered by this study is shown above, where deaths increase from some 30,000 to 35,000. The ageing of deaths in New Zealand is expected to be much more dramatic beyond this period.
Source: Palliative Care Council, Working Paper No. 1, July 2013.
Period of projections2014 to 2026
Prof Heather McLeod
Senior Analyst, Palliative CareCancer Control New Zealand
Office of the CMOMinistry of Health
www.cancercontrolnz.govt.nz/palliative-care
Email: [email protected] Mobile: 0210 279 7425