death, taxes, and rising health care costs
DESCRIPTION
Death, Taxes, and Rising Health Care Costs. Robert E. Hurley, Ph.D. Virginia Commonwealth University. Session Overview. Cost pressures The move to managed care Early success; later decline Consequences for States Private sector responses Tasks before you. - PowerPoint PPT PresentationTRANSCRIPT
Death, Taxes, and Rising Health Care Costs
Robert E. Hurley, Ph.D.Virginia Commonwealth University

Hurley # 2
Session Overview
Cost pressures The move to managed care Early success; later decline Consequences for States Private sector responses Tasks before you
Hurley # 3
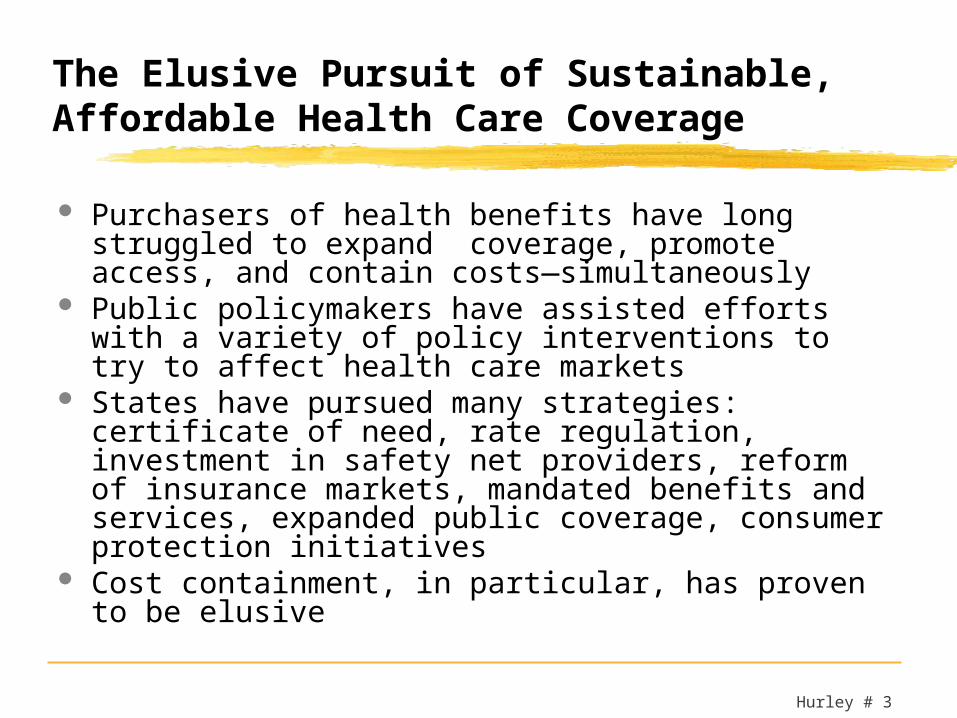
The Elusive Pursuit of Sustainable, Affordable Health Care Coverage
Purchasers of health benefits have long struggled to expand coverage, promote access, and contain costs—simultaneously
Public policymakers have assisted efforts with a variety of policy interventions to try to affect health care markets
States have pursued many strategies: certificate of need, rate regulation, investment in safety net providers, reform of insurance markets, mandated benefits and services, expanded public coverage, consumer protection initiatives
Cost containment, in particular, has proven to be elusive

Hurley # 4
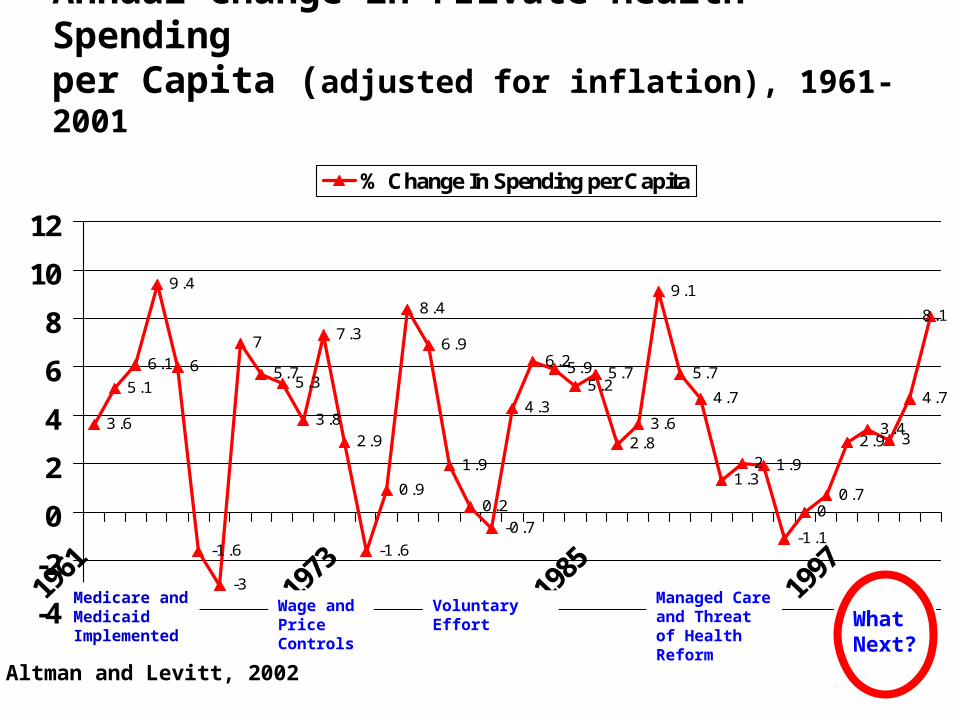
Annual Change in Private Health Spending per Capita (Adjusted for Inflation), 1961-2001
3.6
5.16.1
9.4
6
-1.6
-3
75.75.3
3.8
7.3
2.9
-1.6
0.9
8.4
6.9
1.9
0.2-0.7
4.3
6.25.95.25.7
2.83.6
9.1
5.74.7
1.32 1.9
-1.10
0.7
2.93.43
4.7
8.1
-4
-2
0
2
4
6
8
10
12% Change in Spending per Capita
Medicare and Medicaid Implemented
Voluntary Effort
Managed Care and Threat of Health Reform
Wage and Price Controls
Altman and Levitt, 2002
9.1

• Aged (>65)• Disabled• Low income
• Employee • Dependents
Insurancecarrier/Health
plan/TPADirectPurchase
DirectPurchase
Health Care Providers
Government Employer80 mil. 170 mil.
Uninsured = 45 mil.
The U.S. Health System ― A Simplified View

Hurley # 6
Employer/Sponsored Indemnity Coverage
A system built around spending someone else’s money . . .and an unmanaged system, at that
Employer sponsorship―subsidized premiums and limited cost sharing, health benefits as non-cash compensation shielded from income tax
Indemnity―freedom of choice of providers, providers fees not negotiated, little/no medical management, varied benefit packages
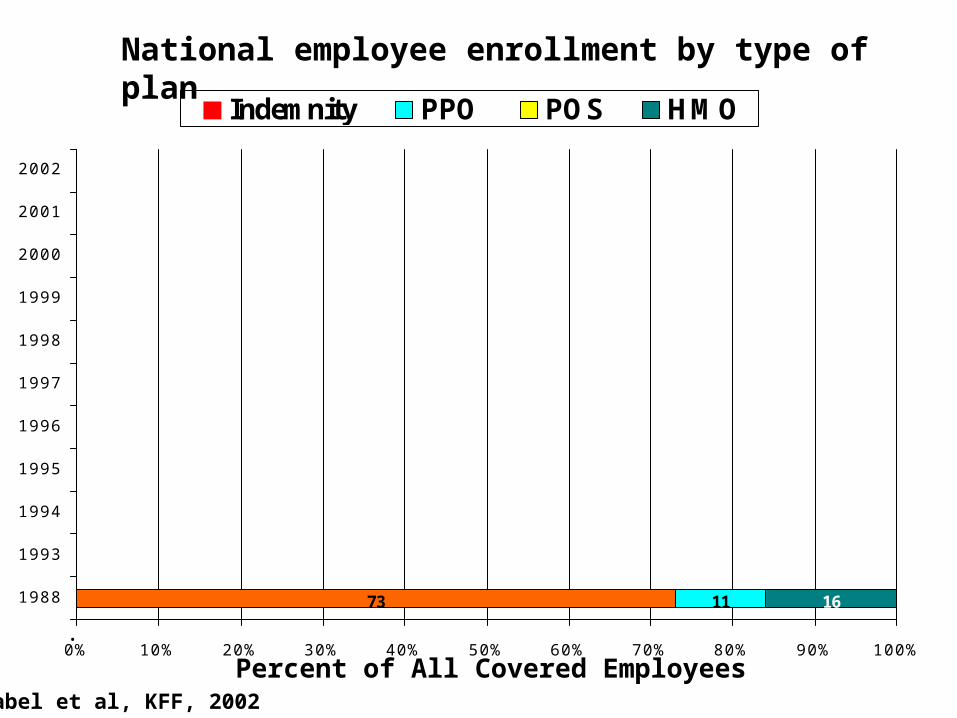
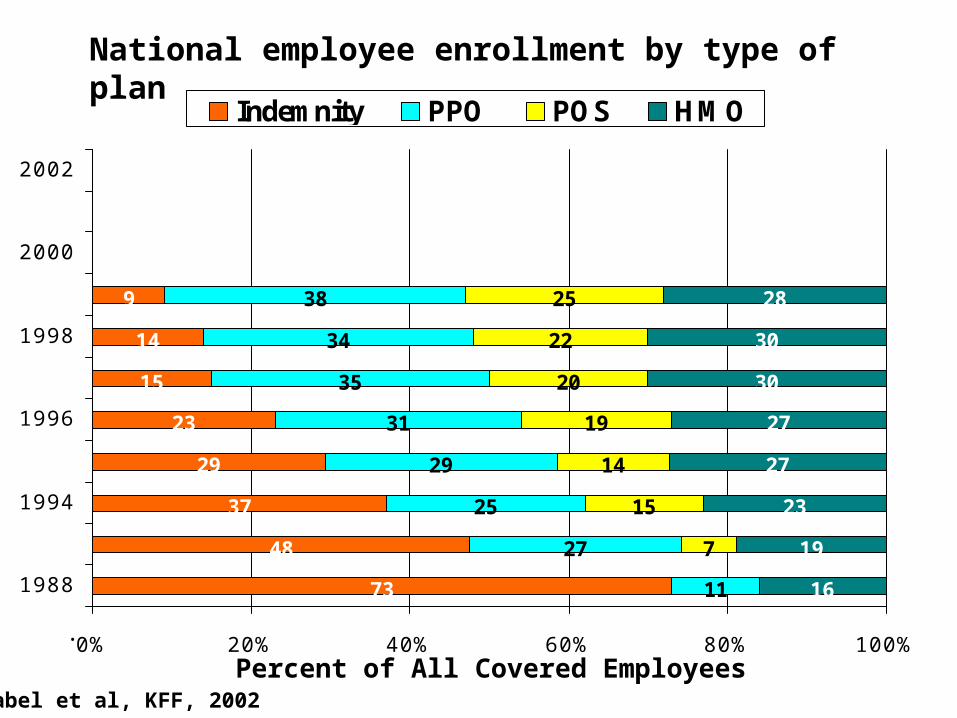
73 11 16
0% 10% 20% 30% 40% 50% 60% 70% 80% 90% 100%
1988
1993
1994
1995
1996
1997
1998
1999
2000
2001
2002
Indemnity PPO POS HMO
Percent of All Covered Employees.
National employee enrollment by type of plan
Gabel et al, KFF, 2002
Hurley # 8
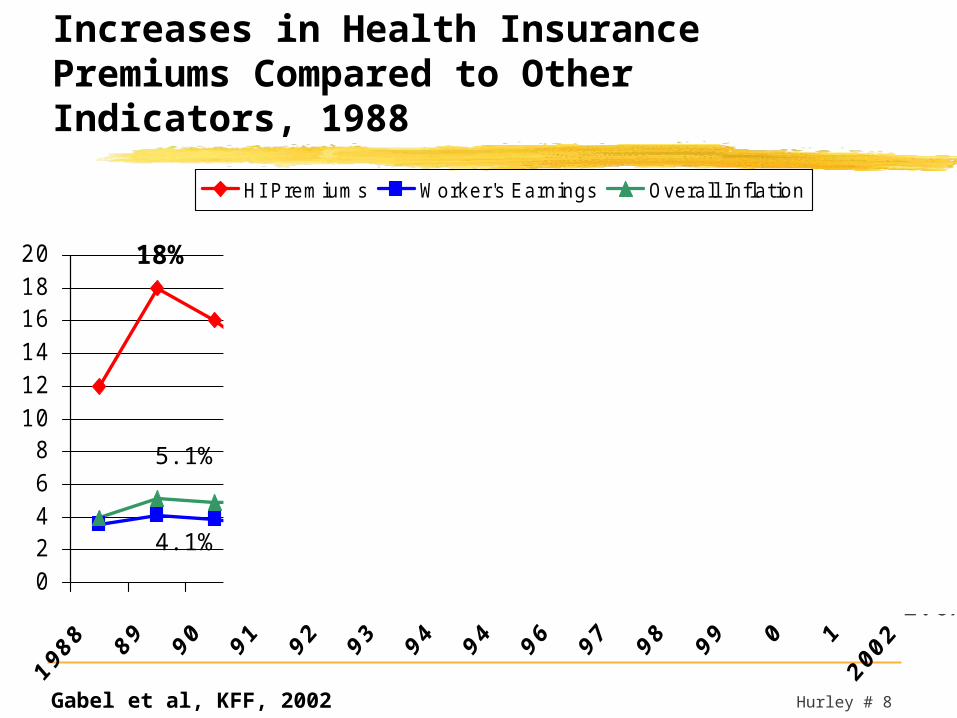
Increases in Health Insurance Premiums Compared to Other Indicators, 1988
02468
101214161820
HI P remiums Worker's Earnings Overall Inflation
18%
12.7%8.5%
8.3%
4.8% 3.4%
1.6%
Gabel et al, KFF, 2002
5.1%
4.1%
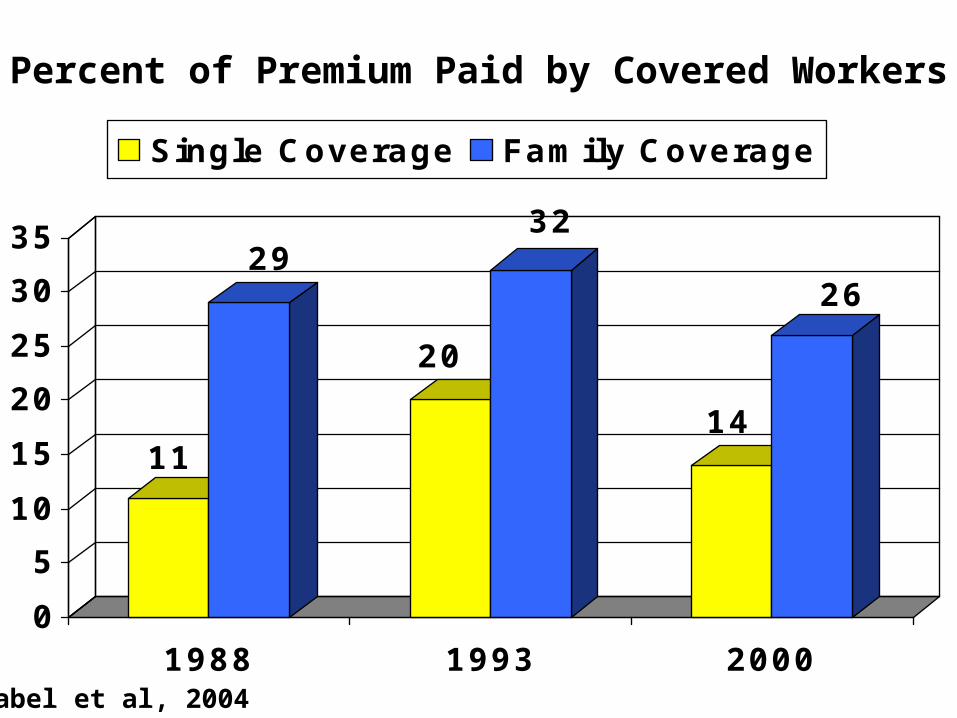
Percent of Premium Paid by Covered Workers
11
29
20
32
14
26
05
101520253035
1988 1993 2000
Single Coverage Family Coverage
Gabel et al, 2004

Hurley # 10
The Purchaser Revolution
The employers make their move
Hurley # 11
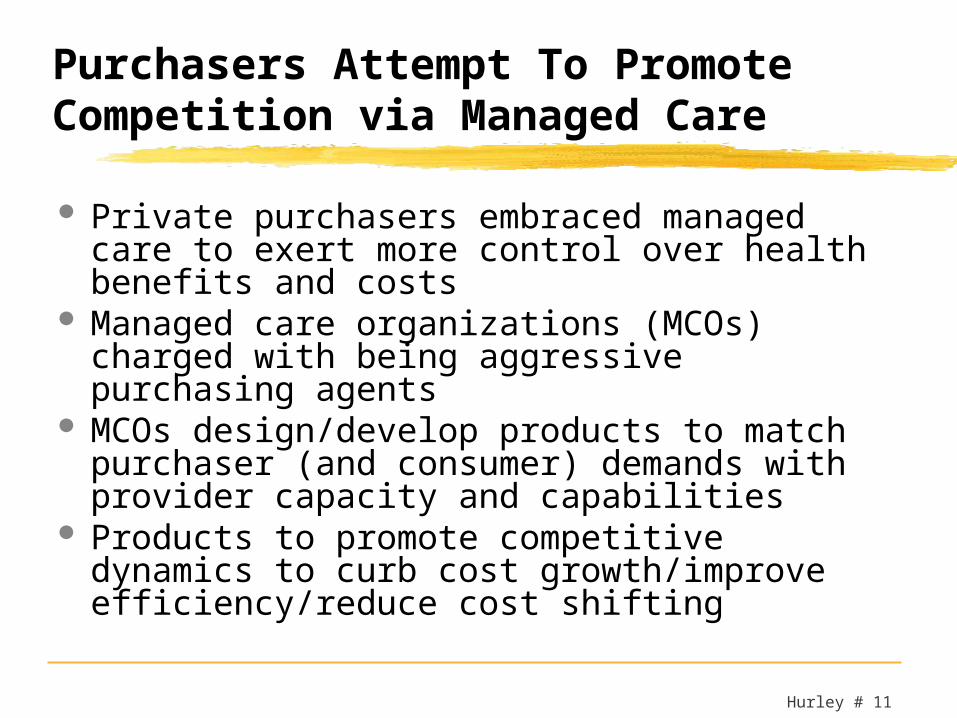
Purchasers Attempt To Promote Competition via Managed Care
Private purchasers embraced managed care to exert more control over health benefits and costs
Managed care organizations (MCOs) charged with being aggressive purchasing agents
MCOs design/develop products to match purchaser (and consumer) demands with provider capacity and capabilities
Products to promote competitive dynamics to curb cost growth/improve efficiency/reduce cost shifting
Hurley # 12
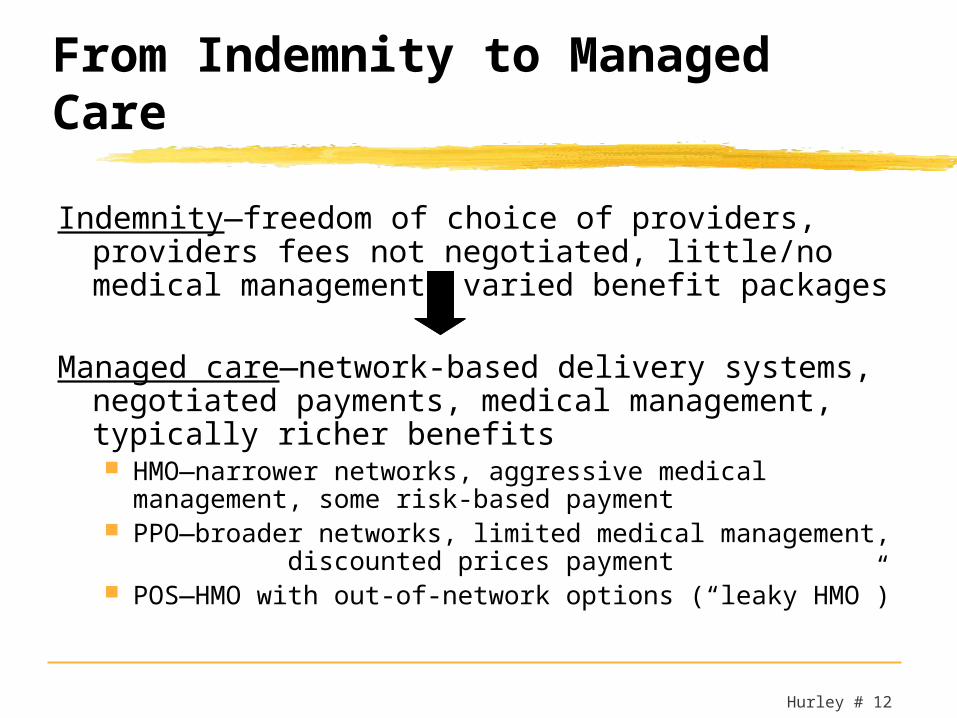
From Indemnity to Managed Care
Indemnity—freedom of choice of providers, providers fees not negotiated, little/no medical management, varied benefit packages
Managed care—network-based delivery systems, negotiated payments, medical management, typically richer benefits HMO—narrower networks, aggressive medical
management, some risk-based payment PPO—broader networks, limited medical management,
discounted prices payment POS—HMO with out-of-network options (“leaky HMO”)
73
48
37
29
23
15
14
9
11
27
25
29
31
35
34
38
7
15
14
19
20
22
25
16
19
23
27
27
30
30
28
0% 20% 40% 60% 80% 100%
1988
1994
1996
1998
2000
2002
Indemnity PPO POS HMO
Percent of All Covered Employees.
National employee enrollment by type of plan
Gabel et al, KFF, 2002
Hurley # 14
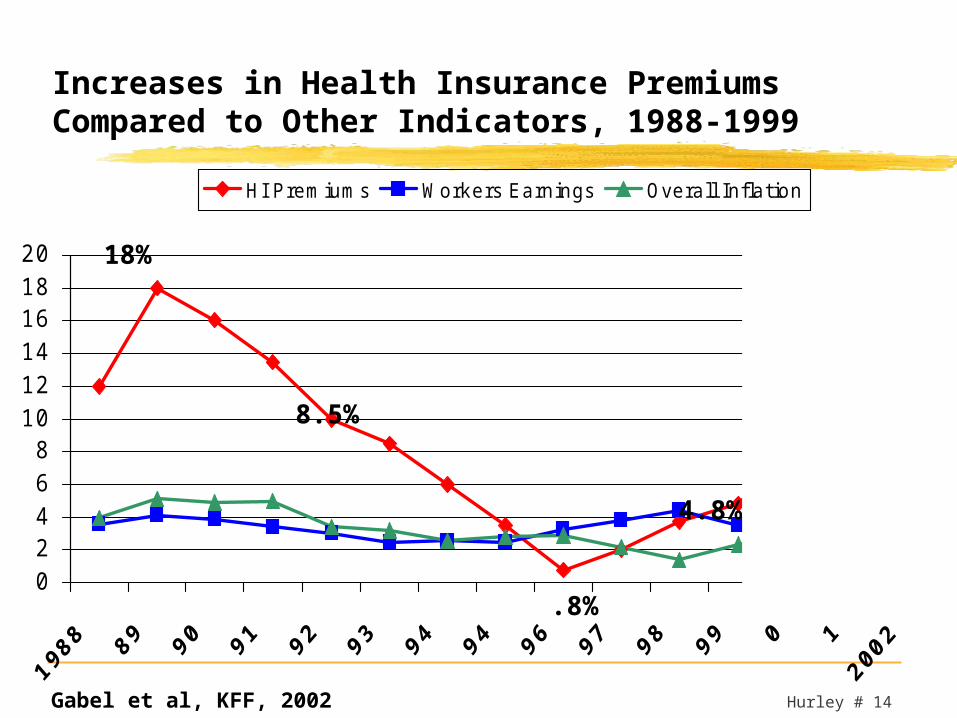
Increases in Health Insurance Premiums Compared to Other Indicators, 1988-1999
02468
101214161820
HI P remiums Workers Earnings Overall Inflation
18%
12.7%8.5%
8.3%
4.8% 3.4%
.8% 1.6%
Gabel et al, KFF, 2002

Hurley # 15
State Governments In 1990s Hitched Their Wagons to Managed Care and Market-based Models
State employee health benefits programs came to rely extensively on managed care products
By 2000, more than half (56%) of Medicaid beneficiaries enrolled in managed care arrangements
Many States enrolled SCHIP eligible children in managed care plans
Sustainability of coverage expansions conditioned on expectation of controlling cost increases
States promoted coverage and benefit expansions with various mandates on health plans
Hurley # 16
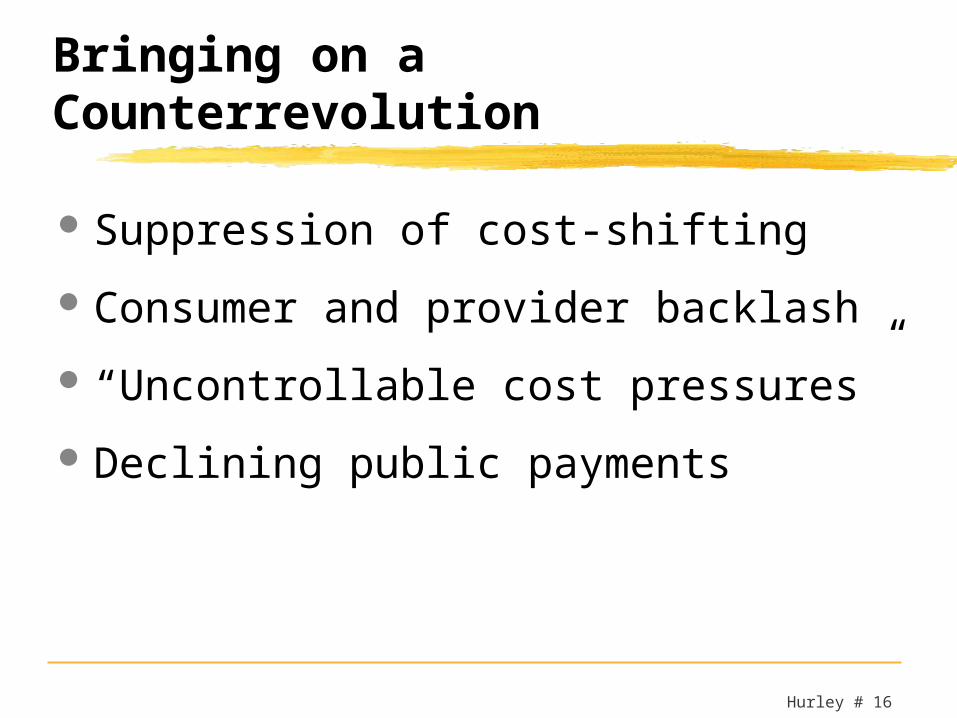
Bringing on a Counterrevolution
Suppression of cost-shifting Consumer and provider backlash “Uncontrollable cost pressures” Declining public payments
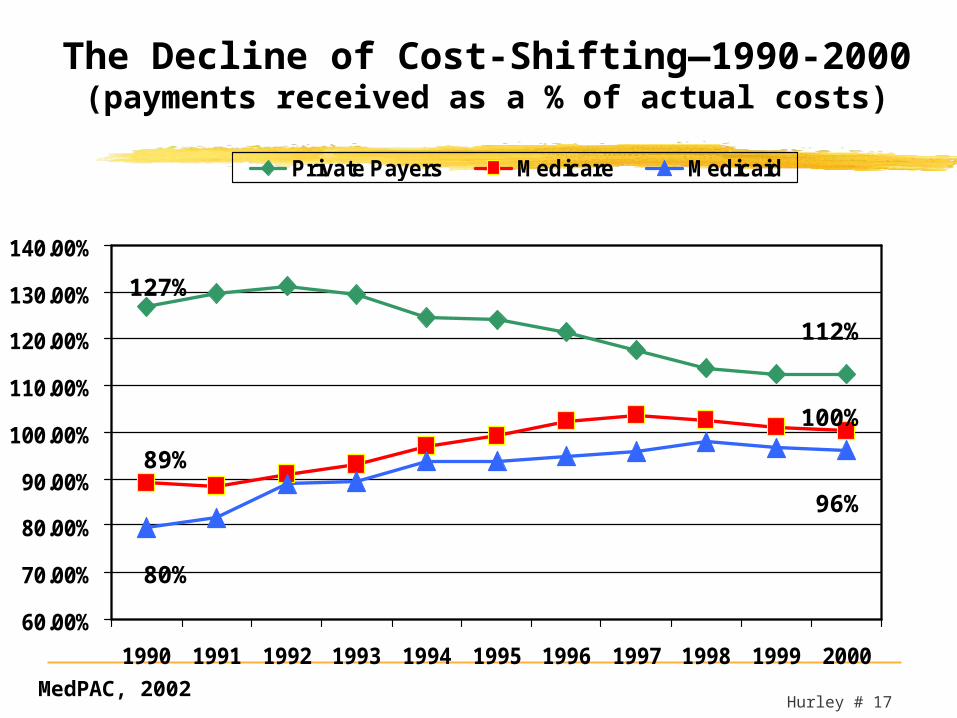
Hurley # 17
The Decline of Cost-Shifting—1990-2000(payments received as a % of actual costs)
60.00%
70.00%
80.00%
90.00%
100.00%
110.00%
120.00%
130.00%
140.00%
1990 1991 1992 1993 1994 1995 1996 1997 1998 1999 2000
Private Payers Medicare Medicaid
127%
89%
80%
112%
100%
96%
MedPAC, 2002
Hurley # 18
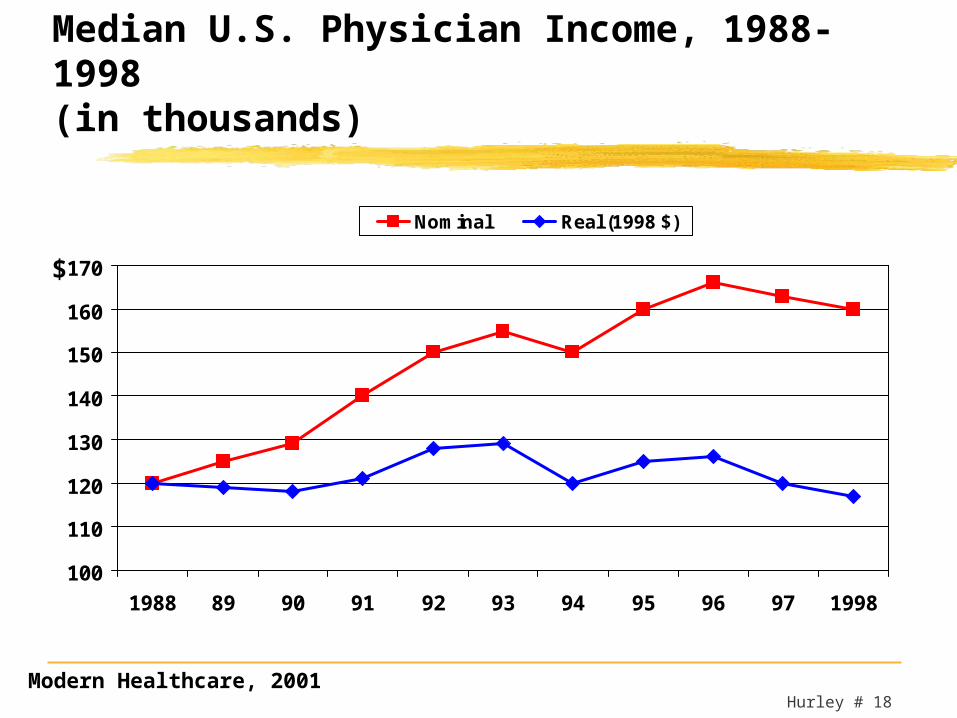
Median U.S. Physician Income, 1988-1998 (in thousands)
100
110
120
130
140
150
160
170
1988 89 90 91 92 93 94 95 96 97 1998
Nominal Real (1998 $)
$
Modern Healthcare, 2001

Hurley # 19
Percent of Groups with “Unfavorable” Rating(Kaiser Family Foundation, National Survey of Prescription Drugs, Sept. 2000)
17%25%26%28%
44%57%57%
71%
0% 20% 40% 60% 80%
Doctors
Hospitals
Banks
Airlines
Pharm Cos
Oil Cos
HMOs
Tobacco Cos

Hurley # 20
Percent Increase in Rx Spending vs. Total Health Care Spending, 1990-2002
10.25 9.759
7.25
5.5 5 4.9 4.8 5 5.6 5.9 6.65.5
12.1 1210.5
8.75 910.5
13.2514
15.316.9 17.3
15.9 15.3
02468
101214161820
1990 1991 1992 1993 1994 1995 1996 1997 1998 1999 2000 2001 2002
Total HC Rx
Percent
Source: HCFA/CMS
Hurley # 21
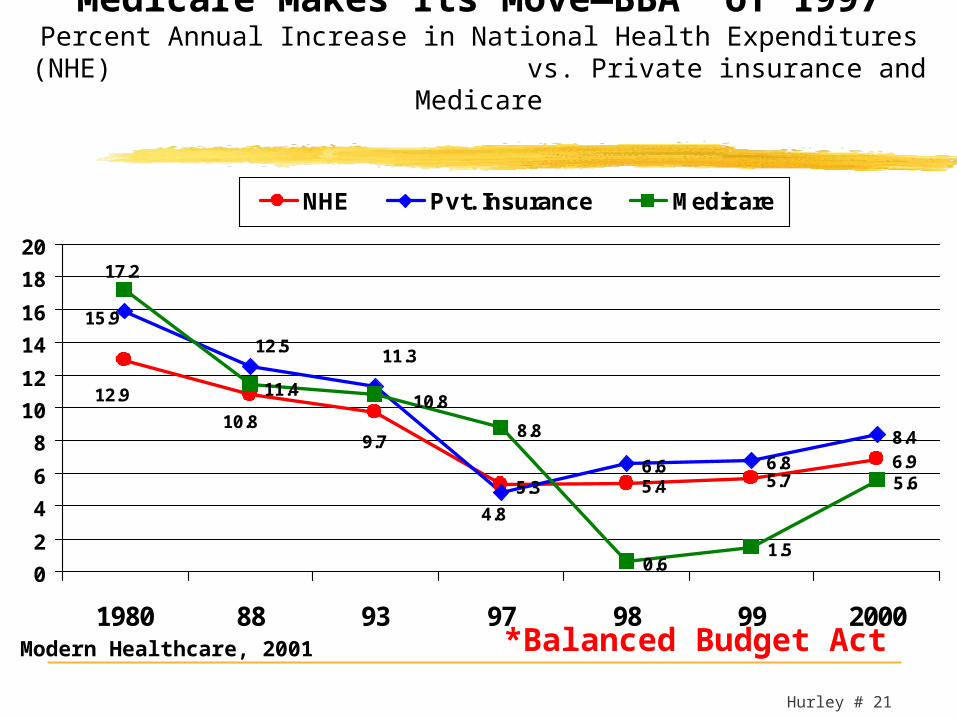
Medicare Makes Its Move—BBA* of 1997Percent Annual Increase in National Health Expenditures (NHE)
vs. Private insurance and Medicare
5.3 5.4 5.76.96.6 6.88.48.8
0.61.5
5.6
9.710.8
12.9
4.8
11.312.515.9
10.811.4
17.2
02468
101214161820
1980 88 93 97 98 99 2000
NHE Pvt. Insurance Medicare
*Balanced Budget ActModern Healthcare, 2001
Hurley # 22
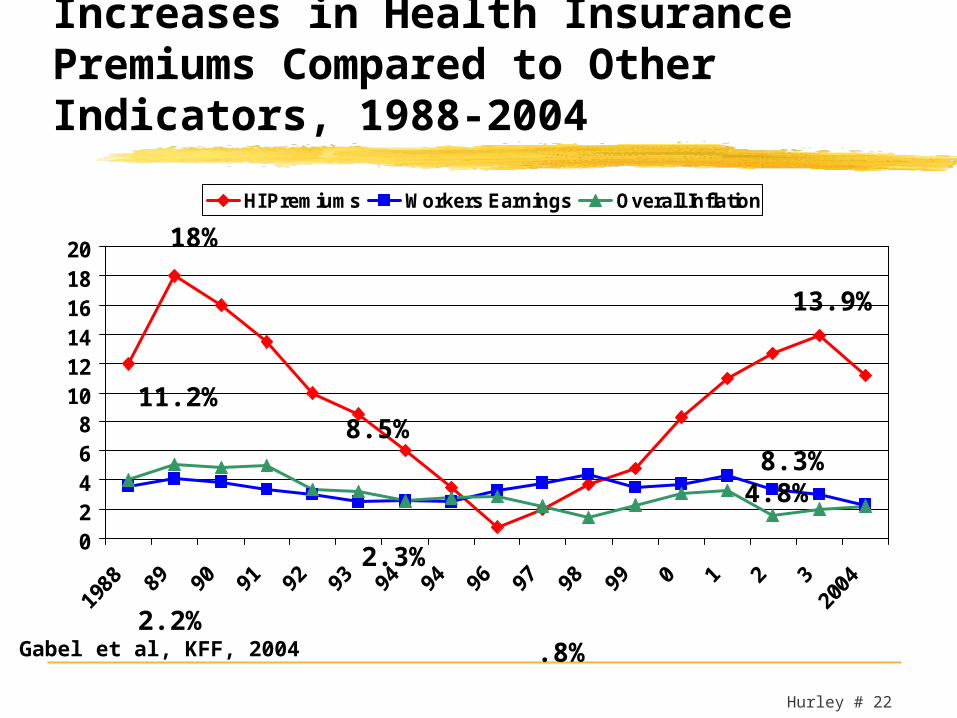
Increases in Health Insurance Premiums Compared to Other Indicators, 1988-2004
02468
101214161820
HI Premiums Workers Earnings Overall Inflation
18%
13.9%
11.2% 8.5% 8.3% 4.8%
2.3% 2.2%
.8%
Gabel et al, KFF, 2004

Hurley # 23
Contemporary Picture
Premium increases remain near or at double digits
Private coverage likely to continue to decline Private-sector managed care plans lose traction
in cost control efforts with providers Continued increases in major cost drivers: labor,
technology, pharmacy, malpractice, and administrative cost
Public payers continue to shift more pressure to private payers
Increased consumer cost participation inevitable
Hurley # 24
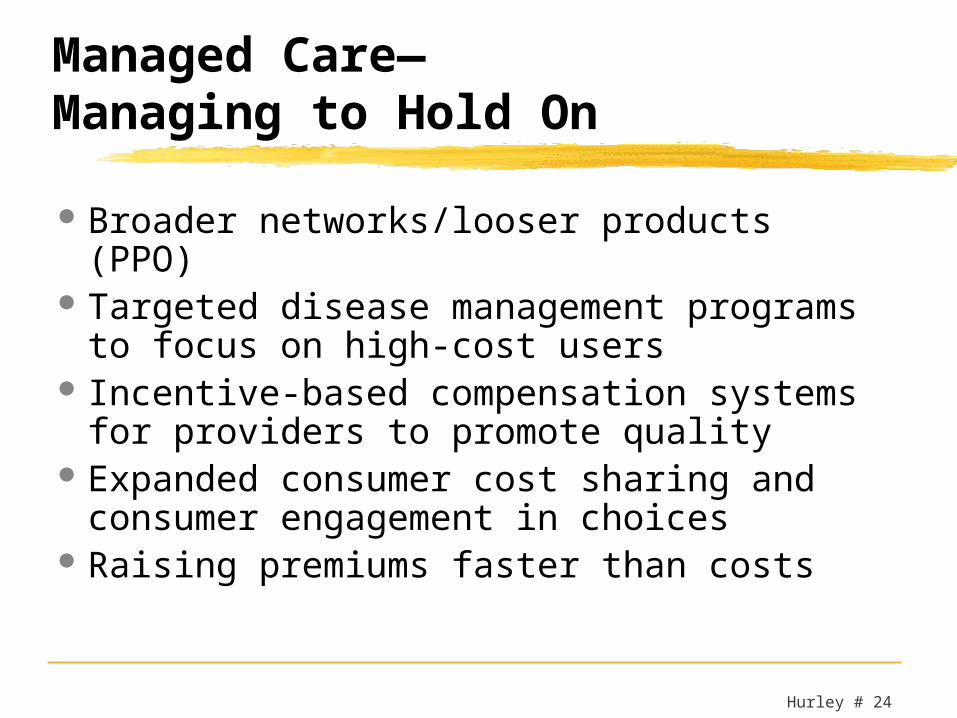
Managed Care—Managing to Hold On
Broader networks/looser products (PPO) Targeted disease management
programs to focus on high-cost users Incentive-based compensation systems
for providers to promote quality Expanded consumer cost sharing and
consumer engagement in choices Raising premiums faster than costs

73
48
37
29
23
15
14
9
8
7
4
5
11
27
25
29
31
35
34
38
41
48
52
54
7
15
14
19
20
22
25
22
22
18
17
16
19
23
27
27
30
30
28
29
23
24
26
0% 20% 40% 60% 80% 100%
1988
1994
1996
1998
2000
2002
Indemnity PPO POS HMO
Percent of All Covered Employees.
National employee enrollment by type of plan
Gabel et al, KFF, 2002
Hurley # 26
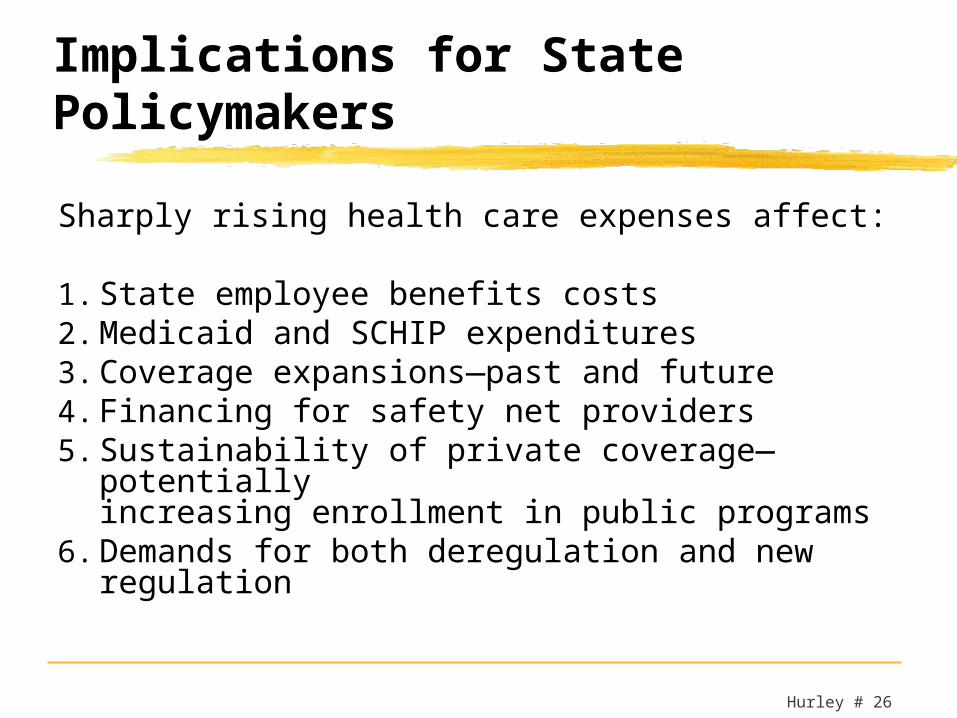
Implications for State Policymakers
Sharply rising health care expenses affect:
1. State employee benefits costs2. Medicaid and SCHIP expenditures3. Coverage expansions—past and future4. Financing for safety net providers 5. Sustainability of private coverage—
potentially increasing enrollment in public programs
6. Demands for both deregulation and new regulation
Hurley # 27
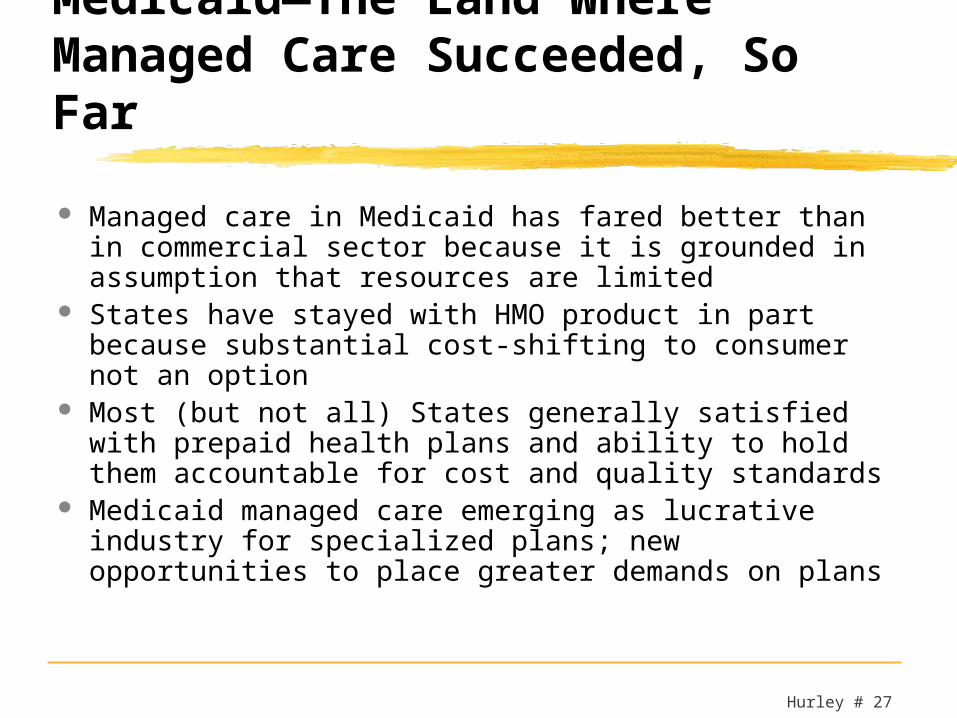
Medicaid—The Land Where Managed Care Succeeded, So Far
Managed care in Medicaid has fared better than in commercial sector because it is grounded in assumption that resources are limited
States have stayed with HMO product in part because substantial cost-shifting to consumer not an option
Most (but not all) States generally satisfied with prepaid health plans and ability to hold them accountable for cost and quality standards
Medicaid managed care emerging as lucrative industry for specialized plans; new opportunities to place greater demands on plans

Hurley # 28
The Private Sector Response Disenchanted with managed care organizations,
growing doubts about their ability to affect health care markets
Belief that expanded coverage/benefits with reduced out of pocket costs for employee/consumer is THE problem and needs to be reversed
Drumbeat building for a variety of “consumer directed health product” (CDHP) designs
Is this inspiration or desperation?

Percentage of Large Employers (>200 workers) Planning Selected Benefit Changes in Next Year
9
41
52
52
55
83
59
48
48
45
17
91Restrict eligibility
Reduce dependentsubsidy
Increase officecopays
Increasedeductibles
Increaser Rx costs
Raise employeepremium
Likely Not likely
Gabel et al, KFF, 2004 Likely= Very/Somewhat likely; Not=Other
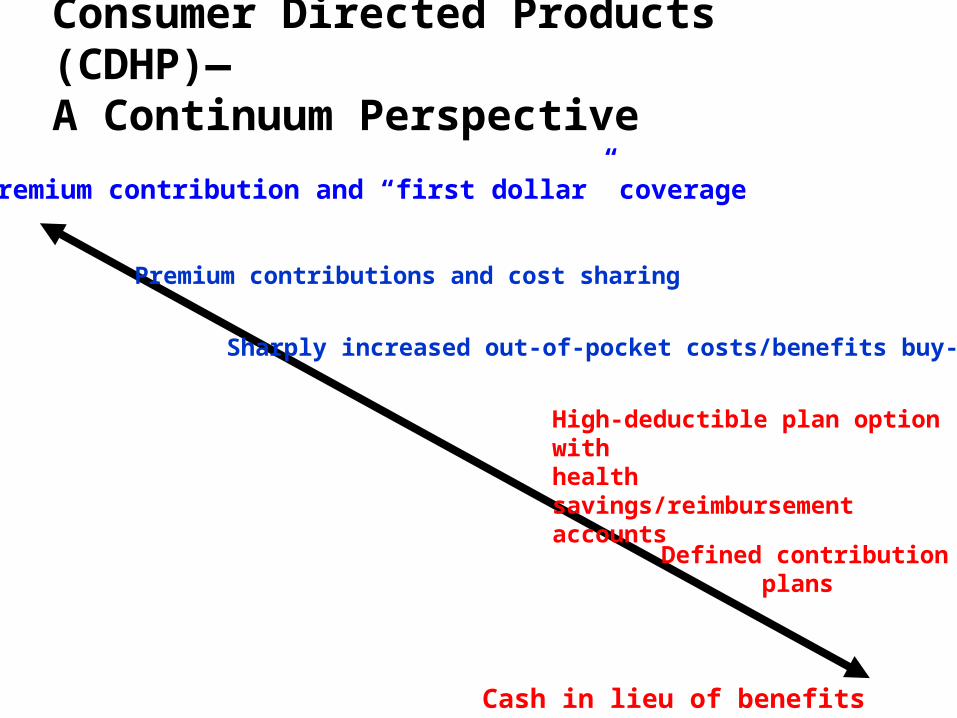
Consumer Directed Products (CDHP)—
A Continuum PerspectiveNo premium contribution and “first dollar” coverage
Cash in lieu of benefits
Premium contributions and cost sharing
Sharply increased out-of-pocket costs/benefits buy-down
High-deductible plan option withhealth savings/reimbursement accounts
Defined contribution plans
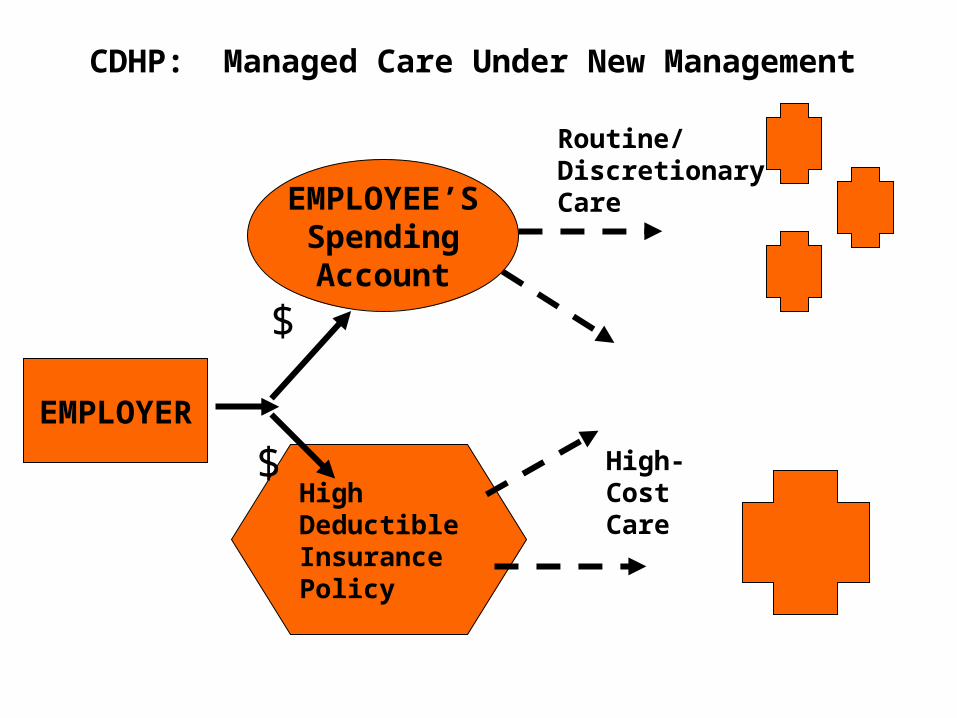
CDHP: Managed Care Under New Management
EMPLOYEE’SSpendingAccount
EMPLOYER
High DeductibleInsurancePolicy
$
$
Routine/DiscretionaryCare
High- CostCare
Hurley # 32
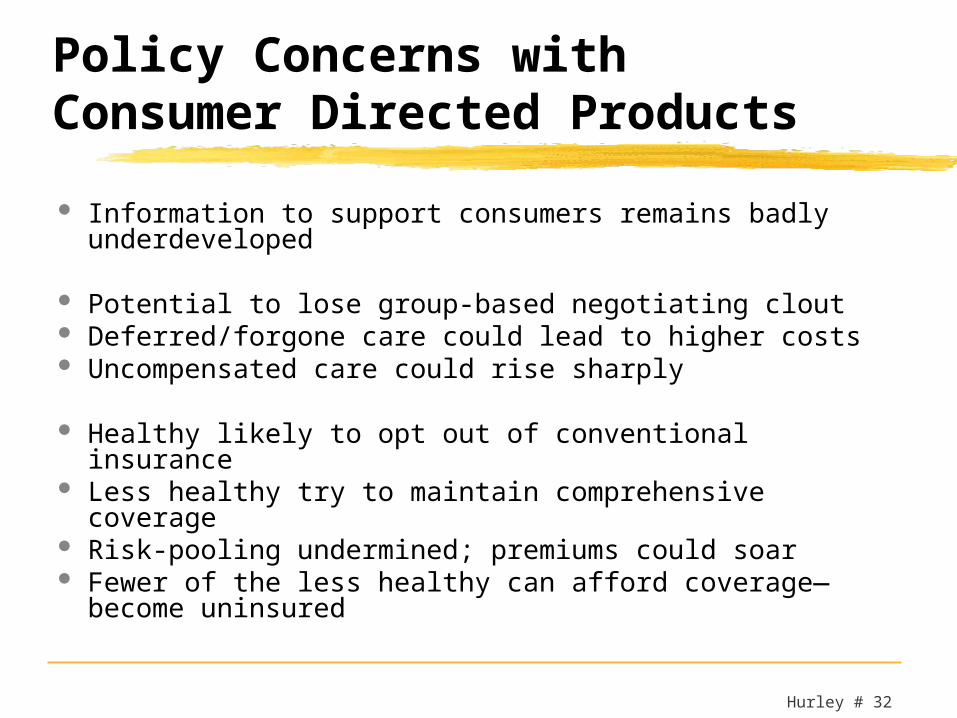
Policy Concerns with Consumer Directed Products
Information to support consumers remains badly underdeveloped
Potential to lose group-based negotiating clout Deferred/forgone care could lead to higher costs Uncompensated care could rise sharply
Healthy likely to opt out of conventional insurance Less healthy try to maintain comprehensive coverage Risk-pooling undermined; premiums could soar Fewer of the less healthy can afford coverage—
become uninsured
Hurley # 33
The Tasks Before You
Sustain past coverage expansions and explore new configurations of public and private arrangements
Review strategies for purchasing care for Medicaid and SCHIP beneficiaries
Revisit benefit designs and delivery system options for State employees
Re-appraise regulatory and other interventions to bolster private insurance markets
Consider consequences of consumer directed products
Annual Change in Private Health Spending per Capita (adjusted for inflation), 1961-2001
3.6
5.16.1
9.4
6
-1.6
-3
75.75.3
3.8
7.3
2.9
-1.6
0.9
8.4
6.9
1.9
0.2-0.7
4.3
6.25.95.25.7
2.83.6
9.1
5.74.7
1.32 1.9
-1.10
0.7
2.93.43
4.7
8.1
-4
-2
0
2
4
6
8
10
12% Change In Spending per Capita
Medicare and Medicaid Implemented
Voluntary Effort
Managed Care and Threat of Health Reform
Wage and Price Controls
WhatNext?
Altman and Levitt, 2002

“You can always count on the Americans to do the right thing, after exhausting all other alternatives.”
Winston S. Churchill