deaf jam - university of pennsylvania · deaf jam from inscription to ... responsive only to those...
TRANSCRIPT

3 5 Social Text 102 • Vol. 28, No. 1 • Spring 2010
DOI 10.1215/01642472-2009-059 © 2010 Duke University Press
The voice is what is really at stake in modernity, the voice as specified substance of language everywhere triumphantly pushed forward. Modern society (as has been repeated often enough) believes itself to be ushering in a civilization of the image, but what it actually establishes overall . . . is a civilization of speech.— Roland Barthes, “Lesson in Writing” (1968)
Speech, to the telephone engineer, is a commodity that must be picked up in one place and delivered promptly, cheaply, and in good condition in another.— D. W. Farnsworth, “High-Speed Motion Pictures of the Human Vocal Cords” (1940)
In 1954 and 1955, French psychoanalyst Jacques Lacan gave a series of lectures on the relationship between psychoanalysis and cybernetics. A favorite theme was the notion of “the message” and the way it seemed to strip speech — hitherto a defining characteristic of the reasonable human — of meaning and intention. Language made people rather than the other way around. We were “thrown into it, committed, caught up in its gears.”1 He returned frequently to the idea of “the circuit”; human subjectivity consisted of interchanges.2 Like psychoanalysis, Lacan sug-gested, “cybernetics also stems from a reaction of astonishment at redis-covering that this human language works almost by itself, seeming to outwit us.”3
Midway through his year-long seminar, he described a fantastic machine that seemed to confirm his philosophy of language. It had fulfilled, he claimed, the nineteenth-century attempts by Étienne-Jules Marey and
Deaf JamFrom Inscription to Reproduction to Information
Mara Mills

3 6 Mills ∙ Deaf Jam
others to represent the voice visually. Built at the Bell Telephone Labora-tories of American Telephone and Telegraph (AT&T), this machine went beyond previous experiments with graphic inscription. It revealed new ways for multiple messages to be passed down the same telephone wire, simultaneously. And, it indicated that certain aspects of a vocalization could be subtracted without a listener perceiving any change. Speech could be broken into bits, much like “the subject” — which, Lacan had earlier announced, “is no one. It is decomposed, in pieces. And it is jammed.”4 The telephone company treated the ephemeral voice as the material of communication, and it raised important questions about the self-evidence of “inter-human relations”:
This doesn’t mean that fundamental things happen between human beings. It concerns what goes down the wires, and what can be measured. Except, one then begins to wonder whether it does go, or whether it doesn’t, when it deteriorates, when it is no longer communication. This is what is called, in psychology, the jam, an American word. It is the first time that confusion as such — this tendency there is in communication to cease being a communi-cation, that is to say, of no longer communicating anything at all — appears as a fundamental concept.5
There is more than one way to understand the significance of “jam-ming,” and here psychoanalysis and telephony diverge. In Lacan’s account, “the jam” is the failure, interruption, and misinformation inherent to all communication. Censorship, false information, unconscious discourse, and forgetting were integral to talking itself. One of the analyst’s roles, as Mladen Dolar has explained, is to be “the interpreter deciphering the coded messages.”6 Communication engineers performed a different sort of work on human speech, and they multiplied the instances when commu-nication “cease[d] being a communication.” Jamming, in their discourse, referred to outside attacks on communication that interfered with recep-tion, such as the deliberate addition of noise to a signal. In the name of effi-ciency, engineers worked to eliminate jams and accidental line noise from transmissions — as well as the “irrelevant” and “redundant” material that suddenly seemed to be intrinsic to speech.
When Dennis Gabor inaugurated the IEEE Transactions on Infor-mation Theory in 1953, he insisted that economy had radically altered communications, more so than procedures for recording or transmission fidelity: “When electrical communications started the first requirement was completeness. Morse had to transmit the whole alphabet; Graham Bell the whole range of speech sounds. But the question of economy also came in, almost from the start. It was soon found that it was necessary, but also sufficient, to make the transmission line, and the terminal equipment, responsive only to those frequencies which the human voice apparatus can

37 Social Text 102 • Spring 2010
produce, and which can be heard by the human ear” (emphasis in origi-nal).7 For economy’s sake, Western Electric (the manufacturing arm of the AT&T monopoly) launched a comprehensive study of speech and hearing in 1913. First directed by Irving Crandall, this decades-long program was taken over by Harvey Fletcher shortly after the 1925 founding of Bell Telephone Laboratories as an independent unit. The goal of this research was to transmit and reproduce speech in the most cost-effective manner, all the while convincing the human ear that it heard “live,” unmodified talk. (To engineer, by definition, means “to contrive” as well as “to construct.”) AT&T grew to become the largest company in the world. Its campaign for “universal service,” the constraints of infrastructure, and price regulation by the U.S. government led to corporate efficiency measures that would eventually include information theory and digital signal processing.8 The telephonic medium — by which I mean its history, infrastructure, techni-cal components, and cultures — thus deserves a more prominent place in media studies.
To support this agenda, members of Fletcher’s department experi-mented with a number of methods for making speech visible and concrete. The unidentified machine in Lacan’s second seminar — the sound spec-trograph — was the first device to accurately and automatically record the frequency components of a complex sound wave.9 Bell engineers initially proposed the spectrograph to improve telephone transmission as well as to support oral education and visual telephony for deaf people. The first serviceable model was built during World War II, as part of a cryptanalysis endeavor with the military. Spectrograms exposed the coding of telephone communication: temporal inversion, time-division scrambling, masking with noise, or the shuffling of frequency bands.
The early twentieth-century telephone was not a particularly faith-ful medium of reproduction; engineers reasonably assumed that certain parts of speech could be (profitably) “lost” without a listener’s awareness. Phonetician Dennis Fry explains that the spectrograph was an early tool for determining which features of a vocal wave counted as “speech”:
The speech sound waves which reach our ears embody a lot of information which we do not need for making phonemic decisions. Out of the wealth of data our brain picks the items which it has learned to use for the pur-pose. . . . The invention of the sound spectrograph itself was an attempt in this direction for it was hoped that by making the patterns of speech visible one would throw into relief the features which were really important for recognition.10
In addition to linguistic features, spectrograms promised to reveal acous-tically redundant or irrelevant material.11 The Bell spectrograph team enrolled deaf students and volunteers as spectrogram-readers, to iden-

3 8 Mills ∙ Deaf Jam
tify the fundamental information buried within the sounds of speech. They imagined that deaf subjects would use this information to interpret telephone calls and to regulate their own voices — assuming speech and normative pronunciation standards to be ideals of human communication. From a telephone engineering perspective, deafness was the ultimate jam in interpersonal relations.12
As part of its mission of “universal communications,” AT&T extended Alexander Graham Bell’s founding commitment to oralism and assistive technology into the twentieth century. The telephone, the first technology for sound reproduction, itself derived from the tradition of inscription; as is well known, Bell’s experiments with a phonautograph, using a human tympanic membrane to transmit sound waves to a stylus and then to a plate of smoked glass, were part of the foundation for the electrical transmission of speech.13 In company publications, the sound spectrograph was explicitly positioned within the genealogy of “visible speech,” especially as it pertained to deaf education. Robert Brain has noted the significance of deafness to the very emergence of “the graphic method” in linguistics; deaf educators, convinced that the eye might sub-stitute for the ear to “unjam” the circuit of oral communication, invented numerous methods for recording and displaying waveforms.14 Surveying the history of experimental phonetics, Hans Günter Tillmann makes deaf-ness central to this new speech science of the nineteenth century: “It was assumed, first, that speech could be exhaustively investigated as a purely mechanical process, and secondly that the listener could be replaced by a deaf observer.”15
The sound spectrograph changed the course of graphic inscription in a number of respects. For one thing, the machine was modeled not on the middle but on the inner ear, which seemed to dissect sound into simpler wave components, along the lines of Fourier analysis. Rather than represent an acoustic waveform, spectrograms thus depicted its percep-tion. Deaf educators and others gradually admitted that the eye could not be made to behave as an ear; this failure was resolved through media that replicated or translated hearing.
Moreover, the milieu of the sound spectrograph was twentieth- century communication engineering, a field that tackled the efficient manufacture and modification of speech itself — beyond the construction of instruments for sound recording and transmission. Graphic inscription and deaf oral education had proven that “sound” could be captured or transmitted by a wide variety of media — an important development in the recasting of sensuous phenomena as “signals.” The sound spectrograph helped map the parameters of normal speech; the ability of deaf subjects to read spectrograms was the best evidence for the identification of infor-mation-bearing features in a complex speech wave. Telephone engineers

3 9 Social Text 102 • Spring 2010
hoped to eventually compress and encode speech by eliminating redundant material. The sound spectrograph caused speech to be considered not in terms of meaning, nor in terms of its absolute physical representation, but in terms of the characteristics of its production and perception and the minimum features by which it could be reconstructed; Telstar engineer John Pierce would list the machine as one of the “most contributive” influ-ences on information theory.16
The passage from inscription to reproduction to information was accompanied by mounting interest in self-regulation by humans and machines. Deafness underscored the role of feedback in communica-tion, and sound-writers of all forms were used to teach deaf students to monitor their own voices. In the twentieth century, sound spectrography became the primary means for machines to recognize human speech, through the matching of incoming sound-wave patterns to those in a stored database.
Across decades, national contexts, and technical shifts, however, deaf-ness ultimately served as a “pretext” to other engineering concerns — in some cases a precursor, in others a pretense. Inventors often abandoned collaborations with deaf students and their educators after initial trials, as their technologies transferred to more profitable realms. Certain inventors simply lifted ideas and inspiration from the world of deaf “assistive” tech-nology, which flourished due to the stigmatization of sign language and the real desires of many deaf people (especially those with “late-deafening”) for oral communication. For other engineers, deafness was never more than a metaphor or an advertisement. David Mitchell and Sharon Snyder term the use of disability as a literary prop or metaphor narrative prosthesis.17 I suggest the phrase assistive pretext as a complementary explanation of the resourcing of disability within technoscience.
Iconic Alphabets
The close of 1945 saw the first swell of publicity regarding a “visible speech” machine that had been secretly built during the war. Ralph Pot-ter, director of “Project X” — in which vocoder technology was used for speech encryption — also coordinated a wartime cryptanalysis project. His team built the sound spectrograph as the vocoder’s twin, a code-breaker. When Potter introduced the sound spectrograph to readers of Bell Laboratories Record, he described it as a translator and tutor for deaf people as well as a tool for engineers:
A person totally deaf, particularly if he has been so since birth, can be taught to speak only with the greatest patience, and at best his speech is unpleasant sounding and difficult to understand. Being unable to hear his own or any other voice, he has no criterion to guide his efforts, and the

4 0 Mills ∙ Deaf Jam
sounds he produces depart widely from those of normal speech . . . although speech training for those without hearing is of most immediate concern, it is likely that visible speech may ultimately enable the deaf to read the speech of others, and particularly to use the telephone. There are many other uses for these patterns of sound than those of special interest to the deaf. Since in telephony our problem is mainly one of speech transmission, this new way of picturing speech sounds and the effects of noise and distortion upon such sounds should be of considerable value.18
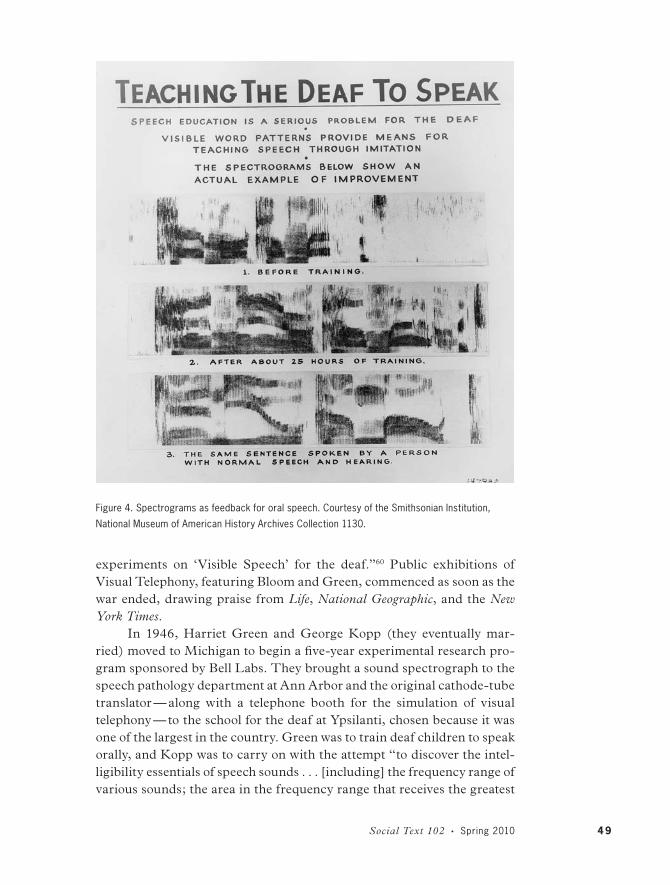
Spectrograms served four initial purposes: to characterize speech sounds, to give feedback to deaf oral speakers, to provide a basis for visual tele-phony, and to decode or encode telephone conversations (see figure 4).
Potter coauthored a full-length book on sound spectrography with George Kopp and Harriet Green, published in 1947 by Van Nostrand and titled simply Visible Speech. Kopp and Green were hired in 1943 to run a three-year experimental training program in the interpretation of spectrograms. Kopp was a Columbia phonetics professor with an interest in speech privacy systems. Harriet Green, his student, was a psychology doctoral candidate with previous degrees from Brooklyn College in speech pathology and audiology and certification as a “teacher of the deaf” from the Lexington School.19
Visible Speech opened with a glance back. The authors presented sound spectrography as a third-generation technique. In the nineteenth century, the science of visible speech had adhered to two methods — iconic notation, whereby alphabets were produced that (presumably) mimicked sounds or the physiology of the vocal apparatus, and graphic inscription, whereby sound waves were translated into visible form via registering devices. Potter, Kopp, and Green recounted the phonetic research and “universal alphabet” of Alexander Melville Bell, as well as the phonautograph — an inscription device — made by his son. The sound spectrograph, they announced, had realized at last the dream of “natural phonetic symbols translated from speech itself.”20
Modern phonetics turned speech and language into the subject matter of science. The inception of this discipline is often tied to the mid-nineteenth-century work of Alexander Melville Bell and his German counterpart, Ernst Wilhelm Ritter von Brücke.21 Bell, who followed his father into the field of elocution and whose wife was deaf, developed an “iconic” script for representing sounds in the 1860s. Alexander Ellis, a British phonetician who generally worked with symbols from the Roman alphabet, praised Bell’s ingenuity and credited it to his experience in the field of speech pathology: “Mr. Melville Bell, in forming an alphabet, rejected all existing alphabets. They were all formed on very imperfect knowledge, or superficial observation. He applied himself directly to the organs of speech, with which his long practice as a corrector of the defects

41 Social Text 102 • Spring 2010
of utterance had rendered him familiar in all their relations.”22 Begun after the London Alphabetical Conferences of 1854, Bell published the original Visible Speech treatise in 1867. His “physiological alphabet” symbolized the positions of the vocal organs (primarily the lips and tongue, but also the palate and throat) during the production of speech sounds (figure 1).
As early as the seventeenth century, John Wallis had advised using a set of symbols to reduce communication to the “motion and posture in the organs of speech.”23 Mathematician, cryptographer, and member of the Royal Society, Wallis became familiar with the materiality of language while teaching deaf pupils Daniel Whalley and Alexander Popham to speak. Grammarians and philologists, however, tended to dismiss speech as a debasement of (scholarly) written language. Two hundred years later, Bell and his colleagues continued to advocate “living” speech over “dead” writing as the basis of phonetics. Henry Sweet, for one, insisted that the meaning of language should be disregarded in favor of its form: “All attempts to reduce language to strict logical or psychological categories, by ignoring its formal side, have failed ignominiously. The form of language is its sounds.”24
Figure 1. Alexander Melville Bell’s Visible Speech alphabet, derived from the “postures” of the
vocal organs, is seen on the blackboards in a classroom at the Rochester School for the Deaf (c.
1910). Students are also using carbon-telephone amplifiers. Courtesy of the Rochester School for
the Deaf Archive Center, Rochester, New York.

4 2 Mills ∙ Deaf Jam
Bell foresaw a number of applications for Visible Speech: aid to pro-nunciation for deaf people; correction of unphonetic English spelling; and the possibility of improved international telegraphy, without the interme-diate step of translation. Bell also called upon the exigencies of empire to advertise his alphabet: it could allow “the speedy diffusion of the language of a mother country throughout the most widely separated COLONIES . . . the acquisition, by Rulers, of the languages of their Colonial Subjects, will, of course, be facilitated in an equal degree.”25 Bell framed his project as a natural “universal alphabet” that could potentially represent the sounds of every language. Quickly, however, he attached Visible Speech to a proposal for one “universal” language — English. In an 1888 publication on “World English,” Bell reasoned, “no language could be invented for International use that would surpass English, in grammatical simplicity, and in gen-eral fitness to become the tongue of the world. The only drawback to the extension of English has been its difficult and unsystematic spelling.”26 The spread of oralism as a method of deaf education in the nineteenth century was part of a larger cultural impulse to streamline communica-tion in industrializing nations.27 As Carolyn Marvin has shown, promoters of global telegraph, telephone, and wireless networks imagined that “the world society that would arise spontaneously in the absence of barriers to communication would resist autonomous minorities.”28
Experimental Phonetics
Concurrent with these innovations in alphabetics, a new “universal lan-guage of science” emerged in the 1800s — graphic inscription. This “lan-guage” largely served to record motions that were otherwise invisible or too rapid for the eye to see. In the nineteenth century, vibration seemed to be the universal manifestation of natural phenomena. Central to the his-tory of the telephone, electricity was found to travel in waves, analogous to water, sound, and light energy.
Although “inscription” has become an expansive theoretical term in science and media studies, often referring to writing and recording in gen-eral, the narrower science of self-recording machines originated with James Watt’s “indicator,” which automatically registered the pressure relations in steam engines.29 (Watt also built a “governor,” an early servomechanism that regulated steam flow, and hence speed.) Carl Ludwig introduced the graphic method into the experimental life sciences in the 1840s with his kymograph — a drum, rotated by clockwork, on whose blackened surface a vibrating bristle recorded the fluctuations of blood pressure. The kymo-graph and many derivative self-registering devices soon formed the nucleus of a laboratory-based approach to language — experimental phonetics. Unlike idealized alphabet-scripts, here the sound waves resulting from
4 3 Social Text 102 • Spring 2010
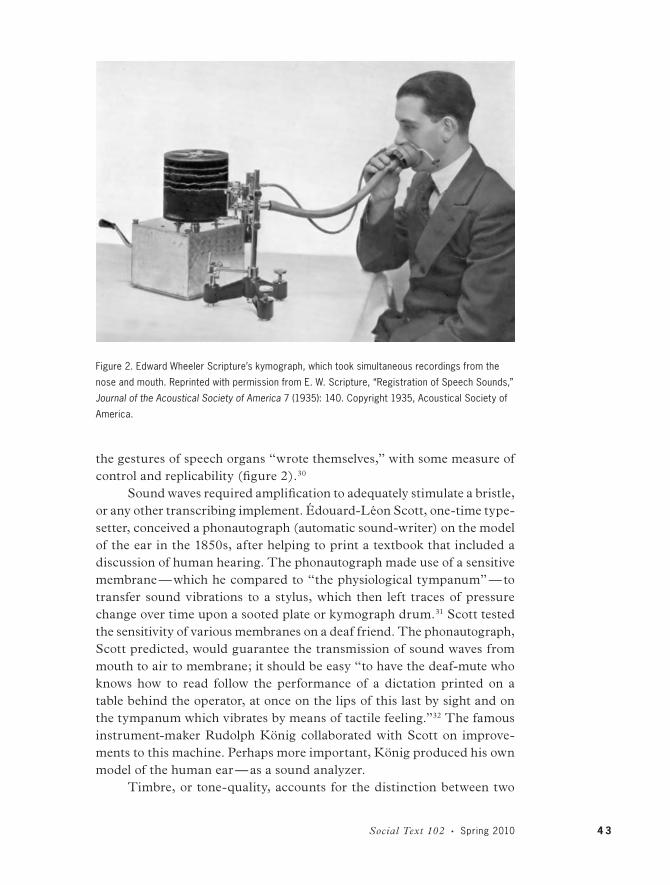
the gestures of speech organs “wrote themselves,” with some measure of control and replicability (figure 2).30
Sound waves required amplification to adequately stimulate a bristle, or any other transcribing implement. Édouard-Léon Scott, one-time type-setter, conceived a phonautograph (automatic sound-writer) on the model of the ear in the 1850s, after helping to print a textbook that included a discussion of human hearing. The phonautograph made use of a sensitive membrane — which he compared to “the physiological tympanum” — to transfer sound vibrations to a stylus, which then left traces of pressure change over time upon a sooted plate or kymograph drum.31 Scott tested the sensitivity of various membranes on a deaf friend. The phonautograph, Scott predicted, would guarantee the transmission of sound waves from mouth to air to membrane; it should be easy “to have the deaf-mute who knows how to read follow the performance of a dictation printed on a table behind the operator, at once on the lips of this last by sight and on the tympanum which vibrates by means of tactile feeling.”32 The famous instrument-maker Rudolph König collaborated with Scott on improve-ments to this machine. Perhaps more important, König produced his own model of the human ear — as a sound analyzer.
Timbre, or tone-quality, accounts for the distinction between two
Figure 2. Edward Wheeler Scripture’s kymograph, which took simultaneous recordings from the
nose and mouth. Reprinted with permission from E. W. Scripture, “Registration of Speech Sounds,”
Journal of the Acoustical Society of America 7 (1935): 140. Copyright 1935, Acoustical Society of
America.

4 4 Mills ∙ Deaf Jam
instruments sounding the same note, or the fact that a word can be iden-tified when it is spoken with varying pitch and loudness. In 1843, Georg Ohm posited that the ear performed Fourier or harmonic analysis to dis-tinguish the simple frequency components within a complex sound wave. Hermann von Helmholtz later illustrated Ohm’s Law with reference to concertgoing:
From the mouths of the male singers proceed waves of six to twelve feet in length; from the lips of the female singers dart shorter waves, from eigh-teen to thirty-six inches long. The rustling of silken skirts excites little curls in the air, each instrument in the orchestra emits its peculiar waves, and all these systems expand spherically from their respective centers, dart through one another, are reflected from the walls of the room and thus rush backwards and forwards. . . . [The ear] analyzes the interdigitation of the waves . . . separates the several tones which compose it, and distinguishes the voices of men and women — even of individuals — the peculiar qualities of tone given out by each instrument, the rustling of the dresses, the footfalls of the walkers, and so on.33
Helmholtz proposed that the ear’s analysis occurred because fibers or hairs at different locations along the cochlea resonated to different fre-quencies of sound. Different speech sounds are created as the vocal tract changes shape, reinforcing, through resonance, particular patterns of overtones. What the ear perceives thus corresponds to the movements of the mouth and throat.
In the 1860s, König attempted to render this process visible via his “manometric flame,” which used “the vibration of the diaphragm to vary the pressure of the gas supply to a sensitive flame, which oscillated up and down in accordance with the spoken sounds. When viewed through a rotating mirror, the resulting bright/dark boundary line appeared as a waveform — of sorts.”34 By adding up to fourteen resonators to this appa-ratus, König created a “harmonic analyzer” that revealed the intensities of particular speech components.35 Wallace Clement Sabine later described the manometric method as “at best qualitative and difficult” for character-izing vowel sounds.36 Alexander Graham Bell hoped to adopt the device for articulation training, but he “saw it was hopeless to attempt to photograph it for the information of [his] Deaf pupils.”37
Deaf education established close ties to experimental phonetics.38 Étienne-Jules Marey, whose La Methode Graphique dans les Sciences Expéri-mentales (The Graphic Method in the Experimental Sciences) gave an ency-clopedic account of the graphic method, began to work on visualizing language in 1875, at the request of a delegation of linguists who visited his laboratory. With one of these linguists, the expert on deafness Charles Rosapelly, Marey coauthored an article on “graphic phonetics” in Scientific

4 5 Social Text 102 • Spring 2010
American; this publication influenced Thomas Edison as he worked on the phonograph.39 A stated goal of their research was “a more scientific method of education for deaf mutes, by conveying to the mind of the latter the necessary instruction through the medium of graphic traces.”40
The graphic method was more than an instrument of “mechanical objectivity.” Anson Rabinbach describes Marey as an “engineer of life”; members of Marey’s laboratory regularly applied graphic inscription as a means of feedback for controlling and economizing time and motion.41 In even greater detail, Marta Braun documents the movement of graph, photograph, and cinematograph into the American scientific management system, where they were used to instill self-discipline among the labor force. She further suggests that the analysis of time and motion facilitated the conversion from mechanization to automation in the factories, with robots built to enact particular micromotions.42 When psychologist Gran-ville Stanley Hall surveyed the graphic method in 1881, he mentioned that some of his contemporaries already believed the “mechanized knowledge” provided by automatic recording devices would someday lead to “the actualization of a universal self-mending, self-governing, self-reproducing, self-knowing machine.”43 Paralleling this application of communication to control in servomechanisms, deaf oral instruction immediately began to employ the graphic method for programmed self-correction among students.
Marey transitioned from chronography to chronophotography in the early 1880s, around the time he took on Georges Demenÿ as his assistant. A decade later, Hector Marichelle of the National Institute of Deaf-Mutes approached Demenÿ with a proposition for an experiment. If speech were just “a rapid succession of movements,” could these not be caught by a series of chronophotographs — and then somehow reassembled? In 1891, the two men performed a demonstration on a deaf student, which they reported to the Academy of Sciences: they had photographed all the lip movements for a particular phrase and then arranged this series within the cylinder of a zoetrope. By observing the images — independently, and connected to one another through the zoetrope’s motion — the student was evidently able to reproduce the original statement. His slight mispronun-ciations pointed only to the errors in photography.44 That December, at a lecture before the National Conservatory of Arts and Crafts, Demenÿ discussed his forays into deaf education, projecting his speech chronopho-tographs one by one with a magic lantern.
Demenÿ eventually built a new machine to project chronophoto-graphs in motion for the first time — the Phonoscope. This apparatus made use of glass discs with photographic series arranged along their perimeters. He and Marichelle demonstrated the Phonoscope with three students and the director of the National Institute for Deaf-Mutes. One of the students
4 6 Mills ∙ Deaf Jam
performed remarkably, matching the pace of his pronunciation to changing speeds of projection. The experiment failed when Demenÿ tried to trick the boy by projecting the phrase in reverse. Demenÿ exclaimed that he had “played the deaf-mute like a Barberi organ” — a portable automatophone, one of the player-pianos fed rolls of mechanized music.45
Laurent Mannoni places the Phonoscope at the very origin of moving photograph projection and the film industry, and Tom Gunning has argued its importance in founding the cinematic close-up.46 Demenÿ anticipated screen interactivity; in 1892, a reporter for the London Globe appreciated that through the Phonoscope, “photography may be turned into a means of inter-communication.”47 The device was a sensation in its own time, and Demenÿ quickly abandoned deaf education in favor of marketing his “animated portraits” to a broad audience. In the end, as Virgilio Tosi has theorized, deafness was merely “the scientific part of the research, the pretext and the occasion to refine the instrument.”48
The felicitously named psychologist Edward Wheeler Scripture was the most avid promoter of “the graphic method” in the United States (see figure 3). Scripture’s research increasingly focused on the recording of speech waves, rather than other time-based human behaviors, and by 1899 he had dedicated part of the Yale Psychological Laboratory to experimental phonetics. In 1906, Scripture started a research program on the speech of people with epilepsy at Columbia’s Vanderbilt Clinic. Alongside his wife, May Kirk Scripture, who was employed as a speech therapist at Columbia’s Teachers College, he also began to take on deaf pupils.49 Scripture was strongly influenced by the Abbé Rousselot’s laboratory for experimental phonetics at the Collège de France, which he had visited in 1897. Rous-selot recommended graphic inscription for the perfecting of accent during foreign language learning. Inscription devices provided curves of “normal” speech for students to imitate through a process of self-comparison and correction.
Scripture also learned to magnify and trace the grooves in phono-graph recordings. He briefly experimented, in the 1930s, with reading the sound track along the edge of a talking filmstrip. He opened an article in the Journal of the Acoustical Society of America, on the topic of what film technology might reveal about English vowels, with a newly sympathetic perspective on deafness: “To avoid presuppositions and illusions we must begin the study of these tracks as if we had never known anything about sound, that is, as if we had been born deaf and had never read anything on the subject. Our conclusions must be based solely on what we see in the curves or in what we can deduce from our observations by the eye.”50 Though he found deafness antithetical to communication, it served as a model subjectivity for the objective, optical space of the lab.

47 Social Text 102 • Spring 2010
Specters of Bell
A few years after Scripture’s death, Potter, Kopp, and Green reprinted his speech curves in Visible Speech — as an example of the sound-recording technology they hoped to supersede. Scripture’s mechanical devices had drawn only a single line of wavering amplitude over time; they revealed changes in loudness and pitch, but they could not be translated into words by the eye.51 Potter, Kopp, and Green were more generous regarding the similar inscription experiments of Alexander Graham Bell, their cor-porate ancestor. Bell spent his early career teaching his father’s Visible Speech to deaf children, who copied the word-pictures with their mouths. Students were to “memorize the picture of the pronunciation of the words and sentences they understand when written and spoken,” Bell explained, “and we will substitute a power of inward self-correction for correction constantly applied only by pressure from without.”52
Bell created the ear phonautograph as a second-generation “visible speech,” to supply more precise visual feedback to his students and to assist his own investigations into the nature of vowels. Yet phonautograph plates represented only brief cuts from a speech stream, and Bell admitted that he himself “found it impossible to recognize the various vowel sounds by their tracings.” In those same years, Bell experimented with a multiple telegraph system, using different frequencies to send several messages simultaneously. Bell tinkered with a “multiple phonautograph” — one that would record speech overtones for the purpose of deaf instruction — but this work remained unfinished as he turned his attention to the telephone and the electrical reproduction of sound waves.53
Potter, Kopp, and Green also discussed the inadequacies of the oscillograph, the output of which they compared to the letters of a word or phoneme being piled one on top of another in writing. In his comprehensive history of early oscillography, Vivian Phillips demonstrates that acoustics
Figure 3. Edward Wheeler Scripture’s speech schema (1936), one of many forerunners to Claude
Shannon’s diagram (1948) for a generalized communication system. From A History of Psychology in Autobiography, Vol. 3, ed. C. Murchison (Worcester, MA: Clark University Press, 1936), 257.

4 8 Mills ∙ Deaf Jam
and phonetics “provided the initial impetus” for waveform display. Eventu-ally, diaphragm and stroboscopic methods also offered “concrete, visible proof” of electrical oscillations. Oscillographs, developed in the 1890s by French physicist André-Eugène Blondel, among others, recorded the temporal changes in an electrical signal and became essential for “render-ing visible what was happening in electrical circuits.”54 Phillips argues, “Although the needs of the electrical engineer and the acoustician arose from quite different causes, those needs actually coalesced as time went on.”55 In the 1920s, following a proposal to use relay circuits to split vowels and consonants into separate channels, I. B. Crandall of Bell Laboratories took oscillograms of all the basic English speech sounds, using a planimeter to perform a time-consuming Fourier analysis of the curves. (For the same purpose, others used mechanical harmonic analyzers and synthesizers — early analog computers that were themselves inscription machines.)56 In 1928, Ralph Hartley used an oscillographic record as evidence for his groundbreaking insistence that information be defined according to physi-cal, rather than psychological, terms: “The actual physical embodiment of the word consists of an acoustic or electrical disturbance which may be expressed as a magnitude-time function.”57
Visible Speech located the “physical embodiment of the word” in the frequency domain. Potter, Kopp, and Green described the sound spec-trograph as “a mechanical ear” that analyzed sound in a manner at least roughly analogous to human hearing.58 For the prototype, Potter recorded sentences and replayed them twelve times, activating a different electri-cal filter in each instance to divide the speech into bands of 350 Hz. The output from the filters triggered a stylus, which left records of the com-ponent waves on a sheet of electrosensitive paper. By 1944, Potter’s team had constructed a real-time Visible Speech Translator — an instantaneous moving image on a cathode-ray tube or a phosphor belt to allow for visual telephony. Time was shown on the horizontal axis, frequency on the verti-cal, and loudness was determined by the darkness of the pattern on paper or its brightness on the screen.
The Visual Telephony phase of the project launched in the fall of 1943, when eleven female Bell employees began training to read paper spectrograms of short phrases. Edgar Bloom, an engineer who had been deaf since birth, joined the class the following December, once the moving-screen translator was complete. Bloom had been a lip-reading champion in his New York elementary and high schools.59 Later, with two bachelor’s degrees and a master’s in chemical engineering from Columbia, he applied twice for employment at Bell Labs; he was turned down in each instance because of his deafness. According to an article in the Deaf American, Bloom’s “lucky break occurred in the mid-1940s when the Laboratories’ scientists wanted a reliable deaf person for a guinea pig for their startling
49 Social Text 102 • Spring 2010
experiments on ‘Visible Speech’ for the deaf.”60 Public exhibitions of Visual Telephony, featuring Bloom and Green, commenced as soon as the war ended, drawing praise from Life, National Geographic, and the New York Times.
In 1946, Harriet Green and George Kopp (they eventually mar-ried) moved to Michigan to begin a five-year experimental research pro-gram sponsored by Bell Labs. They brought a sound spectrograph to the speech pathology department at Ann Arbor and the original cathode-tube translator — along with a telephone booth for the simulation of visual telephony — to the school for the deaf at Ypsilanti, chosen because it was one of the largest in the country. Green was to train deaf children to speak orally, and Kopp was to carry on with the attempt “to discover the intel-ligibility essentials of speech sounds . . . [including] the frequency range of various sounds; the area in the frequency range that receives the greatest
Figure 4. Spectrograms as feedback for oral speech. Courtesy of the Smithsonian Institution,
National Museum of American History Archives Collection 1130.

5 0 Mills ∙ Deaf Jam
reinforcement; and, the influence that combined sounds normally exert on one another.”61
At the same time, communication engineers began using spectro-grams to quantify speech. One Bell researcher explained its simplest application: “By examining numerous spectrograms of the same sounds, spoken by many persons and in a variety of contexts, an investigator can arrive at a description of the acoustic features common to all of the samples, and in this way make progress toward defining the so-called invariants of speech, that is, the essential information-bearing sound elements on which the listener’s identifications critically depend.”62 With John Steinberg, Potter imaged all of the English consonant and vowel sounds, along with their influences on one another. Eventually, data compiled from the spec-trograms of hundreds of speakers allowed the average duration, amplitude (loudness), and range of overtones for these sounds to be estimated.63
Dennis Gabor (who later won the Nobel Prize for inventing hologra-phy) was one engineer who reconceived the “representation” of speech in terms of the minimum parameters necessary for its reconstruction, based on human speech production and perception. Estimating the “untapped” resources of the line, Gabor concluded:
In telegraphy a letter is transmitted in the Baudot system by five “binary selections” or five “bits.” . . . In a telephone channel on the other hand, with a bandwidth of 3000 cycles and a signal : noise ratio of 30 decibels the number of bits/second is 2 3 3000 x 3.2 3 3 5 60,000, yet even in rapid speech the number of speech sounds per second is only about 15: thus it takes about 4000 bits to transmit a letter instead of 5. Of course the telephone transmits more than mere letters; it conveys the individuality of the speaker and the emotional content of his message, but even allowing for this there remains a large untapped source of potential gain. But if we want to realize this, we must go a little beyond the narrow definition of communication engineering.64
Gabor came up with countless experiments for “sampling” and com-pressing speech via spectrograms. As one example, he suggested paint-ing over the darkest sections of a spectrogram, ignoring the others, and playing the result back to see how much intelligibility and quality had been impaired.65 He speculated that a speech transmitter need only have a capacity of two hundred cycles; if every twenty-five milliseconds of a spectrogram were horizontally divided into sixty-four frequency strips, the peaks and valleys of the three darkest bars in each time unit could be denoted by a mere six numbers.
Claude Shannon’s “mathematical theory of communication,” worked out at Bell Labs, allowed one to calculate the minimum number of binary digits (“bits”) required to code a given word, sound, or image. Shannon
51 Social Text 102 • Spring 2010
demonstrated that any continuous source could be made discrete — through sampling and quantizing — and any discrete source could be made more efficient. Messages could be compressed by removing their noninforma-tion, or inherent redundancy, a term Warren Weaver defined as “the frac-tion of the structure of the message which is determined not by the free choice of the sender, but by the accepted statistical rules governing the use of symbols in question.”66
Although Shannon intended “information” to include things like television and radar transmission, his cases were largely language-based. To explain coding based on redundancy, Shannon often referred to Morse code, in which the letter “e” was given the shortest symbol — a single dot — because of its commonness.67 He also referenced Godfrey Dewey, whose 1923 Relativ Frequency of English Speech Sounds was one of the first statistical approaches to phonetics — written entirely in “fonetic” spell-ing.68 In the case of oral language, redundancy could also be found in physiological characteristics, such as the slowness with which the lips and tongue changed positions (“temporal redundancy”).69 At the Seventh Macy Conference on Cybernetics, Shannon mentioned the constraints of consonant-vowel patterns as another example.70 For continuous sources such as sound, however, exploiting the “requirements of the message des-tination” promised the greatest feats of compression.71
Gabor depicted communication theory as a sea change in the history of representation:
The basic problem of structural communication theory is the adequate rep-resentation of signals. By adequate I mean that the representation must con-tain everything that can be observed by the physical receiver, and nothing else. Once it was believed that a sound, for instance, could be represented by some continuous function s(t) . . . the first step in structural communication theory is to replace this naïve view by what I propose to call the Expansion Theorem . . . any signal could be linearly expanded in terms of certain elementary signals.72
The sound spectrograph was one tool for elucidating what the ear “observed.”73 Images of invisible sound waves traveling through the air were transformed into images that documented frequency components (formants, timbre) as analyzed by the ear, revealing linguistic information as well as material that was acoustically redundant. Fidelity was relative; the requirements for reproduction could be set according to the receiver.
“The Deaf May Lead the Way!”
In Visible Speech, Potter, Kopp, and Green forecasted applications of the spectrograph beyond deaf education and visual telephony: the study of

52 Mills ∙ Deaf Jam
patterns in animal and insect sounds, the portrayal of the heartbeat, voice-printing for identification and surveillance, and the discovery of “better ways to take speech sounds to pieces.”74 Potter advertised the spectrograph as a tool for musicians and filmmakers: to generate “audiovisual music,” to control and manipulate sound, and even to “play-back” or translate graphic designs into acoustic form.75 Visible Speech concluded with an exclamation about deaf education and the future of communications: “While there are many potential interests, the important proving ground for visible speech seems certain to be in the field of deaf education . . . What happens during the coming years in the field of deaf education can have a considerable effect upon the future of visible speech. If it comes into general use as a voice-written language for the deaf it could even start a trend toward modernized writing and printing. The deaf may lead the way!”76 Deaf people seemed to be the most objective observers, helping to extract those aspects of speech communication that were universal across different media.
Over the next decade, spectrography became profitable in linguistics, ecology, and communication engineering. It became the basis for speech recognition, machine speech, and spectral audio editing. Information theory spawned countless methods for digitizing sound waves based on the compression of redundant material or the elimination of irrelevant mate-rial (this latter case is today exemplified by the “lossy” perceptual coding found in MP3s, which capitalizes on the limitations of human hearing). Once again, deaf needs lapsed into the status of precursor and pretext. In a revised edition of Visible Speech, Green confessed that Bell Labs never outfitted any other machines for visual telephony: “Lack of equipment has imposed severe limitations on the extent and nature of the translator research program. There is still only one, original model of the cathode-ray translator.”77 Nevertheless, the “miracle” of deaf oral communication continued to assist the advertisement of spectrography in other fields. In the case of spectral phonocardiography, or “heartprinting,” as late as 1968 the following notice appeared in the New York Times: “ ‘Visible Speech’ as a means of communication between deaf people visualizes word-picture patterns, shown as levels separated by contour lines. Now, in an experi-ment at a member hospital of the United Hospital Fund, this technique has been successfully applied to the analysis of cardiovascular sounds to assess heart defects.”78
Edgar Bloom was possibly the only deaf individual to converse over the telephone using the Visible Speech translator. When the sound spectrograph project ended, he continued to work at Bell Labs for the next twenty-five years as an analytical chemist.79 Bloom served multiple terms as president of the Professional Society of the Deaf and the New York Society for the Deaf. In a 1970 interview in the Deaf American, he

5 3 Social Text 102 • Spring 2010
reflected darkly, “My several years of association with hearing people have proven to me beyond doubt their apathy to our problems.”80 Two years later, Bloom described his frustrations more specifically to the White Plains Reporter Dispatch:
Being deaf is a severe handicap! We are further handicapped by attitudes toward us. People don’t seem to realize that the deaf are just as capable, if not better, than their hearing peers. We are given jobs that rarely use our potential. We are seldom invited to conferences to review our work, compare notes, make plans for the future, etc. We have to be exceptional to get jobs. We’re not promoted because we can’t use the telephone. Hogwash! We have been taking it on the chin.81
By 1972, the social importance of the telephone had increased such that, in the words of B. Ruby Rich, “to be without a telephone amounted nearly to a revocation of citizenship.”82 And the sound spectrograph, which worked against sign language all along, had disappointed even its deaf oral supporters. Lacan’s “astonishment” at the outwitting maneuvers of language had not been shared by communication engineers, who moved on with making speech more profitable and efficient.
Notes
1. Jacques Lacan, The Seminar of Jacques Lacan, Book II: The Ego in Freud’s Theory and in the Technique of Psychoanalysis, 1954 – 1955, ed. Jacques-Alain Miller, trans. Sylvana Tomaselli (New York: Norton, 1991), 307.
2. Ibid., 80.3. Ibid., 119.4. Ibid., 54.5. Ibid., 83.6. Mladen Dolar, A Voice and Nothing More (Cambridge, MA: MIT Press,
1996), 158, 160.7. Dennis Gabor, “Communication Theory, Past, Present, and Prospective,”
IEEE Transactions on Information Theory 1 (1953): 2 – 4.8. Signal quality in the presence of noise was also a concern.9. The analog spectrograph discussed in this article has largely been replaced
by digital, computer-based versions. It is also known as the spectrum analyzer or sonagraph (not to be confused with the ultrasound sonogram).
10. Dennis Fry, The Physics of Speech (Cambridge: Cambridge University Press, 1979), 131.
11. See Walter Frischer, Digital Television: A Practical Guide for Engineers (Berlin: Springer, 2004), 65: “Redundant means superfluous, irrelevant means unnecessary. Superfluous information is information which exists several times in the data stream . . . or simply information which can be easily and losslessly recovered. . . . Irrelevant infor-mation is the type which cannot be perceived by the human species.”
12. As Grace Barstow Murphy remarked in her midcentury autobiography, “the fact of deafness is a monkey wrench thrown into the machinery of communication.” Grace Barstow Murphy, Your Deafness Is Not You (New York: Harper, 1954), 7.

5 4 Mills ∙ Deaf Jam
13. On this chain of events — a collaboration between Alexander Graham Bell and otologist Clarence Blake — and on the men’s later attempt to integrate a human tympanum into the speaking telephone, see Clarence Blake, “The Membrana Tym-pani Telephone,” American Journal of Otology 2 (1880): 180 – 83. See also Jonathan Sterne, The Audible Past: Cultural Origins of Sound Reproduction (Durham, NC: Duke University Press, 2003).
14. Robert Brain, “Standards and Semiotics,” in Inscribing Science: Scientific Texts and Materialities of Communication, ed. Timothy Lenoir (Stanford, CA: Stan-ford University Press, 1998), 249 – 85.
15. Hans Günter Tillmann, “Early Modern Instrumental Phonetics,” in Con-cise History of the Language Sciences: From Sumerians to the Cognitivists, ed. E. F. K. Koerner and R. E. Asher (Oxford: Pergamon, 1995), 402.
16. Along with things like telegraphy, vocoding, and statistical mechanics. John R. Pierce, “The Early Days of Information Theory,” IEEE Transactions on Information Theory 19 (1973): 3 – 8. Pierce always insisted that “communication theory has its origins in the study of electrical communication.” John Pierce, Sym-bols, Signals and Noise: The Nature and Process of Communication (New York: Harper, 1961), 24.
17. David Mitchell, “Narrative Prosthesis and the Materiality of Metaphor,” in Disability Studies: Enabling the Humanities, ed. Sharon Snyder, Brenda Jo Bruegge-man, and Rosemarie Garland-Thomson (New York: Modern Language Association of America, 2002), 17.
18. Ralph Potter, “Visible Speech,” Bell Laboratories Record 24 (1946): 7.19. With the assistance of a grant-in-aid from the American Institute of
Physics, I interviewed Harriet Green in 2006 and collected her manuscripts (cited throughout) for the Smithsonian National Museum of American History.
20. Ralph K. Potter, George A. Kopp, and Harriet C. Green, Visible Speech (New York: Van Nostrand, 1947), 4.
21. Ernst Wilhelm Ritter von Brücke was Sigmund Freud’s teacher; he devel-oped an iconic alphabet based on prior work done in deaf education. Tillmann, “Early Modern Instrumental Phonetics,” 401.
22. Quoted in Alexander Melville Bell, Visible Speech: The Science of Universal Alphabetics (London: Simpkin, Marshall, 1867), 24.
23. John Wallis, “A Letter of Dr. John Wallis to Robert Boyle Esq, Concern-ing the Said Doctor’s Essay of Teaching a Person Dumb and Deaf to Speak . . . ,” Philosophical Transactions (1665 – 1678) 5 (1670): 1093.
24. Henry Sweet developed his own “organic alphabet,” based on Visible Speech; it had some influence on the notation of International Phonetics. Henry Sweet, Collected Papers of Henry Sweet, ed. H. C. Wyld (Oxford: Clarendon, 1913), 85.
25. Melville Bell, Visible Speech, 21.26. Melville Bell’s pronunciation standards for English were, in fact, not set
according to efficiency or popularity, but according to the codes of the ruling class. Alexander Melville Bell, World English: The Universal Language (New York: Hodges, 1888), 7.
27. In 1880, the International Congress of Deaf Educators, held in Milan, famously endorsed oralism as a pedagogical strategy, leading to bans on sign lan-guage in many schools. The Milan Treaty was an attempt to enforce mainstream communication and eradicate what is now known as Deaf culture.
28. Carolyn Marvin, When Old Technologies Were New: Thinking about Electric Communication in the Late Nineteenth Century (Oxford: Oxford University Press, 1990), 192.

5 5 Social Text 102 • Spring 2010
29. Robert Brain, “Representation on the Line: The Graphic Method and the Instruments of Scientific Modernism,” in From Energy to Information: Representation in Science and Technology, Art, and Literature, ed. Bruce Clarke and Linda D. Hender-son (Stanford, CA: Stanford University Press, 2002), 162. Brain notes that the few prior self-registering devices did not significantly influence scientists and engineers.
30. Earlier modes of representing sound, for instance Ernst Chladni’s eighteenth- century plates, focused on musical tones rather than speech. Chladni’s plates bore pictorial patterns rather than time-based waves.
31. Édouard-Léon Scott de Martinville, “Principes de Phonautographie” (“Principles of Phonautography”), 26 January 1857, trans. Patrick Feaster, 9. Avail-able at www.firstsounds.org/public/First-Sounds-Working-Paper-01.pdf (accessed 17 September 2009).
32. Édouard-Léon Scott de Martinville, “Fixation Graphique de la Voix” (“Graphic Fixation of the Voice”) (lecture to Société d’Encouragement, 28 Octo-ber 1857), trans. Patrick Feaster, 12. Available at www.firstsounds.org/public/First -Sounds-Working-Paper-03.pdf (accessed 17 September 2009).
33. Hermann von Helmholtz, “The Physiological Causes of Harmony in Music,” in Selected Writings of Hermann von Helmholtz, trans. A. J. Ellis, ed. Russell Kahl (Middletown, CT: Wesleyan University Press, 1971), 88.
34. V. J. Phillips, Waveforms: A History of Early Oscillography (Bristol: Adam Hilger, 1987), 5.
35. The sound “signal” could exist as pressure variations in a variety of media. Rudolph König, “On Manometric Flames,” Philosophical Magazine 45 (1873): 105 – 14.
36. Wallace Clement Sabine, A Student’s Manual of a Laboratory Course in Physical Measurements (Boston: Ginn, 1906), 32.
37. Alexander Graham Bell, The Bell Telephone: The Deposition of Alexander Graham Bell (Boston: American Bell Telephone Company, 1908), 25.
38. Linguist John Joseph contends that “experimental phonetics, the detailed measurement of speech sounds, offered the first truly positivistic approach to lan-guage.” John E. Joseph, “Trends in Twentieth-Century Linguistics: An Overview,” in Concise History of the Language Sciences: From Sumerians to the Cognitivists, ed. E. F. K. Koerner and R. E. Asher (Oxford: Pergamon, 1995), 222.
39. Douglas Kahn, “Concerning the Line: Music, Noise, and Phonography,” in From Energy to Information: Representation in Science and Technology, Art, and Literature, ed. Bruce Clarke and Linda D. Henderson (Stanford, CA: Stanford Uni-versity Press, 2002), 189.
40. Étienne-Jules Marey et al., “Graphic Phonetics,” Scientific American, 17 November 1877, 307.
41. Anson Rabinbach, The Human Motor: Energy, Fatigue, and the Origins of Modernity (New York: Basic, 1990), 116.
42. Marta Braun, Picturing Time: The Work of Etienne-Jules Marey (1830 – 1904) (Chicago: University of Chicago Press, 1992), 348.
43. G. Stanley Hall, “The Graphic Method,” in Aspects of German Culture (Boston: Osgood, 1881), 72.
44. My account is taken from Laurent Mannoni, Georges Demenÿ: Pionnier du Cinema (Paris: Cinematheque Francais/Pagine, 1997), 41 – 42.
45. “En un mot, je jouais du sourd-muet comme on joue d’un orgue de Bar-barie.” M. G. Demenÿ, “Les Photographies Parlantes” (“Talking Photographs”), La Nature 20 (1892): 314.
46. Mannoni, Georges Demenÿ, 47.

5 6 Mills ∙ Deaf Jam
47. Quoted in Braun, Picturing Time, 180. Braun dismisses the phonoscope as “nothing more than a projecting phenakistoscope.”
48. Virgilio Tosi, Cinema before Cinema: The Origins of Scientific Cinematogra-phy, trans. Sergio Angelini (London: British Universities Film and Video Council, 2005), 140.
49. E. W. Scripture, Stuttering, Lisping, and Correction of the Speech of the Deaf (New York: Macmillan, 1923).
50. E. W. Scripture, “Film Tracks of English Vowels,” Journal of the Acoustical Society of America 6 (1935): 169.
51. Frequency, which correlates to the perception of pitch, was calculated by the number of oscillations or cycles per second. Scripture described his method for the harmonic analysis of vowel curves, using a micrometer microscope and a “some-what complicated” set of calculations, in “Inscriptions of Speech,” Volta Review 22 (1920): 426 – 34.
52. Alexander Graham Bell to Mrs. Bingham, 8 [?] 1885, Alexander Graham Bell Papers Series, Box 1, Folder 3, Alexander Graham Bell Association for the Deaf and Hard of Hearing Collection, The History Factory.
53. Robert V. Bruce details Alexander Graham Bell’s passage from harmonic telegraph and phonautograph to telephone — along with the contemporary research of Philipp Reis and Elisha Gray — in Bell: Alexander Graham Bell and the Conquest of Solitude (Boston: Little, Brown, 1973).
54. Phillips, Waveforms, 8.55. Ibid., 6.56. See Dayton Clarence Miller’s chapter on mechanical harmonic analysis in
The Science of Musical Sounds (New York: Macmillan, 1916).57. R. V. L. Hartley, “Transmission of Information,” Bell System Technical
Journal 7 (1928): 542.58. Although Potter described spectrograms as “correlated” to hearing in
early publications, he acknowledged that a true “aural spectrograph” had not yet been achieved. Moreover, different filter combinations and overall bandwidths might allow “visual hearing” beyond the range of the human ear. Ralph K. Potter, “Visible Patterns of Sound,” Science 102 (1945): 463–470; Ralph K. Potter, “Objectives for Sound Portrayal,” Journal of Acoustic Society of America 21 (1949): 1–5.
59. Loretta McDermott Winters and Catherine Teresa McDermott, “Visual Hearing and the Deaf,” Volta Review 48 (1946): 326.
60. Robert L. Swain Jr., Deaf American, September 1970, 4. Clipping in the “Edgar Bloom” folder, Deaf Biographical File Case, Gallaudet University Archives.
61. “Report on Visible Speech Experiments: Summer Session, 1947,” p. 3, Box 3, Folder 11, Harriet Green Kopp Papers, Smithsonian Institution, National Museum of American History.
62. Franklin S. Cooper, Alvin M. Liberman, and John M. Borst, “The Inter-conversion of Audible and Visual Patterns as a Basis for Research in the Perception of Speech,” Proceedings of the National Academy of Science 37 (1951): 318.
63. R. K. Potter and J. C. Steinberg, “Toward the Specification of Speech,” Journal of the Acoustical Society of America 22 (1950): 807 – 20.
64. Gabor, “Communication Theory, Past, Present, and Prospective,” 2.65. Dennis Gabor, “Lectures on Communication Theory,” p. 41 (lectures,
Research Laboratory of Electronics, Massachusetts Institute of Technology, Fall 1951), in DSpace at MIT, hdl.handle.net/1721.1/4830 (accessed 25 June 2008).

57 Social Text 102 • Spring 2010
66. By this time, pulse code modulation (PCM) had already been used to digitize telephone calls simply by sampling a speech wave in time and transmitting patterns of pulses or numbers that corresponded to the amplitudes of the samples. Information theory suggested that signals could be greatly compressed by assign-ing the shortest codes to the most common material, or by eliminating material that was unnecessary because it was imperceptible (irrelevant). Warren Weaver, “Some Recent Contributions to the Mathematical Theory of Communication,” in The Mathematical Theory of Communication, by Claude Shannon and Warren Weaver (1949; repr. Urbana: University of Illinois Press, 1963), 13. Elsewhere, Shannon defined redundancy as “the extent to which it is possible to compress the language.” Claude Shannon, “The Redundancy of English,” in Cybernetics: Circular Causal and Feedback Mechanisms in Biological and Social Systems, Transactions of the Seventh Con-ference, ed. Heinz von Foerster (New York: Josiah Macy Jr. Foundation, 1951), 124.
67. C. E. Shannon, “Prediction and Entropy of Printed English,” Bell Systems Technical Journal 30 (1951): 50 – 64. Jill Lepore reminds that Morse himself “studied quantities of different letter types in a printing shop to determine letter frequency.” Jill Lepore, A Is for American: Letters and Other Characters in the Newly United States (New York: Knopf, 2002), 151.
68. Godfrey Dewey’s father, Melvil (of Dewey Decimal fame), had previously studied the frequencies of written words. Godfrey applied the Funk and Wagnall’s dictionary to the “pronunciation” of words from various written sources. He offered his results to the electroacoustic community: “For the research laboratory of the engineering or manufacturing corporation dealing with such acoustic devices as the telefone or fonograf, these analitic quantitativ data provid important material for study of the most efficient or effctive transmission or reproduction of speech sounds.” Godfrey Dewey, Relativ Frequency of English Speech Sounds (Cambridge, MA: Harvard University Press, 1923), viii.
69. Grant Fairbanks, W. L. Everitt, and R. P. Jaeger, “Method for Time or Frequency Compression-Expansion of Speech,” Transactions of the IRE Professional Group on Audio 2 (1954): 7.
70. Shannon, “Redundancy of English,” 144. Coding eventually included the replacement of “bad redundancy” with cost-efficient redundancy to ensure “spare parts” for messages traveling through noisy or error-prone channels.
71. Pierce, “Early Days of Information Theory,” 5.72. Dennis Gabor, “Communication Theory and Cybernetics,” Transactions
of the IRE Professional Group on Circuit Theory 1 (1954): 19. 73. Moreover, as Frederik Nebeker has recently argued, “the technique
itself — time-frequency signal representation — came to be widely used in signal processing.” Frederik Nebeker, Signal Processing: The Emergence of a Discipline, 1948 to 1998 (New Brunswick, NJ: IEEE History Center, 1998), 44.
74. Potter, Kopp, and Green, Visible Speech, 417.75. Ralph K. Potter, “Audiovisual Music,” Hollywood Quarterly 3 (1947):
66 – 78; Ralph K. Potter, “New Scientific Tools for the Arts,” Journal of Aesthetics and Art Criticism 10 (1951): 126 – 34.
76. Potter, Kopp, and Green, Visible Speech, 421.77. Ralph K. Potter, George A. Kopp, Harriet Green Kopp, Visible Speech,
rev. ed. (New York: Dover, 1965), v. To a limited extent, the sound spectrograph continues to be applied to speech correction, mostly in service of intonation and articulation (as opposed to the direct translation required for visual telephony). For various reasons, spectrograms proved extremely difficult to read as “words.”

5 8 Mills ∙ Deaf Jam
78. “Seeing Heart Sounds,” New York Times, 26 October 1968, 62.79. In the 1960s, Edgar Bloom once again became a Bell test subject — this
time for the Picturephone, which was publicly inaugurated in 1964 with a call between two deaf schoolchildren.
80. Swain, Deaf American.81. Edgar Bloom, quoted in White Plains Reporter Dispatch. Clipping in
the “Edgar Bloom” folder, Deaf Biographical File Case, Gallaudet University Archives.
82. B. Ruby Rich, “The Party Line: Gender and Technology in the Home,” in Processed Lives: Gender and Technology in Everyday Life, ed. Jennifer Terry (New York: Routledge, 1997), 224.