de.marketscreener.com re...de.marketscreener.com
TRANSCRIPT

First quarter 2014 results
Analyst and investor presentation Zurich, 7 May 2014

First quarter 2014 results
• Introduction Michel M. Liès, Group CEO
• Business performance David Cole, Group CFO
• April renewals and financial targets Michel M. Liès, Group CEO
Today’s agenda
2

First quarter 2014 results
Business performance
David Cole, Group CFO
3

First quarter 2014 results
• Group net income USD 1.2bn – Return on equity 14.9%, earnings per share USD 3.58 (CHF 3.20)
– Strong investment performance, return on investments 3.7%
• Reinsurance net income USD 1.1bn – Strong underwriting performance in P&C continues
– Good L&H operating margin, net income impacted by net realised losses
• Corporate Solutions grows profitably, net premiums earned +35.4%
• Admin Re® with exceptional gross cash generation USD 202m
• Book value per common share USD 99.13 (CHF 87.56) – Swiss Re Group SST ratio 241%1
4
Q1 2014 Financial highlights Strong Group performance
1 SST 1/2014 as filed with FINMA at the end of April 2014, consolidated Group view

First quarter 2014 results
Key figures Q1 2014
5
1 Return on investments calculation for 2014 excludes foreign exchange related net realised gains/losses and collateral balances 2 Excluding contingent capital instruments (USD 1 102m, of which USD 352m in P&C Re, USD 750m in L&H Re); basis for ROE and BVPS calculations
Total Q1 2014
Total FY 2013
• Common shareholders' equity2 14 064 5 951 2 567 6 148 5 233 33 919 31 850
of which unrealised gains 624 713 101 951 58 2 447 1 616
• Book value per common share (USD) 99.13 93.08
(CHF) 87.56 82.76
USD m, unless otherwise stated P&C Re L&H Re Corporate Solutions
Admin Re®
Group items
Total Q1 2014
Total Q1 2013
• Premiums earned and fee income 3 813 2 672 830 236 - 7 551 6 782
• Net income/loss 1 003 51 80 48 44 1 226 1 380
• Return on investments1 3.6% 2.8% 3.7% 4.9% 3.3% 3.7% 3.4%
• Return on equity 29.8% 3.6% 12.0% 3.2% 3.5% 14.9% 16.6%
• Combined ratio 78.8% - 95.2% - -
• Operating margin - 9.6% - - -
• Earnings per share (USD) 3.58 4.02
(CHF) 3.20 3.72

First quarter 2014 results
Net income
USD m
Net premiums earned USD m
1 009 1 003 3 534 3 813
+7.9%
ROE: 29.8%
78.8%
69.7%
+9.1%pts -0.6%
Q1 2013 Q1 2014
• Net impact from large nat cats in Q1 2014 was 0.9%pts (8.9%pts below expected)
• Q1 2014 benefited by 5.7%pts from prior year net reserve releases; Q1 2013: 8.2%pts
• Adjusting for expected nat cats and reserve development, CR is 93.4%
6
P&C Reinsurance Robust underwriting and increased investment result
Q1 2013 Q1 2014
• Increase in premiums earned mainly driven by the expiry of a quota share agreement in 2012 and large Asian transactions written at the end of 2013, partially offset by the non-renewal of a large European deal
• Gross premiums written decreased by 0.9%
Q1 2013 Q1 2014
• Both periods benefited from a benign nat cat season
• Continued reserve releases, but at a lower level than in Q1 2013
• Return on investments 3.6% driven by realised gains from the active management of the listed equity portfolio
Combined ratio
%

First quarter 2014 results
Net income
USD m
L&H Reinsurance Strong new business growth, good operating margin
222
51
2 643 3 086
Operating margin1
% +16.8% -4.0%pts
9.6%
13.6%
1 Operating margin is calculated as operating income divided by total operating revenues
ROE: 3.6%
Q1 2013 Q1 2014
• Premiums earned and fee income increased by 15.5%
• Increase driven by recaptured Life business, Health business in Asia, and a large longevity transaction in the UK
• Higher investment result due to asset re-balancing in 2013. Running yield 3.8%; Q1 2013: 3.2%
7
Q1 2013 Q1 2014
• Net realised losses of USD 100m largely due to a non-economic loss on an interest rate hedge; net realised gains in Q1 2013 were USD 111m
• Positive impact from higher investment income and lower interest charges following 2013 capital structure optimisation
-77.0%
Operating revenues USD m
Q1 2013 Q1 2014
• Operating margin of 9.6% demonstrates improvement in the underlying business
• Excluding YRT recapture, operating margin for both periods is stable
• Mortality and morbidity experience was better than expected, particularly in the US and Canada

First quarter 2014 results
101
80
Net income
USD m
613
830
95.2%
87.6%
ROE: 12.0%
+35.4% +7.6%pts -20.8%
Q1 2013 Q1 2014
• No impact from nat cat events, 3.6%pts below expected
• Unfavourable reserve development of USD 17m, impacting CR by 2.0%pts
• Adjusting for expected nat cats and reserve development, CR is 96.8%
8
Corporate Solutions Profitable organic growth continues
Q1 2013 Q1 2014
• Increase in net premiums earned mainly driven by successful organic growth across most lines of business and expiry of a quota share agreement in 2012
• Gross premiums written net of internal fronting for BU Reinsurance increased by 28.9% to USD 0.8bn in Q1 2014
• The exceptional growth includes a large one-off transaction
Q1 2013 Q1 2014
• Realised insurance derivative gains on weather and nat cat business USD 18m; Q1 2013: USD 20m
• ROI 3.7%, mainly driven by realised gains from active management of listed equity portfolio; Q1 2013: 3.2%
• Dividends of USD 300m in Q1 2014
Net premiums earned USD m
Combined ratio
%

First quarter 2014 results
63
202
78
48
Net income
USD m +0.2%pts
1 Gross cash generation (GCG) is the change in excess capital over and above the target capital position
ROE: 3.2%
-38.5% +220.6%
9
4.7% 4.9%
Q1 2013 Q1 2014
• Return on investments of 4.9% primarily driven by net investment income from corporate and government bonds
• Q1 2014 net realised gains of USD 54m; Q1 2013: USD 52m
• Running yield on fixed income portfolio 4.3%; Q1 2013: 4.1%
Q1 2013 Q1 2014
• Q1 2014 net income supported by realised gains, partly offset by higher than expected tax
• Q1 2013 benefited from exceptionally high income from unit-linked business and very low tax
• External credit facility (GBP 550m) established to increase leverage and lower weighted average cost of capital
Admin Re® Cash generation helped by positive prior year effect
Q1 2013
Q1 2014
• Solid underlying gross cash generation in Q1 2014
• Positive impact of USD 142m following finalisation of 2013 UK statutory results
Return on investments
%
Gross cash generation1
USD m

First quarter 2014 results
0.6%
7.8% 3.4%
3.7%
118.2 114.9
Return on investments2
% +0.3%pts -2.8%
Group investment result Consistent and strong performance
10
Total return2
% +7.2%pts
Q1 2013 Q1 2014
• Decrease in average invested assets driven by rising interest rates since Q1 2013
• Net reduction in equity exposure of USD 2.5bn in Q1 2014
• Short duration position in effect as of Q1 2014: DV01 of USD -7.5m
1 Average invested assets excludes cash management activity; 2014 also excludes collateral balances 2 2013 includes foreign exchange related net realised gains/losses, which are excluded from the return on investments and total return scope in 2014
Q1 2013
Q1 2014
• ROI of 3.7% for Q1 2014 driven by net investment income and realised gains from the sale of listed equities
• Net realised gains of USD 234m for Q1 2014; Q1 2013: USD 255m
• Impairments of USD 5m in Q1 2014; Q1 2013: USD 12m
Q1 2013
Q1 2014
• Total return for Q1 2014 impacted by mark-to-market gains driven by lower interest rates
• Group fixed income running yield at 3.4%; Q4 2013: 3.3%; Q1 2013: 3.0%
Average invested assets1
USD bn, basis for ROI calculation
First quarter 2014 results
24% 10-20%
33% 35-55%
5% 5-10%
28% 20-30%
9% 5-10% 1% 0-5%
0%
10%
20%
30%
40%
50%
60%
70%
80%
90%
100%
EndQ1 2014
Mid-termplan
Other (incl. derivatives)Equities and alternatives (incl. Principal Investments)Corporate bonds (incl. loans, municipals and credit ETFs)Securitised productsGovernment bonds (incl. agency)Cash, cash equivalents and short-term investments
11
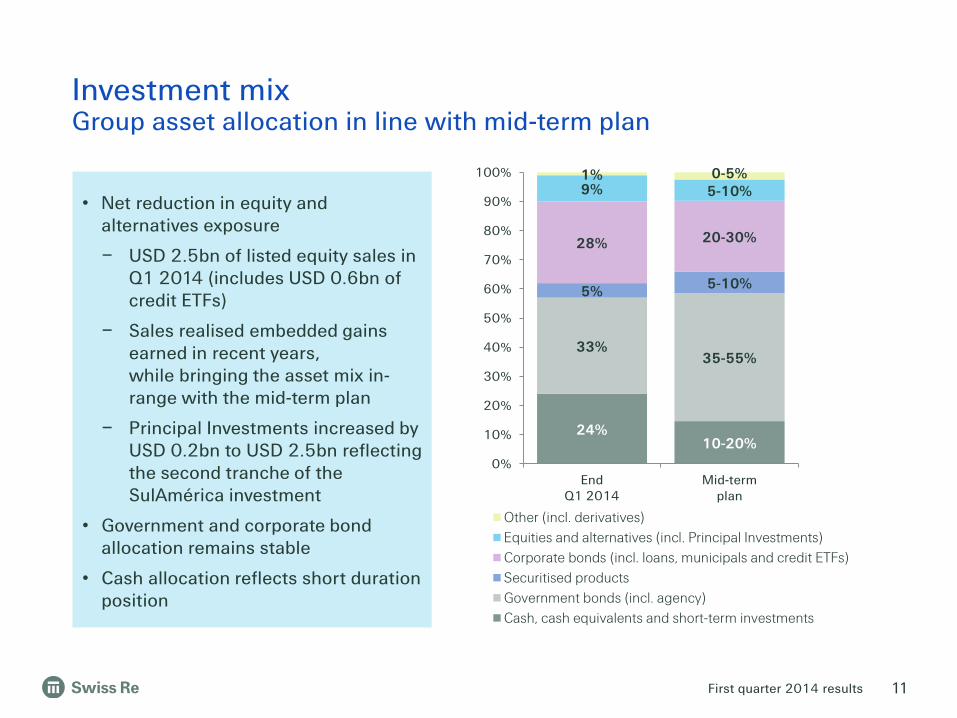
Investment mix Group asset allocation in line with mid-term plan
• Net reduction in equity and alternatives exposure
– USD 2.5bn of listed equity sales in Q1 2014 (includes USD 0.6bn of credit ETFs)
– Sales realised embedded gains earned in recent years, while bringing the asset mix in-range with the mid-term plan
– Principal Investments increased by USD 0.2bn to USD 2.5bn reflecting the second tranche of the SulAmérica investment
• Government and corporate bond allocation remains stable
• Cash allocation reflects short duration position
First quarter 2014 results
31 850
-3 1 226
15 831 33 919
28 000
29 000
30 000
31 000
32 000
33 000
34 000
Commonshareholders'
equity31 Dec 2013
Net incomeattributable to
commonshareholders
Other Foreign currencytranslation
adjustments
Net change inunrealised
gains/losses
Commonshareholders'
equity31 March 2014
USD m
Gov bonds 0.9 Corp bonds 0.5 Sec products 0.0 Equities and others -0.3 Tax -0.3 Total 0.8
12
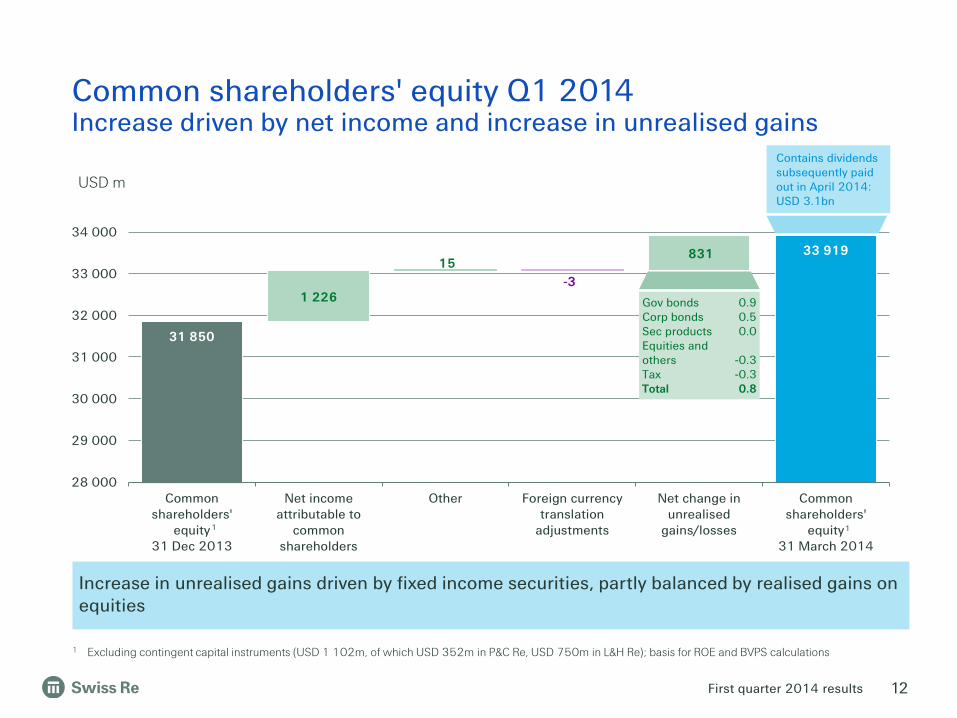
Common shareholders' equity Q1 2014 Increase driven by net income and increase in unrealised gains
Increase in unrealised gains driven by fixed income securities, partly balanced by realised gains on equities
Contains dividends subsequently paid out in April 2014: USD 3.1bn
1 Excluding contingent capital instruments (USD 1 102m, of which USD 352m in P&C Re, USD 750m in L&H Re); basis for ROE and BVPS calculations
1
1

First quarter 2014 results
17.5
27.6 30.7 29.0 33.9
37.2 5.2
5.5 5.4
3.6
5.4 6.5
16.3
16.4 16.3
10.7
9.5 7.0 12.7
13.8 13.6
11.3 8.5 6.7
56% 48%
45% 40%
31% 24%
23%
17% 15% 11% 14% 15%
0%
10%
20%
30%
40%
50%
60%
70%
80%
90%
100%
2008 2009 2010 2011 2012 2013
Core capital Total hybrid incl. contingent capitalSenior debt LOCSenior leverage plus LOC ratio Subordinated leverage ratio
USD bn
• Significant deleveraging of senior debt and LOCs in the course of 2013 • Well on track towards implementation of target capital structure
4 5
1
2 3
Senior leverage plus LOC ratio target range: 15-25%
Subordinated leverage ratio target range: 15-20%
1 Core capital of Swiss Re Group is defined as economic net worth (ENW) 4 Senior debt plus LOCs divided by total capital 2 Senior debt excluding non-recourse positions 5 Subordinated debt divided by sum of subordinated debt and ENW 3 Unsecured LOC capacity of Swiss Re Group (usage is lower) Note: 2009 and prior have been translated from CHF using respective year end fx rates
13
Swiss Re's capital structure Leverage ratios within target range

First quarter 2014 results
April renewals and financial targets
Michel M. Liès, Group CEO
14

First quarter 2014 results
YTD 2014 renewals (January – April)
Treaty portfolio volume
Up for renewalYTD 2014
Estimatedoutcome
USD 11.2bn USD 11.2bn
• Successful April renewals in a challenging environment; wrote attractive new Casualty business in the US
• YTD risk adjusted price quality2 remains at 107%
15
P&C Reinsurance: 2014 renewals Overall price quality remains at an attractive level
January 2014 treaty renewals1
Up for renewal1 Jan 2014
Estimatedoutcome
Up for renewal1 April 2014
Estimatedoutcome
April 2014 treaty renewals
1 January 2014 numbers have been restated with current fx rates 2 Swiss Re's risk adjusted price quality provides an economic view on price quality, ie includes rate and exposure changes, claims inflation and interest rates
USD 9.8bn USD 9.6bn
USD 1.4bn USD 1.6bn
-2%
+14%

First quarter 2014 results 16
1 Excluding nat cat
• Continue to allocate capital to lines with the most favourable risk adjusted returns • Property Cat rates softening significantly for all markets (Swiss Re wrote less nat cat business,
but still at attractive levels) • Casualty book is further growing at profitable terms in all three regions • High Growth Markets volume stable with slightly improved risk adjusted price quality
P&C Reinsurance: 2014 renewals Portfolio weighting by line of business and region
Gross premium volume, treaty portfolio
Estimated outcome YTD April
43%
25%
19%
13% CasualtyNat CatPropertySpecialty
46%
22%
32% EMEAAmericasAsia
1 1
Up for renewal YTD April
By line of business
By region
34%
28%
25%
13%
45%
26%
29%

First quarter 2014 results
89.7 87.8
105.2
123.1
2010 2011 2012 2013 … 2015E
6.6 7.7
11.9 13.0
3.6
9.7
2010 2011 2012 2013 Q12014
… 2015E
Group financial targets On track
in USD2
ROE 700 bps above risk free average over 5 years (2011-2015)
3
7.3 8.0
3
= reported EPS
= EPS @10% avg. annual growth (base: 2010), adjusted for special dividends1
EPS growth 10% average annual growth rate, adjusted for special dividends1
8.4
1 EPS CAGR of 10% has been adjusted to 5% for 2014 to account for the distribution of excess capital through the special dividend of USD 1.6bn in April 2014. Methodology is in line with the approach taken for the special dividend of USD 1.5bn paid in April 2013
2 Assumes constant foreign exchange rate 3 Excl. CPCI 4 Cumulative dividends included in ENW per share were translated from CHF to USD using the fx rate of the dividend payment date; dividends included for 2011: USD
3.1 (CHF 2.75), 2012: USD 6.4 (CHF 3.00, or USD 3.3, in addition to the 2011 dividend), 2013: USD 14.5 (CHF 7.50, or USD 8.05, in addition to the 2011 and 2012 dividends)
17
9.2 9.6
13.4 13.7 14.9
2010 2011 2012 2013 Q12014
… avg.2011-2015E
in %
= reported ROE
= 700 bps above US Gov 5 years
8.5 7.8 8.2
= reported ENWPS including cumulative dividends in USD4
144.5
= ENWPS @ 10% avg. annual growth (base: 2010)
ENW per share growth plus dividends 10% avg. annual growth rate over 5 years
in USD2
8.6
2.2
98.7 108.5
119.4
Delivering the 2011-2015 financial targets remains Swiss Re's top priority

First quarter 2014 results
Appendix
18

First quarter 2014 results
Appendix
• Business segment results Q1 2014 – Income statement
• Business segment results Q1 2014 – Balance sheet
• Shareholders' equity and ROE Q1 2014
• Large losses – P&C Reinsurance
• Large losses – Corporate Solutions
• P&C Reinsurance – Underwriting performance
• Corporate Solutions – Underwriting performance
• Net investment income
• Net realised gains/losses
• Net unrealised gains/losses
• Return on investments basis
• Return on investments (ROI)
• Overall investment portfolio
• Government bonds
• Corporate bonds
• Securitised products
• Equities and alternative investments
• Group capitalisation – Swiss Solvency Test (SST)
• Number of shares
• Exchange rates
• Corporate calendar & contacts
• Cautionary note on forward-looking statements
19

First quarter 2014 results
USD m Re-
insurance P&C Re L&H Re Corporate Solutions
Admin Re®
Group items
Consoli-dation
Total Q1 2014
Total Q1 2013
Revenues Premiums earned 6 472 3 813 2 659 830 126 - - 7 428 6 617 Fee income from policyholders 13 - 13 - 110 - - 123 165 Net investment income/loss – non participating 639 225 414 21 312 39 -4 1 007 941 Net realised investment gains/losses – non participating 163
233
-70
63
51
8 -
285 208
Net investment result – unit-linked and with-profit -54 - -54 - 153 - - 99 2 133 Other revenues 12 12 - - - 78 -88 2 5 Total revenues 7 245 4 283 2 962 914 752 125 -92 8 944 10 069 Expenses Claims and claim adjustment expenses -1 923 -1 923 - -531 - -2 - -2 456 -1 808 Life and health benefits -2 130 - -2 130 - -338 - - -2 468 -2 127 Return credited to policyholders 46 - 46 - -198 - - -152 -2 139 Acquisition costs -1 213 -764 -449 -101 -45 - - -1 359 -1 057 Other expenses -547 -317 -230 -158 -87 -72 78 -786 -817 Interest expenses -185 -62 -123 - -12 -5 14 -188 -188 Total expenses -5 952 -3 066 -2 886 -790 -680 -79 92 -7 409 -8 136 Income/loss before income tax expenses 1 293 1 217 76 124 72 46 - 1 535 1 933 Income tax expense/benefit -221 -208 -13 -44 -24 -2 - -291 -535 Net income/loss before attribution of non-controlling interests 1 072
1 009
63
80
48
44 -
1 244 1 398
Income attributable to non-controlling interests - 1
-1
-
-
-
- -
-1 - Net income/loss after attribution of non-controlling interests 1 071
1 008
63
80
48
44 -
1 243 1 398
Interest on contingent capital instruments -17 -5 -12 - - - - -17 -18 Net income/loss attributable to common shareholders 1 054
1 003
51
80
48
44 -
1 226 1 380
Business segment results Q1 2014 Income statement
20

First quarter 2014 results
31 March 2014, USD m Re-
insurance P&C Re L&H Re Corporate Solutions
Admin Re®
Group items
Consoli-dation
End Q1 2014
End FY 2013
Assets
Fixed income securities 56 908 26 665 30 243 4 753 20 247 66 - 81 974 79 296 Equity securities 3 042 2 661 381 793 - 1 089 - 4 924 7 691 Other investments 17 425 13 982 3 443 151 1 923 5 785 -6 608 18 676 14 884 Short-term investments 17 169 12 235 4 934 1 824 1 197 261 - 20 451 20 989 Investments for unit-linked and with-profit business 910 - 910 - 26 072 - - 26 982 27 215 Cash and cash equivalents 7 330 6 406 924 608 2 005 401 - 10 344 8 072 Deferred acquisition costs 4 861 1 992 2 869 305 1 - - 5 167 4 756 Acquired present value of future profits 1 429 - 1 429 - 2 058 - - 3 487 3 537 Reinsurance recoverable 6 246 4 496 1 750 8 039 310 - -6 601 7 994 8 327 Other reinsurance assets 23 433 13 936 9 497 2 414 3 556 4 -1 777 27 630 24 676 Goodwill 4 092 2 057 2 035 17 - - - 4 109 4 109 Other 14 297 10 043 4 254 1 001 1 056 733 -5 789 11 298 9 968 Total assets 157 142 94 473 62 669 19 905 58 425 8 339 -20 775 223 036 213 520
Liabilities Unpaid claims and claim adjustments expenses 55 151 44 962 10 189 11 624 1 201 12 -6 607 61 381 61 484 Liabilities for life and health policy benefits 17 287 - 17 287 235 18 316 - - 35 838 36 033 Policyholder account balances 1 515 - 1 515 - 29 481 - - 30 996 31 177 Other reinsurance liabilities 16 886 14 507 2 379 4 198 557 7 -2 241 19 407 16 255 Short-term debt 4 520 789 3 731 - 650 998 -2 645 3 523 3 818 Long-term debt 15 405 4 753 10 652 - - - -615 14 790 14 722 Other 25 244 15 029 10 215 1 272 2 072 2 089 -8 623 22 054 17 054 Total liabilities 136 008 80 040 55 968 17 329 52 277 3 106 -20 731 187 989 180 543
Shareholders' equity 21 117 14 416 6 701 2 567 6 148 5 233 -44 35 021 32 952 thereof contingent capital instruments 1 102 352 750 - - - - 1 102 1 102
Non-controlling interests 17 17 - 9 - - - 26 25 Total equity 21 134 14 433 6 701 2 576 6 148 5 233 -44 35 047 32 977 Total liabilities and equity 157 142 94 473 62 669 19 905 58 425 8 339 -20 775 223 036 213 520
Business segment results Q1 2014 Balance sheet
21

First quarter 2014 results
1 Total is after consolidation 2 Excluding contingent capital instruments (USD 1 102m, of which USD 352m in P&C Re, USD 750m in L&H Re); basis for ROE and BVPS calculations 3 Based on published net income attributable to common shareholders
USD m Re-
insurance P&C Re L&H Re Corporate Solutions
Admin Re®
Group items
Total1
Q1 2014
Common shareholders' equity2 at 31 December 2013 18 384 12 904 5 480 2 771 5 804 4 932 31 850
Net income attributable to common shareholders 1 054 1 003 51 80 48 44 1 226
Dividends - - - -300 - 300 -
Other (incl. fx) - -8 8 12 25 -22 12
Net change in unrealised gains/losses 577 165 412 4 271 -21 831
Common shareholders' equity at 31 March 2014 20 015 14 064 5 951 2 567 6 148 5 233 33 919 Contingent capital instruments 1 102 352 750 - - - 1 102 Shareholders' equity at 31 March 2014 21 117 14 416 6 701 2 567 6 148 5 233 35 021
Non-controlling interests 17 17 - 9 - - 26
Total equity at 31 March 2014 21 134 14 433 6 701 2 576 6 148 5 233 35 047
ROE calculation USD m
Re-
insurance
P&C Re L&H Re Corporate Solutions
Admin
Re® Group items
Total1 Q1 2014
Net income/loss attributable to common shareholders 1 054 1 003 51 80 48 44 1 226
Opening common shareholders' equity 18 384 12 904 5 480 2 771 5 804 4 932 31 850
Average common shareholders' equity 19 200 13 484 5 716 2 669 5 976 5 083 32 885
ROE, annualised3 22.0% 29.8% 3.6% 12.0% 3.2% 3.5% 14.9%
22
Shareholders' equity and ROE Q1 2014

First quarter 2014 results
Actual large losses1
Q1 2014 3M 2014 3M 2013 USD m
Net nat cat losses 35 35 -
Net man-made losses 60 60 -
1 Only events exceeding USD 20m included 2 FY 2014 figures will be updated during the year to reflect renewal experience 3 Estimated nat cat premium figure is now gross of acquisition costs
23
Large losses P&C Reinsurance
• The earning pattern for nat cat premium and losses across the quarters has been updated
• There were only two large losses in the quarter
– Snow storms in Japan
– A Credit & Surety loss in Australia
Expected nat cat premiums and losses1, 2
Q3 2014 Q4 2014 FY 2014 FY 2013 USD m Q1 2014 Q2 2014
Expected net nat cat premiums3 25% 15% 35% 25% 2 900 3 100
Expected net nat cat losses 25% 15% 35% 25% 1 500 1 460

First quarter 2014 results
Large losses Corporate Solutions
1 Only events exceeding USD 10m included 2 FY 2014 figures will be updated during the year to reflect business written 3 Estimated nat cat premium figure is now gross of acquisition costs
24
• No large natural catastrophe losses impacted Q1 2014 or Q1 2013
• Elevated net man-made losses of USD 91m in Q1 2014
– Large Credit & Surety loss in Australia of USD 35m
– Large number of medium sized losses with total of USD 56m; affected Property by USD 42m and Other Specialty lines by USD 14m
Actual large losses1
Q1 2014 3M 2014 3M 2013 USD m
Net nat cat losses - - -
Net man-made losses 91 91 32
Expected nat cat premiums and losses1, 2
Q3 2014 Q4 2014 FY 2014 FY 2013 USD m Q1 2014 Q2 2014
Expected net nat cat premiums3 25% 25% 25% 25% 375 340
Expected net nat cat losses 15% 15% 45% 25% 200 170
First quarter 2014 results
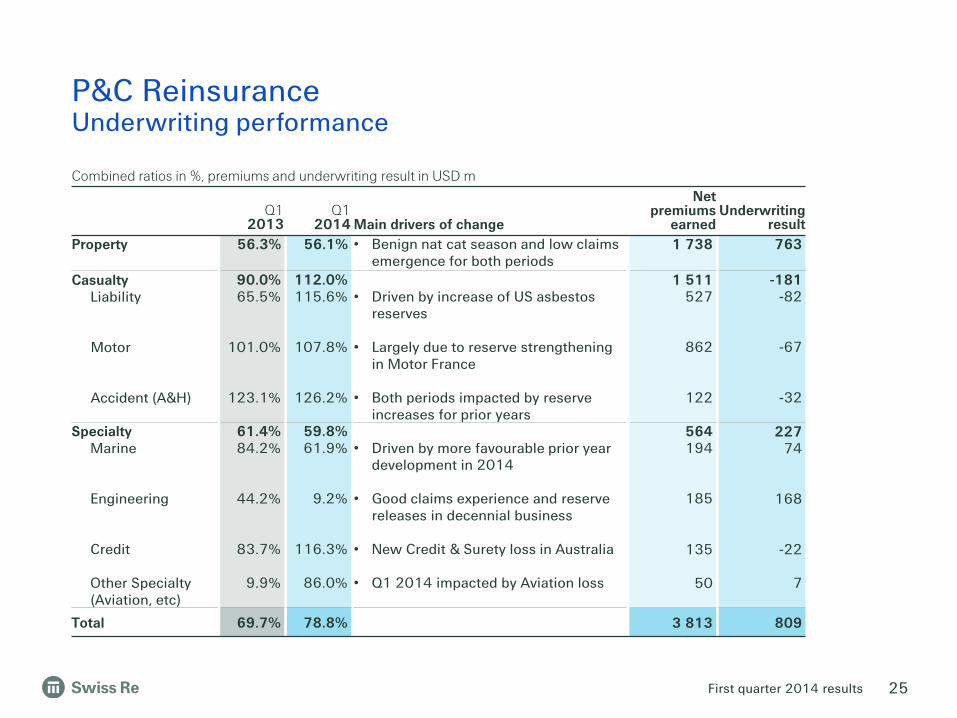
Combined ratios in %, premiums and underwriting result in USD m
Q1 2013
Q1 2014 Main drivers of change
Net premiums
earned Underwriting
result Property 56.3% 56.1% • Benign nat cat season and low claims
emergence for both periods 1 738 763
Casualty Liability Motor Accident (A&H)
90.0% 65.5%
101.0%
123.1%
112.0% 115.6%
107.8%
126.2%
• Driven by increase of US asbestos
reserves
• Largely due to reserve strengthening in Motor France
• Both periods impacted by reserve increases for prior years
1 511 527
862
122
-181 -82
-67
-32
Specialty Marine
Engineering Credit Other Specialty (Aviation, etc)
61.4% 84.2%
44.2%
83.7%
9.9%
59.8% 61.9%
9.2%
116.3%
86.0%
• Driven by more favourable prior year
development in 2014
• Good claims experience and reserve releases in decennial business
• New Credit & Surety loss in Australia
• Q1 2014 impacted by Aviation loss
564 194
185
135
50
227 74
168
-22
7
Total 69.7% 78.8% 3 813 809
P&C Reinsurance Underwriting performance
25

First quarter 2014 results
Corporate Solutions Underwriting performance
Combined ratios in %, premiums and underwriting result in USD m
Q1 2013
Q1 2014 Main drivers of change
Net premiums
earned Underwriting
result Property 77.7% 101.5% • Driven by various man-made losses and
unfavourable prior year development 326 -5
Casualty
110.9% 100.0% • 2013 impacted by negative reserve development in A&H
251 -
Specialty Credit Other Specialty
74.3% 69.6%
76.3%
82.2% 89.4%
78.6%
• New Credit & Surety loss in Australia
• Both periods impacted by notable losses
and favourable prior year development
253 85
168
45 9
36
Total 87.6% 95.2% 830 40
26

First quarter 2014 results
Net investment income
1 Income from assets backing with-profit and unit-linked business are credited to policyholders' accounts and are excluded from investment income available to shareholders
• Q1 2014 fixed income running yield increased to 3.4%, mainly due to additional paydowns on securitised products, partially offset by the impact of mark-to-market gains during the quarter
• Decrease in government bond income is impacted by the short duration position
• Increase in corporate bond income is primarily due to re-balancing of the investment portfolio completed in 2013
• Increase in real estate, PE, HF mainly due to additional mark-to-market gains from equity accounted investments
• Increase in unit-linked income driven by higher equity investment income
27
USD m P&C Re L&H Re Corporate Solutions
Admin Re®
Group items
Consoli-dation
Total Q1 2014
Total Q1 2013
Investment related income 213 331 26 229 40 -4 835 757
Government bonds 87 132 9 58 - - 286 343 Corporate bonds 46 116 13 149 - - 324 257 Securitised products 26 36 3 10 1 - 76 53
Short-term investments 12 13 1 1 - - 27 29 Equities 15 1 4 - - - 20 14 Real estate, PE, HF 62 41 - - 46 - 149 111 Investment expenses -52 -21 -6 -9 -15 13 -90 -93 Other 17 13 2 20 8 -17 43 43
Insurance related income 12 83 -5 83 -1 - 172 184 Policy loans - - - 3 - - 3 3 Deposit interest and fee income 10 80 -5 74 - - 159 177 Other 2 3 - 6 -1 - 10 4
Non-participating investment income 225 414 21 312 39 -4 1 007 941 Income from with-profit business1 - - - 34 - - 34 34 Income from unit-linked business1 - 2 - 218 - - 220 162 Total net investment income 225 416 21 564 39 -4 1 261 1 137

First quarter 2014 results
USD m P&C Re L&H Re Corporate Solutions
Admin Re®
Group items
Consoli-dation
Total Q1 2014
Total Q1 2013
Investment related 217 -82 43 54 2 - 234 255
Government bonds 45 -5 - 49 - - 89 181 Corporate bonds 11 1 2 3 - - 17 65 Securitised products 2 4 - 2 1 - 9 2 Equities 194 38 44 - 2 - 278 77 Real Estate, PE, HF 23 - -2 - - - 21 -11 Foreign exchange remeasurement and designated trading portfolios1 -61
Other asset classes -58 -120 -1 - -1 - -180 2 Insurance related -17 30 19 - -2 - 30 -47 Foreign exchange remeasurement1 33 -18 1 -3 8 - 21 - Non-participating realised gains and losses 233 -70 63 51 8 - 285 208 Net gains/losses from with-profit business2 - - - 21 - - 21 66 Net gains/losses from unit-linked business2 - -56 - -120 - - -176 1 871 Total net realised gains and losses 233 -126 63 -48 8 - 130 2 145
Net realised gains/losses
1 Foreign exchange related net realised gains/losses are excluded from the investment related net realised gains/losses for 2014. Designated trading portfolios are now included with the respective asset classes
2 Income from assets backing with-profit and unit-linked business are credited to policyholders' accounts and are excluded from investment income available to shareholders
• Investment related net realised gains primarily driven by sales within the listed equity portfolio
• Decrease in realised gains from government bonds as compared to Q1 2013
• Other asset classes includes losses largely related to economic interest rate hedges for the Canadian L&H portfolio and foreign exchange derivatives
• Unit-linked business related net realised losses primarily from mark-to-market losses on equities as relevant markets decreased in value
28

First quarter 2014 results
USD m P&C Re L&H Re Corporate Solutions
Admin Re®
Group items
End Q1 2014
End FY 2013
Government bonds 163 502 -16 485 - 1 134 261 Corporate bonds 91 381 15 977 - 1 464 945 Securitised products 41 116 8 61 2 228 206 Equities 431 48 148 - 53 680 966 Other 277 17 1 9 19 323 279 Total on-balance sheet 1 003 1 064 156 1 532 74 3 829 2 657
Real estate 1 742 - - - - 1 742 1 726 Other - 7 - - - 7 -
Total off-balance sheet 1 742 7 - - - 1 749 1 726
Total net unrealised gains/losses 2 745 1 071 156 1 532 74 5 578 4 383
Net unrealised gains/losses
• Increase in unrealised gains on government bonds mainly due to lower interest rates in Q1 2014
• Increase in unrealised gains on corporate bonds primarily from lower interest rates, as well as narrower credit spreads during the quarter
• Increase in unrealised gains on securitised products mainly from RMBS and ABS positions as interest rates decreased during the quarter
• Decrease in unrealised gains on equities mostly driven by the realisation of gains from sales during the quarter
29

First quarter 2014 results
USD bn End
Q1 2014 End
FY 2013
Total investment portfolio 163.3 158.2 Unit-linked investments With-profit business
-24.3 -3.5
-24.6 -3.5
Total (excl. unit-linked and with-profit) 135.5 130.1 Cash and cash equivalents Policy loans Other – insurance related Financial liabilities and other1
-9.5 -0.3 1.7
-13.2
-7.2 -0.3 1.0
-6.1
Total 114.2 117.5
Investments included in the ROI calculation
1 Includes securities in transit, repurchase agreements, securities lending and other assets backing insurance; 2014 also includes collateral balances
Return on investments basis
30

First quarter 2014 results
Return on investments (ROI)
USD m P&C Re L&H Re Corporate Solutions
Admin Re®
Group items
Consoli-dation
Total Q1 2014
Total Q1 2013
Net investment income 213 331 26 229 40 -4 835 757 Net realised gains/losses1 217 -82 43 54 2 - 234 255 Other revenues 10 - - - 1 -10 1 - Investment operating income 440 249 69 283 43 -14 1 070 1 012 Less minority interest income - - - - - - - - Less income from cash/interest income -4 -2 -1 - - - -7 -9
Less income from securities lending, repurchase agreements and collateral balances
-10 - - - - -1 -11 -13
Basis for ROI 426 247 68 283 43 -15 1 052 990 Average investment assets at avg. fx rates2
46 859 35 829 7 348 22 952 5 190 -3 257 114 921 118 192
ROI, annualised 3.6% 2.8% 3.7% 4.9% 3.3% n/a 3.7% 3.4%
1 Foreign exchange related net realised gains/losses are excluded from ROI calculation for 2014 2 Average assets calculation based on monthly average; 2014 excludes collateral balances from ROI scope
31

First quarter 2014 results
USD bn End
Q1 2014
Balance sheet values 163.3
Unit-linked investments -24.3
With-profit business -3.5 Assets for own account (on balance sheet only) 135.5
1 Includes cat bonds and loans 2 Comprised of listed equities, hedge funds – equities, private equity and includes Principal Investments 3 Includes alternative investments such as hedge funds – non equities and real estate, derivatives and other investments
USD bn P&C Re L&H Re Corporate Solutions
Admin Re®
Group items
Consoli-dation
End Q1 2014
End FY 2013
Cash and cash equivalents 6.4 0.9 0.6 1.2 0.4 - 9.5 7.2 Short-term investments 12.2 4.9 1.8 1.2 0.4 - 20.5 21.0 Government bonds 18.1 15.8 2.5 6.9 - - 43.3 41.0 Corporate bonds 6.0 11.9 1.7 12.6 - - 32.2 31.6 Securitised products1 2.6 2.5 0.5 0.8 - - 6.4 6.7 Equities2 4.6 0.8 0.8 - 2.3 - 8.5 10.8 Mortgages and other loans 1.5 1.2 - 1.4 2.0 -3.3 2.8 2.6 Policy loans - 0.1 - 0.2 - - 0.3 0.3 Other – investment related3 10.5 1.8 0.1 - 2.2 -0.9 13.7 9.9 Other – insurance related - - 0.1 0.2 0.4 -2.4 -1.7 -1.0 Total 61.9 39.9 8.1 24.5 7.7 -6.6 135.5 130.1
32
Overall investment portfolio 54% invested in cash, short-term investments or government bonds
Cash and cash
equivalents 7%
Short-term investments
15%
Government bonds incl.
Agency 32%
Corporate bonds 24%
Securitised products
5%
Equities 6%
Mortgages and other
loans 2%
Other 9%

First quarter 2014 results
• Government bonds valued at 101.9% of par2
• Increase from Q4 2013 mainly due to net purchases of USD 1.3bn and change in unrealised gains of USD 0.9bn as global interest rates decreased during the quarter
USD m S&P rating
31 Mar 20141 End
Q1 2014 % of Total
United States AA+ 12 436 28.7%
United Kingdom AAA 11 308 26.1%
Canada AAA 3 310 7.6%
China AA- 1 032 2.4%
Australia AAA 736 1.7%
Japan AA- 733 1.7%
Switzerland AAA 663 1.5%
RoW and other AAA-NR 2 692 6.2%
Non-Eurozone market value 32 910 75.9%
Germany AAA 4 925 11.4%
France AA 3 155 7.3%
Netherlands AA+ 1 118 2.6%
Eurozone other AAA-BB 1 222 2.8%
Eurozone market value 10 420 24.1%
Total market value 43 330 100%
1 Represents S&P's local currency long term debt rating for the respective countries 2 Excluding interest only positions
33
Government bonds Steady allocation
Austria 36%
EIB (European Investment
Bank) 27%
EEC/EU super-
sovereign 7%
Finland 24%
Other 6%
Eurozone other: USD 1 222m
Other includes European peripheral exposure of USD 7m:
Portugal BB USD 7m Italy nil Spain nil Greece nil Ireland nil

First quarter 2014 results
USD m End
Q1 2014 % of
Total
Resources 3 633 11.3%
Basic industries 1 648 5.1%
Cyclical consumer goods 938 2.9%
Cyclical services 3 391 10.5%
Energy, utilities & mining 3 339 10.4%
Financials 12 591 39.1%
General industries 1 080 3.4%
Information technologies 494 1.5%
Non-cyclical consumer goods 2 733 8.5%
Non-cyclical services 2 362 7.3%
Total¹ 32 209 100%
End Q1 2014
Pfandbriefe / covered bonds
13%
Banks 52%
Specialty 15%
Insurance 13%
Real Estate, other 7% Total 100%
USD 0.5bn mark-to-market gains due to decreasing interest rates and narrower credit spreads
1 Includes Pfandbriefe/covered bonds; excludes credit ETFs
Corporate bonds High quality and well diversified
34
56%
13% 7%
5%
5% 3%
3%
2% 6% United States
United Kingdom
Netherlands
Australia
Canada
Switzerland
Sweden
France
Other
48%
35%
7% 5%
5%
BBB
A
AA
AAA
<BBB

First quarter 2014 results
43%
15%
39%
3%
Securitised products 56% AAA rated, 89% investment grade
1 Excludes cat bonds and loans
USD m End
FY 2013 End
Q1 2014 Aaa Aa A BBB BB and below
Est. % par
CMBS 2 908 2 705 1 489 216 423 194 383 103%
RMBS 915 924 234 27 365 106 192 89%
Other ABS 2 453 2 483 1 736 318 203 159 67 102%
Other Securitised 199 174 62 56 28 - 28 62%
Total1 6 475 6 286 3 521 617 1 019 459 670 99% Total: USD 6.3bn (99% par)
Decrease of USD 189m mainly due to paydowns of CMBS during the quarter
35

First quarter 2014 results
67%
18%
15%
Real Estate by geography
Switzerland
Indirect Real Estate
Germany
Equities and alternative investments Net reduction in listed equities
USD m End
FY 2013 End
Q1 2014
Listed Equities1 6 248 3 757
Private Equity1 1 808 1 791
Hedge Funds - equities 458 457
Principal Investments2 2 278 2 501
Total market value 10 792 8 506
USD m End
FY 2013 End
Q1 2014
Hedge Funds – non equities 919 908
Real Estate 3 121 3 128
Total market value 4 040 4 036
Equities
Alternative investments
• Decrease in listed equities of USD 2.5bn from a reduction in exposure
• 54% of hedge funds and 68% of private equity investments are equity accounted; mark-to-market recorded through net investment income
• Increase in Principal Investments reflecting the second tranche of the SulAmérica investment
36
12%
22%
17% 15%
8%
6%
8%
5% 2% 4% 1%
Listed Equities by sector
Exchange-traded fundsNon-Cyclical Consumer GoodsFinancialsInformation TechnologyCyclical ServicesGeneral IndustrialsResourcesNon-Cyclical ServicesBasic IndustriesCyclical Consumer GoodsUtilities
1 Excludes Principal Investments 2 Principal Investments consists of listed equities (USD 692m) and Private Equity (USD 1 809m)
First quarter 2014 results 37
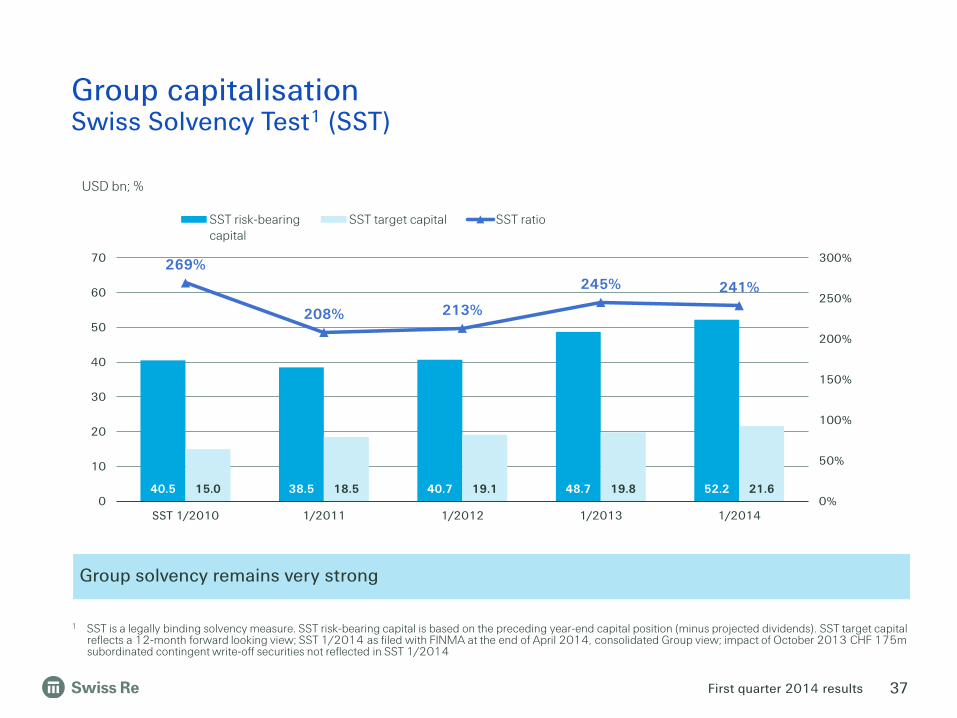
Group capitalisation Swiss Solvency Test1 (SST)
1 SST is a legally binding solvency measure. SST risk-bearing capital is based on the preceding year-end capital position (minus projected dividends). SST target capital reflects a 12-month forward looking view; SST 1/2014 as filed with FINMA at the end of April 2014, consolidated Group view; impact of October 2013 CHF 175m subordinated contingent write-off securities not reflected in SST 1/2014
Group solvency remains very strong
40.5 38.5 40.7 48.7 52.2 15.0 18.5 19.1 19.8 21.6
269%
208% 213%
245% 241%
0%
50%
100%
150%
200%
250%
300%
0
10
20
30
40
50
60
70
SST 1/2010 1/2011 1/2012 1/2013 1/2014
SST risk-bearingcapital
SST target capital SST ratio
USD bn; %

First quarter 2014 results
Number of shares
1 Shares outstanding is the number of shares eligible for dividends and is used for the BVPS and EPS calculation
in millions Q1 2014
Total shares 370.7
of which Treasury shares and shares reserved for corporate purposes 28.5
Shares outstanding1 (as at 31 March 2014) 342.2
Shares outstanding1 (weighted average) 342.8
38
First quarter 2014 results
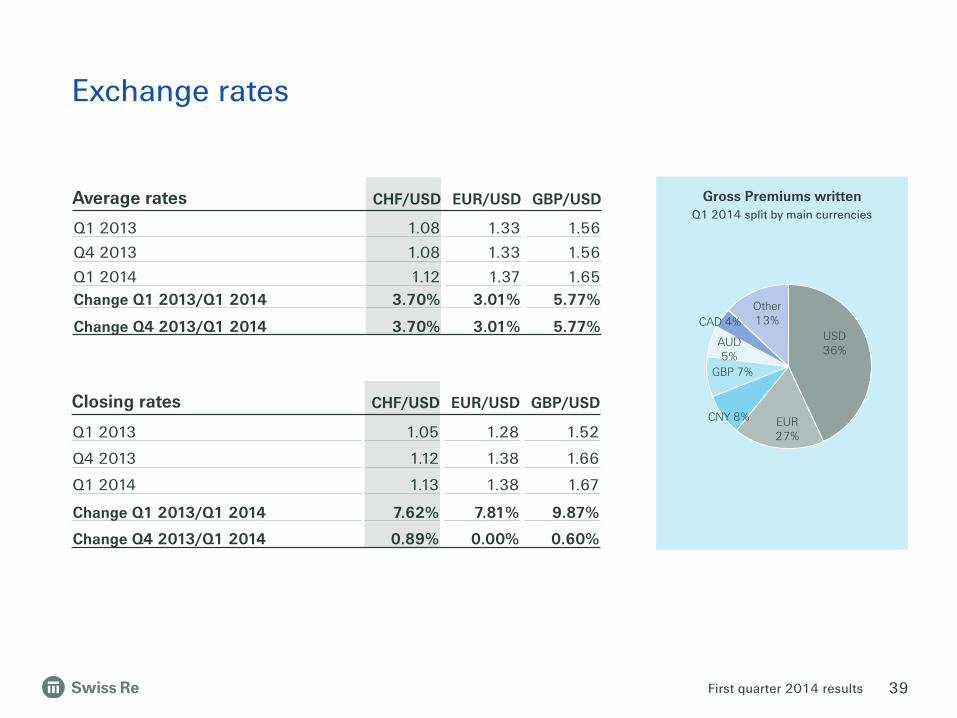
Closing rates CHF/USD EUR/USD GBP/USD
Q1 2013 1.05 1.28 1.52
Q4 2013 1.12 1.38 1.66
Q1 2014 1.13 1.38 1.67
Change Q1 2013/Q1 2014 7.62% 7.81% 9.87%
Change Q4 2013/Q1 2014 0.89% 0.00% 0.60%
Average rates CHF/USD EUR/USD GBP/USD
Q1 2013 1.08 1.33 1.56
Q4 2013 1.08 1.33 1.56
Q1 2014 1.12 1.37 1.65 Change Q1 2013/Q1 2014 3.70% 3.01% 5.77%
Change Q4 2013/Q1 2014 3.70% 3.01% 5.77%
Exchange rates
39
USD 36%
EUR 27%
CNY 8%
GBP 7%
AUD 5%
CAD 4% Other 13%
Gross Premiums written Q1 2014 split by main currencies

First quarter 2014 results
Investor Relations contacts Hotline E-mail +41 43 285 4444 [email protected] Eric Schuh Ross Walker Chris Menth +41 43 285 4708 +41 43 285 2243 +41 43 285 3878
Simone Lieberherr Simone Fessler +41 43 285 4190 +41 43 285 7299
Corporate calendar & contacts
Corporate calendar 3 July 2014 Investors' Day London 6 August 2014 Second Quarter 2014 results Conference call 7 November 2014 Third Quarter 2014 results Conference call 19 February 2015 Annual Results Conference call
40

First quarter 2014 results 41

First quarter 2014 results
Cautionary note on forward-looking statements
Certain statements and illustrations contained herein are forward-looking. These statements (including as to plans objectives, targets and trends) and illustrations provide current expectations of future events based on certain assumptions and include any statement that does not directly relate to a historical fact or current fact. Forward-looking statements typically are identified by words or phrases such as “anticipate“, “assume“, “believe“, “continue“, “estimate“, “expect“, “foresee“, “intend“, “may increase“ and “may fluctuate“ and similar expressions or by future or conditional verbs such as “will“, “should“, “would“ and “could“. These forward-looking statements involve known and unknown risks, uncertainties and other factors, which may cause Swiss Re’s actual results of operations, financial condition, solvency ratios, liquidity position or prospects to be materially different from any future results of operations, financial condition, solvency ratios, liquidity position or prospects expressed or implied by such statements or cause Swiss Re to not achieve its published targets. Such factors include, among others: • further instability affecting the global financial system and developments related
thereto; • deterioration in global economic conditions; • Swiss Re’s ability to maintain sufficient liquidity and access to capital markets,
including sufficient liquidity to cover potential recapture of reinsurance agreements, early calls of debt or debt-like arrangements and collateral calls due to actual or perceived deterioration of Swiss Re’s financial strength or otherwise;
• the effect of market conditions, including the global equity and credit markets, and the level and volatility of equity prices, interest rates, credit spreads, currency values and other market indices, on Swiss Re’s investment assets;
• changes in Swiss Re’s investment result as a result of changes in its investment policy or the changed composition of its investment assets, and the impact of the timing of any such changes relative to changes in market conditions;
• uncertainties in valuing credit default swaps and other credit-related instruments; • possible inability to realise amounts on sales of securities on Swiss Re’s balance
sheet equivalent to their mark-to-market values recorded for accounting purposes; • the outcome of tax audits, the ability to realise tax loss carryforwards and the
ability to realise deferred tax assets (including by reason of the mix of earnings in a jurisdiction or deemed change of control), which could negatively impact future earnings;
• the possibility that Swiss Re’s hedging arrangements may not be effective; • the lowering or loss of one of the financial strength or other ratings of one or more
Swiss Re companies, and developments adversely affecting Swiss Re’s ability to achieve improved ratings;
• the cyclicality of the reinsurance industry; • uncertainties in estimating reserves; • uncertainties in estimating future claims for purposes of financial reporting,
particularly with respect to large natural catastrophes, as significant uncertainties may be involved in estimating losses from such events and preliminary estimates may be subject to change as new information becomes available;
• the frequency, severity and development of insured claim events; • acts of terrorism and acts of war; • mortality, morbidity and longevity experience; • policy renewal and lapse rates; • extraordinary events affecting Swiss Re’s clients and other counterparties,
such as bankruptcies, liquidations and other credit-related events; • current, pending and future legislation and regulation affecting Swiss Re or its
ceding companies, and the interpretation of legislation or regulations by regulators;
• legal actions or regulatory investigations or actions, including those in respect of industry requirements or business conduct rules of general applicability;
• changes in accounting standards; • significant investments, acquisitions or dispositions, and any delays,
unexpected costs or other issues experienced in connection with any such transactions;
• changing levels of competition; and • operational factors, including the efficacy of risk management and other
internal procedures in managing the foregoing risks.
These factors are not exhaustive. Swiss Re operates in a continually changing environment and new risks emerge continually. Readers are cautioned not to place undue reliance on forward-looking statements. Swiss Re undertakes no obligation to publicly revise or update any forward-looking statements, whether as a result of new information, future events or otherwise. This communication is not intended to be a recommendation to buy, sell or hold securities and does not constitute an offer for the sale of, or the solicitation of an offer to buy, securities in any jurisdiction, including the United States. Any such offer will only be made by means of a prospectus or offering memorandum, and in compliance with applicable securities laws.
42