de - colombo stock exchange · core banking growth and profitability the principal source of income...
TRANSCRIPT
de
For the year ended 31 December 2015
`
PRESS RELEASE 24th February 2016
Union Bank records impressive growth in 2015 - Gears for further success
Union Bank of Colombo PLC (UBC) and its subsidiaries concluded the year 2015 with a notable
business performance; reflected by a 226% increase in post-tax profit that signals the strong
growth momentum mobilised within the year.
Core Banking growth and Profitability
The principal source of income from the Bank’s fund based operations escalated to Rs. 2,022
Mn in 2015. This is an increase of Rs. 259 Mn or 15% compared to Rs. 1,763 Mn recorded in the
previous year. It is a noteworthy achievement, given the substantial reduction in interest
spreads experienced by the Bank during the year.
Net Interest margins dropped due to decreasing spreads and increased investments made in
Unit Trusts during the year. Return on the Unit Trust investments are reflected under Net
Trading Income of the Bank.
The Bank’s Loans and Advances stood at Rs. 40,095 Mn as at 2015 year-end. This is a Rs. 14,151
Mn (55%) growth in comparison to the previous year, and is the highest absolute growth
achieved by the Bank since its inception.
The composition of Loans and Advances of the Bank changed in line with its new strategic
positioning, as a fully-fledged commercial bank serving a wider clientele including Corporate,
SME and Retail Banking segments. Corporate Banking contributed to the highest portion of the
growth, given that the Bank employed focused efforts to strengthen its corporate loan book in
2015, in an endeavor to grow fee and commission income.
Results at a Glance Group Performance
Operating Income grows 25% YoY to Rs. 3,436 Mn
Net Profit grows 226% YoY to Rs. 255 Mn
Bank’s Performance
Operating Income grows 24% YoY to Rs. 2,839 Mn
Net Profit grows 238% YoY to Rs. 193 Mn
Loans and Advances grow 54% YTD to Rs. 40,095 Mn
Customer Deposits grow 35% YTD to Rs. 37,653 Mn
Significant improvement in asset quality with Net NPA at 2.7%
Total Assets of the Bank increase by 45% to Rs. 71,005 Mn

`
PRESS RELEASE 24th February 2016 UBC revamped its Retail Banking proposition in 2015, with a broader product spectrum aided
by aggressive network growth; while consciously narrowing the pawning portfolio to reduce the
risk appetite. The Deposits Base of UBC stood at Rs. 37,652 Mn as at year-end. This is a Rs.
9,844 Mn (35%) growth in comparison to 2014. The growth in Fixed Deposits was recorded as
Rs. 7,719 Mn.
The Bank focused on an aggressive CASA (Current and Savings Accounts) drive which was
supported by several strategic initiatives such as; the expansion of the off-site ATM network,
introduction of Debit Cards, setting up a dedicated sales force and rebranding the branch
outlook. CASA recorded a growth of 33% in comparison to 2014.
The Fee and Commission Income of the Bank was Rs. 226 Mn which translates to a year-on-year
growth of 15%. This was mainly attributed to the increase in fee and commission income from
Loans, Cards, Trade and Remittances. The Bank made significant efforts to strengthen its fee
and commission based businesses, and plans to leverage the key enablers that were established
during 2015.
UBC reported a Net Trading Income of Rs. 278 Mn, which is a significant growth of 189% year-
on-year. This was due to an increase in investments made in the Unit Trusts. In 2015, UBC made
a strategic decision to exit the equity trading portfolio and held no trading stocks as at the year
end. Other Operating Income of the Bank was Rs. 359 Mn, which reflects a growth of 28% year-
on-year. This was mainly attributed to the 73% growth reported in Foreign Exchange gains.
The Bank was affected with one of the highest NPL ratios in the industry in mid-2014. The NPL
ratio improved significantly to 2.7% as at the reporting date. NPL ratios as at the end of 2014
was 7.4%. Reflecting a noteworthy improvement in portfolio quality, the Credit Loss Expense of
the Bank reduced to Rs.176 Mn from Rs. 541 Mn in 2014.
Operating expenses of the Bank was Rs. 2,334 Mn which is a 42% increase year-on-year. This
was mainly due to the strategic investments which included the expansion of network and
reach along with investments made in technology and human resources during the year.
The Bank maintained a healthy Liquid Assets Ratio throughout the year. UBC continued to
maintain a healthy Capital Adequacy Ratio which is well above the regulatory requirement,
reporting a 24% core capital ratio as at the year-end.
Group Performance
The Group, consisting of the Bank and its two subsidiaries - UB Finance Company Limited and
National Assets Management Limited reported robust results in 2015. The Group reported pre
and post-tax profits of Rs. 292 Mn and Rs. 255 Mn respectively, compared to Rs. 161 Mn and
Rs. 78 Mn reported in 2014. Annual growth rates for pre and post- tax profits were, 82% and
226% respectively. The Bank was the significant contributor towards the group Net Interest

`
PRESS RELEASE 24th February 2016 Income (NII), accounting for 83% of the total NII. The Group reported a NII of Rs. 2,440 Mn
compared to Rs.1,971 Mn reported in 2014. The annual growth rates for NII was 24%.
The Group recorded significant volume growth in terms of loans and advances growing its
portfolio to Rs.45.5Bn in 2015, an increase of 56% year-on-year. This was a result of the Bank’s
intention to grow the book aggressively while maintaining a profitable mix. The Bank
contributed to 88% of the Group’s total loans and advances. The Group also recorded a
significant increase in customer deposits recording a portfolio of Rs. 41.6Mn in 2015, a growth
of 37% year-on-year. The Bank contributed 90% of the Group’s total customer deposits. Fixed
Deposits accounted for 78% of the total deposits base and grew by 39% year-on-year.
The Group reported a 15% increase in fee based operations. Trading and other income also
reported a strong performance, recording a growth of 35% year-on-year.
Operational Performance
This robust financial performance, endorses the Bank’s renewed strategic focus as a fully-
fledged commercial bank serving a diverse clientele including Retail, SME and Corporate
segments.
The impressive results further reveal the success of the rapid expansion initiatives implemented
by UBC during the year, following the land mark investment from TPG - one of the largest global
private investment firms. UBC’s expansion initiatives underlined remarkable upward
momentum in 2015, with the island-wide network increasing to 64 branches by the end of the
year. The Bank’s rapidly growing ATM reach expanded across 37 new off-site ATM locations in
2015, sizing up the total ATM reach of the Bank to 102 ATMs delivering enhanced convenience
of easy account access island-wide. In line with the Bank’s mandate to deliver greater banking
convenience to customers, 22 existing branches were remodeled in the year 2015, unveiling a
new look and offering a redefined banking experience to customers.
Enhancing and adding value to the Bank’s product portfolio is an integral part of UBC’s growth
strategy. Hence in the year 2015, UBC expanded its product and service offerings especially in
the Retail Banking segment; fortifying its product portfolio with customer-centric solutions that
deliver enhanced value. The launch of the Union Bank VISA International Debit Card and
introduction of the Salary Power savings solution that caters to the specific financial needs of
the employed individuals were some of the key new products introduced within the year.
The focused efforts towards building strong Corporate and SME portfolios were fortified with
new customer relationships established within the year. Strengthening of credit under-writing
processes, centralisation of operations, and setting up of a SME credit centre further
augmented the Bank’s business performance in these categories.

`
PRESS RELEASE 24th February 2016
An integrated communications campaign launched mid-year, was continued throughout the
second half of 2015, in a bid to build stronger corporate brand equity under the premise “Make
the rest of your life the best of your life with Union Bank”. The campaign has succeeded in
delivering greater brand visibility for UBC and has supported the efforts to position the Bank as
a fully-fledged Commercial Bank serving unique financial needs of a diverse clientele.
Marking a milestone in Retail Banking, UBC was conferred the ‘Speed to Market Award 2015’
at the Visa Client Forum India and South Asia in recognition of the speed and success of the
Debit Card launch. UBC’s Annual Report 2014 won the ‘Compliance Award for Excellence’ in
the financial services sector at the grand finale of the 51st Annual Report Awards conducted by
the Institute of Chartered Accountants of Sri Lanka.
Commenting on the performance of the Bank, Director/Chief Executive Officer of Union Bank
Mr. Indrajit Wickramasinghe stated “We have completed a successful year of strong financial
results, and significant reforms towards laying a solid foundation for more ambitious growth in
the years to come. There were many changes implemented during 2015 in terms of the
business focus and strategy, with significant investments being made on people, processes and
technology. Looking into 2016 and beyond, the Bank will continue on its strong growth
trajectory with the intent of becoming one of the leading private sector banking institutions in
Sri Lanka.”
-Ends -
Union Bank of Colombo PLC
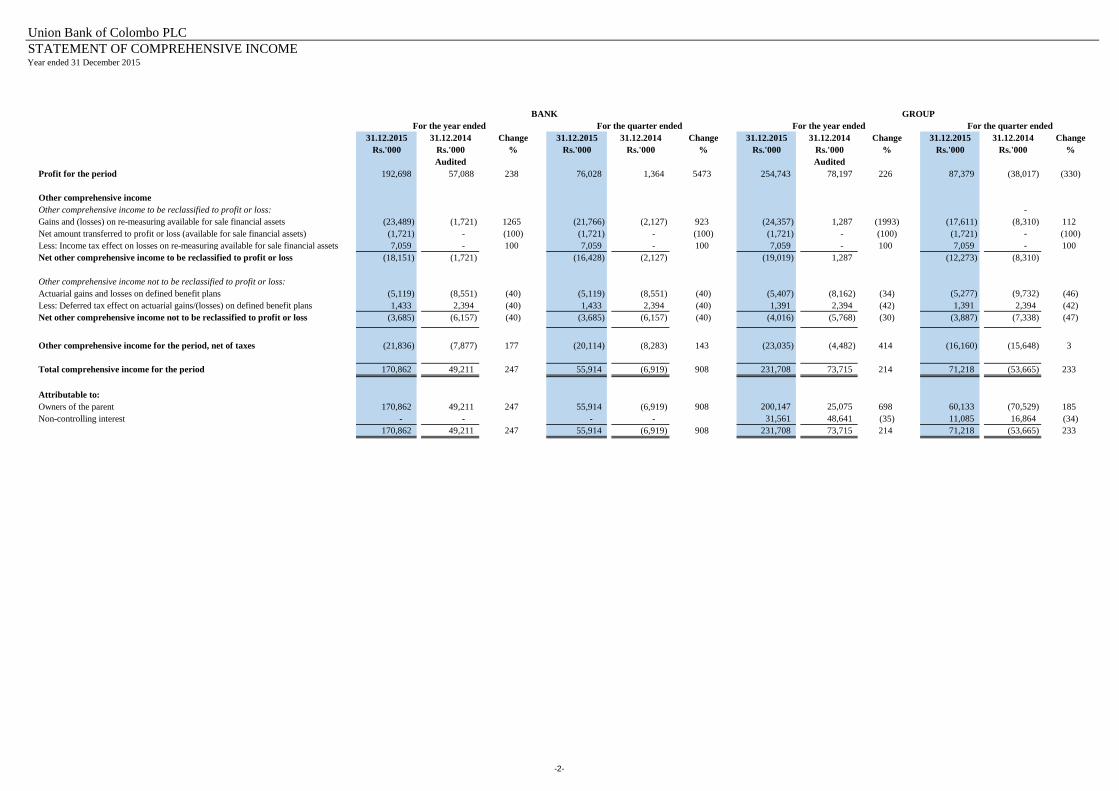
STATEMENT OF COMPREHENSIVE INCOMEYear ended 31 December 2015
31.12.2015 31.12.2014 Change 31.12.2015 31.12.2014 Change 31.12.2015 31.12.2014 Change 31.12.2015 31.12.2014 Change
Rs.'000 Rs.'000 % Rs.'000 Rs.'000 % Rs.'000 Rs.'000 % Rs.'000 Rs.'000 %
Audited Audited
Profit for the period 192,698 57,088 238 76,028 1,364 5473 254,743 78,197 226 87,379 (38,017) (330)
Other comprehensive income
Other comprehensive income to be reclassified to profit or loss: -
Gains and (losses) on re-measuring available for sale financial assets (23,489) (1,721) 1265 (21,766) (2,127) 923 (24,357) 1,287 (1993) (17,611) (8,310) 112
Net amount transferred to profit or loss (available for sale financial assets) (1,721) - (100) (1,721) - (100) (1,721) - (100) (1,721) - (100)
Less: Income tax effect on losses on re-measuring available for sale financial assets 7,059 - 100 7,059 - 100 7,059 - 100 7,059 - 100
Net other comprehensive income to be reclassified to profit or loss (18,151) (1,721) (16,428) (2,127) (19,019) 1,287 (12,273) (8,310)
Other comprehensive income not to be reclassified to profit or loss:
Actuarial gains and losses on defined benefit plans (5,119) (8,551) (40) (5,119) (8,551) (40) (5,407) (8,162) (34) (5,277) (9,732) (46)
Less: Deferred tax effect on actuarial gains/(losses) on defined benefit plans 1,433 2,394 (40) 1,433 2,394 (40) 1,391 2,394 (42) 1,391 2,394 (42)
Net other comprehensive income not to be reclassified to profit or loss (3,685) (6,157) (40) (3,685) (6,157) (40) (4,016) (5,768) (30) (3,887) (7,338) (47)
Other comprehensive income for the period, net of taxes (21,836) (7,877) 177 (20,114) (8,283) 143 (23,035) (4,482) 414 (16,160) (15,648) 3
Total comprehensive income for the period 170,862 49,211 247 55,914 (6,919) 908 231,708 73,715 214 71,218 (53,665) 233
Attributable to:
Owners of the parent 170,862 49,211 247 55,914 (6,919) 908 200,147 25,075 698 60,133 (70,529) 185
Non-controlling interest - - - - 31,561 48,641 (35) 11,085 16,864 (34)
170,862 49,211 247 55,914 (6,919) 908 231,708 73,715 214 71,218 (53,665) 233
BANK GROUP
For the year ended For the quarter ended For the year ended For the quarter ended
-2-
Union Bank of Colombo PLC
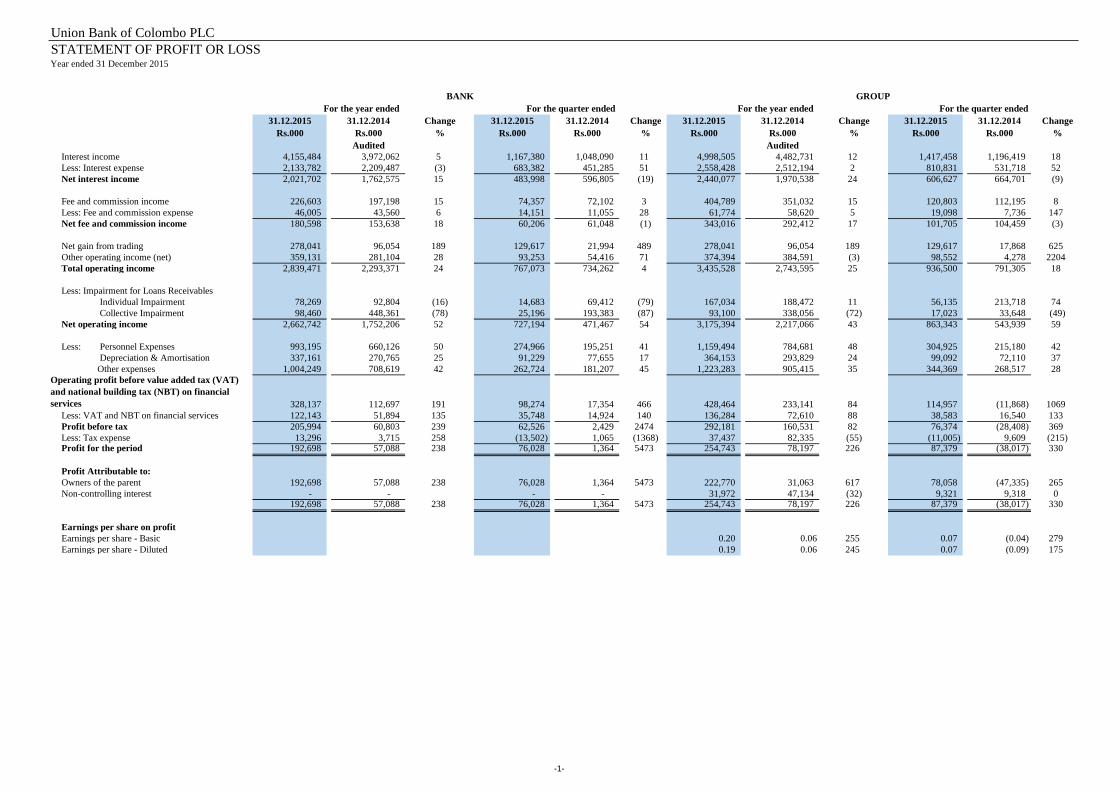
STATEMENT OF PROFIT OR LOSSYear ended 31 December 2015
31.12.2015 31.12.2014 Change 31.12.2015 31.12.2014 Change 31.12.2015 31.12.2014 Change 31.12.2015 31.12.2014 Change
Rs.000 Rs.000 % Rs.000 Rs.000 % Rs.000 Rs.000 % Rs.000 Rs.000 %
Audited Audited
Interest income 4,155,484 3,972,062 5 1,167,380 1,048,090 11 4,998,505 4,482,731 12 1,417,458 1,196,419 18
Less: Interest expense 2,133,782 2,209,487 (3) 683,382 451,285 51 2,558,428 2,512,194 2 810,831 531,718 52
Net interest income 2,021,702 1,762,575 15 483,998 596,805 (19) 2,440,077 1,970,538 24 606,627 664,701 (9)
Fee and commission income 226,603 197,198 15 74,357 72,102 3 404,789 351,032 15 120,803 112,195 8
Less: Fee and commission expense 46,005 43,560 6 14,151 11,055 28 61,774 58,620 5 19,098 7,736 147
Net fee and commission income 180,598 153,638 18 60,206 61,048 (1) 343,016 292,412 17 101,705 104,459 (3)
Net gain from trading 278,041 96,054 189 129,617 21,994 489 278,041 96,054 189 129,617 17,868 625
Other operating income (net) 359,131 281,104 28 93,253 54,416 71 374,394 384,591 (3) 98,552 4,278 2204
Total operating income 2,839,471 2,293,371 24 767,073 734,262 4 3,435,528 2,743,595 25 936,500 791,305 18
Less: Impairment for Loans Receivables
Individual Impairment 78,269 92,804 (16) 14,683 69,412 (79) 167,034 188,472 11 56,135 213,718 74
Collective Impairment 98,460 448,361 (78) 25,196 193,383 (87) 93,100 338,056 (72) 17,023 33,648 (49)
Net operating income 2,662,742 1,752,206 52 727,194 471,467 54 3,175,394 2,217,066 43 863,343 543,939 59
Less: Personnel Expenses 993,195 660,126 50 274,966 195,251 41 1,159,494 784,681 48 304,925 215,180 42
Depreciation & Amortisation 337,161 270,765 25 91,229 77,655 17 364,153 293,829 24 99,092 72,110 37
Other expenses 1,004,249 708,619 42 262,724 181,207 45 1,223,283 905,415 35 344,369 268,517 28
Operating profit before value added tax (VAT)
and national building tax (NBT) on financial
services 328,137 112,697 191 98,274 17,354 466 428,464 233,141 84 114,957 (11,868) 1069
Less: VAT and NBT on financial services 122,143 51,894 135 35,748 14,924 140 136,284 72,610 88 38,583 16,540 133
Profit before tax 205,994 60,803 239 62,526 2,429 2474 292,181 160,531 82 76,374 (28,408) 369
Less: Tax expense 13,296 3,715 258 (13,502) 1,065 (1368) 37,437 82,335 (55) (11,005) 9,609 (215)Profit for the period 192,698 57,088 238 76,028 1,364 5473 254,743 78,197 226 87,379 (38,017) 330
Profit Attributable to:
Owners of the parent 192,698 57,088 238 76,028 1,364 5473 222,770 31,063 617 78,058 (47,335) 265
Non-controlling interest - - - - 31,972 47,134 (32) 9,321 9,318 0192,698 57,088 238 76,028 1,364 5473 254,743 78,197 226 87,379 (38,017) 330
Earnings per share on profit
Earnings per share - Basic 0.20 0.06 255 0.07 (0.04) 279
Earnings per share - Diluted 0.19 0.06 245 0.07 (0.09) 175
BANK GROUP
For the year ended For the quarter ended For the year ended For the quarter ended
-1-

Union Bank of Colombo PLC
STATEMENT OF FINANCIAL POSITIONAs at 31 December 2015
1,000
Not
e
31.12.2015 31.12.2014 Change 31.12.2015 31.12.2014 Change
Rs.'000 Rs.'000 % Rs.'000 Rs.'000 %
Assets Audited Audited
Cash and cash equivalents 14 3,017,938 12,002,573 (75) 3,328,152 12,382,390 (73)
Balances with Central Bank 1,306,812 949,105 38 1,306,812 949,105 38
Placements with Banks 284,078 73,995 284 294,074 186,430 58
Derivative Financial Instruments 18 10,621 4,150 156 10,621 4,150 156
Other financial assets held for trading 8,463,808 2,584,471 227 8,463,807 2,584,471 227
Loans and receivables to banks - - 16,004 16,004 0
Loans and receivables to other customers 20 40,095,332 25,944,570 55 45,450,314 29,217,857 56
Other loans and receivables 5,721,549 2,470,115 132 4,951,274 1,649,134 200
Financial investments – Available for sale 21 8,356,130 1,647,686 407 8,538,559 1,800,750 374
Financial investments – Held to maturity 140,529 140,027 0 140,529 140,027 0
Investments in subsidiaries 22 892,364 892,364 0 - -
Property, plant and equipment 26 913,814 754,548 21 1,059,027 875,933 21
Investment in Real Estate - - 213,274 258,887 (18)
Goodwill and intangible assets 25 1,118,200 951,750 17 1,469,783 1,304,027 13
Income Tax Recoverable 208,404 149,448 39 224,555 149,448 50
Deferred tax assets 27 - - 485,102 515,838 (6)
Other assets 28 475,909 430,318 11 590,238 523,918 13
Total assets 71,005,489 48,995,121 45 76,542,126 52,558,370 46
Liabilities
Due to banks 29 6,945,249 2,090,588 232 7,156,388 2,145,832 234
Due to other customers 30 45,895,059 28,925,381 59 49,618,454 31,419,544 58
Other borrowed funds 32 - - 1,281,085 845,085 52
Current tax liabilities - - 173,498 181,442 (4)
Deferred tax liabilities 30,089 25,284 19 30,553 25,915 18
Other liabilities 33 1,212,915 1,203,584 1 1,567,079 1,443,521 9
Total liabilities 54,083,312 32,244,837 68 59,827,057 36,061,339 66
Equity
Stated capital 16,334,782 16,334,782 0 16,334,782 16,334,782 0
Share warrants 65,484 65,484 0 65,484 65,484 0
Statutory reserve fund 71,417 61,782 16 80,624 69,169 17
Retained earnings 467,692 288,314 62 (91,502) (298,854) (69)
ESOP reserve 1,030 - 1,030
Available for sale reserve (18,229) (78) (231) (4,576) 14,085 (132)
Total shareholders’ equity 16,922,176 16,750,284 1 16,385,842 16,184,665 1
Non-controlling interests - - 329,227 312,366 5
Total equity 16,922,176 16,750,284 1 16,715,069 16,497,032 1
Total equity and liabilities 71,005,488 48,995,121 45 76,542,126 52,558,370 46
Contingent liabilities and commitments 35,164,045 24,188,914 45 35,164,045 24,188,914 45
Net asset value per ordinary share 15.50 15.35 1 15.32 15.12 1
1 (0) 0 (0)
Memorandum information
Number of Employees 984 724
Number of Branches 64 61
BANK GROUP
-3-
Union Bank of Colombo PLC
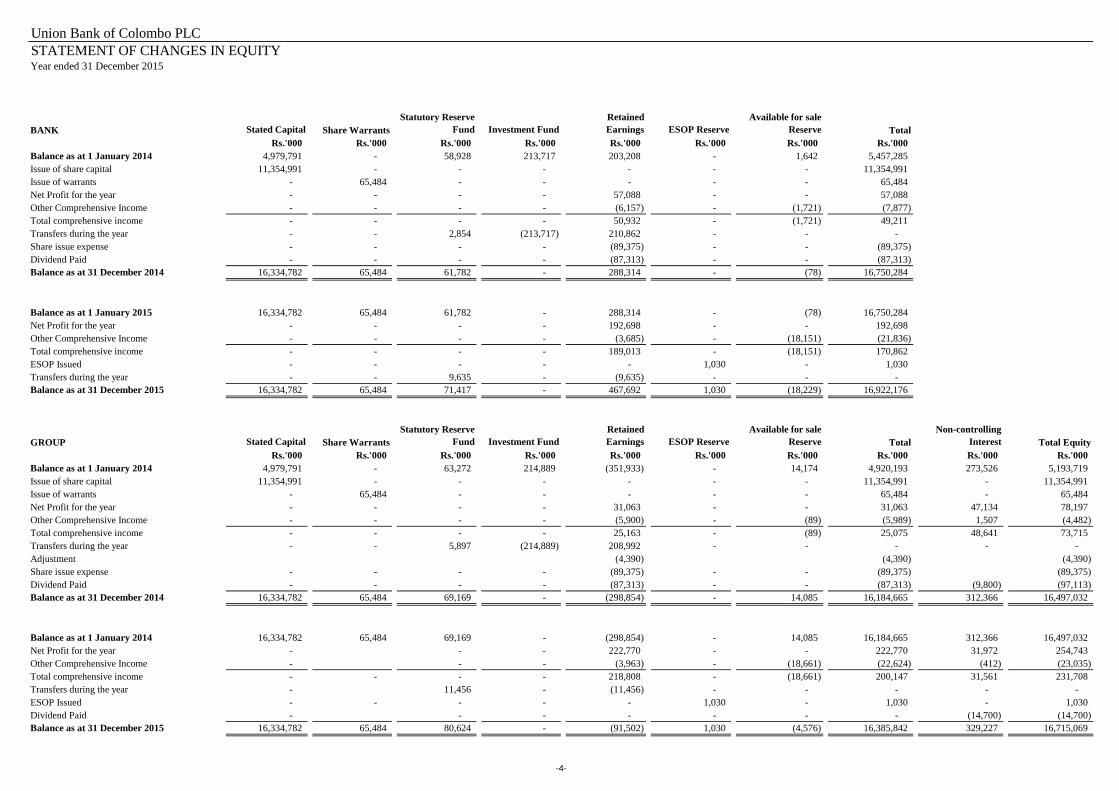
STATEMENT OF CHANGES IN EQUITYYear ended 31 December 2015
1,000
BANK Stated Capital Share Warrants
Statutory Reserve
Fund Investment Fund
Retained
Earnings ESOP Reserve
Available for sale
Reserve Total
Rs.'000 Rs.'000 Rs.'000 Rs.'000 Rs.'000 Rs.'000 Rs.'000 Rs.'000
Balance as at 1 January 2014 4,979,791 - 58,928 213,717 203,208 - 1,642 5,457,285
Issue of share capital 11,354,991 - - - - - - 11,354,991
Issue of warrants - 65,484 - - - - - 65,484
Net Profit for the year - - - - 57,088 - - 57,088
Other Comprehensive Income - - - - (6,157) - (1,721) (7,877)
Total comprehensive income - - - - 50,932 - (1,721) 49,211
Transfers during the year - - 2,854 (213,717) 210,862 - - -
Share issue expense - - - - (89,375) - - (89,375)
Dividend Paid - - - - (87,313) - - (87,313)
Balance as at 31 December 2014 16,334,782 65,484 61,782 - 288,314 - (78) 16,750,284
Balance as at 1 January 2015 16,334,782 65,484 61,782 - 288,314 - (78) 16,750,284
Net Profit for the year - - - - 192,698 - - 192,698
Other Comprehensive Income - - - - (3,685) - (18,151) (21,836)
Total comprehensive income - - - - 189,013 - (18,151) 170,862
ESOP Issued - - - - - 1,030 - 1,030
Transfers during the year - - 9,635 - (9,635) - - -
Balance as at 31 December 2015 16,334,782 65,484 71,417 - 467,692 1,030 (18,229) 16,922,176
GROUP Stated Capital Share Warrants
Statutory Reserve
Fund Investment Fund
Retained
Earnings ESOP Reserve
Available for sale
Reserve Total
Non-controlling
Interest Total Equity
Rs.'000 Rs.'000 Rs.'000 Rs.'000 Rs.'000 Rs.'000 Rs.'000 Rs.'000 Rs.'000 Rs.'000
Balance as at 1 January 2014 4,979,791 - 63,272 214,889 (351,933) - 14,174 4,920,193 273,526 5,193,719
Issue of share capital 11,354,991 - - - - - - 11,354,991 - 11,354,991
Issue of warrants - 65,484 - - - - - 65,484 - 65,484
Net Profit for the year - - - - 31,063 - - 31,063 47,134 78,197
Other Comprehensive Income - - - - (5,900) - (89) (5,989) 1,507 (4,482)
Total comprehensive income - - - - 25,163 - (89) 25,075 48,641 73,715
Transfers during the year - - 5,897 (214,889) 208,992 - - - - -
Adjustment (4,390) (4,390) (4,390)
Share issue expense - - - - (89,375) - - (89,375) (89,375)
Dividend Paid - - - - (87,313) - - (87,313) (9,800) (97,113)
Balance as at 31 December 2014 16,334,782 65,484 69,169 - (298,854) - 14,085 16,184,665 312,366 16,497,032
Balance as at 1 January 2014 16,334,782 65,484 69,169 - (298,854) - 14,085 16,184,665 312,366 16,497,032
Net Profit for the year - - - 222,770 - - 222,770 31,972 254,743
Other Comprehensive Income - - - (3,963) - (18,661) (22,624) (412) (23,035)
Total comprehensive income - - - - 218,808 - (18,661) 200,147 31,561 231,708
Transfers during the year - 11,456 - (11,456) - - - - -
ESOP Issued - - - - - 1,030 - 1,030 - 1,030
Dividend Paid - - - - - - - (14,700) (14,700)
Balance as at 31 December 2015 16,334,782 65,484 80,624 - (91,502) 1,030 (4,576) 16,385,842 329,227 16,715,069
-4-

Union Bank of Colombo PLC
STATEMENT OF CASH FLOWSYear ended 31 December 2015
2015 2014 2015 2014
Rs.'000 Rs.'000 Rs.'000 Rs.'000
Audited Audited
Cash Flow from Operating Activities
Interest received 3,751,511 4,044,153 4,485,752 4,492,976
Fees and commission receipts 180,598 125,161 343,016 263,934
Interest paid (2,032,622) (2,465,361) (2,502,991) (2,930,842)
Receipts from other operating activities 362,011 412,761 388,959 526,441
Payments on other operating activities (2,101,289) (1,407,194) (2,496,906) (1,746,682)
Operating Profit/(Loss) before changes in
operating assets & liabilities 160,209 709,519 217,830 605,826
(Increase)/Decrease in Operating Assets:
Balance with Central Bank of Sri Lanka (357,707) 168,766 (357,707) 168,766
Funds Advanced to Customers (14,240,742) (3,241,507) (16,347,632) (4,725,727)
Others (52,062) 9,282 (27,179) 94,273
(14,650,511) (3,063,459) (16,732,518) (4,462,689)
Increase /(Decrease) in Operating Liabilities:
Due to other customers 9,800,141 (274,306) 11,320,894 1,070,177
Repurchased agreements 7,109,814 986,591 6,882,591 968,091
Other liabilities (140,902) 141,950 (29,424) 434,762
16,769,053 854,234 18,174,061 2,473,031
Net Cash from/(used in) Operating Activities
before Income Tax 2,278,752 (1,499,705) 1,659,373 (1,383,832)
Retiring Gratuity paid (7,039) (7,587) (8,436) (8,591)
Income Tax Paid (10,812) (9,521) (28,520) (65,032)
Net Cash from/(used in) Operating Activities 2,260,900 (1,516,813) 1,622,417 (1,457,455)
Cash Flow from/(used in) Investing Activities
Dividends received 14,126 11,146 648 1,163
Net investment in other financial assets - held for trading (5,608,120) (1,613,967) (5,608,120) (1,618,540)
Net increase in investment in financial assets - held to maturity (6,889) (515) (6,889) (515)
Net increase in investment in financial assets - available for sale (6,647,352) 89,043 (6,677,585) 30,132
Net increase in debt securities (3,069,167) - (3,068,934) -
Purchase of property & equipment (390,646) (209,058) (443,575) (229,589)
Purchase of intangible assets (141,869) (537,088) (143,213) (537,604)
Proceeds from sale of property & equipment 1,416 161 6,988 161
Net Cash used in Investing Activities (15,848,501) (2,260,279) (15,940,679) (2,354,792)
Cash Flow from/(used in) Financing Activities
Proceeds from shares issued - 11,420,475 - 11,420,475
Increase in borrowings 4,899,216 1,833,300 5,527,710 2,204,111
Share issue cost - (89,375) - (89,375)
Dividend Paid - (87,313) (14,700) (97,113)
Net Cash from Financing Activities 4,899,216 13,077,088 5,513,010 13,438,099
Net Increase/(Decrease) in Cash and Cash Equivalents (8,688,385) 9,299,995 (8,805,252) 9,625,852
Cash and Cash Equivalents at Beginning of the year 11,932,107 2,632,112 12,369,116 2,743,264
Cash and Cash Equivalents at end of the year 3,243,722 11,932,107 3,563,864 12,369,116
Reconciliation of Cash and Cash Equivalents
Cash & Cash Equivalents 3,015,411 11,999,865 3,325,625 12,379,683
Placements with Banks 284,074 73,995 294,070 186,430
Due to Banks (55,763) (141,753) (55,831) (196,998)
3,243,722 11,932,107 3,563,864 12,369,116
BANK GROUP
-5-
Union Bank of Colombo PLC
NOTES TO THE FINANCIAL STATEMENTSAs at 31 December 2015
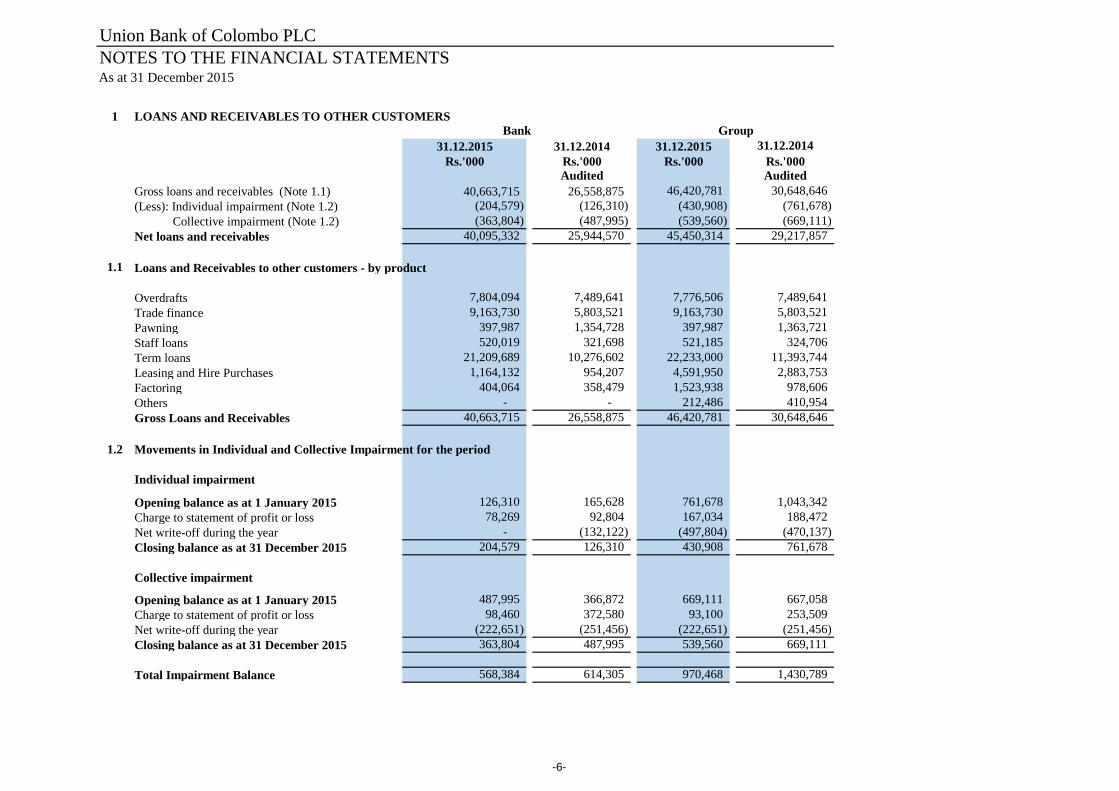
1 LOANS AND RECEIVABLES TO OTHER CUSTOMERS
31.12.2015 31.12.2014 31.12.2015 31.12.2014
Rs.'000 Rs.'000 Rs.'000 Rs.'000
Audited Audited
Gross loans and receivables (Note 1.1) 40,663,715 26,558,875 46,420,781 30,648,646
(Less): Individual impairment (Note 1.2) (204,579) (126,310) (430,908) (761,678)
Collective impairment (Note 1.2) (363,804) (487,995) (539,560) (669,111)
Net loans and receivables 40,095,332 25,944,570 45,450,314 29,217,857
1.1 Loans and Receivables to other customers - by product
Overdrafts 7,804,094 7,489,641 7,776,506 7,489,641
Trade finance 9,163,730 5,803,521 9,163,730 5,803,521
Pawning 397,987 1,354,728 397,987 1,363,721
Staff loans 520,019 321,698 521,185 324,706
Term loans 21,209,689 10,276,602 22,233,000 11,393,744
Leasing and Hire Purchases 1,164,132 954,207 4,591,950 2,883,753
Factoring 404,064 358,479 1,523,938 978,606
Others - - 212,486 410,954
Gross Loans and Receivables 40,663,715 26,558,875 46,420,781 30,648,646
1.2 Movements in Individual and Collective Impairment for the period
Individual impairment
Opening balance as at 1 January 2015 126,310 165,628 761,678 1,043,342
Charge to statement of profit or loss 78,269 92,804 167,034 188,472
Net write-off during the year - (132,122) (497,804) (470,137)
Closing balance as at 31 December 2015 204,579 126,310 430,908 761,678
Collective impairment
Opening balance as at 1 January 2015 487,995 366,872 669,111 667,058
Charge to statement of profit or loss 98,460 372,580 93,100 253,509
Net write-off during the year (222,651) (251,456) (222,651) (251,456)
Closing balance as at 31 December 2015 363,804 487,995 539,560 669,111
Total Impairment Balance 568,384 614,305 970,468 1,430,789
Bank Group
-6-
Union Bank of Colombo PLC
NOTES TO THE FINANCIAL STATEMENTSAs at 31 December 2015
31.12.2015 31.12.2014 31.12.2015 31.12.2014
Rs.'000 Rs.'000 Rs.'000 Rs.'000
Audited Audited
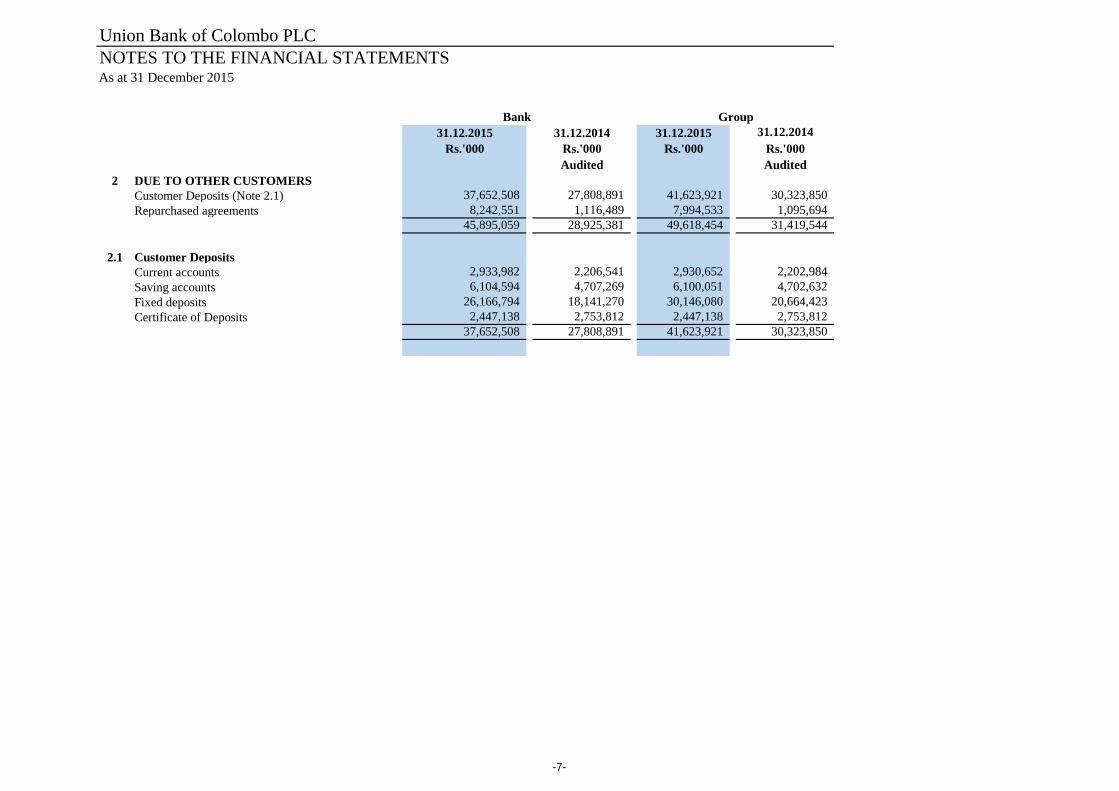
2 DUE TO OTHER CUSTOMERS
Customer Deposits (Note 2.1) 37,652,508 27,808,891 41,623,921 30,323,850
Repurchased agreements 8,242,551 1,116,489 7,994,533 1,095,694
45,895,059 28,925,381 49,618,454 31,419,544
2.1 Customer Deposits
Current accounts 2,933,982 2,206,541 2,930,652 2,202,984
Saving accounts 6,104,594 4,707,269 6,100,051 4,702,632
Fixed deposits 26,166,794 18,141,270 30,146,080 20,664,423
Certificate of Deposits 2,447,138 2,753,812 2,447,138 2,753,812
37,652,508 27,808,891 41,623,921 30,323,850
Bank Group
-7-

Union Bank of Colombo PLC
EXPLANATORY NOTESYear ended 31 December 2015
1
2
3
3.1
4 Information on Ordinary Shares
Market Value 31.12.2015 31.12.2014
Rs. Rs.
Market value 20.20 25.30
Highest price for the quarter 22.60 27.20
Lowest price for the quarter 20.00 22.50
The Board of Directors of the Bank has recommended a final dividend of Rs.0.04 per share for the financial year ended 31 December 2015. This
dividend is to be approved by the shareholders at the Annual General Meeting to be held on 31 March 2016.
The information contained in these statements have been extracted from the unaudited financial statements of the Bank and the Group unless indicated as
audited.
Interim financial statements are presented in accordance with LKAS 34 - Interim Financial Reporting applicable after 1 January 2012 and there are no
changes to the accounting policies and methods of computation as against those disclosed in the Annual Report for the year ended 31 December 2014.
The Group financial statements comprise of consolidated financial statements of the Bank and its subsidiary National Asset Management Limited & UB
Finance Company Limited and the Special Purpose Entity, Serandib Capital (Private) Limited.
No material events have been taken place subsequent to the reporting period that require disclosures or/ and adjustment in the Financial Statements other
than stated below;
-8-

Union Bank of Colombo PLC
NOTES TO THE FINANCIAL STATEMENTS
Year ended 31 December
SEGMENTAL ANALYSIS - GROUP
For the year ended 31 December
2015 2014 2015 2014 2015 2014 2015 2014 2015 2014 2015 2014
Interest Income 1,179,162 891,321 896,567 616,741 1,645,495 2,360,579 307,024 - 970,257 614,091 4,998,505 4,482,731
Inter-Segment Interest Income - - - - - 522,836 2,235,034 - - - 2,235,034 522,836
Total Interest Income 1,179,162 891,321 896,567 616,741 1,645,495 2,883,415 2,542,058 - 970,257 614,091 7,233,539 5,005,568
Total Interest Expense 150,578 295,837 387,150 83,056 8,522 1,814,785 1,602,103 - 410,075 318,516 2,558,428 2,512,194
Inter-Segment Interest Expense 764,972 458,662 249,452 64,175 1,220,610 - - - - 2,235,034 522,836
Net Interest Income 263,612 136,822 259,965 469,511 416,363 1,068,630 939,955 - 560,182 295,575 2,440,078 1,970,538
Total Other Income 97,294 80,272 426,366 194,001 265,575 261,801 8,822 - 197,392 236,984 995,450 773,057
Total Net Income 360,907 217,094 686,332 663,512 681,939 1,330,431 948,777 - 757,574 532,558 3,435,528 2,743,595
Less :
Impairment 44,297 35,662 - - 120,154 505,503 12,278 - 83,405 (14,637) 260,134 526,528
Depreciation & Amortisation 27,576 24,957 27,576 24,957 113,724 220,851 168,284 26,992 23,065 364,153 293,829
Other Expenses 316,795 253,031 365,694 265,157 491,966 850,556 803,543 - 404,779 321,352 2,382,777 1,690,096
Segmental Results (27,762) (96,556) 293,062 373,397 (43,906) (246,479) (35,329) - 242,398 202,779 428,464 233,142
Less: VAT and NBT on Financial Services 136,284 72,610
Less: Taxation 37,437 82,335
Profit After Taxation 254,743 78,197
Cash flow from operating activities 656,523 (304,975) 541,627 (271,459) 895,706 (727,430) 167,045 - (638,483) (153,591) 1,622,418 (1,457,455)
Cash flow from investing activities (154,221) (491,820) (15,317,402) (437,771) (210,407) (1,173,095) (39,240) - (219,410) (252,105) (15,940,679) (2,354,792)
Cash flow from financing activities - 422,191 4,899,216 11,796,269 - 1,007,015 - - 613,794 212,624 5,513,010 13,438,099
As at 31 December 2015
Other Information
Segment Assets 20,860,915 9,102,578 22,935,433 17,394,928 18,498,170 19,411,525 4,362,801 - 7,885,846 4,761,780 74,543,164 50,670,811
Unallocated Assets 1,998,962 1,887,560
Consolidated Total Assets 76,542,126 52,558,370
Segment Liabilities 4,686,267 2,657,070 15,216,824 2,947,364 247,523 25,671,181 33,470,802 - 5,527,064 4,035,256 59,148,481 35,310,872
Unallocated Liabilities 678,577 750,466
Consolidated Total Liabilities 59,827,057 36,061,339
TotalCorporate Treasury SME Retail Other Group Companies
-9-

Union Bank of Colombo PLC
INFORMATION ON ORDINARY SHARES OF THE BANKAs at 31 December 2015
TOP 20 SHAREHOLDERS
Name No. of shares % holding
as at 31.12.2015
1 Culture Financial Holdings Ltd 763,984,374 70.0%
2 Vista Knowledge Pte Ltd 64,677,973 5.9%
3 Associated Electrical Corporation Ltd 29,237,387 2.7%
4 Mr. A.I. Lovell 22,743,780 2.1%
5 Mr. C.P.A Wijeyesekera 18,508,468 1.7%
6 Mr. D.A.J Warnakulasuriya 14,842,730 1.4%
7 EXSAB International Holding Co. for Trading Development 8,902,139 0.8%
8 Ashyaki Holdings (Pvt) Ltd. 7,792,506 0.7%
9 Mr. M.D. Samarawickrama 7,660,582 0.7%
10 Mr. S.P. Khattar 7,343,365 0.7%
11 Sterling Holdings (Private) Ltd 7,207,557 0.7%
12 Dr. T. Senthilverl 6,365,767 0.6%
13 Asian Alliance Insurance PLC - A/C 02 (Life Fund) 6,067,256 0.6%
14 Rosewood (Pvt) Ltd - Account No. 1 5,500,698 0.5%
15 Commercial Agencies (Ceylon) Ltd. 4,050,833 0.4%
16 Ajita De Zoysa & Company Limited. 4,050,832 0.4%
17 Anverally and Sons (Pvt) Ltd A/C No 01 2,932,600 0.3%
18 Standard Chartered Bank Singapore S/A HL Bank Singapore Branch 2,875,149 0.3%
19 Rubber Investment Trust Limited A/C No 01 2,078,975 0.2%
20 Ceylon Biscuits Limited 2,000,000 0.2%
988,822,971 90.6%
Other shareholders 102,583,278 9.4%
Total 1,091,406,249 100.0%
As at 31 December 2015
Number of shares in public holding 239,161,850
Number of public shareholders 33,532
Percentage of public holding 21.9%
DIRECTORS' HOLDING IN SHARES
No. of shares held
as at 31.12.2015
Dr. P. Jayendra Nayak None
Mr. Alexis Indrajit Lovell 22,743,780
Mr. Bodahandi Asoka Keerthi de Silva 8,900
Ms. Sow Lin Chiew None
Ms. Yoke Sun Woon (Alternate Director to Ms. Sow Lin Chiew) None
Mr. Priyantha Fernando None
Mr. Sabry Ghouse None
Mr. Imtiaz Muhseen None
Mr. Ranvir Dewan None
Mr. Gaurav Trehan None
Mr. Puneet Bhatia None
Mr. Michael J. O' Hanlon None
Ms. Ayomi Aluwihare None
Mr. Sumedh Jog (Alternate Director to Mr. Michael J. O' Hanlon) None
Mr. Indrajit Wickramasinghe None
Name
-10-

Union Bank of Colombo PLC
NOTES TO THE FINANCIAL STATEMENTSAs at 31 December 2015
MEASUREMENT OF FINANCIAL INSTRUMENTS
1,000
a. Bank - 31 December 2015
HFT HTM L & R AFS Others Total
Rs. Rs. Rs. Rs. Rs. Rs.
ASSETS
Cash and cash equivalents - - 3,017,938 - - 3,017,938
Balances with Central Bank - - 1,306,812 - - 1,306,812
Placements with banks - - 284,078 - - 284,078
Derivative financial instruments 10,621 - - - - 10,621
Other financial assets - Held for trading 8,463,808 - - - - 8,463,808
Loans and receivables to other customers - - 40,095,332 - - 40,095,332
Other loans and receivables - - 5,721,549 - - 5,721,549
Financial investments - Available for sale - - - 8,356,130 - 8,356,130
Financial investments - Held to maturity - 140,529 - - - 140,529
Other assets - - 49,039 - - 49,039
Total financial assets 8,474,429 140,529 50,474,748 8,356,130 - 67,445,836
HFT Amortised cost Others Total
LIABILITIES Rs. Rs. Rs. Rs.
Due to banks - 6,945,249 - 6,945,249
Due to other customers - 45,895,059 - 45,895,059
Other liabilities - 954,193 - 954,193
Total financial liabilities - 53,794,501 - 53,794,501
b. Bank - 31 December 2014 (Audited)
HFT HTM L & R AFS Others Total
Rs. Rs. Rs. Rs. Rs. Rs.
ASSETS
Cash and cash equivalents 682,354 - 11,320,219 - - 12,002,573
Balances with Central Bank - - 949,105 - - 949,105
Placements with banks - - 73,995 - - 73,995
Derivative financial instruments 4,150 - - - - 4,150
Other financial assets - Held for trading 2,584,471 - - - - 2,584,471
Loans and receivables to other customers - - 25,944,570 - - 25,944,570
Other loans and receivables - - 2,470,115 - - 2,470,115
Financial investments - Available for sale - - - 1,647,686 - 1,647,686
Financial investments - Held to maturity - 140,027 - - - 140,027
Other assets - - 16,462 - - 16,462
Total financial assets 3,270,975 140,027 40,774,466 1,647,686 - 45,833,155
HFT Amortised cost Others Total
LIABILITIES Rs. Rs. Rs. Rs.
Due to banks - 2,090,588 - 2,090,588
Due to other customers - 28,925,381 - 28,925,381
Other liabilities - 855,678 - 855,678
Total financial liabilities - 31,871,646 - 31,871,646
-11-
Union Bank of Colombo PLC
NOTES TO THE FINANCIAL STATEMENTSAs at 31 December 2015
MEASUREMENT OF FINANCIAL INSTRUMENTS
1,000
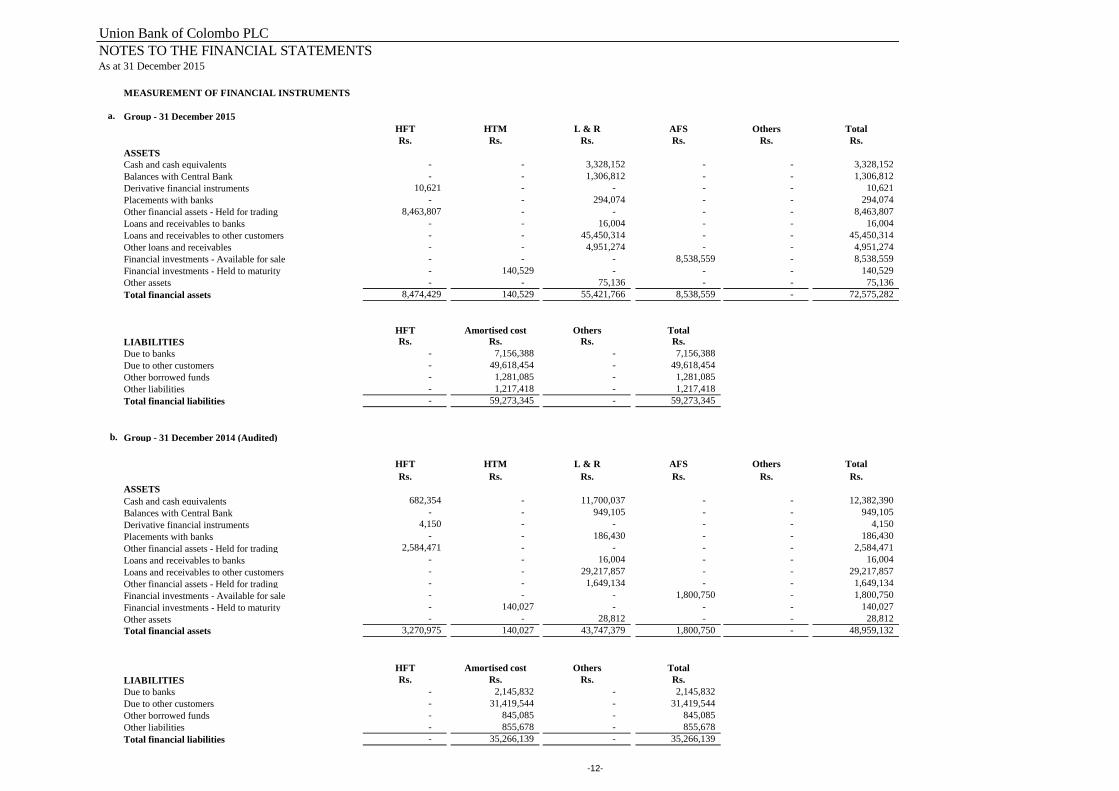
a. Group - 31 December 2015
HFT HTM L & R AFS Others Total
Rs. Rs. Rs. Rs. Rs. Rs.
ASSETS
Cash and cash equivalents - - 3,328,152 - - 3,328,152
Balances with Central Bank - - 1,306,812 - - 1,306,812
Derivative financial instruments 10,621 - - - - 10,621
Placements with banks - - 294,074 - - 294,074
Other financial assets - Held for trading 8,463,807 - - - - 8,463,807
Loans and receivables to banks - - 16,004 - - 16,004
Loans and receivables to other customers - - 45,450,314 - - 45,450,314
Other loans and receivables - - 4,951,274 - - 4,951,274
Financial investments - Available for sale - - - 8,538,559 - 8,538,559
Financial investments - Held to maturity - 140,529 - - - 140,529
Other assets - - 75,136 - - 75,136
Total financial assets 8,474,429 140,529 55,421,766 8,538,559 - 72,575,282
HFT Amortised cost Others Total
LIABILITIES Rs. Rs. Rs. Rs.
Due to banks - 7,156,388 - 7,156,388
Due to other customers - 49,618,454 - 49,618,454
Other borrowed funds - 1,281,085 - 1,281,085
Other liabilities - 1,217,418 - 1,217,418
Total financial liabilities - 59,273,345 - 59,273,345
b. Group - 31 December 2014 (Audited)
HFT HTM L & R AFS Others Total
Rs. Rs. Rs. Rs. Rs. Rs.
ASSETS
Cash and cash equivalents 682,354 - 11,700,037 - - 12,382,390
Balances with Central Bank - - 949,105 - - 949,105
Derivative financial instruments 4,150 - - - - 4,150
Placements with banks - - 186,430 - - 186,430
Other financial assets - Held for trading 2,584,471 - - - - 2,584,471
Loans and receivables to banks - - 16,004 - - 16,004
Loans and receivables to other customers - - 29,217,857 - - 29,217,857
Other financial assets - Held for trading - - 1,649,134 - - 1,649,134
Financial investments - Available for sale - - - 1,800,750 - 1,800,750
Financial investments - Held to maturity - 140,027 - - - 140,027
Other assets - - 28,812 - - 28,812
Total financial assets 3,270,975 140,027 43,747,379 1,800,750 - 48,959,132
HFT Amortised cost Others Total
LIABILITIES Rs. Rs. Rs. Rs.
Due to banks - 2,145,832 - 2,145,832
Due to other customers - 31,419,544 - 31,419,544
Other borrowed funds - 845,085 - 845,085
Other liabilities - 855,678 - 855,678
Total financial liabilities - 35,266,139 - 35,266,139
-12-

Union Bank of Colombo PLC
SELECTED PERFORMANCE INDICATORS
31-Dec-15 31-Dec-14
Regulatory Capital Adequacy
Core Capital (Tier 1 Capital), Rs. ‘000 15,458,060 15,485,556
Total Capital Base, Rs. ‘000 15,177,627 15,199,541
Core Capital Adequacy Ratio, as % of Risk Weighted Assets
(Minimum Requirement, 5%) 24.41% 41.70%
Total Capital Adequacy Ratio, as % of Risk Weighted Assets
(Minimum Requirement, 10%) 23.96% 40.93%
Assets Quality (Quality of Loan Portfolio)
Gross Non-Performing Advances Ratio, %
(net of interest in suspense) 3.55% 8.25%
Net-Non Performing Advances,%
(net of interest in suspense and provision) 2.69% 7.44%
Profitability
Interest Margin, % 3.37% 4.20%
Return on Assets (before tax), % 0.34% 0.14%
Return on Equity, % 1.14% 0.70%
Regulatory Liquidity
Statutory Liquid Assets, Rs. ‘000
Domestic Banking Unit 8,966,288 15,298,157
Foreign Currency Banking Unit 621,730 364,972
Statutory Liquid Assets Ratio, % (Minimum Requirement, 20%)
Domestic Banking Unit 21.87% 51.12%
Foreign Currency Banking Unit 22.70% 22.51%
CERTIFICATION:
Sgd.
Malinda Samaratunga
Chief Financial Officer
Sgd. Sgd.
Indrajit Wickramasinghe P. Jayendra Nayak
Chief Executive Officer Chairman
Date: 24 February 2016
(b) the information contained in these statements have been extracted from the unaudited financial
statements of the Bank and the Group unless indicated as audited.
As at 31 December 2015
Item
Bank
We, the undersigned, being the Chairman, Chief Executive officer and Chief Financial Officer of Union
Bank of Colombo PLC certify jointly that:
(a) the above statements have been prepared in compliance with the format and definitions prescribed by
the Central Bank of Sri Lanka.
-13-