d.c. water resources research institute annual technical ... · d.c. water resources research...
TRANSCRIPT

D.C. Water Resources Research InstituteAnnual Technical Report
FY 2013
D.C. Water Resources Research Institute Annual Technical Report FY 2013 1

Introduction
This report is a summary of the activities of the District of Columbia (DC) Water Resources ResearchInstitute (WRRI) for the period - March 1, 2013 through February 28, 2014. Hosted under the College ofAgriculture, Urban Sustainability and Environmental Sciences (CAUSES) of the University of the District ofColumbia, the Institute continued to coordinate water related research, training and outreach activities in theDistrict of Columbia. According to the Sustainable DC plan, 100% of waterways should be fishable andswimmable by 2032. The mission of the Institute is to help the District meet this ambitious goal by providinginterdisciplinary research and training support.
For the last 10 years, the Institute has provided seed grants for 74 research projects and trained more than 200graduate and undergraduate students. The seed grant created the opportunity to train students and new facultyin water science and technology research projects, and leverage extramural funding. Through the Institute, theUniversity of the District of Columbia received $2 million in financial support to build state-of-the-artresearch and training laboratories for environmental and water quality testing, as well as modeling andsimulation.
In FY13, the Institute funded and implemented research activities and training that addressed all water issues,to include identifying city water resources and environmental problems, and contributing to their solutions.Nearly 50 graduate and undergraduate students were trained on the high-end analytical technologies fromvarious majors such as water resources, environmental science, civil engineering, computer science and foodscience. The Institute's new Environmental Quality Testing Lab is equipped with the latest model of InductiveCouple Plasma Mass Spectrophotometer, Gas Chromatograph Mass Spectrophotometer, and Time of FlightMass Spectrophotometer with Direct Sample Analyzer. The modeling and simulation lab has keyEnvironmental Protection Agency (EPA) approved models that applies for the Total Maximum Daily Loadassessment as well as Geographical Information System. The Institute continues developing and maintainingnew environmental quality testing and modeling tools to advance water research and training at UDC.
In addition, the Institute has been working closely with other organization in the region and landgrant centersin CAUSES to conduct outreach and information transfer activities. In collaboration with the American WaterResources Association in the National Capitol Region (AWRA-NCR), the Institute organized the 2nd AnnualWater Symposium on April 4, 2014, at the University of DC. This symposium, designed based upon theprevious year's success, sought to bring together experts from government agencies, academia, the privatesector and non-profits to discuss challenges and opportunities for sustainable management of water resourcesand infrastructure in the region. In addition, in close collaboration with other landgrant centers in CAUSES,such as the Center for Sustainable Development, the Center for Urban Agriculture, and the Center for 4-H andYouth Development, the Institute conducts outreach activities by distributing newsletters, media releases andfactsheets, and training and attracting youth to prepare them to the water sciences and technologies.
Introduction 1

Research Program Introduction
In FY 2013, the Instituted funded four research projects that address the three components of integrated urbanwater system: storm water runoff and sewer system, the wastewater treatment plant and receiving waters. TheInstitute is also working towards establishing certified environmental that can support all water projects in DCarea and beyond. Dr. Arash Massoudieh's project introduces the Bayesian parameter estimation technique thatcan be applied to the optimization of activated sludge operations at the Blue Plains Wastewater TreatmentPlant, one of the largest wastewater treatment plants in the world. Optimization of this large plant is crucialfor energy efficiency and treatment to reduce the impact of effluent quality on the Chesapeake Bay watershed.
Dr. Charles Glass's work focuses on the evaluation of the effectiveness of different green infrastructuredevices in removing stormwater runoff contaminants. The three devices in this study are identified as:bioswale, swale-bioretention and bioretention. The effectiveness of the green devices was analyzed based onthe laboratory analysis of both the influent and the effluent quality for 10 storm events. The findings of thiswork are crucial for selecting green devices that can significantly improve stormwater runoff quality andthereby improve DC waterways.
Dr. Caroline Solomon's project focuses on studying the effect of organic nitrogen (urea) from combined seweroverflow on the productivity and physiology of harmful algae in the Anacostia River. In this project, watersamples were collected at 10 sites and analyzed for nutrient concentrations, bacteria and phytoplanktoncomposition, nitrogen uptake and assimilation enzyme rates. The finding of this project provides betterunderstanding of the impact of combine sewer overflows and organic N in the Anacostia River.
Finally, the primary goal of Dr. Kobina Atobra's research project was to assess the existing data of the groundwater quality in DC and plan for regular monitoring. The objective of this research is to establish the protocoland guidance for a continuing long term, consistent monitoring of in organic chemicals, nutrients and otherconstituents found in the groundwater of the District of Columbia, as well as improving the tracking andmodeling of chemical and physical changes that will be essential during the next decade to distinguish trendsin groundwater quality and quantity.
Research Program Introduction
Research Program Introduction 1

Monitoring Groundwater for Developing Alternative Sourceof Water Supply for Homeland Security in the District ofColumbia
Basic Information
Title: Monitoring Groundwater for Developing Alternative Source of Water Supply forHomeland Security in the District of Columbia
Project Number: 2013DC148BStart Date: 3/1/2013End Date: 2/28/2014
Funding Source: 104BCongressional
District: DC
Research Category: Ground-water Flow and TransportFocus Category: Groundwater, Hydrology, Water Quantity
Descriptors: NonePrincipal
Investigators: Kobina Atobrah, Tolessa Deksissa
Publications
There are no publications.
Monitoring Groundwater for Developing Alternative Source of Water Supply for Homeland Security in the District of Columbia
Monitoring Groundwater for Developing Alternative Source of Water Supply for Homeland Security in the District of Columbia1
Monitoring Groundwater for Developing Alternative
Source of Water Supply in the District of Columbia:
Progress Report
By
Tolessa Deksissa and Kobina Atobrah
Water Resources Research Institute
University of the District of Columbia
May, 2014

Abstract
The purpose of this project is to assess the available data pertaining to groundwater quantity and
quality in the District of Columbia as planning phase to establish a long term monitoring stations.
Groundwater in urban settings is not only the last reserve for water supply, but it is also the
ultimate sink for persistent urban pollutants. During dry season, surface water supply depends
mainly on ground water discharge through baseflow to streams. Furthermore, when surface water
is contaminated either by natural or manmade processes, ground water can be an alternative
source for water supply. District of Columbia, like most urban areas, is on the fast track of
industrial development with increased activities of construction, remodeling or tunneling that are
likely to significantly impact the quality and quantity of its groundwater. To explore if ground
water can augment the water supply in DC, regular monitoring of ground water is critical. The
objective of this project was to establish the protocol and guidance for a continuing long term
monitoring of ground water quantity and quality in the District of Columbia, and to improve the
tracking of changes in ground water quantity and quality that will be essential for sustainable
water resources management of the district. This preliminary study showed that exploring or
gathering of more ground water quantity and quality data is crucial to determine the current
status as well as predict the future trend of DC ground water quality.
1. Introduction
Ground water was the first as well as is the last reserve to meet the future demand for water
supply in the global urban expansion. When surface water supply is limited, cities must import or
purchase water from other cities or exploit their ground water reserves (Chowdhury et al. 2013;
Ku et al, 1992). During dry season, surface water supply mainly depends on ground water.
Approximately 75% of community water systems in U.S. rely on ground water (U.S.
Environmental Protection Agency, 2002).
Nevertheless, the potential of ground water as an alternative source for water supply in an urban
setting is not explored in the Nation’s capital. Ground water provides a critical source of water
for agricultural irrigation and industries (Garduno and Foster, 2010). When natural disasters such
as hurricanes or manmade processes impair the existing surface water supply, uncontaminated

ground water can be an alternative source. Furthermore, the growth of urban farming to address
global warming and food insecurity may potentially increase water demand in urban areas. In
that case surface water supply can be augmented by groundwater (Ortega-Reig et al., 2014).
The District of Columbia, like any other growing cities, is on the fast track of industrial
development with increased activities of construction, remodeling or tunneling that are likely to
significantly impact the quality and quantity of the underlying groundwater in various ways.
Increased surface imperviousness can potentially lower ground water levels as a result of
reduced infiltration of precipitation. Contaminated urban runoff and combined sewer overflows
in pervious area can contaminate the ground water. Contaminated soil or land can potentially
impact the ground water quality (Ayotte et al., 2014).
The scope of this study was three folds. First to explore how thirteen monitoring wells installed
20 years a go by UDC can be applied for continuous monitoring and trend analysis of ground
water quality and quantity in DC. Second, to compile available data related to ground water
contamination in DC. Third, to explore the potential use of urban ground water as an alternative
source for water supply in DC.
2. Available Monitoring Wells
Based on previous studies, there is a significant number of monitoring wells in DC that can
potentially be used for ground water quantity and quality studies. In 1989, D.C. Department of
Consumer and Regulatory Affairs tasked the University of the District of Columbia's Water
Resources Research Center with assessing the ground water resources of the District of
Columbia (DC WRRC, 1993). Based upon their request, and to complement the already
available ground water information, thirteen wells (Table 1) were installed as part of the Ground
Water Resource Assessment Study. These wells were installed to assess the ambient ground
water quality and quantity within the city's main geological formations and to provide
information on impacts of non-point source pollution on the groundwater.
As presented in DC WRRC (1993), the locations of the thirteen wells are presented in Table 1
and Figure 1. Five wells (MW-1, 2, 3, 4, 5) were installed for monitoring the hydrologic

characteristics, whereas eight other wells were installed to assess the impact of nonpoint source
pollution in shallow ground water in community gardens (MW-A1,2,3 and MW-B1,2,3) and a
golf course (MW-C1,2). The physical and hydraulic characteristics of these thirteen wells vary
widely among the four aquifer types and within each aquifer. Highest transmissivities were
found for the Potomac Group Aquifer and localized areas within the surficial aquifer. Both local
and regional flow patterns exist in the District of Columbia. The local flow systems correspond
to the surface water drainage basins of the Potomac River, the Anacostia River, Rock Creek and
Oxon Run.
In 2002, the U.S. Geological Survey installed three monitoring wells in the tidal part of
Anacostia River watershed (Miller and Klohe, 2003). Two wells were installed at the New York
Avenue overpass, two wells at the Kenilworth Aquatic Gardens, and one well at Anacostia Park.
In 2005 and 2008, the USGS in collaboration with the DC Department of the Environment
investigated the ground water quality of 31 wells in the district (Figure 2). Most monitoring wells
are located in the Anacostia River watershed, whereas three wells are in Rock Creek watershed
and only one well on the Potomac River watershed.
Table 1: The Table below show the depth, Aquifer Media, Location and methods used to installs
the (13) Wells.
Well Depth
(ft.)
Aquifer Media Location Method
MW-1 250 Unconsolidated clay,
sand
Ft. Dupont Park, SE Hydraulic (Mud)
Rotary
MW-2 50 Unconsolidated fill,
sand, gravel, clay
New York Ave and 1st Street, NW Hollow – Stem
Auger
MW-3 100 Massive/ fracture rock Dalecarlia Parkway, NW Air – Percussion
Rotary
MW-4 30 Unconsolidated fill,
sand, gravel, clay
Massachusetts Ave and Constitution
Ave, NE
Hollow – Stem
Auger
MW-5 22 Unconsolidated fill,
sand, gravel, clay
1st and N St, SW Hollow – Stem
Auger
MW-A 1,
2, 3
22 Unconsolidated fill,
sand, gravel, clay
Peabody St. & 8th St, NW Hollow – Stem
Auger
MW-B 1,
2, 3
19 Unconsolidated fill,
sand, gravel, clay
Nannie Helen Burroughs Ave &
48th Street, NE
Hollow – Stem
Auger
MW-C 1,
2
18 Unconsolidated
Saprolite
Rock Creek Golf Course Hole 17 Hollow – Stem
Auger

Figure 1: General location map of ground water monitoring wells installed during the ground
water resource assessment study (after DC WRRC, 1993)
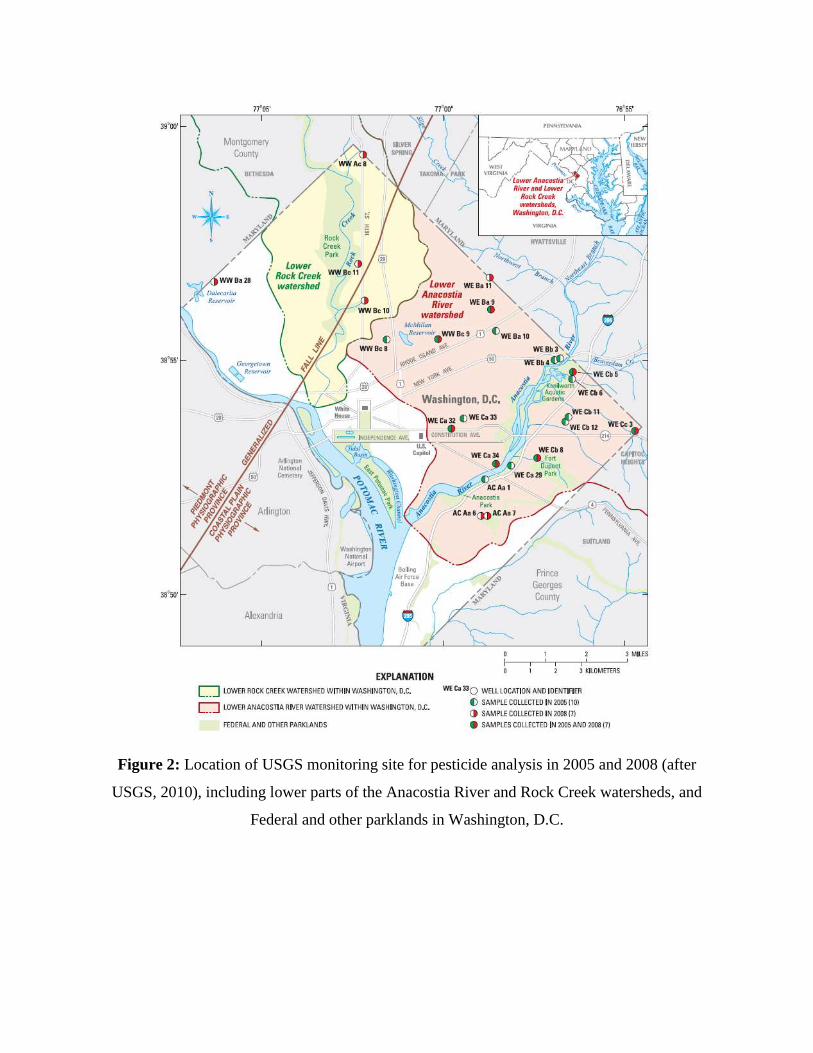
Figure 2: Location of USGS monitoring site for pesticide analysis in 2005 and 2008 (after
USGS, 2010), including lower parts of the Anacostia River and Rock Creek watersheds, and
Federal and other parklands in Washington, D.C.

3. Groundwater Level
In an urban setting, both ground water rise and depletion are important issues which must be
addressed in sustainable water resources management. Groundwater depletion can be due to less
pervious layer of the system, whereas groundwater level rise is mainly due to leakage from sewer
system or main water break or leakage from distribution system (Sharp et al., 2003). Monitoring
data showed that groundwater level can rise up to 20 feet after nearby water main break in DC
(DCWRRC, 1993). Regardless of groundwater use for water supply, such potential rise of
ground water levels must be an integral part of urban water resources management.
4. Ground water Quality
4.1. Basic water quality
Urbanization can affect ground water quality in various ways. Shallow aquifers can be
contaminated by runoff from paved surfaces, leaky storage tanks, surface spills, illegal dumping
of hazardous waste, and leaky sewage lines (Sharp et al., 2003). In this study, ground water
quality can be discussed in two categories. The 1st category is basic water quality, including
specific conductivity, pH, nitrate, total dissolved solids and metals. The 2nd
category is based on
organic contaminants.
In the District of Columbia, 13 wells (Figure 1) were installed in 1992 through 1993 for
monitoring both basic and organic contaminants in ground water (DC WRRC, 1993). The
average pH values for nine (9) wells ranged from 4.9 – 7.8 with five (5) out of nine (9) below the
minimum of the EPA water quality standards range of 6.5-8.5. The average Specific
Conductance measured values for the year 1992-1993 ranged from 114.86 – 964.75
micromhos/cm . The average dissolved solids ranged from 85.25 – 583.30 ppm with three (3) out
of nine (9) wells exceeded the EPA standard of 500 ppm. In general, the chemistry of well water
during this year is within the normal range of typical ground water quality except dissolved
solids.

In 2005 and 2008, the average specific conductance ranged from 74 - 1550 micromhos/cm. In
2005 and 2008 the pH measured values for fourteen (14) monitoring wells ranged from 4 – 7.4
with eleven (11) out of fourteen(14) below the minimum of the EPA water quality standards
range of 6.5-8.5.
4.2. Pesticide contamination
Based on the 13 monitoring wells installed by UDC in 1989, the presence of pesticides was
investigated as a base line study. It was concluded that the pesticide chlordane was the only
substance detected during the Ground Water Resources Assessment Study from MW-5 in
October of 1992 and 1993, but the detected concentration of 2 ppb does not exceed the
Maximum Contaminant Level specified by U.S EPA (0.002 mg/l, 40 CFR Part 141.61). In 1989,
there was no pesticide detected above the EPA standards in all wells. For a more detailed picture
of pesticide occurrence in ground water and its potential contribution to the water quality of the
District’s rivers, it is advisable to test the ground water quality in or near residential areas as
pesticide application near houses for indoor pest control. Such a project would require the
installation of some more monitoring wells, which would not only provide data on the question
of pesticides in the ground water, but would also enable the District of Columbia to enhance its
picture of the ground water resource in general.
During July-August 2002 (Miller and Klohe, 2003), the U.S. Geological Survey assessed ground
water and sediment quality in the tidal part of Anacostia River watershed. The chemical analyses
included volatile organic compounds, semi-volatile organic compounds or polyaromatic
hydrocarbons, organochlorine pesticides, aroclors and total polychlorinated biphenyls, metals,
nutrients, biochemical and chemical oxygen demands, total phenols, total cyanide, oil and
grease, and total suspended and dissolved solids in aqueous phases. The results showed that all
contaminants were below the EPA reporting level except at the Benning Road monitoring well.
In 2005 and 2008, USGS investigated the presence of pesticides in 31 wells (Koterba et al., ,
2010), including groundwater samples from 17 wells in the lower Anacostia River watershed

from September through December 2005, and from 14 wells in the lower Anacostia River and
lower Rock Creek watersheds from August through September 2008. The results showed that
twenty-seven pesticide compounds were detected in the groundwater samples. No fungicides
were detected. In relation to the pesticides detected, the concentration of the 27 compounds is
below the Federal drinking-water standards.
Summary
Urbanization modifies the hydrology and chemistry of ground water. These modifications
include systematic variation with hydrogeological setting, for example unconfined oxygenated
aquifer allow free vertical movement of water and pollutants from the built infrastructure,
whereas confined anoxic aquifers obstruct vertical water movement and are less prone to
pollution but more readily over exploited. It is therefore crucial to determine the type of existing
monitoring wells before planning for continuous groundwater quality monitoring. This
preliminary study showed that collection of more groundwater quantity and quality data is
crucial to determine the current status as well as predict the future trend of DC ground water. To
develop comprehensive plan and guidelines, a close collaboration with DC Department of
Environment and US Geological survey is needed to generate a more consistent and long term
groundwater monitoring system in DC.
References
Ayotte, J. D.; M. Belaval, S. A. Olson, K. R. Burow, S. M. Flanagan, S. R. Hinkle, B. D. Lindsey
(2014). Factors affecting temporal variability of arsenic in groundwater used for drinking water
supply in the United States. Science of the Total Environment. In Press.Chowdhury, F.,
Christopher L., B. Dziegielewski (2013). A century of water supply expansion for ten U.S. cities,
Applied Geography, 45: 58-76
DC Water Resource Research Center (1993). Ground Water Resources Assessment Study for
District of Columbia. Annual Report, UDC

Garduno H & Foster S (2010). Sustainable groundwater irrigation–approaches to reconciling
demand with resources. World Bank/GWP GW-MATE Strategic Overview Series SO-4
(Washington DC, USA)
Koterba, M.T., C. A. Dieter and C. V. Miller (2010). Pesticides in Groundwater in the Anacostia
River and Rock Creek Watersheds in Washington, D.C., 2005 and 2008, scientific investigation
report 2010-5130. USGS.
Ku, H. F.H., N.W. Hagelin, and H.T. Buxton (1992). Effects of Urban Storm-Runoff Control on
Ground-Water Recharge in Nassau County, New York, Ground Water, 30 (4): 507-514.
Miller, C. V. and C. A. Klohe (2003). Summary of Water- and Sediment-Quality Data for
Anacostia River Well Sites Sampled in July-August 2002, USGS, Open-File Report 03-73
Ortega-Reig, Mar, G. Palau-Salvador, M. Josep, C. Sempere, J. Benitez-Buelga, D. Badiella,
and P. Trawick. (2014). The integrated use of surface, ground and recycled waste water in
adapting to drought in the traditional irrigation system of Valencia, Agricultural Water
Management, Volume 133, February 2014, Pages 55-64
Sharp, J. M., J. N. Krothe, J. D. Mather, B. Garcia-Fresca, and C. A. Stewart. (2003). Effectso f
Urbanizationo n GroundwaterS ystems. EarthS ciencein the City: A Reader, A merican
Geophysical Union, 56: 257-278.
U.S. Environmental Protection Agency. (2002). Community water system survey 2000, Volume
I. Retrieved at http://www.epa.gov/OGWDW/consumer/cwss_2000_volume_i.pdf

Stormwater Quality Management with Green Infrastructure:Nannie Helen Burroughs Avenue
Basic Information
Title: Stormwater Quality Management with Green Infrastructure: Nannie HelenBurroughs Avenue
Project Number: 2013DC152BStart Date: 3/1/2013End Date: 2/28/2014
Funding Source: 104BCongressional
District: DC
Research Category: EngineeringFocus Category: Water Quality, Water Quantity, Treatment
Descriptors:Principal
Investigators: Charles Glass
Publications
There are no publications.
Stormwater Quality Management with Green Infrastructure: Nannie Helen Burroughs Avenue
Stormwater Quality Management with Green Infrastructure: Nannie Helen Burroughs Avenue 1

Stormwater Quality Management with Green Infrastructure: Nannie Helen Burroughs Avenue
Watershed Name: Middle Potomac-Anacostia-Occoquan HUC: 02070010
STATES: DC, MD, VA
Submitted by:
CHARLES GLASS, PH.D.
DEPARTMENT OF CIVIL AND ENVIRONMENTAL ENGINEERING
HOWARD UNIVERSITY
Submitted to:
DC Water Resources Research Institute,
University of the District of Columbia
May 5, 2014

EXECUTIVE SUMMARY The purpose of this research was to evaluate the effectiveness of three variations of green
infrastructure devices in the removal of stormwater contaminants for ten storm events along
Nannie Helen Burroughs Avenue in Washington, D.C. This was done by collecting
representative samples of stormwater from both the influent and the effluent of the bioretention
cells for laboratory analysis. The three devices in this study are identified as: bioswale, swale-
bioretention and bioretention. The general order of performance in descending order was: the
bioretention, the bioswale and the swale-bioretention. For all three devices the effluent quality
was significantly improved, in aggregate for all pollutants, than the influent stormwater.
The Swale-bioretention produced negative results for total dissolved solids, copper,
cadmium, nitrite, nitrate and ammonia. The percentage removals for these pollutants were -
564%, -24%, -10%, -50%, -9% and -8.33% respectively. The Bioswale produced negative results
for total dissolved solids, lead and total phosphorus with percentage removals of -91%, -25% and
-44% respectively. The Bioretention produced negative results for total dissolved solids,
cadmium and zinc with -98%, -7% and -18% removals respectively. These poor results could be
as a result of poor or lack of routine and periodic maintenance which includes; replacement of
sub-soil mix, annual replacement of much layer and proper maintenance of plant material
(Maryland Department of Environmental Resources (DER), 2007, Yu, S. L et al., 2001).

Contents EXECUTIVE SUMMARY .................................................................................................................................. 2
TABLE OF ACRONYMS ................................................................................................................................... 4
1. INTRODUCTION ..................................................................................................................................... 5
2. BACKGROUND ....................................................................................................................................... 7
2.1 PROJECT DESCRIPTION ........................................................................................................................ 9
3. LITERATURE REVIEW ........................................................................................................................... 12
3.1 Urban Stormwater Best Management Practices: ....................................................................... 12
4. MATERIALS AND METHODS ................................................................................................................ 19
4.1 Stormwater Sampling ....................................................................................................................... 19
4.2 Sample Storage and Preservation ..................................................................................................... 20
4.3 Analytical Methods ........................................................................................................................... 23
5. RESULTS AND DISCUSSION ...................................................................................................................... 26
5.1 Performance criteria ......................................................................................................................... 26
5.2 Bioswale Results ................................................................................................................................ 28
5.3 Swale-bioretention Results ............................................................................................................... 29
6. CONCLUSIONS AND RECOMMENDATIONS ......................................................................................... 33
6.1 Recommendations ............................................................................................................................ 33
REFERENCES ................................................................................................................................................ 34

TABLE OF ACRONYMS
DDOT - District Department of Transportation.
QA - Quality Assurance
QAPP - Quality Assurance Project Plan
BMPs - Best Management Practices
GHI - Green Highway Initiative
DDOE -District Department of the Environment
(DC)WASA – District of Columbia Water and Sewer Authority
LID - Low Impact Development
NPDES - National Pollutant Discharge Elimination System
MS4 - Municipal Separate Storm Sewer System
BMPs - Best Management Practices
TSS - Total Suspended Solids
BOD5 - 5-day Biochemical Oxygen Demand
COD - Chemical Oxygen Demand
TDS - Total Dissolved Solids
TN - Total Nitrogen
AAS - Atomic Absorption Spectroscopy®
PAHs - Polycyclic Aromatic Hydrocarbons
HPLC - High-Performance Liquid Chromatographic
IC – Ion Chromatograph
AEMC - Average Event Mean Concentration
SOL - Summation of Loads

1. INTRODUCTION
Urbanization has important hydrologic and environmental implications (O’Driscoll et al., 2010;
Gunn et al., 2012). Hydrologic impacts of urban expansion can be seen in increasing runoff rate
and volume, decreasing soil-water, decreasing groundwater recharge and baseflow, decreasing
interception and evapotranspiration (Harbor, 1994; Tang et al., 2005), and degradation of water
quality in both streams and shallow groundwater due to urban waste discharge, industrial
discharge, leakage from waste disposal grounds, and nonpoint source pollutant losses (USEPA,
2000). Urban runoff is rapidly becoming a major source of non-point source pollution (US EPA,
1996) and has been found to be a leading impairment source for surface waters and ground
water. In 1997, Bang et al. indicated that the street solids and sewer-deposited material are major
pollutants in urban runoff.
The District of Columbia is served by the Municipal Separate Storm Sewer System (MS4) and
Combined Sewer System (CSS). During a storm event, some of the stormwater collected by
these systems are discharged directly into the rivers causing human health effects as well as
problems for the aquatic species present. Again, during runoff, suspended material and other
debris transported to the sewer systems often block the systems. In order to prevent sewer
blockages and improve the quality of the stormwater before reaching the sewer systems, catch
basins are installed in urban locations. Catch basins are, however, completely ineffective at
removing dilute pollutants from stormwater runoff. Other best management practices (BMP’s)
have been evaluated for the past couple of decades that are much more effective at reducing
pollutants of interest before they enter natural water bodies.

The District of Columbia Department of Transportation (DDOT) commissioned the evaluation of
the efficiency of three BMP’s utilized by DDOT roadway infrastructure. The specific BMP’s of
interest in this project were a Bioswale, swale-bioretention, and bioretention.
Bioretention is a best management practice (BMP) developed in the early 1990's by the Prince
George's County, Maryland, Department of Environmental Resources (PGDER). Bioretention is
a terrestrial-based, water quality and water quantity control practice using the chemical,
biological, and physical properties of plants, microbes, and soils for removal of pollutants from
stormwater runoff. Some of the processes that may take place in a bioretention facility include
sedimentation, adsorption, filtration, volatilization, ion exchange, decomposition,
phytoremediation, bioremediation, and storage capacity. This same principle of using biological
systems has been widely used in agricultural and wastewater treatment practices for retention
and the transformation of pollutants and nutrients.
The objective of this research was to evaluate the effectiveness of three green infrastructure
devices in the removal of stormwater contaminants for fifteen storm events in the District of
Columbia with the hope to restore urban watersheds through the use of Green Highway Initiative
principles and Low Impact Development while revitalizing an urban arterial. Representative
samples of the “first-flush” of stormwater runoff were collected at the inlet and outlet points of
the devices and transported to the laboratory for analysis. Data was collected based on the
amount of rainfall and pollutant concentrations present in the influent and effluent runoff were
accessed.

2. BACKGROUND This project to evaluate three green infrastructure devices was a part of a total green street
development program. The larger project was funded through the D.C. Government Capital
Improvements Program. The total $5.7 million dollar budget was slated for design and
construction of roadway Streetscape, Streetlights, Traffic Signals and best management practices
for water quality along the entire 1.5 mile long corridor. Both the community and DDOT wished
for the Nannie Helen Burroughs project to become the District of Columbia’s first model “green
street” and replicable throughout the District. DDOT utilized innovative Green Highway
Initiative (GHI) and low impact development (LID) approaches to provide improved water
quality of stormwater within the available budget. The technical GHI and LID approaches were
implemented at the overall road plan level and the design level. The overall planning included
evaluating a “road diet” that may reduce the roadway width and travel lanes while maintaining
transportation and mobility throughout. “Surplus” space was available to expand non-motorized
transportation facilities such as sidewalks and bicycle lanes, and provide space for additional
street trees and bioretention facilities. Portions of the existing concrete and/or asphalt roadway
were removed to create these facilities. The design concepts were developed and presented to
the community for input.
The basic concepts behind these LID techniques are part of the Anacostia Waterfront Initiative
and Great Streets Transportation Plans. The acceptance and buy in of these concepts by the
community is well documented. Therefore, they have a high probability of feasibility and long-
term acceptance by the community. The techniques will be selected through the collaborative
effort of the partners, led by DDOT. The criteria will include environmental effectiveness,
community acceptance, and the feasibility of the technique to achieve the listed multiple

objectives. Howard University will participate in public meetings with DDOT throughout the
project to provide input on the amount of maintenance that is required to maintain the
performance of selected LID.
Figure 1. Project Area Map
The infrastructure along this road prior to reconstruction was dilapidated and was selected for
this project because significant improvements and enhancements were required. The Nannie
Helen Burroughs Avenue corridor, (see Figure 1), is adjacent to the Watts Branch and riparian
buffer to Watts Branch, but lacks street trees along long segments that could provide vital
canopy, shade, habitat, and stormwater management. The roadway had more travel lanes than
are required for the current volume of traffic and thus had more impervious surface area than

necessary. There are a number of storm sewers running under Nannie Helen Burroughs that
discharge directly into Watts Branch. Additionally, the previous neglected condition of the
roadway contributed to a general appearance of neglect and disinvestments along the length of
the corridor, which impedes economic development in the area.
The driving force behind the physical, chemical, and biological degradation of Watts Branch is
enhanced stormwater flow and rate of flow. Vast areas of impervious surface cause these flows
by prohibiting infiltration, leading to flashy, intense flow conditions in the stream channel, even
during moderate storm events. It is envisioned that Watts Branch will become a quality
community stream and park system comparable to the National Park Service’s Rock Creek Park
in Northwest DC. Improving the infrastructure along the Nannie Helen Burroughs Avenue
corridor will assist in achieving this vision of restored habitat, water quality, and aesthetics.
Extensive stream restoration have been completed in Watts Branch by DDOE, however all of the
work on this project will be performed adjacent to the Nannie Helen Burroughs Avenue and will
not include improvements to water quality that are a result of those restoration efforts.
2.1 PROJECT DESCRIPTION
This project was designed to address the needs of DDOT to evaluate the impact of stormwater
pollution from runoff from pervious surfaces and the effectiveness of LID devices to mitigate
those impacts. Under the National Pollutant Discharge Elimination System (NPDES), Municipal
Separate Storm Sewer System (MS4), the government is tasked to utilize best management
practices (BMPs) to substantially minimize pollution transport from stormwater runoff.

The purpose of this grant is to assist DDOT in developing an institutional framework and action
plan to restore urban watersheds through the use of GHI principals and LID while revitalizing an
urban arterial.
The Howard University, Department of Civil and Environmental Engineering, monitored three
three water quality BMP structures constructed by DDOT as a part of the overall Project. The
locations for these structures was identified by DDOT before the rainy season begins in the
spring of 2012. The sampling and monitoring of the approved BMP’s were performed in
accordance to the 40 CFR 122.26 (d)(2)(iii). The parameters tested were as follows:
1. TSS - Total Suspended Solids
2. COD - Chemical Oxygen Demand
3. TDS - Total Dissolved Solids
4. TN - Total Nitrogen (TKN + NO2 + NO3)
Measured as Total Kjeldahl Nitrogen + Nitrite-Nitrogen(NO2) + Nitrate-Nitrogen(NO3)
5. Oil and Grease (Polycyclic Aromatic Hydrocarbons, also known as semi-volatile organic
compouds)
Naphthalene, Acenaphthene, Acenaphthylene, Fluorene, Phenanthrene, Anthracene,
Fluoranthene, Pyrene, Benzo(a)anthracene, Chrysene, Benzo(b)fluoranthene,
Benzo(k)fluoranthene, Benzo(a)pyrene, Dibenzo(a,h)anthracene, Benzo(ghi)perylene,
Indeno(1, 2, 3-cd)pyrene.
6. TP - Total Phosphorus
7. Ortho- Dissolved Phosphorus

8. Cd - Cadmium
9. Cu - Copper
10. Pb - Lead
11. Zn - Zinc
12. Cr - Chromium
13. As - Arsenic
14. pH and Temperature
15. Measure of Sediment Accumulation
The Howard University, Department of Civil and Environmental Engineering was expected to
assist DDOT in identifying catch basins to monitor before construction was completed, and if
possible before construction had begun in the catchment area. This was not possible due to
delays in the awarding of the grant to Howard University. After installation of the new GHI and
LID devices monitoring began in April of 2012 through September 2012. Because of contractual
issues monitoring ceased from November 2012 – May 2013, then began again in May 2013 and
finished at the end of September 2013. The same parameters were analyzed using the same
protocols as performed during the two monitoring phases.

3. LITERATURE REVIEW Today in the United States, stormwater pollution has become a primary non-point pollution
source of concern. And according to the United States EPA stormwater pollution still remains a
leading cause of water body impairment (US EPA, 2011). Stormwater treatment has therefore
become very necessary in urban and suburban areas to manage stormwater runoff. However, this
has proven difficult because of the number and varieties of point and non point sources. To deal
with these setbacks, various stormwater best management practices (BMPs have been developed
and implemented which include rain gardens (bioretention), bioswales, stormwater wetlands, and
others (USEPA, 2000; Davis, 2005).
3.1 Urban Stormwater Best Management Practices: Best Management Practices (BMPs) also known as low impact development practices (LIDs) are
micro-scale control practices used to bring the natural hydrology of a site close to that of its
predevelopment conditions (Coffman, 2002; HUD, 2003). They are used to manage and improve
the quality of stormwater runoff (Strecker et al,. 1992). Structural BMPs are engineered and
constructed systems that are used to treat stormwater runoff. Non-structural BMP’s are pollution
prevention practices designed to reduce the amount of pollutants present in stormwater runoff.
Urban stormwater BMP’s are implemented to control flow, removal pollutants and reduce
pollutant source.
It is very important to control stormwater runoff flow rates because increased flow rates increase
erosion. Urban stormwater BMPs reduce flow rates by storage, infiltration, and natural forms of
hydrologic control. A wide range of pollutants can be removed from stormwater runoff with the
use of properly designed and maintained structural BMPs (Strecker et al,. 1992). Stormwater

BMP’s utilize various chemical and physical operations to remove pollutants from stormwater.
Some of these processes include filtration, absorption, nitrification, settlement, and oxidation.
The implementation of Stormwater BMPs is driven by four fundamental hydrologic
considerations: control of runoff volume, control of peak runoff rate, control of flow frequency,
and control of water quality (PG County, 1999).
Bioswales:
Bioswale is the general term given to any vegetated swale, ditch, or depression that conveys
stormwater. The fully vegetated bioswale and the open channel bioswale are the two basic types
of vegetated swales based upon the degree of vegetation. Research revealed that the trapezoidal
fully vegetated bioswale is the most effective bioswale at removing pollutants. Open channels do
not add much more than infiltration to the process of removing pollutants. Bioswales provide
good treatment of stormwater runoff without the extensive maintenance required for some other
stormwater BMPs. When bioswales are well maintained and the residence time of water in a
swale increases, pollutant removal rates increase. The effectiveness of bioswales is also
dependent upon the retention time of the stormwater in the bioswale. The longer the retention
time, generally, the higher the removal efficiency.
Stormwater runoff contributes pollutants to streams, rivers and lakes. Pesticides, herbicides, and
fertilizers come from residential lawns, commercial landscaping, and recreational facilities like
golf courses. Residuals also leach from lands that were previously farmland. Heavy metals in
stormwater come from vehicles, buildings, roofs, and industries. Oil and grease drip regularly
from cars onto streets and parking lots. Pathogens and bacteria in runoff can come from pet

waste, broken or leaking sanitary sewers, wildlife, or sanitary sewer overflows. Bioswales can
remove a large amount of pollutants found in stormwater runoff. Bioswales have achieved high
levels of removal of suspended solids (TSS), turbidity, and oil and grease (DEQ NWR, 2003).
They can also remove a moderate percentage of metals and nutrients in runoff. This lower level
of removal compared to sediment or oil and grease is partly due to the large percentage of metals
and nutrients that are dissolved in runoff.
Bioswale Monitoring and Performance
The effectiveness of bioswales at removing pollutants can be measured in two ways. The first is
by measuring the particular pollutants of interest by their concentrations in water entering and
exiting the bioswale and calculating the difference. This method does not account for the
infiltration of the pollutants along the length of the bioswale which may be released at some
future time or have to be remediated in the future. The second method involves performing a
mass balance of pollutants in the bioswale throughout the length of the bioswale. This method
will result in information on the amount of pollutants retained in the soil and vegetation of the
bioswale.
Table 1 Bioswale removable efficiencies
Pollutant Removal
Total Suspended Solids (TSS) 83 - 92%
Turbidity (with 9 minutes of residence) 65%
Lead (Pb) 67%
Copper (Cu) 46%

Total Phosphorus (TP) 29 - 80%
Aluminum (Al) 63%
Total Zinc 63%
Dissolved Zinc 30%
Oil/Grease 75%
Nitrate-N (NO3-N) 39 - 89%
Source: DEQ NWR, 2003
Swale Bioretention:
Bioretention swales provide both stormwater treatment and conveyance functions. These systems
consist of both elements of a vegetated swale and a bioretention system. These components are
subtly different and the main function of the swale is that of conveyance while the primary
function of the bioretention component is the promotion of soil filtration of stormwater. The
swale may have a discharge capacity to convey stormwater flow for frequent events (Barling et
al, 1993).
The swale component provides pretreatment of stormwater to remove coarse to medium
sediments while the bioretention system removes finer particulates and associated contaminants.
Bioretention swales provide flow retardation for frequent storm events and are particularly
efficient at removing nutrients.
Bioretention swale performance:
Test results showed that bioretention swales removed 85%, 70% and 45% of Total Suspended
Solids, Total Phosphorus and Total Nitrogen respectively (Woodfull J et al. 1993).

Bioretention
Bioretention is a terrestrial-based water quality and water quantity control practice that uses the
chemical, biological, and physical properties of plants, microbes, and soils for removal of
pollutants from stormwater runoff.
The system was initially developed by the Prince George’s County Department of Environmental
Resources (PGDER) in Maryland (US EPA, 1999). Even though the system is a non-structural
BMP, it is usually engineered and placed strategically to provide treatment. Processes such as
filtration, sedimentation, absorption, ion exchange, nitrification and denitrification, and
decomposition allow the Bioretention to treat a wide range of pollutants present in influent
stormwater.
The use of bioretention does not only provide for water quality and quantity control, but also
adds value to a development. It brings landscape diversity into the built environment, establishes
a unique sense of place, encourages environmental stewardship and community pride, provides a
host of additional environmental benefits, increases real estate values up to 20 percent by using
aesthetically pleasing landscaping.
Bioretention Performance
Bioretention uses chemical, physical, and biological processes to remove pollutants from
stormwater. The ability of the bioretention to perform several different types of pollutant
removal makes it an effective low impact device. The bioretention is designed to treat first-flush
stormwater runoff since that is when stormwater has its highest pollutant load (US EPA, 1999).

Several studies have been conducted on the performance of bioretention and their effectiveness
in removing pollutants in stormwater.
Table 2 Laboratory bioretention removal efficiency
Pollutants Removal Rates
Total Phosphorus 70-83%1
Metals (Cu, Zn, Pb) 93-98%1
TKN 68-80%1
Total suspended solids 90%2
Organics 90%2
Bacteria 90%2
Source: Davis et al., 1998; PGDER, 1993
Highway Runoff Characteristics:
Highway runoff characteristics has been summarized based on: aggregate water quality
parameters, metals constituents, nutrient constituents, and other less frequently measured water
quality parameters such as fecal indicator bacteria, toxicity, polycyclic aromatic hydrocarbons
(PAHs), and herbicides and pesticides.
Conventional and aggregate water quality parameters:
These include: total suspended solids (TSS), total dissolved solids (TDS), dissolved organic
carbon (DOC), total organic carbon (TOC), chemical oxygen demand (COD), biochemical

oxygen demand (BOD), oil and grease, hardness as CaCO3, temperature and pH. The three most
frequently measured aggregate parameters are TDS, COD and oil and grease.
Metals constituents:
Metal constituents in the literature generally include aluminum (Al), arsenic (As), cadmium
(Cd), chromium (Cr), copper (Cu), iron (Fe), lead (Pb), nickel (Ni), and zinc (Zn). Metal
pollutant concentrations vary within each continent and between continents.
Nutrients:
Selective nutrients monitored from different studies include nitrates, nitrites, ammonium, total
Kjehldal nitrogen (TKN), total nitrogen, phosphate and total phosphorus (TP). Nitrogen and
phosphorus constituents can be transformed in the environment from dissolved to particulate
forms or from one dissolved form to another, with an overall impact that can be substantial. The
sources of nitrogen and phosphorus species measured in highway runoff may be related to both
traffic and non-traffic sources.

4. MATERIALS AND METHODS
4.1 Stormwater Sampling This project was contracted to collect influent and effluent for 15 storm events. In actuality 10
storms were sampled conducted from May, 2012 to September, 2013 due to inconsistencies in
rainfall and arrival at the sites after storms had ended resulting in missing effluent. Table 4.1 lists
the sample dates and the rainfall measurements at the National Airport weather station. Influent
and effluent samples were evaluated with a 3 day minimum dry period between collection
samples in order to ensure an adequate antecedent dry period for pollutants to accumulate after
the previous storm.
Table 4.1 Sampling Dates
Sampling Date Event Number Samples Collected Rainfall (Inches)
6/12/2012 1 Site 1inlet, 2inlet and 3inlet 0.26
6/26/2012 2 Site 1inlet 0.28
7/9/2012 3 1inlet, 2inlet, 2outlet and 3inlet 0.69
7/19/2012 4 Site 1inlet, 1outlet and 2inlet 0.42
8/26/2012 5 All except 3inlet 0.28
9/1/2012 6 All sites 1.64
9/19/2012 7 All sites except 1outlet 0.93
9/31/2012 8 All sites except 1outlet 0.49
6/29/2013 9 All sites 0.64
9/21/2013 10 All sites except 1outlet 0.72

4.2 Sample Storage and Preservation Samples were labeled and carefully handled to prevent misidentification and cross
contamination. After collecting the samples, they were prepared for storage or analyzed by the
team at the Howard University laboratory in accordance with the protocol of Table 4.2 on the
same day.
The following parameters were measured on the influent and effluent water of the three catch
basins; pH, temperature, total suspended solids, total dissolved solids, chemical oxygen demand,
nutrients (ammonia, nitrite, nitrate, phosphate), heavy metals such as mercury (Hg), Cadmium
(Cd), Copper (Cu), Lead, (Pb), Chromium, Arsenic (As) and 16 Polycyclic Aromatic
Hydrocarbons (PAH), associated with oil and grease. The 16 PAHs were; Naphthalene,
Acenaphthene, Acenaphthylene, Fluorene, Phenanthrene, Anthracene, Fluoranthene, Pyrene,
Benzo(a)anthracene, Chrysene, Benzo(b)fluoranthene, Benzo(k)fluoranthene, Benzo(a)pyrene,
Dibenzo(a,h)anthracene, Benzo(ghi)perylene, Indeno(1, 2, 3-cd)pyrene.
The accuracy of both the equipment and the sampling methodology were determined by
performing these tests in triplicate. In addition, the instruments were also calibrated by creating a
standard curve with at least five known values, in triplicate.
Table 4.2. Parameters Measured and the Technique Required
Constituent
Name
Analytical Method
Collection
method
Containers Preservative
Maximum
holding
time
Cadmium AAS- Furnace Composite
Plastic,
Glass
Filter on site
HNO3 to PH<2
6 mths
Chromium AAS- Furnace Composite Plastic, Filter on site 6 mths

Glass HNO3 to PH<2
Copper AAS- Furnace Composite
Plastic,
Glass
Filter on site
HNO3 to PH<2
6 mths
Lead AAS- Furnace Composite
Plastic,
Glass
Filter on site
HNO3 to PH<2
6 mths
Arsenic AAS- Furnace Composite
Plastic,
Glass
Filter on site
HNO3 to PH<2
6 mths
Zinc AAS- Furnace Composite
Plastic,
Glass
Filter on site
HNO3 to PH<2
6 mths
TS-Total Solids
Total Solids
Dried at 103-105°C
Composite
Plastic,
Glass
Cool, 4°C 24 hrs
TDS- Total
Dissolved Solids
Total Dissolved Solids
Dried at 180°C
Composite
Plastic,
Glass
Cool, 4°C 24 hrs
TSS-Total
Suspended
Solids
Total Suspended Solids
Dried at 103-105°C
Composite
Plastic,
Glass
Cool, 4°C 24 hrs
COD Closed reflux, Colorimetric
Method Composite Glass
Filter on site
H2 SO4 to PH<2
No holding
(better)
Nitrogen
Ammonia
Ammonia selective
Electrode
Composite
Plastic,
Glass
Cool, 4°C
H2SO4 to PH<2
24 hrs
Nitrogen-Nitrite Ion Chromatography Composite
Plastic,
Glass
Cool, 4°C No holding
(better)
Nitrogen-Nitrate Ion Chromatography Composite
Plastic,
Glass
Cool, 4°C
H2SO4 to PH<2
24 hrs
Soluble (dissolved)
Phosphorus
Ion Chromatography Composite
Plastic,
Glass
Filter on site
Cool, 4°C
48 hrs
PAH-Poly Aromatic
Hydrocarbon HPLC Composite Glass ___ ___
Temperature Thermocouple Measurement
on site
Plastic,
Glass
Determine on site
No
holding
pH pH-probe Measurement
Plastic, Cool, 4°C 6 hrs
on site Glass Determine on site
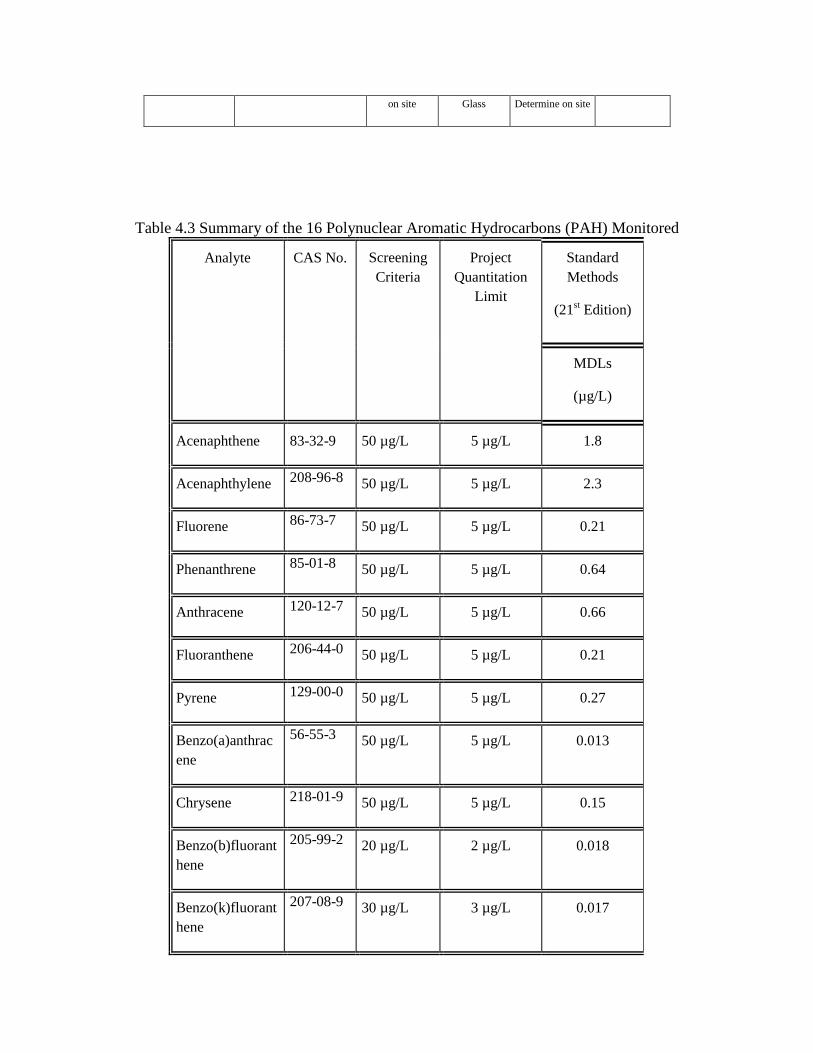
Table 4.3 Summary of the 16 Polynuclear Aromatic Hydrocarbons (PAH) Monitored
Analyte CAS No. Screening
Criteria
Project
Quantitation
Limit
Standard
Methods
(21st Edition)
MDLs
(µg/L)
Acenaphthene 83-32-9 50 µg/L 5 µg/L 1.8
Acenaphthylene 208-96-8 50 µg/L 5 µg/L 2.3
Fluorene 86-73-7 50 µg/L 5 µg/L 0.21
Phenanthrene 85-01-8 50 µg/L 5 µg/L 0.64
Anthracene 120-12-7 50 µg/L 5 µg/L 0.66
Fluoranthene 206-44-0 50 µg/L 5 µg/L 0.21
Pyrene 129-00-0 50 µg/L 5 µg/L 0.27
Benzo(a)anthrac
ene
56-55-3 50 µg/L 5 µg/L 0.013
Chrysene 218-01-9 50 µg/L 5 µg/L 0.15
Benzo(b)fluorant
hene
205-99-2 20 µg/L 2 µg/L 0.018
Benzo(k)fluorant
hene
207-08-9 30 µg/L 3 µg/L 0.017

Analyte CAS No. Screening
Criteria
Project
Quantitation
Limit
Standard
Methods
(21st Edition)
MDLs
(µg/L)
Benzo(a)pyrene 50-32-8 30 µg/L 3 µg/L 0.023
Dibenzo(a,h)anth
racene
53-70-3 20 µg/L 2 µg/L 0.030
Benzo(ghi)peryle
ne
191-24-2 30 µg/L 3 µg/L 0.076
Indeno(1,2,3-
cd)pyrene
193-39-5 30 µg/L 3 µg/L 0.043
Naphthalene 91-20-3 50 µg/L 5 µg/L 1.8
4.3 Analytical Methods Upon arrival in the laboratory with the samples, the influent and effluent readings were taken for
the temperature and pH on the 1 Liter jars from the different catch basins. The pH, Temperature
and total dissolved solids were measured using the multiparameter probe. All measurements
were performed in triplicate.
Total Suspended Solids: The method used to perform the TSS measurements is the Total
Suspended Solids at 103-105 C (Standard Methods, 21st Ed.). In this method, the weight of the
glass-fiber filters and the aluminum dish were taken and recorded as B, mg. The sample was
stirred and 60 ml of sample poured onto a glass-filter with applied vacuum. After the vacuum

was turned off, the filter was removed from the filtration apparatus and transferred to the
weighed aluminum dish. The sample was dried in an oven at 103-105 C for 1 hour. The sample
and dish were then taken out and allowed to cool to room temperature. After cooling, they were
weighed again and recorded as A, mg. The difference between A and B gives the total suspend
solids in mg.
Chemical Oxygen Demand: The Chemical Oxygen Demand test was used to determine the
organic content of samples. The samples were analyzed using the HACH COD Reactor and UV
Spectrophotometer. All samples were refrigerated at 4 C. The method for low range sample
concentration (HACH Water Analysis Handbook, 1989) was used throughout the analysis.
Nutrients: The nutrients that were analyzed in the laboratory included nitrite (NO2-N), nitrate
(NO3-N), phosphate (PO4
-3-P), and ammonia (NH3-N).
Nitrite (NO2-N), nitrate (NO3-N), phosphate (PO4-3
-P), (NH3-N) were analyzed using the Dionex
ICDX-120 instrument and an attached AS 40 Automated sampler unit. The procedure involved
preparing 100 ppm stock solution as standards. In this case, AS14A and CS12 were the guard
and analytical columns used to analyze the anions and cations, respectively.
The presence of heavy metals in the samples was analyzed using Atomic Absorption
Spectroscopy (AAS) through a furnace module (800 Aanalyst, Perkin-Elmer Corporation,
Norfolk, CT). The AAS is composed of AAanalyst 800 and AS 800 Auto sampler including a
WinLab 32 software. During the analysis, Matrix modifiers for each of the specific heavy metals
were included in the analysis to determine their accuracy. In order to preserve the heavy metal
samples, 1.5 mL of HNO3 per liter of sample was used to lower the pH to approximately 2. The

samples were filtered with 0.45 µm non-sterile syringe filters before the analysis and to maintain
the accuracy of the results, all lab analysis was performed within required storage time (APHA,
2005).
Polycyclic Aromatic Hydrocarbons: The method for determining the polycyclic aromatic
hydrocarbons (PAHs) was accomplished using the high-performance liquid chromatographic
(HPLC) method. The HPLC is an analytical system complete with column supplies, high-
pressure syringes, detectors, and compatible strip-chart recorder (APHA, 2005). Extraction was
done by pouring 100ml of the sample into a 500mL separatory funnel and adding 15 mL of
methylene chloride. The sample was shaken and allowed to settle down for about 10 minutes.
After the extraction, the sample was separated in a RotoVapor R-210 machine and Acetonitrile
added to it. The samples were then filtered with a 0.2 µm non-sterile syringe filters. After placing
the filtered samples in vials, analysis of the samples were performed in a Dionex SumMit HPLC
machine.
Rainfall Data taken from the National Weather Service Data from the Rain Station at Reagan
National, which given the variability of rain is only an estimate of the rain the fell at the four
sites. Rain gauges used at previous sites were repeatedly destroyed or stolen.
3.4 Data Analysis
The USEPA (1983) has two basic methods for computing pollutant removal efficiency of
stormwater devices (FHWA, 2002). The average event mean concentration efficiency ratio
(Eemc) and summation of loads efficiency ratio (Esol), both expressed as percentages:

100AEMC
AEMC-1E
100AEMC
AEMC-1E
in
outsol
in
outemc
AEMC is the average event mean concentration and SOL is the summation of loads. In and Out
represent inflow and outflow. In order to calculate loads the product of event mean
concentration and the volume of storms have to be calculated. AEMC and SOL can be
calculated for all of the storms monitored or computed on a per storm basis, which can be more
accurate, but is also more expensive and due to budgetary constraints was not considered for this
project. In this project, because it was deemed too costly to calculate the flow rates into and out
of each device, we are limited to calculating the AEMC only. Using the AEMC can be biased: it
does not show the possible values or information on the changes in concentration associated with
storm magnitude. However, given the constraints of this project, calculating the AEMC was the
only avenue for analyzing the data given the fiscal constraints already mentioned.
5. RESULTS AND DISCUSSION
5.1 Performance criteria All three devices that were evaluated have very different design characteristics and therefore
attained varied performance. In order to evaluate the relative performances of each BMP the
USEPA’s freshwater priority (Table 5.1) and non-priority (Table 5.2) pollutant guidelines were
used. This was chosen as stormwater treatment systems effluent ultimately feed fresh water
bodies and therefore should adhere to these standards. Raw data for all sites are presented in the
appendix.

Table 5.1 Chronic Priority Pollutants for Fresh Water
Pollutant Chronic Concentration (ppb)
Copper 9
Cadmium 0.25
Zinc 120
Chromium 11
Lead 2.5
Arsenic 150
EPA
Table 5.2 Non-priority Pollutants (US EPA)
Pollutant Concentration (mg/L)
pH 6.5-9.0
Dissolved Oxygen Dependent
Temperature Dependent
TSS 80
TDS 250

PAH 0
Total Nitrogen 10
Total Phosphorus 0.1
US EPA
5.2 Bioswale Results The results for the NHB Bioswale were average as some of the parameters regularly met
required standards. Satisfactory removal rates were achieved for TSS, NH3, NO3, PO4 and COD
contaminants with the system achieving 55%, 93%, 90%, 100% and 56% removal respectively
as shown in Table 5.3. Chromium and arsenic also showed satisfactory results with 80% and
21% removal respectively. Of note were the concentrations of Copper, Cadmium, Zinc, and
Lead. All of these priority contaminants were above acceptable levels in both influent and
effluent concentrations for all storm events evaluated. Non-priority pollutants did not achieve
removal rates as high as other bioretentions in other studies however the concentrations were
within a reasonable range. The average pH of all 10 events influent and effluent were 7.03 ± 0.12
and 7.44 ± 0.15 respectively.
Table 5.3 Summary of Bioswale Data
Contaminant Influent Avg. and Std. Dev. Effluent Avg. and Std. Dev Removal Efficiency
pH 7.03 ±0.12 7.44±0.14
Temp. (ºC) 25 26

TSS 275 ± 82 125 ± 48 55%
TDS 81.36 ± 35 156 ± 24 -91%
Cu 70 25 64%
Cd 40 38 5%
Zn 162 150 7.4%
Cr 2.0 0.40 80%
Pb 7 9 -28%
As 1.92 1.51 21%
TP 0.75 ± 0.4 1.08 ± 0.2 -44%
PO4-3 0.23 ± 0.02 0.0 ± 0.1 100%
NO2- 0.58 ± 0.12 0.3 ± 0.5 48%
NO3- 0.2 ± 0.3 0.02 ± 0.15 0%
NH3 .15 ± 0.0 .01 ± 00 93%
COD 87 ± 3.3 38 ±3.63 56%
5.3 Swale-bioretention Results The results for the NHB Bioswale were good with most of the parameters regularly meeting
required standards. Satisfactory removal rates were achieved for TSS, TP, PO4and COD
contaminants with the system achieving 71%, 48%, 78% and 47% removal respectively as
shown in Table 5.4. Zinc, chromium, lead and arsenic also showed satisfactory results with 22%,
55%, 86% and 90% removal respectively. Of note were the concentrations of Copper and

Cadmium. These priority contaminants were above acceptable levels in both influent and
effluent concentrations for all storm events evaluated. Non-priority pollutants like ammonia,
nitrates and nitrites did not achieve removal rates as high as other bioretentions in other studies
however the concentrations were within a reasonable range. The average pH of all 10 events
influent and effluent were 6.7 and 6.8 respectively.
Table 5.4 Summary Swale-bioretention Data
Contaminant Influent Avg. & Std. Dev. Effluent Avg. & Std. Dev Removal Eff.
pH 6.7 6.8
Temp. (ºC) 22.6 21.8
TSS 62 ± 34 18 ±13 71%
TDS 28 186
Cu 8.33 10.33 -24%
Cd 37.3 41 -10%
Zn 122.3 95 22%
Cr 4.27 1.89 56%
Pb 3.75 0.5 86%
As 8.83 0.93 90%
TP 1.98 1.03 48%
PO4-3 1.1 0.24 78%
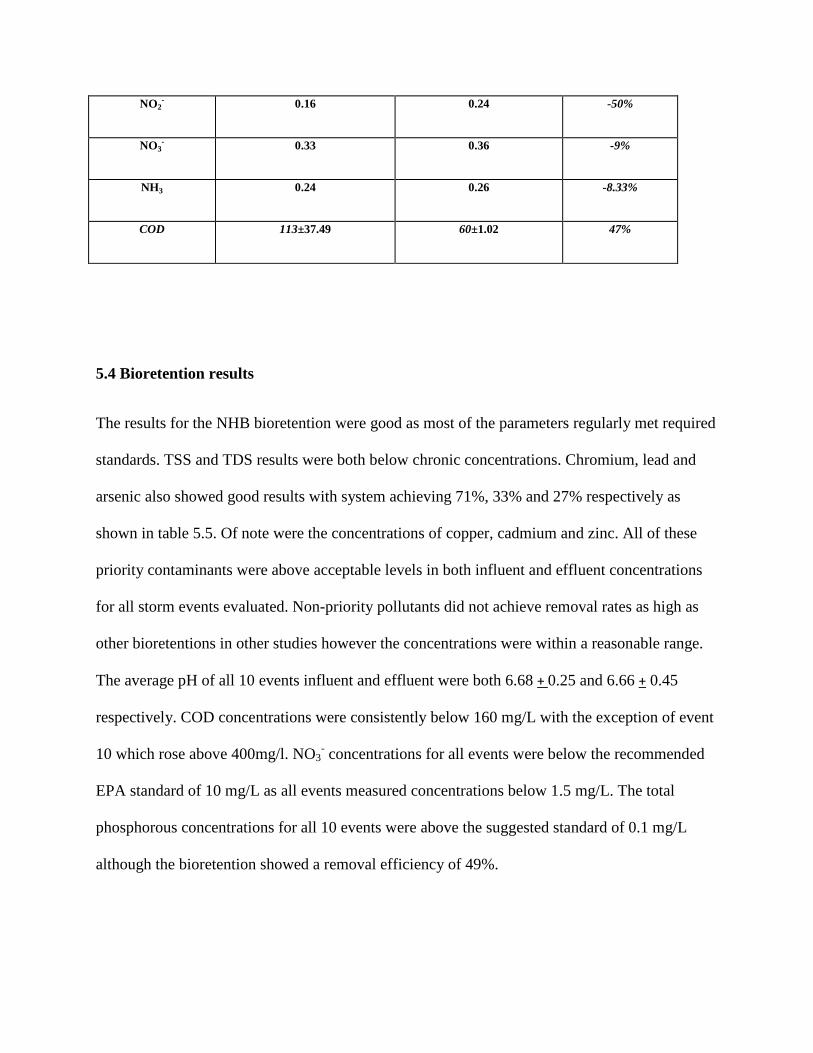
NO2- 0.16 0.24 -50%
NO3- 0.33 0.36 -9%
NH3 0.24 0.26 -8.33%
COD 113±37.49 60±1.02 47%
5.4 Bioretention results
The results for the NHB bioretention were good as most of the parameters regularly met required
standards. TSS and TDS results were both below chronic concentrations. Chromium, lead and
arsenic also showed good results with system achieving 71%, 33% and 27% respectively as
shown in table 5.5. Of note were the concentrations of copper, cadmium and zinc. All of these
priority contaminants were above acceptable levels in both influent and effluent concentrations
for all storm events evaluated. Non-priority pollutants did not achieve removal rates as high as
other bioretentions in other studies however the concentrations were within a reasonable range.
The average pH of all 10 events influent and effluent were both 6.68 + 0.25 and 6.66 + 0.45
respectively. COD concentrations were consistently below 160 mg/L with the exception of event
10 which rose above 400mg/l. NO3- concentrations for all events were below the recommended
EPA standard of 10 mg/L as all events measured concentrations below 1.5 mg/L. The total
phosphorous concentrations for all 10 events were above the suggested standard of 0.1 mg/L
although the bioretention showed a removal efficiency of 49%.
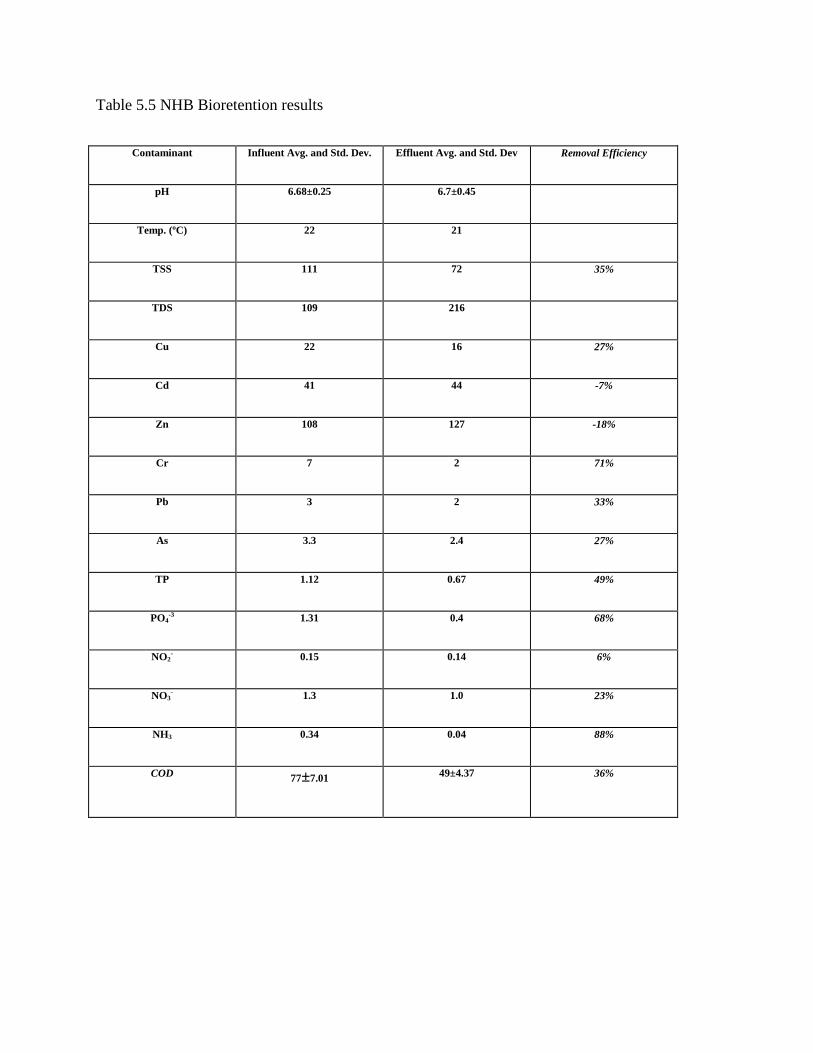
Table 5.5 NHB Bioretention results
Contaminant Influent Avg. and Std. Dev. Effluent Avg. and Std. Dev Removal Efficiency
pH 6.68±0.25 6.7±0.45
Temp. (ºC) 22 21
TSS 111 72 35%
TDS 109 216
Cu 22 16 27%
Cd 41 44 -7%
Zn 108 127 -18%
Cr 7 2 71%
Pb 3 2 33%
As 3.3 2.4 27%
TP 1.12 0.67 49%
PO4-3 1.31 0.4 68%
NO2- 0.15 0.14 6%
NO3- 1.3 1.0 23%
NH3 0.34 0.04 88%
COD 77±7.01
49±4.37 36%

6. CONCLUSIONS AND RECOMMENDATIONS
6.1 Recommendations The data from this study are quite unique. In the graphs that are presented on all of the
devices there are often holes in the graphs. For instance, there were 10 storms sampled, however
for 6 of those storms, site 1, a long swale with seven inlets, did not produce any effluent.
Although we have classified site one as a swale, it has at least four feet of depth between the top
of the soil and the perforated PVC pipe that serves as an underdrain. From the standpoint of
performance in withholding stormwater this is excellent. From the perspective of stormwater
sampling this produces few results. Also, the lack of homogeneity in field sampling gave rise to
high standard deviations in the results.
The three best management practices were compared using the removal efficiencies of
selected significant pollutants present in stormwater. Results from the field study reveal that the
best performing system is the Bioretention as it achieved the highest number of pollutants below
the required standard. The bioretention system however showed poor performance in the
removal of Cadmium and Zinc, achieving -7% and -18% removal respectively. The field results
also show that bioswale can be effective for the removal of heavy metals in the following order:
chromium 80%, copper 64%, Arsenic 21%, zinc 7.4% and cadmium 5%
Based on results from this study, the following research areas are recommended:
To evaluate the performance of the BMPs during different seasons and under different
conditions.
To evaluate the fate and transfer of the different contaminants held within the different
systems.

REFERENCES 1. APHA, AWWA, WEF, 2005, Standard Methods for the Examination of Water and
Wastewater, 21st Edition.
2. Betrand-Krajewski, J., Chebbo, G., Saget, A., 1998. Distribution of pollutant mass vs
volume in stormwater discharges and the first flush phenomenon. Water Research. 32.
3. Federal Highway Administration, 2002. Stormwater Best Management Practices in an Ultra-Urban Setting: Selection and Monitoring May 2002.
4. He, W., Wallinder, I.O., Leygraf, C., 2001. A laboratory study of copper and zinc runoff
during first flush treatment design. Water Research 40.
5. Li, Y.X., Lau, S. -L., Kayhanian, M., Strenstrum, M.K., 2005. Particle size distribution in
highway runoff. J. Environ. Eng. -ASCE 131.
6. Law, N., DiBlasi, K., Ghosh, U., Stack, B., Stewart, S., Belt, K., Pouyat, R., Welty, C.,
2006. Research in Support of an Interim Pollutant Removal Rate for Street Sweeping
and Storm Drain Cleanout Activities. Center for Watershed Protection. Sponsored by the
U.S. Chesapeake Bay Program.
7. Lee, J., and Bang, K., (2000). Characterization of Urban Stormwater Runoff. Water
Research, Vol 34. No. 6, pp 1773-1780
8. Minnesota Pollution Control Agency, 1989. Protecting Water Quality in Urban Areas,
Division of Water Quality, MPCA, MN.
9. Morrison, G., Revitt, D., and Ellis, J. (1995). The Gully Pot as a Biochemical Reactor.
Water Science Technology, Vol. 31, No. 7, pp 229-236.
10. Natural Resources Defense Council (NRDC), 1999. Stormwater strategies: Community
Response to Stormwater Pollution.
11. Nanbakhsh, H., Kazemi-Yazdi, S., and Scholz, M., 2007. Design comparison of
experimental storm water detention systems treating concentrated road runoff. Science of
the Total Environment, Vol 380, pp 220-228.
12. Strecker, E., 1995. Constituents and Methods for Assessing Best Management Practices.
In Proceedings of the Engineering Foundation Conference on Stormwater Related
Monitoring Needs. American Society of Civil Engineering, New York, NY.
13. Trust for Public Land (TPL), 1997. Protecting the Source: Land Conservation and the
Future of America’s Drinking Water.

14. United States Environmental Protection Agency. 1983. Results of the Nationwide Urban
Runoff Program: Volume 1-Final Report.
15. United States Environmental Protection Agency. 1999. Stormwater Technology Fact
Sheet: Water Quality Inlets, EPA, Office of Water, Washington DC.
16. United States Environmental Protection Agency. 1987. A compendium of Superfund
Field Operations Methods, office of Emergency and Remedial Response, Washington,
D.C.
17. United States Environmental Protection Agency (USEPA). 1999. Stormwater O&M Fact
Sheet Catch Basin Cleaning, Office of Water, Washington, D.C.

Bayesian Parameter Estimation of Activated SludgeProcesses In Blue Plains Waste Water Treatment Plant
Basic Information
Title: Bayesian Parameter Estimation of Activated Sludge Processes In Blue Plains WasteWater Treatment Plant
Project Number: 2013DC153BStart Date: 3/1/2013End Date: 2/28/2014
Funding Source: 104BCongressional
District: DC
Research Category: Water QualityFocus Category: Waste Water, Treatment, Models
Descriptors:Principal
Investigators: Arash Massoudieh
Publication
Sharifi,Soroosh, Sudhir Murthy, Imre Taka´cs (2014). Arash Massoudieh Probabilistic ParameterEstimation of Activated Sludge Processes Using Markov Chain Monte Carlo. Water Research50(2014)254-266.
1.
Bayesian Parameter Estimation of Activated Sludge Processes In Blue Plains Waste Water Treatment Plant
Bayesian Parameter Estimation of Activated Sludge Processes In Blue Plains Waste Water Treatment Plant1

Bayesian Parameter Estimation of Activated Sludge
Processes in Blue Plains Waste Water Treatment Plant:
Final Report
Jamal Alikhani, Heather Ann Stewart and Arash Massoudieh
Civil Engineering, The Catholic University of America
Submitted to DC Water Resources Research Institute,
University of the District of Columbia
May, 2014

1. Executive Summary
In this project a Bayesian hierarchical modeling framework have been developed and
used for probabilistic parameter estimation of bio-kinetic and stoichiometric parameters
using real data collected at full-scale nitrification-denitrification (Nit-DeNit) reactors at
the Blue Plains Wastewater Treatment Plant. Bayesian parameter estimation approach is
capable of explicitly considering different sources of uncertainty and providing the Joint
Probability Density Functions (JPDFs) of stoichiometric and kinetic parameters.
Parameter JPDFs can then be used for chance-constrained design and optimization of
the reactor. In the Bayesian approach, the prior information regarding the parameters
obtained from the literature or independent laboratory studies can be incorporated into
the analysis. The method also provides the posterior correlations between the
parameters as well as measures of the overall sensitivity of different constituents with
respect to each of the parameters that can be used to design pilot studies effective in
determining the parameters. The method is demonstrated by applying the simplified
version of a one-step nitrification whole plant model in Sumo (Dynamita, France) to
observed concentration of a number of constituents at different stages of a Nit-DeNit
reactor at the Blue Plains wastewater treatment plant (WWTP) in Washington, DC. The
results indicate that data from full-scale systems can narrow down the ranges of some
parameters substantially while the level of information they provide regarding other
parameters can be small due to either large correlations between parameters or lack of
sensitivity with respect to them under the operational condition of the reactor. The
study also shows strong correlations among some biokietic and stoichiometric
parameters under the operational condition of the reactor.
2. Introduction
Activated Sludge Models (ASMs) are widely used for the design and
optimization of various unit processes in wastewater treatment plants (WWTP). As

mechanistic models, their main goal is to predict the WWTP behavior under different
conditions, and they are employed as tools for design and operation optimization of
activated sludge systems. Optimization of Activated Sludge processes can substantially
reduce the energy use and the amount of BOD and nutrients being discharge into
receiving waters. This issue becomes even more important for plants that treat
combined sewage and therefore experience a high level of fluctuations in both the
volume and composition of wastewater (as in the District of Columbia). Optimizing the
Activated Sludge operations at DC’s Blue Plains WWTP is even more important in face
of the efforts to restore the Chesapeake Bay.
The outcomes of ASM models are directly influenced by various sources of
uncertainty including, which if not identified and accounted for correctly, will result in
un-trustable predictions. The major sources of uncertainty include:
1. Uncertainty in model parameter values that is caused by measurement or
calibration error.
2. Model input data uncertainty, i.e. uncertainties associated with influent and
effluent characterization due to both measurement error and spatial and
temporal heterogeneities in the system.
3. Model structural uncertainty, i.e. no ASM model perfectly represents the
compartments, processes, and interactions of the real system.
4. Uncertainty associated with the numerical methods used within the model
(truncation errors) [1].
The most important challenge for making ASM models applicable is identifying
the values of its many stoichiometric and kinetic parameters. Despite the vast research
efforts in the past, to this date, there exists no globally accepted calibration procedure
for Activated Sludge reaction parameters. Also, in all approaches used so far, the
uncertainty associated with the estimation of model parameters due to errors in influent
and effluent data, model structural and numerical errors have been ignored.

The main goal of this project has been to develop a flexible Bayesian calibration
framework that is capable of including the different sources of uncertainty in Activated
Sludge Systems. The method has been applied to data collected at Blue Plains and this
in hand will result in optimizing the processes of the plant. Consequently, this will
improve the efficiency of the plant, minimize the energy consumption and cost of
operation and reduce the amount of nutrients discharged into Potomac River.
3. Methods
a. Field Data – Full scale operation
This study has used field data gathered between February and June of 2010 from
the nitrification-denitrification (Nit-DeNit) phase of the Blue Plains WWTP, in
Washington, DC. A schematic of this stage is given in Figure 1. These field data can be
divided into three groups: 1) daily flow rates and influent/effluent characteristics, 2)
daily methanol loading rates, and 3) weekly sampling of characteristics within
individual bio-reactors of the Nit-DeNit phase. These measurements include
concentrations of total/volatile suspended solids (TSS/VSS), biodegradeable substrate
(Ss), and nitrogen (NH3, NOx). The flowrate and influent data are shown below in
Figure 2.
Fig. 2. Nitrification-Denitrification stage configuration at Blue Plains WWTP

Fig. 1. Left: Daily flowrate of influent, RAS, WAS and Methanol loading rate. Right: Daily influent
biodegradable substrate (Ss), ammonia (NH-N) and Nitrate (NOx).
b. Bayesian model framework
The Blue Plains Nit-DeNit configuration contains eight continuous stages, two
large and six in smaller compartments. The eight reactor system for modeling in the
Bayesian program framework is shown in Figure 3. Nitrification occurs in stages 1A, 1B,
and 2 which are under aerobic conditions. Stage 3A is not aerated and known as a
denox zone. Methanol is added in stage 3B to aid in denitrification which occurs in
stages 3B, 4 and 5A under anoxic conditions. The last stage is aerated to improve
biomass settling in the clarifier.

Fig. 3. Eight tank configuration in the Ni-DeNit model. The volumes are not to scale and each tank is
considered a completely mixed reactor (CMR).
Transient mass balance equation for each tank can be expressed as ordinary
differential equations (ODEs). Eqs. 1 and 2 show the Activated Sludge model reactions
for a given constituent C (such as BOD concentration) for tank 1 and a general tank k.
( )
( )
(
) ∑ for k = 1 (1)
(
) ∑ for k=2 to 8 (2)
Where is the volume of tank k, and are respectively the outflow rate and
concentration of constituent i in the outflow from tank k, and are the inflow
rate and concentration in the inflow to the first tank and and are the return
activated sludge (RAS) flow rate and concentration in RAS to the first tank. is the
reaction rate of reaction number j at tank k such that nr is the total number of reactions.
is the stoichiometric coefficient of constituent i in reaction j. is the oxygen
mass transfer rate in tank k through bubble aeration with a saturation
concentration
(for those un-aerated tanks considered as zero). is the
methanol loading rate into tank k. The model proposed by [2, 3] has been used to model
the clarifier.
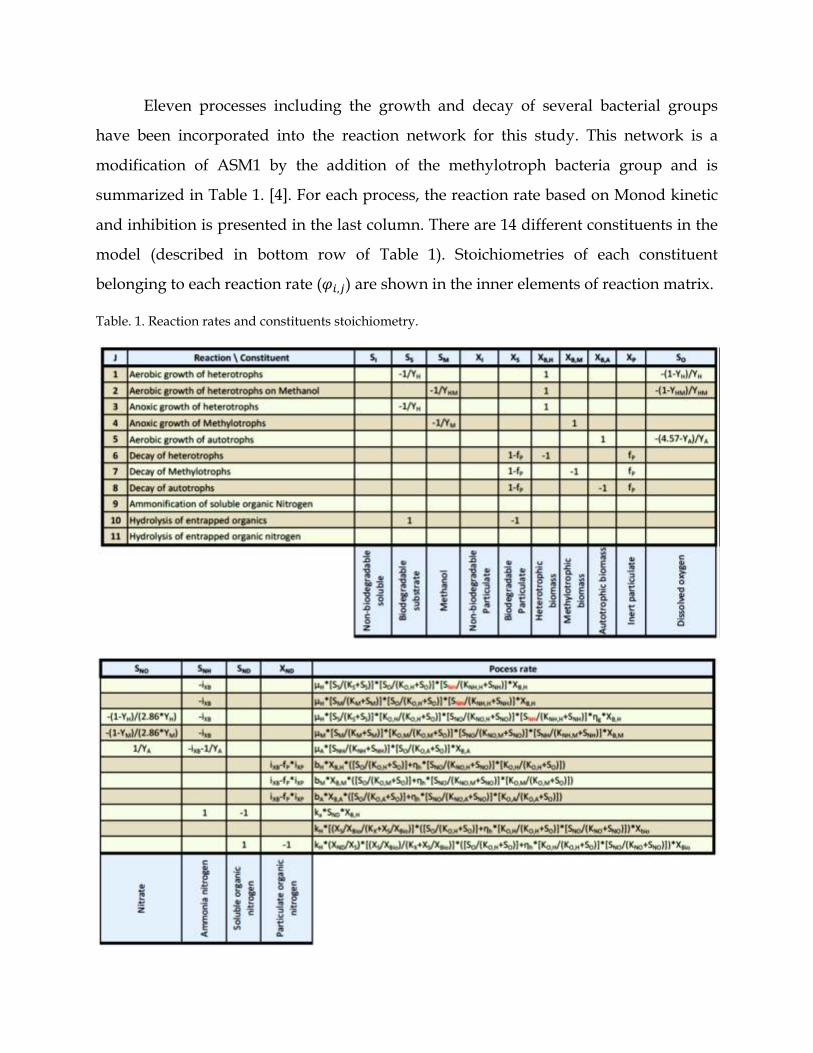
Eleven processes including the growth and decay of several bacterial groups
have been incorporated into the reaction network for this study. This network is a
modification of ASM1 by the addition of the methylotroph bacteria group and is
summarized in Table 1. [4]. For each process, the reaction rate based on Monod kinetic
and inhibition is presented in the last column. There are 14 different constituents in the
model (described in bottom row of Table 1). Stoichiometries of each constituent
belonging to each reaction rate ( ) are shown in the inner elements of reaction matrix.
Table. 1. Reaction rates and constituents stoichiometry.

c. Parameter estimation
In abbreviated form, Eqs. 1 and 2 can be expressed as:
(4)
where, is the constituents’ concentration vector. The length of the vector is equal to
the number of constituents times the number of tanks. is the external forcing input
from influent, RAS, methanol loading rate ( ), and temperature. is the
stoichiometry/reaction parameter vector that is shown in Table 1. Function f in Eq. 4 is
the bio-reactor model structure.
Estimation of the parameters can be performed by comparing between modeled
and observed concentrations. If represents the observed data vector, then the
considered error function between observed and modeled concentration is ( ). If
the external forcing vector is known, then the model output becomes a function of just
the parameters. So, the error function can be re-written as ( ), where is the vector
of unknown parameters. If the error function has a probability distribution and
independent behavior, then the likelihood function of the observed vector can be shown
as function of only unknown parameters:
∏ ∏ ( )
(5)
where is the observed concentration of constituent by type i at time or tank j, is the
total number of observed constituent and is the number of total samples (in time or
location) of observed type i. If the error structure is assumed to be a log-normal
distribution, then the error function becomes:
( )
√ (
( )
) (6)
where is the output modeled concentration of constituent i at time/tank j is
the unknown standard deviation of observed type i, which can be considered as a new

parameter in the parameters vector, such that { }, where k is
the total number of un-known parameters in Eq. 4. Maximizing the likelihood function
by a deterministic optimization approach is a way to find the set of optimum parameter
values which is called the maximum likelihood estimator (MLE) of [4].
The likelihood function of the sample can interpreted as a probability
function of the observed data:
( ) (7)
If we have some additional, prior information about the unknown parameters, we
incorporate that knowledge in the form of a probability distribution for each parameter,
. This Bayesian approach can be expressed as:
( ) ( )
( ) (8)
where ( ) is the joint probability distribution of the error function (which is equal to
the likelihood function in Eq. 7), is the prior distribution, and ( ) is the
posterior distribution for parameters The denominator, ( ), is a normalizing factor.
d. Adaptive time step
The Blue Plains Nit-DeNit daily fluctuations in wastewater influent along with
the complex external forcing make the system of non-linear ODEs in Eq. 4 a stiff system
of equations which needs a very small time interval to solve by an explicit method. An
adaptive backward differentiation method has been implemented where the time
interval varies with stiffness.
For deterministic parameter estimation, the genetic algorithm has been used to
find the MLE. If maximizes , it can also maximize the natural log of . The
fitness function created for the genetic algorithm is:
(∑ ∑ ∑
( )
) (9)

For stochastic parameter estimation, a Metropolis-Hasting (M-H) algorithm which is a
powerful Markov chain method to generate multivariable distributions has been
applied. The algorithm generates a large number of random variables for unknown
parameters and standard deviations based on the posterior distribution:
{ [
( )
( ) ]
(10)
In Eq. 10, are the previous and generated/proposed parameters. and
are the log-normal proposal densities, and is the uniform random
number between 0 and 1.
4. Results
In total, the Bayesian approach was successfully used to estimate twenty-five key
parameters in the Nit-DeNit stage of wastewater treatment. The simulated effluent
using these parameter estimates is in good agreement with the observed effluent
characteristics, thus supporting their credibility. The list of examined parameters is
detailed in Table 2. For all but a few, the resultant joint probability distributions for
these parameters have significantly narrower credible intervals than the value ranges
found in the literature.
For temperature-sensitive parameters, the Arrhenius relationship was applied.
The relationship and relevant factors are given in Table 2. For parameter estimation,
first the Genetic algorithm was applied using a large population and number of
generations to obtain optimum deterministic values. In all, 31 parameters existed in the
proposed modeled, and 25 of them were considered to be estimated. The parameter
symbols, original given range of value and the results for Genetic optimum values are
shown in Table 3. Plots of important constituents (methanol, ammonium,
nitrite/nitrate, soluble COD, and volatile suspended solids) in Nit-Denit derived from
deterministic optimum values are illustrated in Fig. 4.

Fig. 4. Comparison between modeled results in denitrification stages based on Genetic optimum
parameters (solid lines) and observed data (shapes). Red shapes and lines belong to stage 3A, yellow to
stage 3B, blue to stage 4 and green to stage 5A. Different shapes with the same color belong to the same
stage, but were measured from different locations within the tank.

As is expected, methanol has a high concentration in stage 3B (the reactor of
methanol loading) and decreases in stages 4 and 5 (Fig. 4, a). Ammonia concentration is
low in the denitrification stages illustrated as it was consumed in the earlier stages (Fig.
4, b). Nitrate (NOx) has a high concentration directly before methanol loading at stage
3A and promptly decreases (stages 3B to 5A) due to methylotrophic denitrification (Fig.
4, c). Soluble COD encompasses both methanol and soluble biodegradable substrate
(Ss); due to a lack of Ss in the Nit-DeNit phase, sCOD has a same pattern as methanol
(Fig. 4, d). VSS consists of all the particulate constituents. As anticipated, it has no
significant change stage by stage because of slow growth and decay in comparison with
changes in soluble constituents (Fig. 4, e).
For probabilistic parameter estimation, the M-H algorithm was used to generate
100,000 sample parameter sets; the probability of each parameter has been evaluated by
Bayesian inference (Eq. 8). The distribution of parameters is shown in the histograms of
Fig. 5. The summary (95% credible interval, median, and mean) of each histogram is
reported in the last columns of Table 2. This 95% interval range of each parameter
distribution can be used as a new parameter range for the Nit-DeNit system at Blue
Plains. In most cases the ranges resulting from Bayesian parameter estimation are
narrower than the given parameter ranges in the literature for general cases. Finally, the
median and mean values of parameters from their histograms show good agreement
with values genetic parameter estimation, which indicates a good prior distribution for
each parameter. This study has so far shown promising success. One of the next steps
will be to incorporate newly acquired hourly influent data from Blue Plains.

Fig. 5. Posterior distributions of parameters for 100,000 samples generated by Metropolis-Hasting
algorithm.

Fig. 5. (Continued)
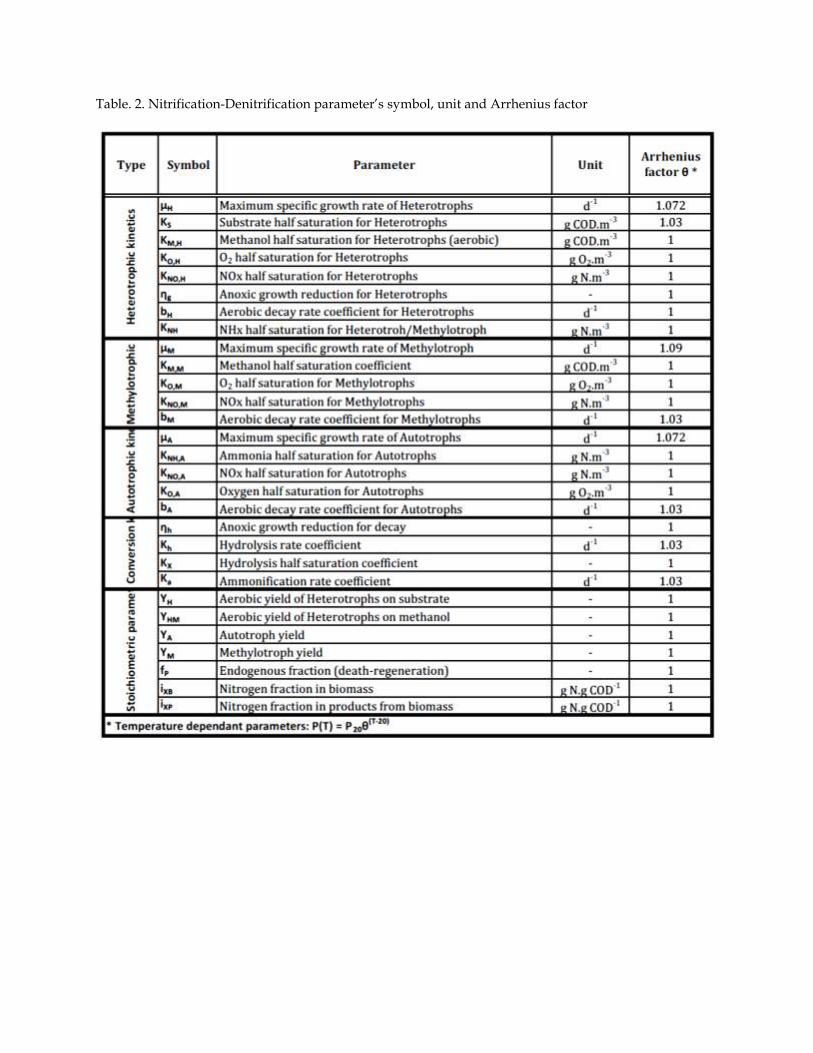
Table. 2. Nitrification-Denitrification parameter’s symbol, unit and Arrhenius factor

Table. 3. Summary of parameter estimation results

5. Conclusions
In this project a Bayesian hierarchical modeling framework have been developed and
used for probabilistic parameter estimation of bio-kinetic and stoichiometric parameters
using real data collected at full-scale nitrification-denitrification (Nit-DeNit) reactors at
the Blue Plains Wastewater Treatment Plant. The data was found to be able to narrow
down the spread of the distribution with respect to the prior distributions for some of
the parameters while for some other parameters the spread of the distributions was not
reduced significantly. The level at which the data is able to reduce the uncertainty about
a parameter depends on the sensitivity of the model outputs with respect that
parameter and the internal correlation between the parameters. The results obtained
from this study can be further used to perform chance-constrained optimization to
minimize the risk of exceeding effluent nitrogen water quality standards and also
minimize the emission of methanol in the effluent.
6. References
Abrishamchi, A., A. Massoudieh, and M. Kayhanian (2010), Probabilistic modeling of
detention basins for highway stormwater runoff pollutant removal efficiency, Urban
Water Journal, 7(6), 357-366.
Giudice, B., A. Massoudieh, and T. Young (2007), Evaluating Management Decisions to
Reduce Environmental Risk of Roadside-Applied Herbicides, Transportation Research
Record, 1991(-1), 27-32.
Massoudieh, A., and T. R. Ginn (2007), Modeling colloid-facilitated transport of multi-
species contaminants in unsaturated porous media, Journal of Contaminant Hydrology,
92(3-4), 162-183.

Massoudieh, A., and T. R. Ginn (2008), Modeling Colloid-Enhanced Contaminant
Transport in Stormwater Infiltration Basin Best Management Practices, Vadose Zone
Journal, 7(4), 1215-1222.
Massoudieh, A., A. Abrishamchi, and M. Kayhanian (2008), Mathematical modeling of
first flush in highway storm runoff using genetic algorithm, Science of The Total
Environment, 398(1-3), 107-121.
Massoudieh, A., S. Sharifi, and D. K. Solomon (2012), Bayesian evaluation of
groundwater age distribution using radioactive tracers and anthropogenic chemicals,
Water Resources Research, 48.
Massoudieh, A., X. J. Huang, T. M. Young, and M. A. Marino (2005), Modeling fate and
transport of roadside-applied herbicides, Journal of Environmental Engineering-
Asce, 131(7), 1057-1067.
Montgomery, D.C. and G.C. Runger, Applied statistics and probability for engineers, ed. 4th.
2007: John Wiley & Sons.
Morgan, M. G., and M. Henrion (1992), Uncertainty A Guide to Dealing with Uncertainty
in Quantitative Risk and Policy Analysis, Cambridge University Press, Cambridge, UK.
Sharifi, S., A. Massoudieh, and M. Kayhanian (2011), A Stochastic Stormwater Quality
Volume-Sizing Method with First Flush Emphasis, Water Environment Research,
83(11), 2025-2035.
Takacs, I. (2008), Experiments in activated sludge modelling, 267 pp, Ghent University.
Takacs, I., G. G. Patry, and D. Nolasco (1991), A DYNAMIC-MODEL OF THE
CLARIFICATION THICKENING PROCESS, Water Res., 25(10), 1263-1271.

Continuous Monitoring of Urea Concentrations and HarmfulAlgal Productivity and Physiology
Basic Information
Title: Continuous Monitoring of Urea Concentrations and Harmful Algal Productivity andPhysiology
Project Number: 2013DC154BStart Date: 3/1/2013End Date: 2/28/2014
Funding Source: 104BCongressional
District: DC
Research Category: Water QualityFocus Category: Education, Water Quality, Surface Water
Descriptors: NonePrincipal
Investigators: Caroline Solomon
Publications
There are no publications.
Continuous Monitoring of Urea Concentrations and Harmful Algal Productivity and Physiology
Continuous Monitoring of Urea Concentrations and Harmful Algal Productivity and Physiology 1

1
Continuous Monitoring of Urea Concentrations and
Harmful Algal Productivity and Physiology in the Anacostia
River: Final Report
Caroline Solomon, Ph.D.
Professor, Department of Sciences, Technology and
Mathematics, Gallaudet University
May, 2014

2
1. Executive Summary
Water quality monitoring in the Anacostia River is plagued by inconsistent and uncoordinated efforts by different municipalities throughout its watershed, but efforts have increased due to mandates from the EPA’s Chesapeake Bay TMDL program. Over the years, there have been studies that collect basic and important water quality parameters (e.g. temperature, salinity, dissolved oxygen, bacteria and phytoplankton composition) that help determine the health of the Anacostia River. However, one large component that is lacking from these monitoring studies or programs is assessing the concentration and impact of organic nitrogen, especially urea, that could compose more than 50% of the total nitrogen that comes from the 17 combined sewage outfalls along the DC portion of the Anacostia River. This project involved collected samples at 10 sites for nutrient concentrations, bacteria and phytoplankton composition, nitrogen uptake and assimilation enzyme rates to better understand the impact of organic N in the Anacostia River. Urea concentrations were lower than predicted but the high ammonium (NH4
+) concentrations suggest that urea may be breaking down rapidly to NH4
+ via urease activity or new sources of NH4+ are entering the Anacostia River. The
measurement of natural abundance of 15N-NH4+ revealed that there might be multiple
sources of NH4+ that needs to be further investigated. Precipitation was high during
June 2013 that led to higher concentrations of NH4+ and total dissolved phosphorus
(TDP) that resulted in two observed non-harmful phytoplankton blooms on the Anacostia River. The six-fold concentrations of NH4
+ observed than historical levels is troubling because of potential toxicity to fish and other invertebrates.
2. Introduction
Of the two rivers that flow through the District of Columbia, the Anacostia River is often called the “forgotten river” as it was neglected for many decades while the neighboring Potomac River has received more attention and is monitored more closely (Wennersten, 2008). The Anacostia River recently received an overall score of C- on its report card based on several water quality parameters (Anacostia Watershed Society, 2011). However, it was difficult to create this report card because there is not an uniform and coordinated effort that monitors all of the biological, chemical and physical parameters throughout the Anacostia watershed.

3
The Anacostia River watershed includes three major jurisdictions: Montgomery County (MD), Prince George’s County (MD) and the District of Columbia. Water quality monitoring of the Anacostia River is very fragmented with various jurisdictions having different type of consistent monitoring programs despite past efforts to coordinate all the efforts (e.g. Metropolitan Council of Governments). For instance, Montgomery County has monitored the northwest branch for fish and macro- invertebrates since 1990 (Anacostia Watershed Restoration Partnership, 2012). Their water quality monitoring program has been discontinued, so there is no current data on nutrient loading for this region. The DC Department of the Environment (DC DOE) has an Anacostia and Potomac River monitoring program where they measure temperature, dissolved oxygen, pH, depth, chlorophyll and turbidity (DC Department of the Environment, 2012) but data is only available beginning in May 2008 and is often not calibrated. Additionally, DC DOE only samples once a month, and recent data available through the Chesapeake Bay Program is only for one site (ANA0082), which is near Anacostia River Bridge on Bladensburg Road. Prince George’s County does not have any consistent or coherent monitoring programs with the most recent data from May 2010-June 2011 (U.S Environmental Protection Agency, 2011). However, there have been some recent efforts to increase water quality monitoring and to combine it with some modeling and simulations by DCWRRI (e.g. Deksissa and Behera, 2008)
Figure 1: The 17 combined sewage outfall sites along the DC portion of the Anacostia River (DC Water and Sewage Authority, 2012)
Location Urea
concentration
(M-N)
Reference
Chesapeake Bay, mainstem
<0.01-8.16 Lomas et al. 2002; Solomon 2006
Kings Creek, Chesapeake Bay Maryland
0.3-24.2 Glibert et al. 2005
Florida Bay, Florida
0.36-1.7 Glibert et al 2004
Great South Bay, New York
<0.12-1.24 Clark et al. 2006
Neuse River Estuary, North Carolina
<0.14-43 Twomey et al. 2005
Table 1: Urea concentrations in select coastal
waters in the United States

4
Water quality monitoring typically measures only dissolved inorganic nutrients – both nitrogen (DIN; NO3
-, NH4+ and NO2
-) and phosphorus (DIP) – based on the premise that bacteria and phytoplankton primarily uses these sources (Mulholland and Lomas, 2008) and largely ignores the organic forms of both nutrients. Dissolved organic nitrogen (DON) can make up from 14-90% of total N in rivers (Seitzinger and Sanders 1997; Wiegner et al. 2006) and some is liable and bioavailable to bacteria and phytoplankton contrary to previous beliefs that DON is completely refractory (Berman and Bronk, 2003). Recent work has shown that uptake rates of DON are similar to DIN and is a significant source of N to phytoplankton and bacteria (Bronk 2002, Berman and Bronk, 2003, Bronk et al. 2007). A large possible source of DON to the Anacostia River is sewage overflows and treated effluent. The Anacostia has many combined sewage outfalls (CSO) that occur at 17 sites in DC (Fig. 1; Natural Resources Defense Council, 2012; DC Water and Sewer Authority, 2012). The combined sewage system consists of one pipe for both sanitary waste and storm water run off. During dry weather, most of the water is treated, but during wet weather the excess flow goes straight into the Anacostia River. Nutrient concentrations in the river can increase after such wet events. For instance, the three weeks after Tropical Storm Sandy hit the Eastern seaboard, NH4
+ concentrations increased from
4.72 to 17.2 M-N, which suggests that what were originally high levels of DON may have decomposed into NH4
+ (Solomon et al., unpublished). Even when the sewage is treated, it is mostly dissolved inorganic nitrogen (DIN) such as NO3
-, NH4+ and NO2
- that is removed, leaving mostly DON in concentrations of > 1 mM-N (Urgun-Demirtas et al. 2008; Sattayatewa et al. 2010, Bronk et al. 2010). One component of the dynamic and liable DON pool that may be present in high concentrations due to CSO is urea. Urea is a part of the DON pool in many aquatic systems (Antia et al. 1991, Berman and Bronk 2003, Glibert et al. 2006, Bronk et al. 2007) and concentrations in coastal
waters can vary from undetectable to >40 M-N (Lomas et al. 2002, Glibert et al. 2005, Twomey et al. 2005, Clark et al. 2006, Glibert et al. 2006; Table 1). Urea typically represents only ~5% on
Figure 2: Comparison of urease activity rates between different phytoplankton species on per cell or per cell volume basis. Prochlorococcus marinus on a per cell volume basis (*) was divided by 10 to allow for visualization of other species (Solomon 2006)

5
average of the DON pool, but can be more than 40% of DON in rivers draining agricultural watersheds (Glibert et al. 2005, Glibert et al. 2006), and could potentially be high near CSOs after storm events. High levels of urea can be troubling because there are several harmful algal species (HABs) that can either use urea to support a large fraction of their N demand, have higher urease activity or grow better on urea compared to DIN sources (Solomon 2006, Solomon et al. 2010). Both dinoflagellates and cyanobacteria are emerging as taxonomic groups of phytoplankton that thrive on urea when it is present in the ecosystem. Urea may have been a culprit in a recent bloom of the dinoflagellate, Gymnodinium, that occurred in the Anacostia River during summer 2011 (Metropolitan Washington Council of Governments, 2011). The rates of urea uptake and urease activity tend to be higher in dinoflagellates and cyanobacteria than other phytoplankton taxonomic groups. The maximum urea uptake rates (Vmax) for the red algal lineage including harmful pelagophytes such as Aureococcus anophagefferens that often blooms in Great South Bay and Peconic Bay, New York (Lomas et al. 1996, Mulholland et al. 2002), and harmful dinoflagellates such as Alexandrium catenalla in Thau Lagoon in Southern France (Collos et al. 2004) is often higher than for the green lineage (Solomon et al. 2010). Higher rates of urea uptake and urease activity have also been measured where cyanobacteria dominate the phytoplankton community, such as in Florida Bay, the southwestern Florida Shelf and Chesapeake Bay (Glibert et al. 2004, Heil et al. 2007, Solomon et al. 2010). It was found that among several species of phytoplankton surveyed, including a diatom, three dinoflagellates, a cryptophyte, and a haptophyte, dinoflagellates and cyanobacteria were found to have the highest rates of activity of urease either on per cell or cell volume basis (Fig. 2; Solomon 2006, Glibert et al. 2008). Higher urea availability and utilization may lead to higher toxin production by various harmful algal species. For instance, the toxin, microcystin, from the freshwater cyanobacteria Microcystis aeruginosa (which has appeared in the Potomac River in the past; Krogmann et al. 1986), are N-containing molecules and are synthesized by biochemical pathways that involve polyketide and nonribosomal peptide synthases (Dittman and Borner 2005) thus would be expected to increase with N enrichment. There are many other algal toxins that include saxitoxin and domoic acid that are also N-containing molecules that come from an array of dinoflagellates and diatoms (van Dolah, 2000). The bloom of the dinoflagellate, Gymnodinium, that occurred in the Anacostia River during summer 2011 (Metropolitan Washington Council of Governments, 2011) could have released substantial amounts of saxitoxins. The aim of this study was to monitor urea concentrations and any appearance of harmful algal blooms (HABs) that may have an impact on the ecosystem heath of the Anacostia River. Measurements of physical factors (e.g. temperature, precipitation, dissolved oxygen), inorganic nutrients (e.g. NO3
-, NH4+, TDP), nitrogen utilization rates
(e.g. NH4+, urea uptake, and urease activity) were also taken to better understand urea
and HAB dynamics in the Anacostia River.

6
3. Methodologies
Water samples were collected bi-weekly starting in March 2013 until November 2013. Sampling began again in March 2014 and is currently on-going. Dr. Solomon and/or students collected samples from designated sites on the Anacostia River (Fig. 3) in partnership with the Anacostia Riverkeeper (AK). The Anacostia Watershed Society (AWS) and the DC Department of Environment (DC DOE) also monitor these sites, allowing for comparison with current and historical data. Additional sites were added to monitor certain locations such as near RFK where they are building storage tanks to hold the overflow (site 6A; began on 8/21/13) and Pennsylvania Avenue Bridge near a CSO (site 7B; began on 5/29/13). The original site 7 is noted as 7A in the data, while site 6 remains recorded as the original site 6.
Figure 3: Sampling sites on the Anacostia River (as shown by the blue dots) Samples were analyzed for (1) concentrations of nutrients such as NO3
-, NH4+, urea and
total dissolved phosphorus (TDP) (2) chlorophyll a (3) nitrogen uptake and enzymatic activity and (4) phytoplankton and bacterial composition. Due to a collaboration with the University of Maryland that began during summer 2013, natural 15N-NH4
+ samples were also collected and analyzed.
(1) Nutrients: NO3- were analyzed according to the resorcinol method (Zhang et al.
2006), NH4+ by the method of Parsons et al. (1984), urea by the method developed
by Revilla et al. (2005), and total dissolved phosphorus (TDP) by APHA (1998) using an automatic Shimadzu UV-1800 spectrophotometer at Gallaudet.

7
(2) Chlorophyll a: Chlorophyll a was measured using a modified protocol of Parsons et al. (1984) on a Turner 10-AU flourometer at Gallaudet. (3) Uptake and enzymatic activity: Nitrogen (NH4
+ and urea) uptake rates were analyzed according to Glibert and Capone (1993). Enzymatic activity such urease (Solomon et al. 2007) was also measured to better understand how rapidly phytoplankton utilizes urea. (4) Phytoplankton and bacterial composition: Samples for phytoplankton and bacteria enumeration was collected and preserved with 4% glutaraldehyde, stored at 4°C until stained with DAPI (4’-6-Diamidino-2-phenylindole) and counted on an epiflourescent microscope at Gallaudet. Some samples were also preserved in Lugol’s solution for better resolution for further DNA identification or microscopy. (5) Natural abundance of 15N-NH4
+. Samples for natural abundance of 15N-NH4+
in the particulate and dissolved fraction were collected and prepared by the method of Glibert et al. (unpublished) and analyzed via mass spectrometry to better understand the origins and sources of NH4
+ to the Anacostia River.
4. Results and Discussion a. Physical data:
The year 2013 was a wet year with high total precipitation in June and July, and later again in October and December (Figs. 4A & B). Many sampling dates were preceded by one or more rainy days. Average temperatures ranged from 6.97 to 29.3°C (Fig. 5), while dissolved oxygen was the lowest in June and July and highest in March and early April (Fig. 6).
Figure 4A: Monthly precipitation during 2013 (data from the National Weather Service).
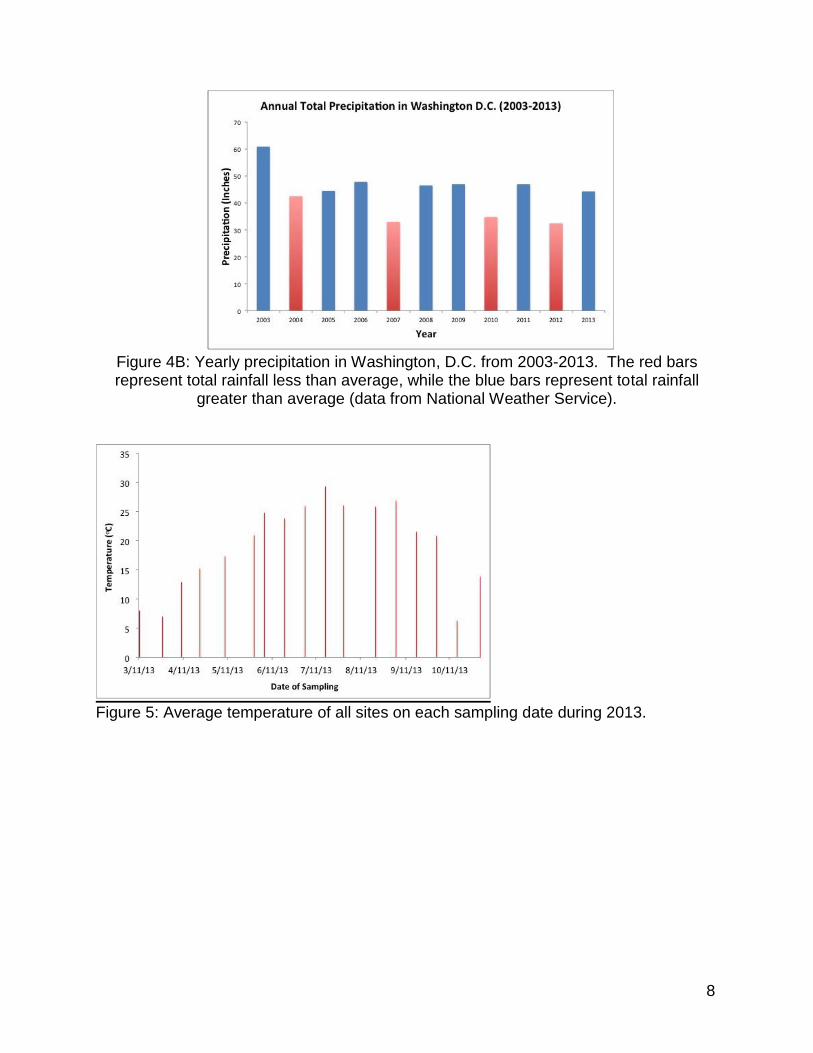
8
Figure 4B: Yearly precipitation in Washington, D.C. from 2003-2013. The red bars represent total rainfall less than average, while the blue bars represent total rainfall
greater than average (data from National Weather Service).
Figure 5: Average temperature of all sites on each sampling date during 2013.

9
Figure 6: Dissolved oxygen concentrations at each site for each sampling date with the
exception of 11/1/13 during 2013.
b. Biological data:
Most of the biological activity occurred during the late summer months into the early fall months in the Anacostia River. Chlorophyll a (chl a) concentrations increased in late June and remained high until mid-October (Fig. 7). The chl a concentrations during this period were within range of historical chl a concentrations recorded from 2002-2006.
For instance, average chl a concentrations were 12.2 g L-1 during 2002-2006 with the
highest recorded chl a concentration of 61.8 g L-1 in August 2002 (Chesapeake Bay
Program, 2014), while chl a concentrations on average for 2013 was 32.5 g L-1 with
the highest average chl a concentration of 62 g L-1 during August 2013. A closer resolution to the summer months reveals two dates when chlorophyll levels were higher relative to other times and those were bloom conditions (Fig. 8). Further investigation via microscopy and consultation with a phytoplankton taxonomist, Steve Morton, from NOAA revealed that the bloom on June 13 was of the cryptophyte, Cryptomonas ovata while the bloom on July 17 was of the dinoflagellate, Scrippsiella spp (Fig.9).

10
Figure 7: Chlorophyll concentrations in the Anacostia River during 2013.
Figure 8: Chlorophyll concentrations during the spring and summer months in
Anacostia River during 2013.

11
Figure 9: Epiflourescent and bloom pictures of phytoplankton species present on two dates: June 13 and July 17, 2013.
c. Nutrient concentrations (NH4
+, urea, TDP) Nitrogen concentrations, especially for NH4
+, were high during the Cryptomonas ovata bloom. Comparisons with historical NH4
+ data from 2002-2006 that was available via the Chesapeake Bay Program (2014) revealed that the highest concentration was 13
M-N during July 2003. The NH4+ concentrations observed during May-July 2013 were
six-fold of historical concentrations (Fig. 10) For the first time according to our knowledge, urea concentrations were measured for the Anacostia. Urea concentrations
were never higher than 10 M-N (Fig. 11) and decreased starting on July 17 and remained low the rest of the year. These concentrations are similar to what has been observed in the Chesapeake Bay mainstem (Table 1). Analysis of NO3
- is currently on-going. TDP concentrations were higher during the early months of the year then again in late summer (Fig. 12). TDP concentrations were higher during the Scrippsiella spp. Bloom than during the Cryptomonas ovata bloom, which suggests that these two species required different nutrient conditions. The TDP concentrations from the last two sampling dates of 2013 have not yet been analyzed.

12
Figure 10: NH4
+ concentrations in the Anacostia River during 2013.
Figure 11: Urea concentrations in the Anacostia River during 2013

13
Figure 12: Total dissolved phosphorus (TDP) concentrations in the Anacostia River
during 2013. d. Biochemical rates (NH4
+ uptake and urease activity)
NH4
+ uptake was only measured on selected dates after NH4+ concentrations were the
highest. NH4+ uptake rates were similar on three sampling dates, and increased from
site 1 to site 9 (Fig. 13). Urea uptake has yet to be analyzed. Urease activity rates that have been analyzed to date revealed that the highest activity occurred in late May. Urease activity rates tend to be the highest during the summer months (Solomon, 2006), so rates are expected to continue to be high during the rest of the summer.
Figure 13: NH4
+ uptake rates in the Anacostia River during selected dates.
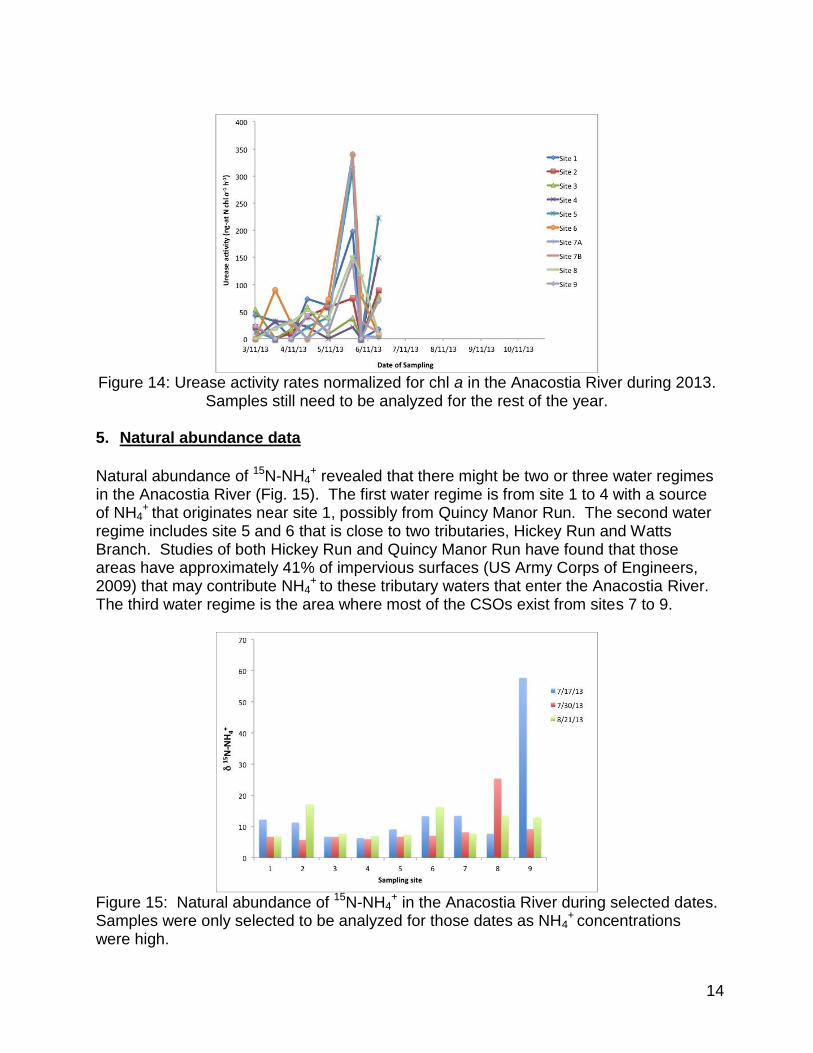
14
Figure 14: Urease activity rates normalized for chl a in the Anacostia River during 2013.
Samples still need to be analyzed for the rest of the year. 5. Natural abundance data
Natural abundance of 15N-NH4
+ revealed that there might be two or three water regimes in the Anacostia River (Fig. 15). The first water regime is from site 1 to 4 with a source of NH4
+ that originates near site 1, possibly from Quincy Manor Run. The second water regime includes site 5 and 6 that is close to two tributaries, Hickey Run and Watts Branch. Studies of both Hickey Run and Quincy Manor Run have found that those areas have approximately 41% of impervious surfaces (US Army Corps of Engineers, 2009) that may contribute NH4
+ to these tributary waters that enter the Anacostia River. The third water regime is the area where most of the CSOs exist from sites 7 to 9.
Figure 15: Natural abundance of 15N-NH4
+ in the Anacostia River during selected dates.
Samples were only selected to be analyzed for those dates as NH4+ concentrations
were high.

15
6. Project outcomes and presentations
a. Collaborations This project resulted in a successful collaboration with the Anacostia Riverkeeper (AK). We often observed situations that resulted in contacting the proper authorities. On one occasion, AK reported workers cleaning one of the bridges and found out that they were working without the correct permits. AK also contacted DC DOE after we observed the Scrippsiella spp.bloom. DC DOE went out to look at the bloom the next day and was in touch with us regarding whether it was a health hazard and whether an advisory needed to be issued. This project also allowed Dr. Solomon and personnel in her laboratory to interact and network with other people who are working on the Anacostia River including Anacostia Watershed Society, AK, WaterCat consulting and researchers at University of DC and University of Maryland. Through DCWWRI, both Dr. Solomon and her colleague, Dr. Daniel Lundberg, learned about two workshops or symposiums that focused on DC water issues and were able to attend.
b. Presentations Summer 2013 interns, Kody Schouten and Anna McCall ’15, presented their results to the campus community including several Anacostia River stakeholders (e.g. Anacostia Riverkeeper, WaterCat Consulting) at the end of the summer as part of their internship. They also presented at ASLO (see next section). Giovanna Vasquez ‘16 and lab technician, Muhammad Rubaiyat, prepared materials to educate the Gallaudet community about the Anacostia River research during Earth Day 2014. c. Weaving the project into the curriculum Data from the study was used in courses taught by Dr. Solomon to spread awareness among students and the campus community during the Spring 2013, Fall 2013, and Spring 2014 semesters. During the spring semesters, Dr. Solomon co-taught a course on socio-environmental synthesis that utilized the Anacostia River as a case study. Students from these courses visited the Blue Plains Treatment Plant and the Anacostia River to better understand the socio-environmental system. Many students later signed up for clean-up days through the Anacostia Watershed Society and AK as part of their sorority or fraternity community service efforts. Other efforts included sharing research results with the Gallaudet University Sustainability Council, and one graduating senior decided to do a grant proposal on studying how much litter enters the Anacostia River as part of her capstone project.

16
d. Additional funding Data from the study allowed us to apply for further funding from Maryland Sea Grant and receive funding from an anonymous donor to continue our work on the Anacostia River.
7. Student support
Over the course of one year, six deaf and hard-of-hearing undergraduate and one graduate student were involved with the project. Brandon McMillian ’13 and Justin Christian ‘14 were involved in getting the project started during the Spring 2013 semester. Brandon was involved with the sampling as well as measuring TDP. Justin joined on one sampling trip and helped with sample preparation. Two interns, Kody Schouten (Tarleton State University, TX) and Anna McCall (Gallaudet ’15) were involved with the project during Summer 2013. They were involved with all sampling trips and all the nutrient analyses. Both students won scholarships to attend and present their poster at the Association for the Sciences of Limnology and Oceanography (ASLO) conference in Honolulu, Hawaii in February, 2014. They had the opportunity to be part of the ASLOMP program that matched them with a mentor during the meeting. Giovanna Vasquez ’16 and Sheena O’Donnell ’14 worked on the project during Fall 2013 and Spring 2014 semesters. The experience helped Giovanna land an internship interview with MarineLab in Key Largo, Florida for Summer 2014. Learning how to do nutrient analyses benefitted Sheena as she progressed through her senior honors capstone project on designing a sustainable turtle aquarium. Melanie Jackson, a PhD student at University of Maryland, became involved with the study starting in March 2014. She will be looking at the natural abundance of 15N-NH4
+ to investigate potential sources of NH4
+ to the Anacostia River as part of her dissertation research.
8. Conclusion
The aim of this project was to investigate the role of organic nitrogen, especially urea, and its potential relationship with harmful algal blooms in the Anacostia River. It was predicted that urea would be higher closer to the CSOs on the lower part of the Anacostia River (sites 6-9) which may lead to occasional harmful algal blooms, but that did not occur. Both NH4
+ and urea concentrations were highest upriver between sites 3-6 which is located along marshland, National Arboretum and Langston golf course while the two blooms were observed between sites 1-4. The two phytoplankton blooms observed during the summer included a dinoflagellate and a crytophyte. These two blooms occurred under different nutrient conditions. The Cryptomonas ovata bloom that occurred on June 19, in the middle of the rainiest month of 2013, happened when there was high NH4
+ but low TDP concentrations. Urea

17
concentrations ranged from 3.5-5.9 M-N, and urease activity was higher than the previous sampling dates (with the exception of late May) suggesting that urea may have been utilized in addition to NH4
+. However, crytophytes have a lower urea activity per cell than dinoflagellates (Solomon 2006), so it may have utilized NH4
+ more than urea. NH4
+ and urea uptake rates need to be analyzed for this date to test this prediction and better nitrogen physiology of this bloom. The Scrippsiella bloom that occurred on July 17 differed than the Cryptomonas ovata bloom because by this time NH4
+ concentrations had decreased, and TDP concentrations increased. The NH4
+ uptake rates on this date showed similar rates on later dates, suggesting NH4
+ was utilized by the dinoflagellate resulting in lower concentrations than earlier in the summer. Urea and urease activity rates have not yet been analyzed for this date, but previous information about urea uptake and urease activity by dinoflagellates suggests that it will be high during this bloom (Solomon, 2006; Solomon et al. 2010). However, there is not much known about the urea physiology of Scrippsiella compared to other dinoflagellates. If this is a common dinoflagellate in the Anacostia River that could be improperly identified as a harmful phytoplankton, further taxonomic and physiological studies are warranted. The six-fold concentrations of NH4
+ observed than historical levels needs to be further investigated. The PhD student will continue to investigate different sources of NH4
+ by measuring natural abundance of 15N-NH4
+. We obtained additional funding to continue monitoring the Anacostia River for another year and to continue to analyze samples from 2013 to further investigate the role of NH4
+ and urea in relation to potential harmful algal blooms.
9. Acknowledgements
Our work on the Anacostia River was supported by grants from the DC Water Resources Research Institute and Maryland Sea Grant. We also want to thank an anonymous donor who also supported our project. Our collaboration with the Anacostia Riverkeeper allowed us to go out bi-weekly on their boat. They donated their staff time so that one staff person could accompany us and drive the boat. Last but not least, we want to thank Dr. Daniel Lundberg for his assistance with analyzing TP and TDP concentrations, sampling the River and working with students.
10. References
Anacostia Watershed Restoration Partnership (2012). Northwest Branch. Accessed at: http://www.anacostia.net/Subwatershed/Northwest_Branch.html Anacostia Watershed Society (2011). State of the Anacostia River. Accessed at: http://www.anacostiaws.org/userfiles/file/AWS_sotr2011_web.pdf Antia NJ, Harrison PJ, Oliveria, L (1991) The role of dissolved organic nitrogen in phytoplankton nutrition, cell biology, and ecology. Phycologia 1:1-89.

18
APHA 1998. Standard Methods for the Examination of Water and Waste Water, 20th Edition. American Public Health Association, Washington DC. Berman, T, Bronk, DA (2003) Dissolved organic nitrogen: a dynamic participant in aquatic ecosystems. Aquat Microb Ecol 31: 279-305. Bronk DA (2002) Dynamics of DON. In: Hansell DA, Carlson, CA (eds) Biogeochemistry of Marine Dissolved Organic Matter. Academic Press, San Diego, pp. 153-249. Bronk DA, Roberts QN, Sanderson MP, Canuel, EA, Hatcher PG, Mesfioui R, Filippino KC, Mulholland MR, and Love NG (2010). Effluent Organic Nitrogen (EON): Bioavailability and Photochemical and Salinity-Mediated Release. Environ. Sci. Technol. 44: 5830-5835. Bronk DA, See JH, Bradley P, Killberg L (2007) DON as a source of bioavailable nitrogen for phytoplankton. Biogeosciences 4:283-296. Chesapeake Bay Program (2014). Chesapeake Bay Program Water Quality Monitoring Data. Accessed at: http://www.chesapeakebay.net/data/downloads/cbp_water_quality_database_1984_present Clark LB, Gobler CJ, Sanudo-Wilhelmy SA (2006) Spatial and temporal dynamics of dissolved trace metals, organic carbon, mineral nutrients, and phytoplankton in a coastal lagoon: Great South Bay, New York. Estuaries and Coasts 29:841-854. Collos Y, Gagne C, Laabir M, Vaquer A, Cecchi P, Souchu P (2004) Nitrogenous nutrition of Alexandrium catenalla (Dinophycae) cultures and in Thau Lagoon, Southern France. J Phycol 40:96-103. DC Department of the Environment (2012) Anacostia River Initiatives. Accessed at: http://green.dc.gov/service/anacostia-river-initiativeshttp://green.dc.gov/service/anacostia-river-initiatives DC Water and Sewer Authority (2012) Combined Sewer. Accessed at: http://www.dcwater.com/about/cip/cso.cfm Dekissa T, Behera P (2008) Modeling urban wastewater system: model building and implementation. Mid-Atlantic Regional Water Resources Research Institute Conference. Shepherdstown, West Virginia. Dittmann E, Borner T (2005) Genetic contributions to the risk assessment of microcystin in the environment. Toxicology and Applied Pharmacology 203:192-200.

19
Glibert, P., Azanza, R, Burford, M, Furuya K, Abal, E, Al-Azri, A., Al-Yamani, F., Andersen, P, Anderson, DM, Beardall, J. Berg GM, Brand, L, Bronk, D, Brookes, J, Burkholder JM, Cembella, A, Cochlan, WP, Collier JL, Collos, Y, Diaz R, Doblin, M, Drennen, T, Dyhrman, S., Yasuwo, F, Furnas, M., Galloway, J, Graneili, E, Ha, DV, Hallegraff, G, Harrison, J, Harrison, P, Heil, CA, Heimann, K, Howarth, R, Jauzein, C, Kana, AA, Kana TM, Kim, H, Kudela, R, Legrand, C, Mallin, M, Mulholland, M, Murray, S, O’Neil, J, Pitcher, G, Qi, Y, Rabalais, N, Raine, R, Seitzinger, S, Salomon, PS, Solomon, CM, Stoecker, DK, Usup, G, Wilson, J, Yin, K, Zhou, M, Zhu, M. (2008) Ocean urea fertilization for carbon credits poses high ecological risks. Marine Pollution Bulletin 56:1049-1056. Glibert, PM, Capone DG (1993). Mineralization and assimilation in aquatic, sediment and wetland systems, p. 243-272. In R. Knowles and T.H. Blackburn [eds.], Nitrogen isotope techniques. Academic Press. Glibert, PM, Harrison, J, Heil CA, Seitzinger S (2006) Escalating worldwide use of urea – a global change contributing to coastal eutrophication. Biogeochemistry 77: 441-463. Glibert PM, Heil CA, Hollander D, Revilla M, Hoare A, Alexander J, Murasko S (2004) Evidence for dissolved organic nitrogen and phosphorus uptake during a cyanobacterial bloom in Florida Bay. Mar Ecol Prog Ser 280: 73-83. Glibert PM, Trice TM, Michael B, Lane L (2005) Urea in the tributaries of the Chesapeake and Coastal Bays of Maryland. Water, Air, and Soil Pollution. 160: 229-243. Heil CA, Revilla M, Glibert PM, Murasko S (2007) Nutrient quality drives differential phytoplankton community composition on the southwest Florida shelf. Limnol and Oceanogr 52:1067-1078. Krogmann DW, Butalla R, Sprinkle J (1986) Blooms of cyanobacteria on the Potomac River. Plant Physiology 80:667-671. Lomas, MW, Glibert, P, Berg, GM, Burford, M. (1996). Characterization of nitrogen uptake by Aureococcus anophagefferens as a function of incubation duration, substrate concentration, irradiance and temperature. J. Phycol., 32:907-916. Lomas MW, Trice TM, Glibert PM, Bronk DA, McCarthy JJ (2002) Temporal and spatial dynamics of urea uptake and regeneration rates and concentrations in Chesapeake Bay. Estuaries 25:469-482. Metropolian Washington Council of Governments (2011). Black Substance in Anacostia River Found to be Rare Algal Bloom. Press Release; September 9, 2011. Accessed at: http://www.mwcog.org/environment/water/waterquality/downloads/Rare%20Algae%20in%20Anacostia.pdf

20
Mulholland MR, Gobler CJ, Lee C (2002) Peptide hydrolysis, amino acid oxidation, and nitrogen uptake in communities seasonally dominated by Aureococcus anophagefferens. Limnol Oceanogr 47:1094–1108. Mulholland MR, Lomas MW (2008). Nitrogen Uptake and Assimilation. In: Capone DG, Bronk DA, Mullholland M, Carpenter EJ (eds) Nitrogen in the Marine Environment. Elsevier. Natural Resources Defense Council (2002). Cleaning up the Anacostia River. Accessed at: http://www.nrdc.org/water/pollution/fanacost.asp. National Weather Service (2014). NOAA National Weather Service Forecast Office: Baltimore/Washington. Accessed at: http://www.nws.noaa.gov/climate/xmacis.php?wfo=lwx Parsons, RT, Maita Y, Lalli, CM (1984). A manual of chemical and biological methods for seawater analysis. Pergamon Press, New York, NY. Revilla, M, Alexander, J, Glibert PM (2005). Analysis of urea in coastal waters: comparison of the enzymatic and direct method. Limnol. Oceangr. Methods 3: 290-299. Sattayatewa C, Pagilla K, Sharp R, Pitt P. (2010) Fate of organic nitrogen in four biological nutrient removal wastewater treatment plants. Water Environ Res. 12: 2306-2315. Seitzinger SP, Sanders RW (1997). Contribution of dissolved organic nitrogen from rivers to estuarine eutrophication. Mar Ecol Prog Ser 159:1-12. Solomon CM (2006) Regulation of estuarine phytoplankton and bacterial urea uptake and urease activity by environmental factors. PhD Dissertation, University of Maryland, College Park.
Solomon, C.M., Collier J.L., Berg G.M. and P.M. Glibert (2010) Role of urea in microbial metabolism in aquatic ecosystems: a biochemical and molecular review. Aquat Microb Ecol. 59: 67-88. Solomon, C.M., Glibert P.M., and J.A. Alexander (2007). Measurement of urease activity in natural samples. Limnol Oceangr Methods 5: 280-288.
Twomey LJ, Piehler MF, Paerl HW (2005) Phytoplankton uptake of ammonium, nitrate, and urea in the Neuse River Estuary, NC, USA. Hydrobiologia. 533: 123-134. Wennersten, JR (2008). Anacostia: The Death and Life of an American River. The Chesapeake Book Company, Baltimore, MD.

21
Wiegner, TN, Seitzinger SP, Glibert PM, Bronk DA (2006). Bioavailability of dissolved organic nitrogen in nine rivers in the eastern United States. Aquat Microb Ecol. 43:277-287. Urgun-Demirtas M, Sattayatewa C, Pagilla KR (2008). Bioavailability of dissolved organic nitrogen in treated effluents. Water Environ Res 80:397-406. U.S. Army Corps of Engineers (2009). Anacostia River Watershed Restoration Plan: Anacostia Tidal Reach Provisional Restoration Project Inventory. U.S. Department of the Environment (2011). Anacostia Wetland Study Demonstration: Anacostia LID Project Phase V; Final Technical Report , Accessed at: http://www.princegeorgescountymd.gov/government/agencyindex/der/PDFs/ESDFinalTechnicalReportAnacostiaV.pdf Van Dolah, FM (2000). Marine Algal Toxins: Orgins, Health Effects, and their Increased Occurrence. Environmental Health Perspectives 108: 133-141. Zhang, J-Z, Fischer CJ (2006) A simplified resorcinol method for direct spectrophometric determination of nitrate in seawater. Marine Chemistry 99:220-226

Information Transfer Program Introduction
The Institute has no funded Information Transfer Project, however it conducts outreach and training activitiesin close collaboration with other landgrant centers in CAUSES, such as the Center for SustainableDevelopment, the Center for Urban Agriculture, and 4-H and Youth Development by distributing newsletters,media releases and factsheets, and training and attracting youth to prepare them to the water sciences andtechnologies.
In addition, the Institute has also established a strong collaboration with the regional water and environmentalorganization to conduct major outreach and environmental education. Every year, in collaboration with DCEnvironmental Film Festival, the Institute screens two water related films at UDC. For more informationabout the films, please follow the links:
1.http://www.dcenvironmentalfilmfest.org/films/show/1257
2.http://www.dcenvironmentalfilmfest.org/films/show/1258
3.http://www.dcenvironmentalfilmfest.org/films/show/833
4.http://www.dcenvironmentalfilmfest.org/films/show/829
5.http://www.americantowns.com/dc/washington/events/environmental-film-festival-thursday-screenings-at-university-of-the-district-of-columbia-2013-03-21
In colaboration with NCR-AWRA, we organize annual water symposium at UDC. This year we organized the2nd Annual water symposium on April 4. Please follow the following links for more information about both1st and 2nd annual water symposiums:
1.http://www.udc.edu/docs/causes/WaterHighlights%202013.pdf
2.https://www.udc.edu/docs/causes/Just%20CAUSES%20April.pdf
Information Transfer Program Introduction
Information Transfer Program Introduction 1

USGS Summer Intern Program
None.
USGS Summer Intern Program 1

Student Support
Category Section 104 BaseGrant
Section 104 NCGPAward
NIWR-USGSInternship
SupplementalAwards Total
Undergraduate 2 0 0 0 2Masters 4 0 0 0 4
Ph.D. 0 0 0 0 0Post-Doc. 0 0 0 0 0
Total 6 0 0 0 6
1

Notable Awards and Achievements
Notable Awards and Achievements 1
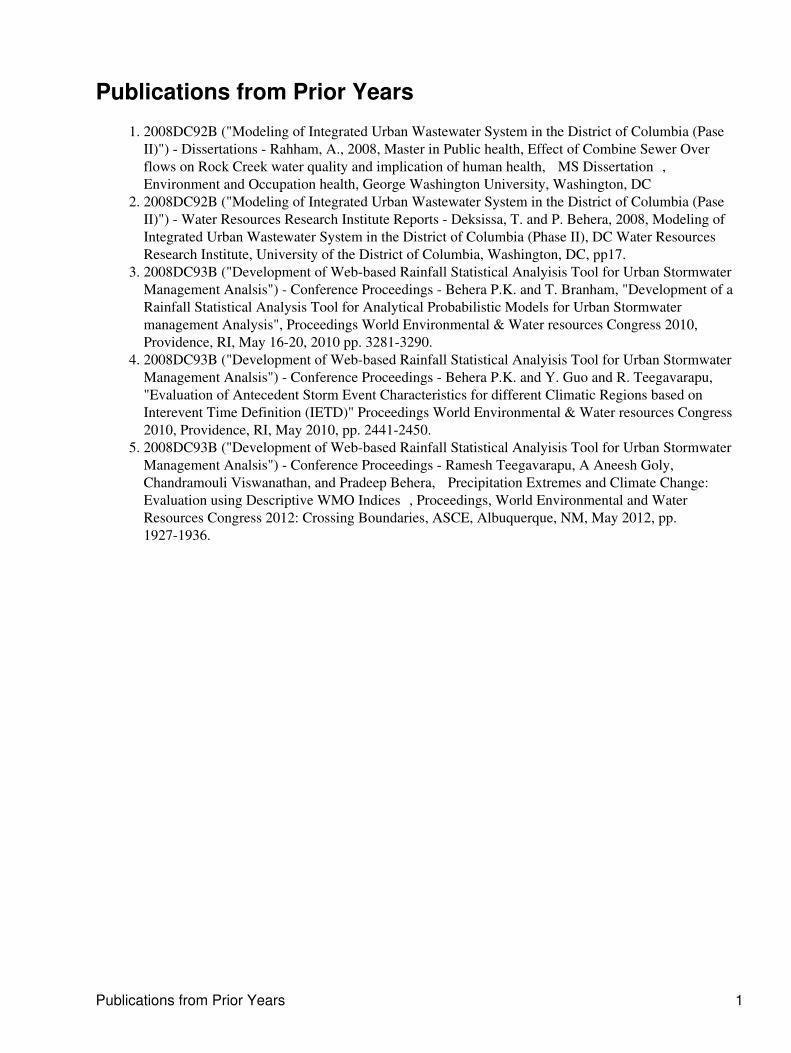
Publications from Prior Years
2008DC92B ("Modeling of Integrated Urban Wastewater System in the District of Columbia (PaseII)") - Dissertations - Rahham, A., 2008, Master in Public health, Effect of Combine Sewer Overflows on Rock Creek water quality and implication of human health, �MS Dissertation�,Environment and Occupation health, George Washington University, Washington, DC
1.
2008DC92B ("Modeling of Integrated Urban Wastewater System in the District of Columbia (PaseII)") - Water Resources Research Institute Reports - Deksissa, T. and P. Behera, 2008, Modeling ofIntegrated Urban Wastewater System in the District of Columbia (Phase II), DC Water ResourcesResearch Institute, University of the District of Columbia, Washington, DC, pp17.
2.
2008DC93B ("Development of Web-based Rainfall Statistical Analyisis Tool for Urban StormwaterManagement Analsis") - Conference Proceedings - Behera P.K. and T. Branham, "Development of aRainfall Statistical Analysis Tool for Analytical Probabilistic Models for Urban Stormwatermanagement Analysis", Proceedings World Environmental & Water resources Congress 2010,Providence, RI, May 16-20, 2010 pp. 3281-3290.
3.
2008DC93B ("Development of Web-based Rainfall Statistical Analyisis Tool for Urban StormwaterManagement Analsis") - Conference Proceedings - Behera P.K. and Y. Guo and R. Teegavarapu,"Evaluation of Antecedent Storm Event Characteristics for different Climatic Regions based onInterevent Time Definition (IETD)" Proceedings World Environmental & Water resources Congress2010, Providence, RI, May 2010, pp. 2441-2450.
4.
2008DC93B ("Development of Web-based Rainfall Statistical Analyisis Tool for Urban StormwaterManagement Analsis") - Conference Proceedings - Ramesh Teegavarapu, A Aneesh Goly,Chandramouli Viswanathan, and Pradeep Behera, �Precipitation Extremes and Climate Change:Evaluation using Descriptive WMO Indices�, Proceedings, World Environmental and WaterResources Congress 2012: Crossing Boundaries, ASCE, Albuquerque, NM, May 2012, pp.1927-1936.
5.
Publications from Prior Years 1