virgin islands water resources research institute … · virgin islands water resources research...
TRANSCRIPT
Virgin Islands Water Resources Research Institute Annual Technical Report
FY 2005
IntroductionThe Virgin Islands Water Resources Research Institute (VI-WRRI) is located at the University of theVirgin Islands (UVI), the only institution of higher learning in the U. S. Virgin Islands. As UVI meets thehigher education needs of the people of the U. S. Virgin Islands, the VI-WRRI strives to provide aresponsive program in water resources research, training and information dissemination to the communityit serves. An advisory council guides the development of the program through determination of priorityfocus areas. In the U. S. Virgin Islands rain water harvesting and seawater desalination are the principalsources of fresh water. Proper management of available fresh water is critical not only because of itslimited amount but also because its disposal can have serious health and economic implications in thetourismbased economy of the USVI.
The VI-WRRI’s program for the reporting period March 1, 2005 through February 28, 2006 consists ofresearch, training and information dissemination activities on the three larger islands of the U. S. VirginIslands and covers a wide range of water resources issues that have been identified as important. Theyinclude water quality and quanity, agriculture and aquaculture, water resources planning and managementand environmental and ecological considerations.
This annual report presents a summary of the activities conducted by the VI-WRRI with support from theU. S. Geological Survey’s annual base (104B) grant. Personnel at the University of the Virgin Islands andother investigators at collaborating institutions conducted this work. It provides an overview of the VirginIslands Water Resources Research Institute’s effort to utilize support from the USGS in serving the waterresources research, training and information dissemination needs of the people of the U. S. Virgin Islands.
Research ProgramThe research program for the reporting period is a reflection of the USVI’s reliance on multiple sources ofwater from unconventional water supplies. The water resources research questions that develop in theUSVI most likely would not arise outside of the Territory and equally most likely would not be addressedby investigators not having an interest in the Virgin Islands. The VI-WRRI’s 2005-2006 research programinvestigated the use of drip irrigation for papaya production, the role of salt ponds in environmentalprotection and the quantification and qualification of human bacterial pathogens in aquaculture systems.
Hydrology Modeling in Turpentine Run, St. Thomas
Basic Information
Title: Hydrology Modeling in Turpentine Run, St. Thomas
Project Number: 2004VI18B
Start Date: 3/1/2004
End Date: 2/28/2005
Funding Source: 104B
Congressional District: Not applicable
Research Category: Climate and Hydrologic Processes
Focus Category: Hydrology, Non Point Pollution, Water Quality
Descriptors:
Principal Investigators: R. Heath Kelsey, Henry H. Smith
Publication
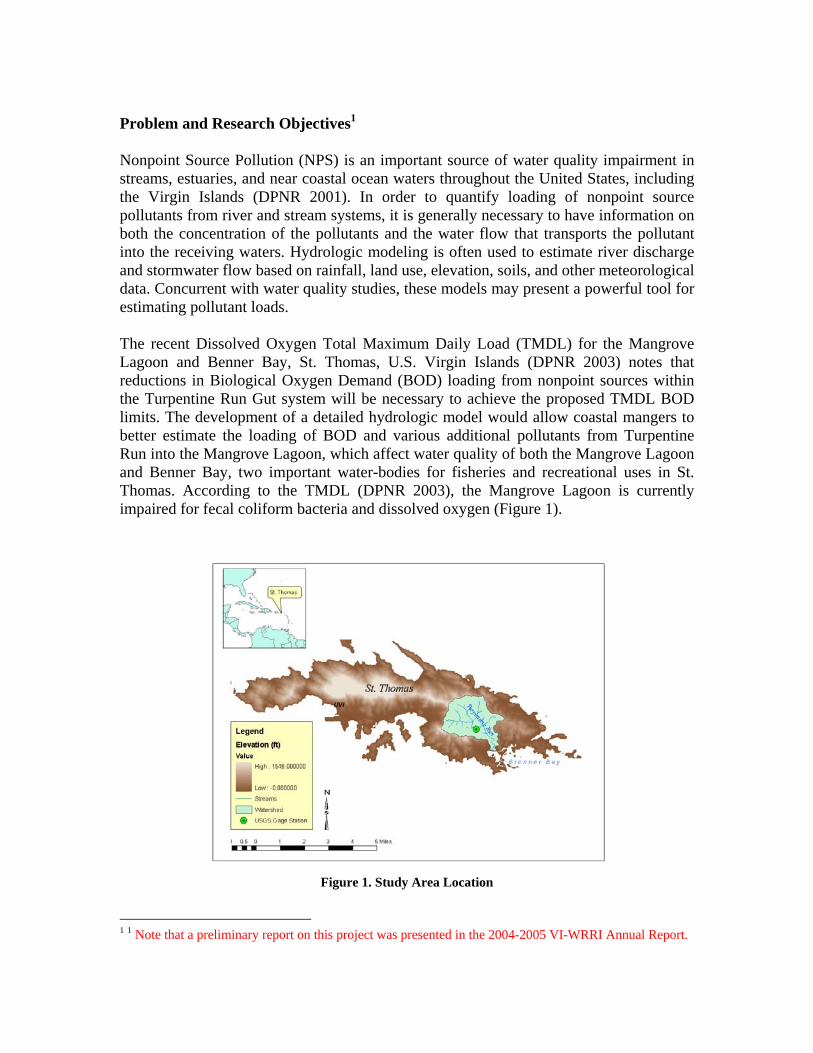
Problem and Research Objectives1 Nonpoint Source Pollution (NPS) is an important source of water quality impairment in streams, estuaries, and near coastal ocean waters throughout the United States, including the Virgin Islands (DPNR 2001). In order to quantify loading of nonpoint source pollutants from river and stream systems, it is generally necessary to have information on both the concentration of the pollutants and the water flow that transports the pollutant into the receiving waters. Hydrologic modeling is often used to estimate river discharge and stormwater flow based on rainfall, land use, elevation, soils, and other meteorological data. Concurrent with water quality studies, these models may present a powerful tool for estimating pollutant loads. The recent Dissolved Oxygen Total Maximum Daily Load (TMDL) for the Mangrove Lagoon and Benner Bay, St. Thomas, U.S. Virgin Islands (DPNR 2003) notes that reductions in Biological Oxygen Demand (BOD) loading from nonpoint sources within the Turpentine Run Gut system will be necessary to achieve the proposed TMDL BOD limits. The development of a detailed hydrologic model would allow coastal mangers to better estimate the loading of BOD and various additional pollutants from Turpentine Run into the Mangrove Lagoon, which affect water quality of both the Mangrove Lagoon and Benner Bay, two important water-bodies for fisheries and recreational uses in St. Thomas. According to the TMDL (DPNR 2003), the Mangrove Lagoon is currently impaired for fecal coliform bacteria and dissolved oxygen (Figure 1).
Figure 1. Study Area Location
1 1 Note that a preliminary report on this project was presented in the 2004-2005 VI-WRRI Annual Report.
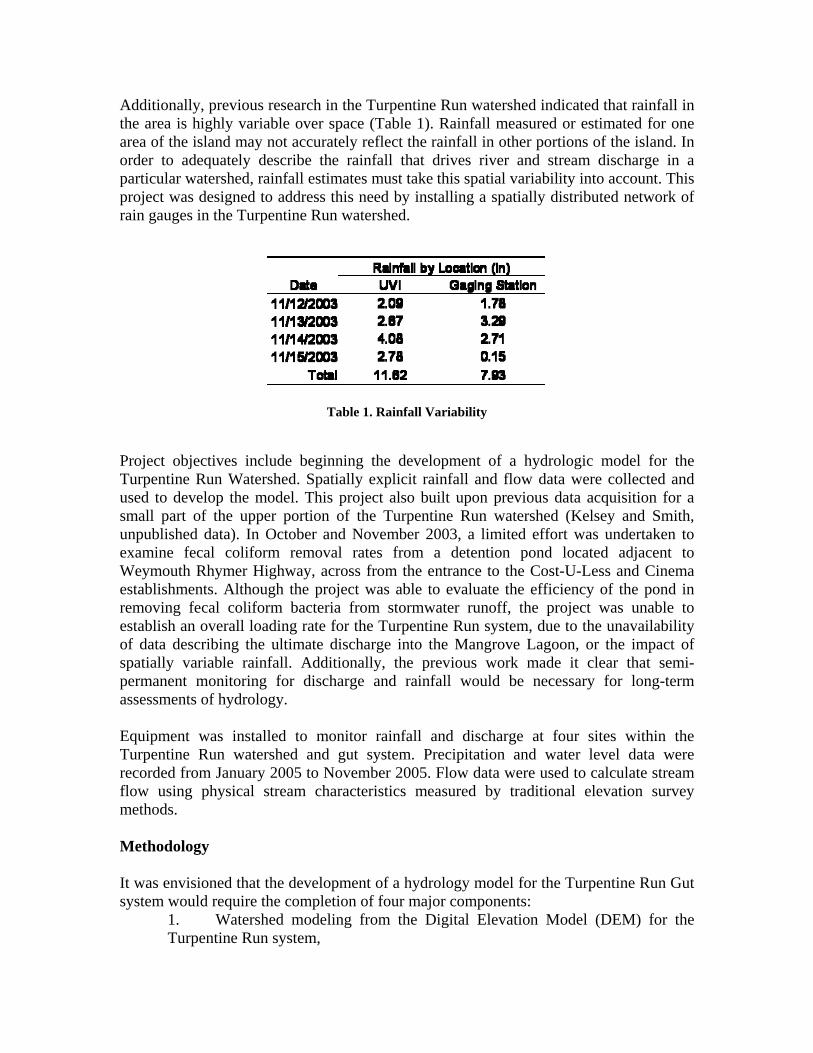
Additionally, previous research in the Turpentine Run watershed indicated that rainfall in the area is highly variable over space (Table 1). Rainfall measured or estimated for one area of the island may not accurately reflect the rainfall in other portions of the island. In order to adequately describe the rainfall that drives river and stream discharge in a particular watershed, rainfall estimates must take this spatial variability into account. This project was designed to address this need by installing a spatially distributed network of rain gauges in the Turpentine Run watershed.
Table 1. Rainfall Variability
Project objectives include beginning the development of a hydrologic model for the Turpentine Run Watershed. Spatially explicit rainfall and flow data were collected and used to develop the model. This project also built upon previous data acquisition for a small part of the upper portion of the Turpentine Run watershed (Kelsey and Smith, unpublished data). In October and November 2003, a limited effort was undertaken to examine fecal coliform removal rates from a detention pond located adjacent to Weymouth Rhymer Highway, across from the entrance to the Cost-U-Less and Cinema establishments. Although the project was able to evaluate the efficiency of the pond in removing fecal coliform bacteria from stormwater runoff, the project was unable to establish an overall loading rate for the Turpentine Run system, due to the unavailability of data describing the ultimate discharge into the Mangrove Lagoon, or the impact of spatially variable rainfall. Additionally, the previous work made it clear that semi-permanent monitoring for discharge and rainfall would be necessary for long-term assessments of hydrology. Equipment was installed to monitor rainfall and discharge at four sites within the Turpentine Run watershed and gut system. Precipitation and water level data were recorded from January 2005 to November 2005. Flow data were used to calculate stream flow using physical stream characteristics measured by traditional elevation survey methods. Methodology It was envisioned that the development of a hydrology model for the Turpentine Run Gut system would require the completion of four major components:
1. Watershed modeling from the Digital Elevation Model (DEM) for the Turpentine Run system,
2. Site determination and equipment installation, 3. Data acquisition and management, and 4. Development of the hydrologic model.
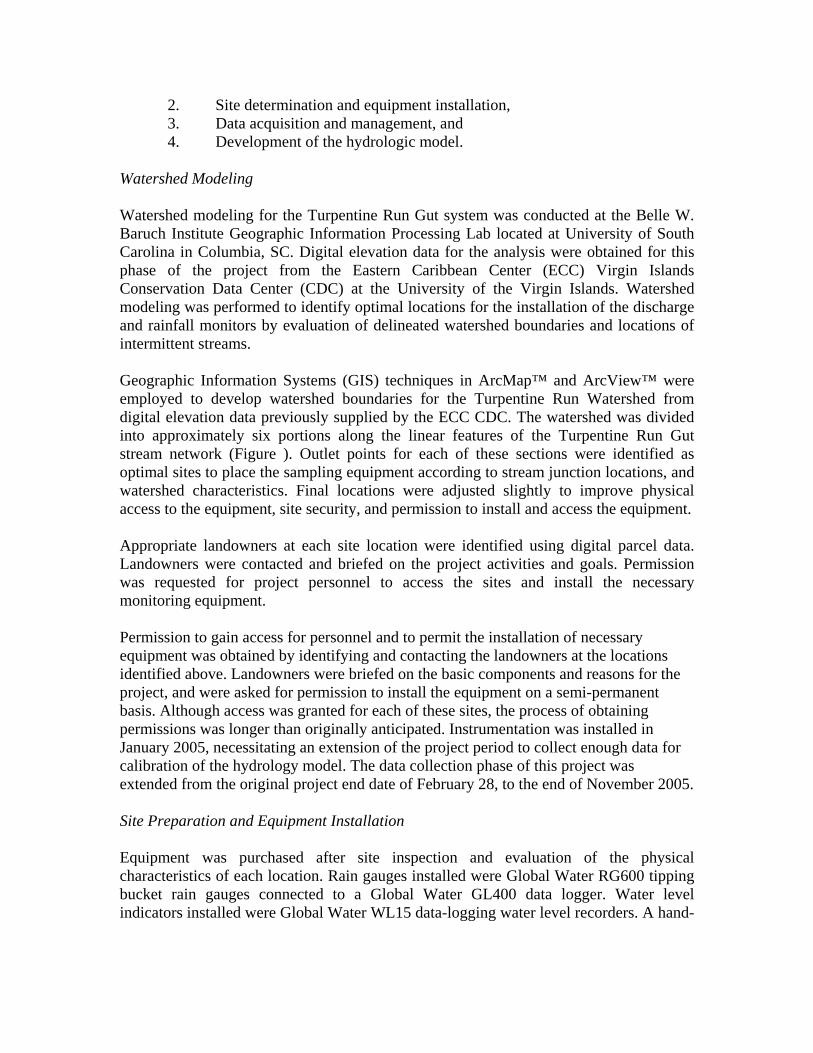
Watershed Modeling Watershed modeling for the Turpentine Run Gut system was conducted at the Belle W. Baruch Institute Geographic Information Processing Lab located at University of South Carolina in Columbia, SC. Digital elevation data for the analysis were obtained for this phase of the project from the Eastern Caribbean Center (ECC) Virgin Islands Conservation Data Center (CDC) at the University of the Virgin Islands. Watershed modeling was performed to identify optimal locations for the installation of the discharge and rainfall monitors by evaluation of delineated watershed boundaries and locations of intermittent streams. Geographic Information Systems (GIS) techniques in ArcMap™ and ArcView™ were employed to develop watershed boundaries for the Turpentine Run Watershed from digital elevation data previously supplied by the ECC CDC. The watershed was divided into approximately six portions along the linear features of the Turpentine Run Gut stream network (Figure ). Outlet points for each of these sections were identified as optimal sites to place the sampling equipment according to stream junction locations, and watershed characteristics. Final locations were adjusted slightly to improve physical access to the equipment, site security, and permission to install and access the equipment. Appropriate landowners at each site location were identified using digital parcel data. Landowners were contacted and briefed on the project activities and goals. Permission was requested for project personnel to access the sites and install the necessary monitoring equipment. Permission to gain access for personnel and to permit the installation of necessary equipment was obtained by identifying and contacting the landowners at the locations identified above. Landowners were briefed on the basic components and reasons for the project, and were asked for permission to install the equipment on a semi-permanent basis. Although access was granted for each of these sites, the process of obtaining permissions was longer than originally anticipated. Instrumentation was installed in January 2005, necessitating an extension of the project period to collect enough data for calibration of the hydrology model. The data collection phase of this project was extended from the original project end date of February 28, to the end of November 2005. Site Preparation and Equipment Installation Equipment was purchased after site inspection and evaluation of the physical characteristics of each location. Rain gauges installed were Global Water RG600 tipping bucket rain gauges connected to a Global Water GL400 data logger. Water level indicators installed were Global Water WL15 data-logging water level recorders. A hand-
held data transfer device was purchased to allow ease of data collection and management of the sensors in the field.
Figure 2. Turpentine Run Sub-watersheds and Instrument Locations
Sites were chosen for their location within the watershed system of the Turpentine Run Gut, ease of access, and security. Fortunately, each location provided some measure of inherent security as a result of fences or other security devices, or was a location where visibility was very low. Landowners were helpful in choosing locations where vandalism could be reduced. Water level recorders were installed within schedule 40 gray PVC electrical conduits, and were locked with a locking cap mechanism from the sensor manufacturer. Conduits extended from dry and elevated locations to the streambed. Stream ends of the conduit were capped and 3/8- inch holes were drilled in the PVC housing for approximately two feet to allow water to move freely in and out of the conduit. The sensor was located near this two-foot area of perforation. Data Collection Data collection was begun immediately following installation of the monitoring equipment. The data-logging units were configured to record rainfall and water level at
one-hour intervals to conform to the requirements of the hydrologic model time step, and to preserve battery life and storage space within the data logging devices. Data was downloaded periodically from the units to the handheld device, for transfer to a desktop unit at UVI. Data were downloaded in a portable database format and were converted to comma separated variable files, stored in Microsoft Excel™ Spreadsheet format for input to the hydrologic model. Following collection, data were copied from UVI to the Baruch Institute for back-up and input into the hydrology model. Data Processing Following data acquisition, water level information was converted to flow measurement time series by a series of computations involving physical stream characteristics. Traditional elevation survey techniques were used to develop cross-sectional and longitudinal stream profiles. Stream profiles were used to calculate slope, wetted perimeter, and cross-sectional are at different flow depths. These values were used to estimate stream velocity at different depth scenarios using Manning’s Equation (Chapra 1997). A stream stage-discharge relationship was estimated by fitting a power trend-line to depth and discharge data in a Microsoft Excel™ spreadsheet. The flow discharge equation was applied to calibrated water level data as observed at the sensor locations to develop time series of stream flow through the data collection period. Water level data were calibrated to equate sensor measurements of water level with water level at the cross section where the survey was conducted. Hydrologic Model Development The WinHSPF model, within the BASINS family of modeling applications developed for EPA, was chosen for the beginning of hydrologic model development. The model incorporates changes in land use, loading functions, and stochastic rainfall events in estimating discharge. The model also can incorporate modules for locally derived values for contaminant loading and transport. It was envisioned that the flow and precipitation data obtained could be used to calibrate this model. Land-use data were provided by the ECC’s CDC. Principal Findings, and Significance Watershed Modeling Watershed modeling was completed using the BASINS System obtained from EPA (EPA 2004). A Digital Elevation Model (DEM) for St. Thomas was obtained from the ECC CDC and was used to delineate watershed and sub-watershed boundaries. Outlet points were manipulated to obtain six sub-watersheds within the Turpentine Run Gut basin, such that the outlets could reflect optimal locations for water level and rain gauge instrument locations (Figure ). Confluences of streams and existing equipment (USGS Gage Station at Mt. Zion, Turpentine Run, Outlet at Sub-watershed 3) were also taken
into account when choosing locations for outlets determining sub-watershed size and locations. A stream network was created from processing the DEM to create raster data sets representing flow direction, and flow accumulation. The flow accumulation raster was reclassified to derive the stream network. The stream network was visually inspected for accuracy, and was subsequently used during the delineation of watersheds and sub-watersheds within the Turpentine Run Gut system. Based on the placement of installed instruments and the location of the existing United States Geological Survey (USGS) stream gauge, six sub-watersheds were delineated. Each sub-watershed outlet was located where a water level indicator (or the USGS stream gauge) was installed so that flow could be estimated and calibrated for each sub-watershed. Land-use parameters were calculated for each sub-watershed. Equipment Installation Five water level indicators and three rain gauges were installed at the sub-watershed outlets along Turpentine Run Gut (Figure ). Instruments were installed in January 2005, and were left in place through November 2005. In addition to the five water level indicators installed, three tipping bucket rain gauges with data loggers were installed at locations within the Turpentine Run watershed (Figure ). Appropriate locations for the rain gauges were more difficult to establish because of the generally open nature of rain gauge location requirements, creating high visibility and less secure installations. One rain gauge was installed at a central location near the confluence of tributaries draining Sub-watersheds 2 and 6. An additional rain gauge was installed approximately 100 meters west of the water level indicator location for Sub-watershed 4. A third rain gauge was installed on the roof of the V. I. Department of Agriculture abattoir located south of Bovoni Road, approximately 300 meters west of the intersection of Turpentine Run and Bovoni Roads. Data Collection Data collection began immediately following instrument installation in mid-January 13, 2005 and continued through mid-November 2005. Stream Profiles Cross-sectional and longitudinal stream surveys were conducted to measure physical stream characteristics important to the estimation of flow based on flow depth. Elevation data were obtained by traditional elevation survey methods and were used to develop cross sectional area and wetted perimeter estimations for flow calculations. Slope of the streambed was also calculated similarly. These parameters were used for flow calculations using Manning’s Equation. In the corrugated pipe at the outlet for Sub-watershed 2, these parameters were calculated using flow depth and the pipe radius. In other stream sections, the parameters were
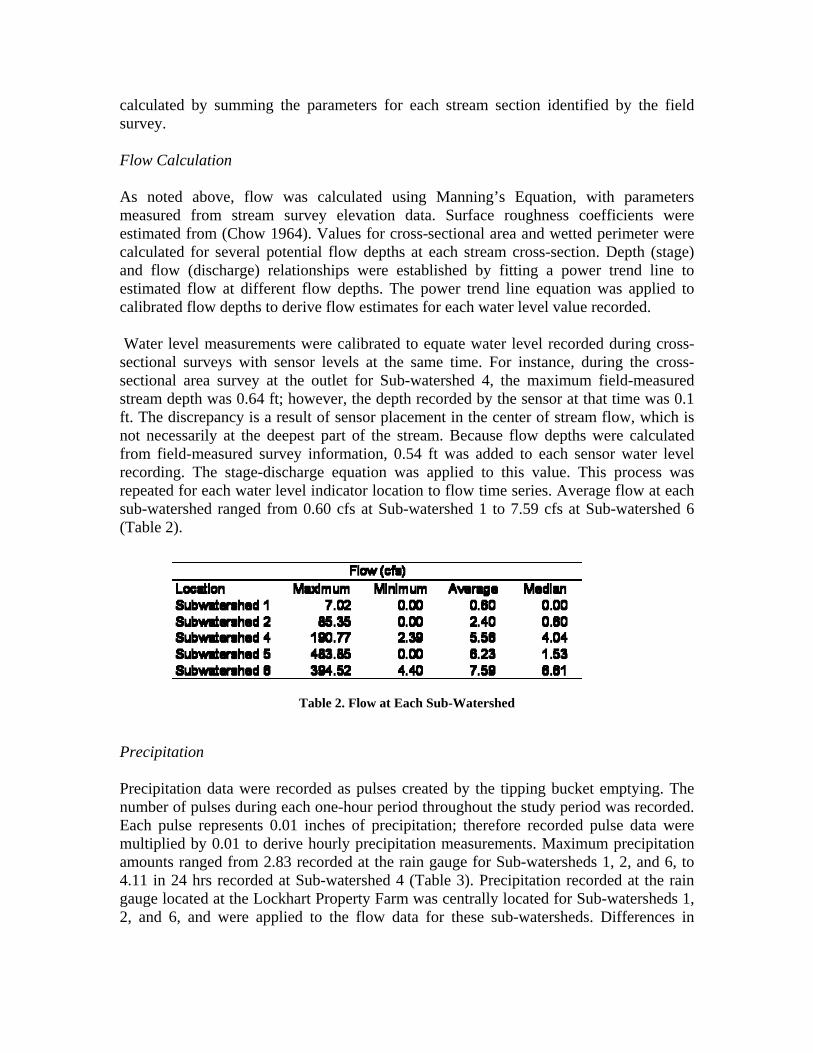
calculated by summing the parameters for each stream section identified by the field survey. Flow Calculation As noted above, flow was calculated using Manning’s Equation, with parameters measured from stream survey elevation data. Surface roughness coefficients were estimated from (Chow 1964). Values for cross-sectional area and wetted perimeter were calculated for several potential flow depths at each stream cross-section. Depth (stage) and flow (discharge) relationships were established by fitting a power trend line to estimated flow at different flow depths. The power trend line equation was applied to calibrated flow depths to derive flow estimates for each water level value recorded. Water level measurements were calibrated to equate water level recorded during cross-sectional surveys with sensor levels at the same time. For instance, during the cross-sectional area survey at the outlet for Sub-watershed 4, the maximum field-measured stream depth was 0.64 ft; however, the depth recorded by the sensor at that time was 0.1 ft. The discrepancy is a result of sensor placement in the center of stream flow, which is not necessarily at the deepest part of the stream. Because flow depths were calculated from field-measured survey information, 0.54 ft was added to each sensor water level recording. The stage-discharge equation was applied to this value. This process was repeated for each water level indicator location to flow time series. Average flow at each sub-watershed ranged from 0.60 cfs at Sub-watershed 1 to 7.59 cfs at Sub-watershed 6 (Table 2).
Table 2. Flow at Each Sub-Watershed
Precipitation Precipitation data were recorded as pulses created by the tipping bucket emptying. The number of pulses during each one-hour period throughout the study period was recorded. Each pulse represents 0.01 inches of precipitation; therefore recorded pulse data were multiplied by 0.01 to derive hourly precipitation measurements. Maximum precipitation amounts ranged from 2.83 recorded at the rain gauge for Sub-watersheds 1, 2, and 6, to 4.11 in 24 hrs recorded at Sub-watershed 4 (Table 3). Precipitation recorded at the rain gauge located at the Lockhart Property Farm was centrally located for Sub-watersheds 1, 2, and 6, and were applied to the flow data for these sub-watersheds. Differences in
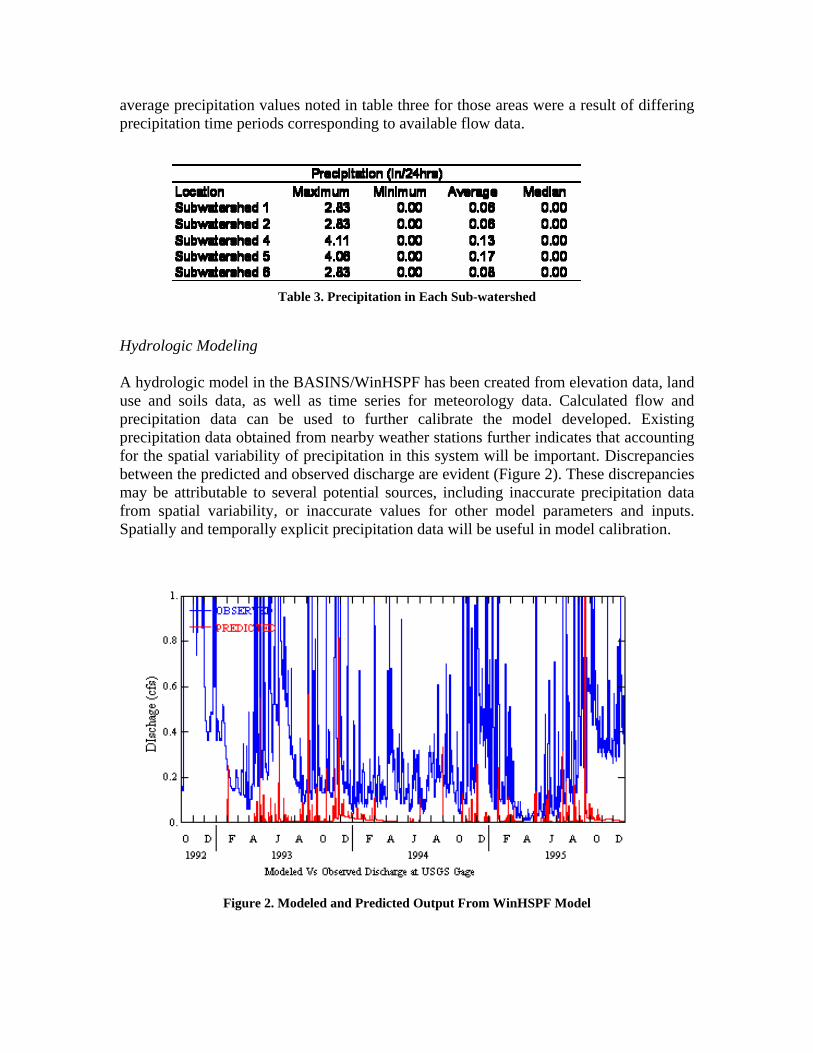
average precipitation values noted in table three for those areas were a result of differing precipitation time periods corresponding to available flow data.
Table 3. Precipitation in Each Sub-watershed
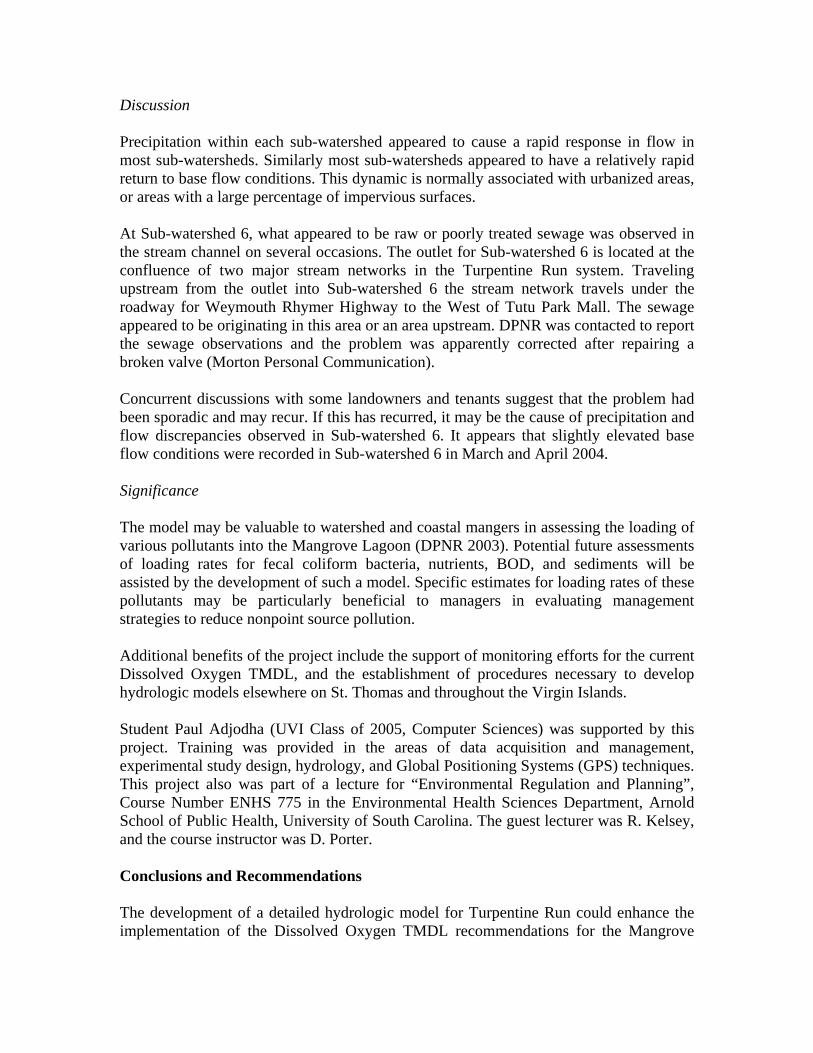
Hydrologic Modeling A hydrologic model in the BASINS/WinHSPF has been created from elevation data, land use and soils data, as well as time series for meteorology data. Calculated flow and precipitation data can be used to further calibrate the model developed. Existing precipitation data obtained from nearby weather stations further indicates that accounting for the spatial variability of precipitation in this system will be important. Discrepancies between the predicted and observed discharge are evident (Figure 2). These discrepancies may be attributable to several potential sources, including inaccurate precipitation data from spatial variability, or inaccurate values for other model parameters and inputs. Spatially and temporally explicit precipitation data will be useful in model calibration.
Figure 2. Modeled and Predicted Output From WinHSPF Model
Discussion Precipitation within each sub-watershed appeared to cause a rapid response in flow in most sub-watersheds. Similarly most sub-watersheds appeared to have a relatively rapid return to base flow conditions. This dynamic is normally associated with urbanized areas, or areas with a large percentage of impervious surfaces. At Sub-watershed 6, what appeared to be raw or poorly treated sewage was observed in the stream channel on several occasions. The outlet for Sub-watershed 6 is located at the confluence of two major stream networks in the Turpentine Run system. Traveling upstream from the outlet into Sub-watershed 6 the stream network travels under the roadway for Weymouth Rhymer Highway to the West of Tutu Park Mall. The sewage appeared to be originating in this area or an area upstream. DPNR was contacted to report the sewage observations and the problem was apparently corrected after repairing a broken valve (Morton Personal Communication). Concurrent discussions with some landowners and tenants suggest that the problem had been sporadic and may recur. If this has recurred, it may be the cause of precipitation and flow discrepancies observed in Sub-watershed 6. It appears that slightly elevated base flow conditions were recorded in Sub-watershed 6 in March and April 2004. Significance The model may be valuable to watershed and coastal mangers in assessing the loading of various pollutants into the Mangrove Lagoon (DPNR 2003). Potential future assessments of loading rates for fecal coliform bacteria, nutrients, BOD, and sediments will be assisted by the development of such a model. Specific estimates for loading rates of these pollutants may be particularly beneficial to managers in evaluating management strategies to reduce nonpoint source pollution. Additional benefits of the project include the support of monitoring efforts for the current Dissolved Oxygen TMDL, and the establishment of procedures necessary to develop hydrologic models elsewhere on St. Thomas and throughout the Virgin Islands. Student Paul Adjodha (UVI Class of 2005, Computer Sciences) was supported by this project. Training was provided in the areas of data acquisition and management, experimental study design, hydrology, and Global Positioning Systems (GPS) techniques. This project also was part of a lecture for “Environmental Regulation and Planning”, Course Number ENHS 775 in the Environmental Health Sciences Department, Arnold School of Public Health, University of South Carolina. The guest lecturer was R. Kelsey, and the course instructor was D. Porter. Conclusions and Recommendations The development of a detailed hydrologic model for Turpentine Run could enhance the implementation of the Dissolved Oxygen TMDL recommendations for the Mangrove
Lagoon. The results of this effort could be used, with further evaluation, to establish BOD input into the Mangrove Lagoon, and subsequently to evaluate reductions in BOD from the Turpentine Run Watershed. Testing of stormwater BOD concentration would be necessary to include in the evaluations. In order to calibrate the hydrology model for Turpentine Run, further stormwater flow measurements will be helpful. These could be obtained during sampling for BOD in the stormwater. Further analysis of the data obtained in the course of this project is warranted. Although data for several of the individual sub-watersheds are limited, due to the equipment failures noted above, the data for Sub-watershed 5 could be used to calibrate the modeled output for the larger Turpentine Run watershed. Further data evaluation could also include assessments of the spatial variability of precipitation recorded at each of the individual rain gauges and the evaluation of remotely sensed precipitation as a spatially averaged precipitation data source for input into the model. It may be possible to evaluate the data from Sub-watershed 5 in relation to an annual predicted stormwater flow total and a calculation of average BOD in stormwater measured at the watershed outlet. It may be possible to develop empirically predicted stormwater flow at the watershed outlet from precipitation data only.
References
Chapra, S. C (1997). Surface water quality modeling. Boston, MA, WCB McGraw-Hill.
Chow, Ven Te (1964). Handbook of Applied Hydrology. New York, McGraw-Hill Book Company.
DPNR, Department of Planning and Natural Resources (2001). Coastal Water Quality Monitoring Manual.
DPNR, Department of Planning and Natural Resources (2003). Dissolved Oxygen TMDL for Mangrove Lagoon and Benner Bay, St. Thomas, U.S. Virgin Islands, Draft. DPNR.
EPA, Environmental Protection Agency (2004). Better Assessment Science Integrating point and Nonpoint Sources Version 3.1 Users Manual. EPA-823-C-04-004. EPA.
Morton, D. (Personal Communication) Discussion regarding sewage contamination at Turpentine Run. July 2004
Water Usage for Papaya Production During Drought in the U.S.Virgin Islands
Basic Information
Title: Water Usage for Papaya Production During Drought in the U.S. Virgin Islands
Project Number: 2005VI50B
Start Date: 3/1/2005
End Date: 2/28/2006
Funding Source: 104B
Congressional District: Not applicable
Research Category: Biological Sciences
Focus Category: Agriculture, Drought, Water Use
Descriptors:
Principal Investigators: Thomas W. Zimmerman
Publication
Problem and Research Objectives
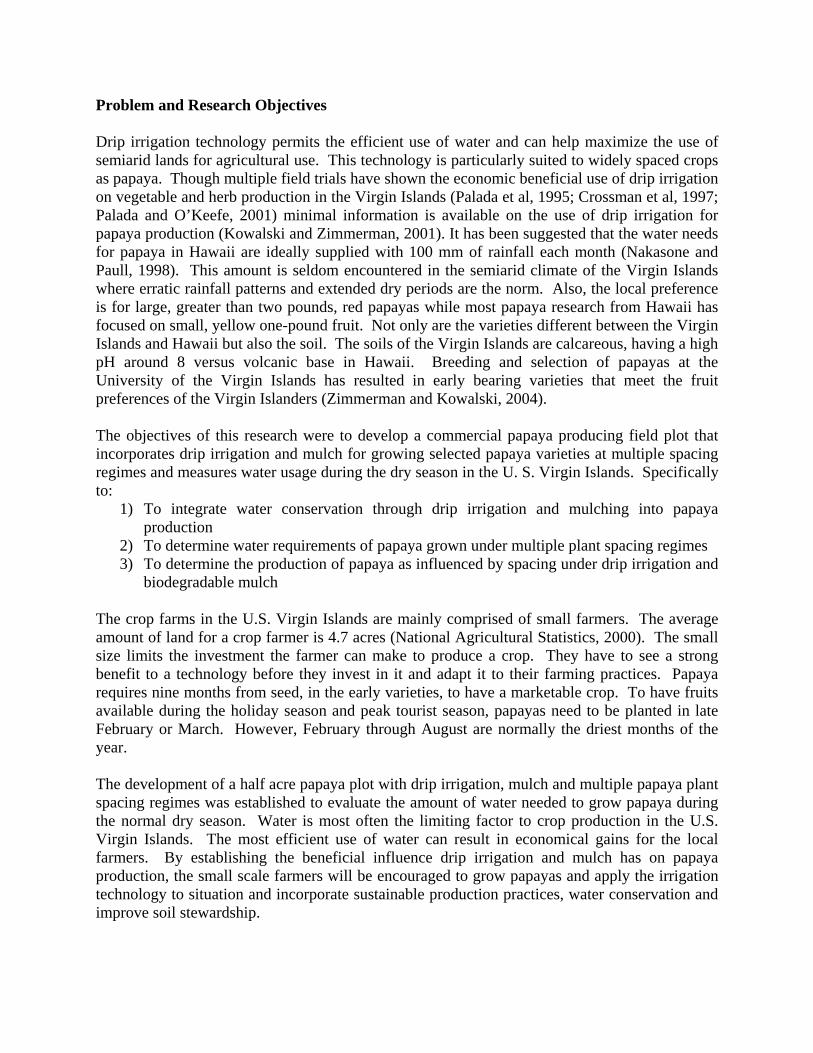
Drip irrigation technology permits the efficient use of water and can help maximize the use of semiarid lands for agricultural use. This technology is particularly suited to widely spaced crops as papaya. Though multiple field trials have shown the economic beneficial use of drip irrigation on vegetable and herb production in the Virgin Islands (Palada et al, 1995; Crossman et al, 1997; Palada and O’Keefe, 2001) minimal information is available on the use of drip irrigation for papaya production (Kowalski and Zimmerman, 2001). It has been suggested that the water needs for papaya in Hawaii are ideally supplied with 100 mm of rainfall each month (Nakasone and Paull, 1998). This amount is seldom encountered in the semiarid climate of the Virgin Islands where erratic rainfall patterns and extended dry periods are the norm. Also, the local preference is for large, greater than two pounds, red papayas while most papaya research from Hawaii has focused on small, yellow one-pound fruit. Not only are the varieties different between the Virgin Islands and Hawaii but also the soil. The soils of the Virgin Islands are calcareous, having a high pH around 8 versus volcanic base in Hawaii. Breeding and selection of papayas at the University of the Virgin Islands has resulted in early bearing varieties that meet the fruit preferences of the Virgin Islanders (Zimmerman and Kowalski, 2004). The objectives of this research were to develop a commercial papaya producing field plot that incorporates drip irrigation and mulch for growing selected papaya varieties at multiple spacing regimes and measures water usage during the dry season in the U. S. Virgin Islands. Specifically to:
1) To integrate water conservation through drip irrigation and mulching into papaya production
2) To determine water requirements of papaya grown under multiple plant spacing regimes 3) To determine the production of papaya as influenced by spacing under drip irrigation and
biodegradable mulch The crop farms in the U.S. Virgin Islands are mainly comprised of small farmers. The average amount of land for a crop farmer is 4.7 acres (National Agricultural Statistics, 2000). The small size limits the investment the farmer can make to produce a crop. They have to see a strong benefit to a technology before they invest in it and adapt it to their farming practices. Papaya requires nine months from seed, in the early varieties, to have a marketable crop. To have fruits available during the holiday season and peak tourist season, papayas need to be planted in late February or March. However, February through August are normally the driest months of the year. The development of a half acre papaya plot with drip irrigation, mulch and multiple papaya plant spacing regimes was established to evaluate the amount of water needed to grow papaya during the normal dry season. Water is most often the limiting factor to crop production in the U.S. Virgin Islands. The most efficient use of water can result in economical gains for the local farmers. By establishing the beneficial influence drip irrigation and mulch has on papaya production, the small scale farmers will be encouraged to grow papayas and apply the irrigation technology to situation and incorporate sustainable production practices, water conservation and improve soil stewardship.
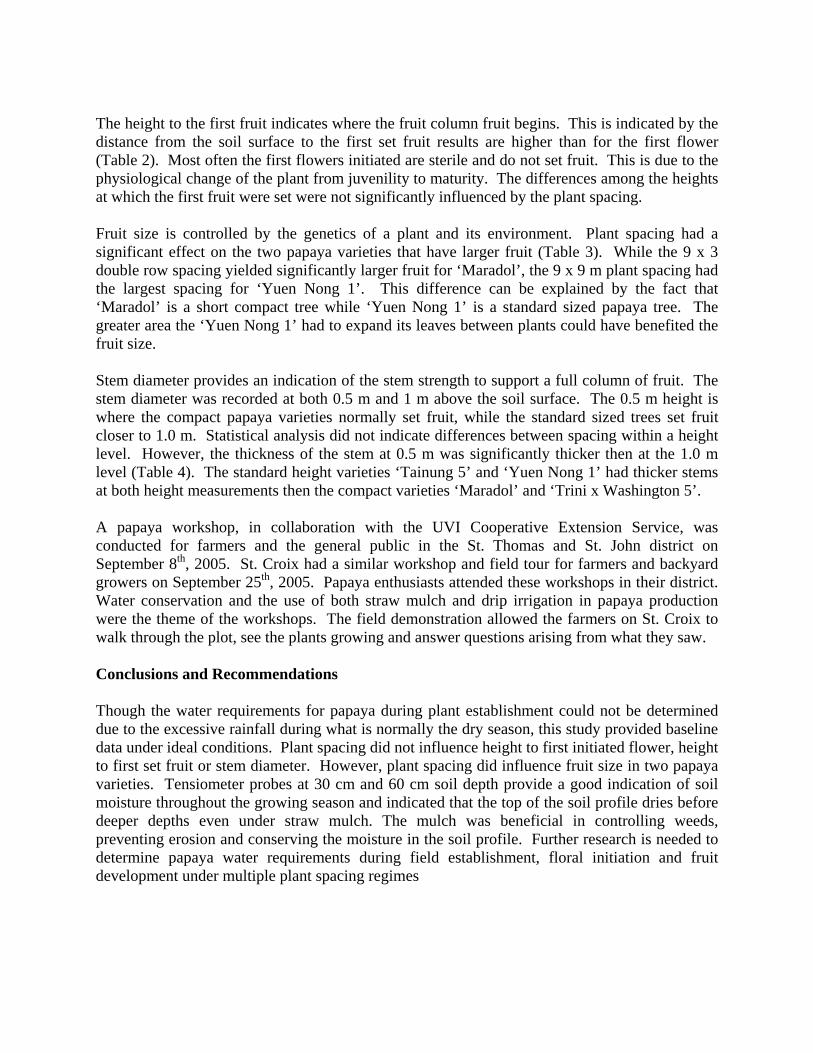
Methodology Papayas were initiated from seed under greenhouse conditions during March. Four papaya varieties were selected for the replicated water usage and spacing study. The varieties were: ‘Maradol’, ‘Tainung 5’, ‘Trini x Washington 5’ and ‘Yuen Nong 1’. When the seedlings were 10-15cm in May, they were transplanted to the field in three spacing arrangements. The spacing was 3 m x 3 m, 3 m x 2 m and a staggered double row 3 m x 1 m with 2.5 m between each set of double rows. There were eight rows per spacing regime that were divided into two row blocks. Each row had two plants of each variety. Guard rows of other papaya varieties were planted around the plot to negate border effects. The plants were hand watered at the time of planting with a fertilizer and fungicide solution. Drip irrigation lines, with 1 m spaced emitters, were installed at the time of planting. The irrigation system was set up with a Dosmatic injector and each spacing block had its own water meter. Two sets of soil moisture tensiometers were installed within rows of each papaya block. Each set of tensiometers consisted of two meters to record soil moisture at 15 cm and 30 cm depth. The tensiometer readings were recorded twice a week by a student assistant. The plots were mulched with grass hay mulch when plants were 0.8-1 m tall. After one month of field establishment, floral buds had formed, allowing for the papaya plants to be sexed and thinned to one plant per hill. None bearing male plants were removed and one, preferably hermaphrodite, papaya was left to grow. A month after anthesis, the height to the first set fruit was recorded. At the time of fruit harvest, the stem diameter was recorded at 0.5 m and 1.0 m. Production data was collected as the fruits ripened. A prebachelorate college student was funded through this grant. The student was actively involved in all aspects of this papaya study. His time has been spent on the following activities: 1. Papaya seed planting and recording of seedling emergence; 2. Transplanting of the papaya plants to the field and installation of the drip irrigation lines; 3. Assembling the tensiometers and calibrated them; 4. Installing the tensiometers in the field and regularly recorded soil moisture readings; 5. Assist with the sex determination and thinning of trees; 6. Recorded height to first flower, height to first fruit, stem diameter and fruit characteristics; 7. Developed spreadsheets for data parameters and entered the data in the computer. Principal Findings and Significance This study was to investigate the amount of water usage during the first six months of establishment at varying papaya spacing intervals during the dry season. Due to the unseasonable abundant amount of rainfall during the normal dry season and course of this research (Figure 1), supplemental irrigation water was only applied once. The heavy rainfalls resulted in even water distribution throughout the test plot. The papaya growing plot was at or near field capacity during most of the first six-month trial (Figure 2). This ideal environment caused the papaya plants to grow well and be productive. The mulch was a benefit during the heavy rains by preventing erosion to the soil. The mulch also suppressed weed growth and
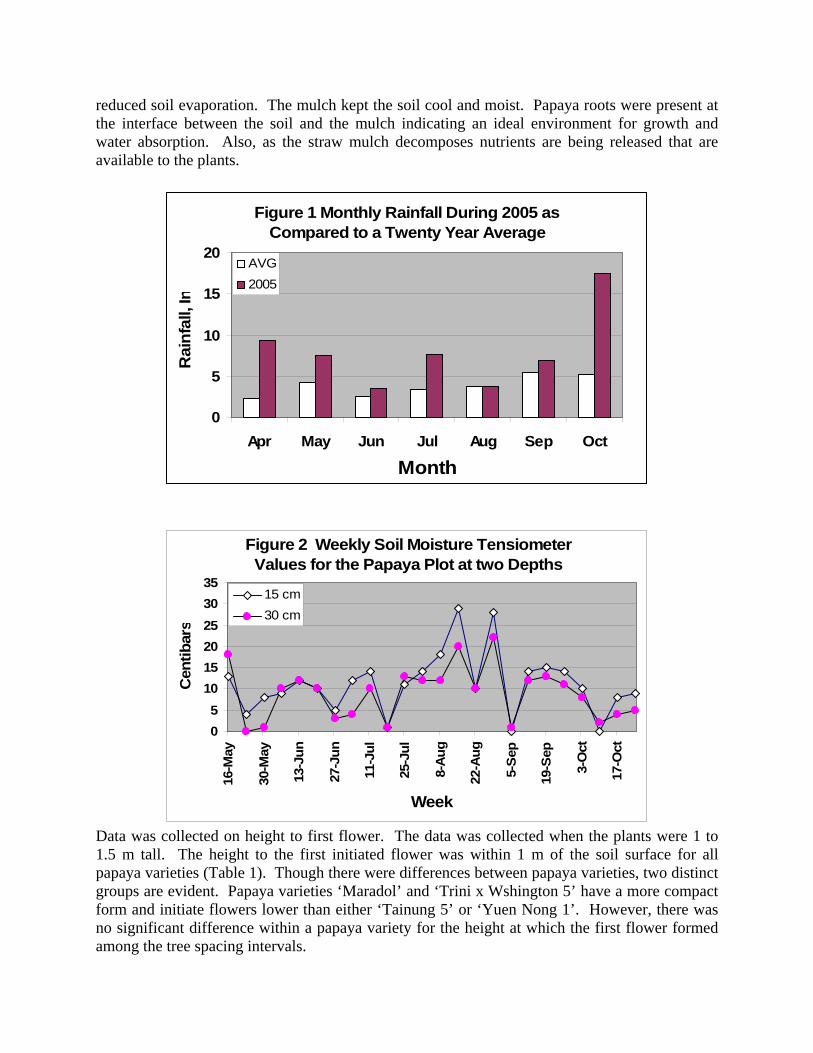
reduced soil evaporation. The mulch kept the soil cool and moist. Papaya roots were present at the interface between the soil and the mulch indicating an ideal environment for growth and water absorption. Also, as the straw mulch decomposes nutrients are being released that are available to the plants.
Figure 1 Monthly Rainfall During 2005 as Compared to a Twenty Year Average
0
5
10
15
20
Apr May Jun Jul Aug Sep Oct
Month
Rai
nfal
l, In
AVG2005
Figure 2 Weekly Soil Moisture Tensiometer Values for the Papaya Plot at two Depths
05
101520253035
16-M
ay
30-M
ay
13-J
un
27-J
un
11-J
ul
25-J
ul
8-Au
g
22-A
ug
5-Se
p
19-S
ep
3-O
ct
17-O
ct
Week
Cen
tibar
s
15 cm30 cm
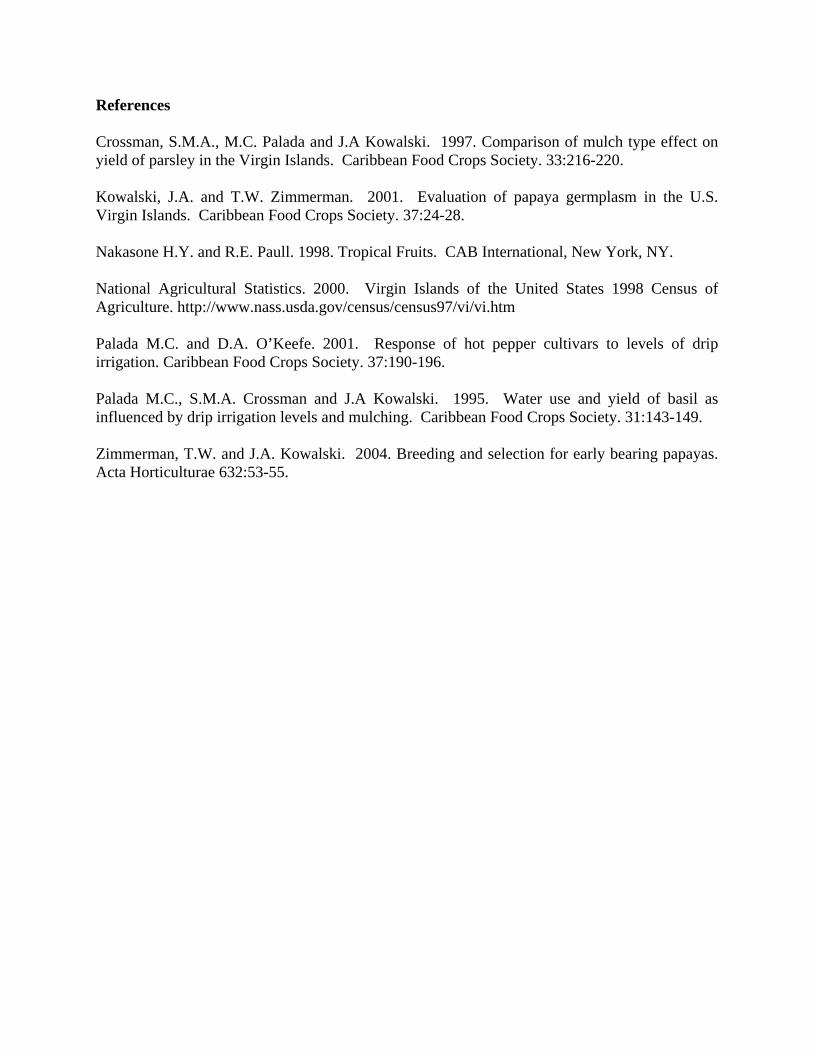
Data was collected on height to first flower. The data was collected when the plants were 1 to 1.5 m tall. The height to the first initiated flower was within 1 m of the soil surface for all papaya varieties (Table 1). Though there were differences between papaya varieties, two distinct groups are evident. Papaya varieties ‘Maradol’ and ‘Trini x Wshington 5’ have a more compact form and initiate flowers lower than either ‘Tainung 5’ or ‘Yuen Nong 1’. However, there was no significant difference within a papaya variety for the height at which the first flower formed among the tree spacing intervals.
The height to the first fruit indicates where the fruit column fruit begins. This is indicated by the distance from the soil surface to the first set fruit results are higher than for the first flower (Table 2). Most often the first flowers initiated are sterile and do not set fruit. This is due to the physiological change of the plant from juvenility to maturity. The differences among the heights at which the first fruit were set were not significantly influenced by the plant spacing. Fruit size is controlled by the genetics of a plant and its environment. Plant spacing had a significant effect on the two papaya varieties that have larger fruit (Table 3). While the 9 x 3 double row spacing yielded significantly larger fruit for ‘Maradol’, the 9 x 9 m plant spacing had the largest spacing for ‘Yuen Nong 1’. This difference can be explained by the fact that ‘Maradol’ is a short compact tree while ‘Yuen Nong 1’ is a standard sized papaya tree. The greater area the ‘Yuen Nong 1’ had to expand its leaves between plants could have benefited the fruit size. Stem diameter provides an indication of the stem strength to support a full column of fruit. The stem diameter was recorded at both 0.5 m and 1 m above the soil surface. The 0.5 m height is where the compact papaya varieties normally set fruit, while the standard sized trees set fruit closer to 1.0 m. Statistical analysis did not indicate differences between spacing within a height level. However, the thickness of the stem at 0.5 m was significantly thicker then at the 1.0 m level (Table 4). The standard height varieties ‘Tainung 5’ and ‘Yuen Nong 1’ had thicker stems at both height measurements then the compact varieties ‘Maradol’ and ‘Trini x Washington 5’. A papaya workshop, in collaboration with the UVI Cooperative Extension Service, was conducted for farmers and the general public in the St. Thomas and St. John district on September 8th, 2005. St. Croix had a similar workshop and field tour for farmers and backyard growers on September 25th, 2005. Papaya enthusiasts attended these workshops in their district. Water conservation and the use of both straw mulch and drip irrigation in papaya production were the theme of the workshops. The field demonstration allowed the farmers on St. Croix to walk through the plot, see the plants growing and answer questions arising from what they saw. Conclusions and Recommendations Though the water requirements for papaya during plant establishment could not be determined due to the excessive rainfall during what is normally the dry season, this study provided baseline data under ideal conditions. Plant spacing did not influence height to first initiated flower, height to first set fruit or stem diameter. However, plant spacing did influence fruit size in two papaya varieties. Tensiometer probes at 30 cm and 60 cm soil depth provide a good indication of soil moisture throughout the growing season and indicated that the top of the soil profile dries before deeper depths even under straw mulch. The mulch was beneficial in controlling weeds, preventing erosion and conserving the moisture in the soil profile. Further research is needed to determine papaya water requirements during field establishment, floral initiation and fruit development under multiple plant spacing regimes
References Crossman, S.M.A., M.C. Palada and J.A Kowalski. 1997. Comparison of mulch type effect on yield of parsley in the Virgin Islands. Caribbean Food Crops Society. 33:216-220. Kowalski, J.A. and T.W. Zimmerman. 2001. Evaluation of papaya germplasm in the U.S. Virgin Islands. Caribbean Food Crops Society. 37:24-28. Nakasone H.Y. and R.E. Paull. 1998. Tropical Fruits. CAB International, New York, NY. National Agricultural Statistics. 2000. Virgin Islands of the United States 1998 Census of Agriculture. http://www.nass.usda.gov/census/census97/vi/vi.htm Palada M.C. and D.A. O’Keefe. 2001. Response of hot pepper cultivars to levels of drip irrigation. Caribbean Food Crops Society. 37:190-196. Palada M.C., S.M.A. Crossman and J.A Kowalski. 1995. Water use and yield of basil as influenced by drip irrigation levels and mulching. Caribbean Food Crops Society. 31:143-149. Zimmerman, T.W. and J.A. Kowalski. 2004. Breeding and selection for early bearing papayas. Acta Horticulturae 632:53-55.
Table 1. Average height to the first flower of four papaya varieties planted in three spacing intervals.
Papaya 9 x 3 9 x 6 9 x 9 Variety (cm) (cm) (cm) Maradol 43.0 38.8 45.0 Tainung 5 63.8 61.6 61.4 Trini x Washington 5 41.5 43.2 36.6 Yuen Nong 1 65.7 78.2 87.3
Table 2. Average height to the first fruit of four papaya varieties planted in three spacing intervals.
Papaya 9 x 3 9 x 6 9 x 9 Variety (cm) (cm) (cm) Maradol 52.3 47.7 48.0 Tainung 5 82.7 71.0 74.4 Trini x Washington 5 53.8 54.9 58.8 Yuen Nong 1 86.8 82.4 94.6
Table 3. Average fruit size of four papaya varieties planted in three spacing intervals. Papaya 9 x 3 9 x 6 9 x 9 Variety (Kg) (Kg) (Kg) Maradol 2.26 a* 1.89 b 2.11 ab Tainung 5 1.20 0.95 1.07 Trini x Washington 5 0.87 0.76 0.80 Yuen Nong 1 2.86 b 2.16 b 4.35 a * Differences among spacing intervals within variety followed by a different letter are significant at 0.05 level (LSD).
Table 4. Stem diameter at 0.5 m and 1.0 m after six month of growth in the field.
Height at 0.5 m Height at 1.0 m Papaya 9 x 3 9 x 6 9 x 9 9 x 3 9 x 6 9 x 9 Variety (cm) (cm) (cm) (cm) (cm) (cm) Maradol 10.5 10.0 9.3 8.1 8.3 7.8 Tainung 5 12.4 12.5 12.3 11.1 10.8 10.5 Trini x Washington 5 10.5 9.9 10.8 8.3 8.1 8.7 Yuen Nong 1 12.1 12.1 12.6 9.7 10.0 10.9
Qualification and quantification of human bacterial pathogensin UVI aquaculture systems
Basic Information
Title: Qualification and quantification of human bacterial pathogens in UVIaquaculture systems
Project Number: 2005VI51B
Start Date: 3/1/2005
End Date: 2/28/2006
Funding Source: 104B
Congressional District: Not applicable
Research Category: Water Quality
Focus Category: Agriculture, Water Quality, None
Descriptors:
Principal Investigators: Donald Bailey
Publication
Problem and Research Objectives The aquaculture program of the University of the Virgin Islands’ Agricultural Experiment Station has developed aquaculture systems which are being adopted by farmers in the U. S. Virgin Islands, the USA and in other countries. As implementation of these systems proceeds in these locations, health and environmental monitoring agencies involved in the permitting process have requested information on the presence of human bacterial pathogens in the aquaculture systems’ water and the potential for illness among workers and consumers and the environmental impact of waste water discharged. Coliform bacteria are a group of bacteria of the family Enterobacteriaceae “consisting of gram negative aerobic and facultatively anaerobic rods which produce acid from glucose and other carbohydrates, and are usually aerogenic” (Speck 1976). They are ubiquitous in the intestinal track of animals and in soil, plants and water. Fecal coliform is a subset of total coliform and are found in the digestive track of warm-blooded animals and birds. The presence of fecal coliform in water is not in itself a hazard but its identification in water is used as an indicator of possible contamination by other pathogenic bacteria. Escherichia coli is one specie of fecal coliform that is monitored in public drinking and recreational water. E. coli O157:H7 is a strain of these bacteria that does produce a toxin that causes severe illness in humans and is a public health concern that is monitored by Territorial and Federal agencies. There were 183 reported cases of Shinga toxin-producing E. coli in the United States in 2005. There were no reported cases in the U.S. Virgin Islands (MMWR vol. 55:8). Not all cases of gastroenteritis are reported to public health officials and the cause of each case is often unknown The UVI aquaculture systems studied in this research are exposed in an outdoor environment and accessible by birds and mammals. Feces from these animals can contaminate the water with coliform and other pathogenic bacteria. This research evaluated water samples from the systems over a 6-month period to determine the presence of coliform, fecal coliform and reported the number of organisms in a 100 mL sample. Methodology Water samples were collected from the UVI Aquaponic System, Greenwater Tank Culture System, and the Fish Purge system during the Summer, Fall and Winter, 2005-2006. Samples were collected in sterile plastic bottles at a depth of 30 cm from the surface. They were immediately placed in an ice chest and transported to a commercial water quality analysis laboratory for analysis.
Using Standard Method 9221 B. Standard Total Coliform Fermentation Technique (Eaton, 1995) the laboratory performed the presumptive portion of the multiple-tube test. This test uses 9 tubes of lauryl tryptose broth, each of which is inoculated with a different
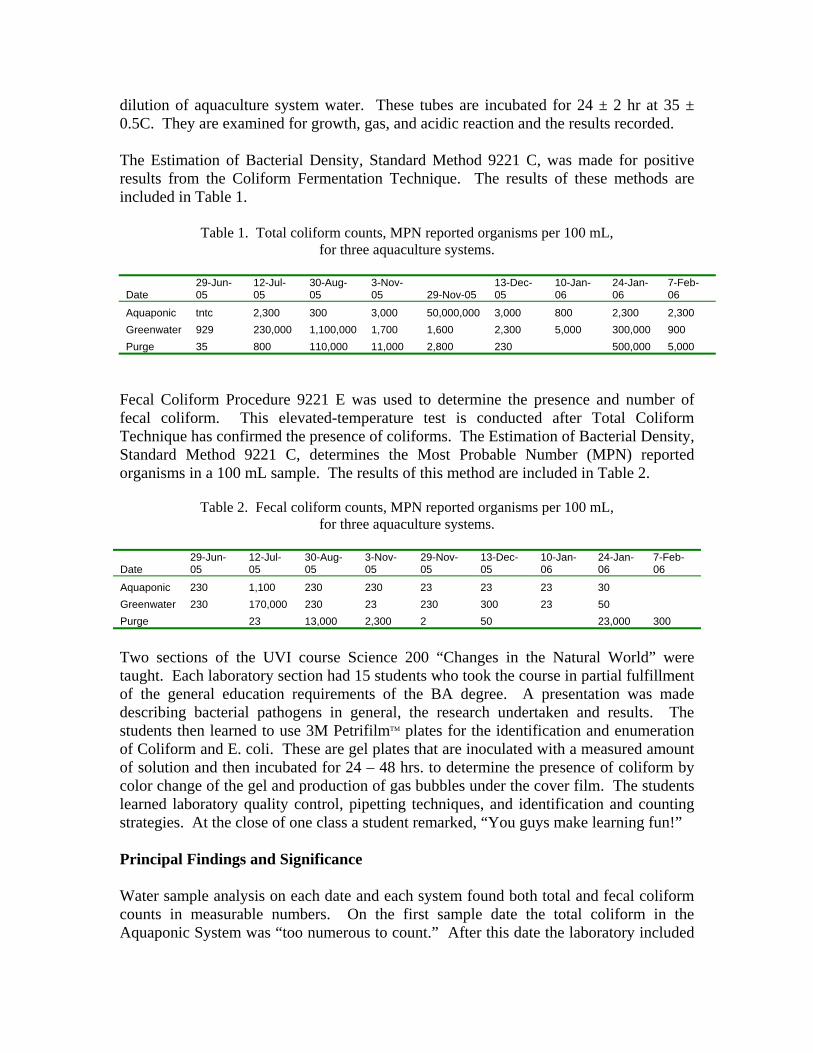
dilution of aquaculture system water. These tubes are incubated for 24 ± 2 hr at 35 ± 0.5C. They are examined for growth, gas, and acidic reaction and the results recorded. The Estimation of Bacterial Density, Standard Method 9221 C, was made for positive results from the Coliform Fermentation Technique. The results of these methods are included in Table 1.
Table 1. Total coliform counts, MPN reported organisms per 100 mL, for three aquaculture systems.
Date 29-Jun-05
12-Jul-05
30-Aug-05
3-Nov-05 29-Nov-05
13-Dec-05
10-Jan-06
24-Jan-06
7-Feb-06
Aquaponic tntc 2,300 300 3,000 50,000,000 3,000 800 2,300 2,300 Greenwater 929 230,000 1,100,000 1,700 1,600 2,300 5,000 300,000 900 Purge 35 800 110,000 11,000 2,800 230 500,000 5,000
Fecal Coliform Procedure 9221 E was used to determine the presence and number of fecal coliform. This elevated-temperature test is conducted after Total Coliform Technique has confirmed the presence of coliforms. The Estimation of Bacterial Density, Standard Method 9221 C, determines the Most Probable Number (MPN) reported organisms in a 100 mL sample. The results of this method are included in Table 2.
Table 2. Fecal coliform counts, MPN reported organisms per 100 mL, for three aquaculture systems.
Date 29-Jun-05
12-Jul-05
30-Aug-05
3-Nov-05
29-Nov-05
13-Dec-05
10-Jan-06
24-Jan-06
7-Feb-06
Aquaponic 230 1,100 230 230 23 23 23 30 Greenwater 230 170,000 230 23 230 300 23 50 Purge 23 13,000 2,300 2 50 23,000 300
Two sections of the UVI course Science 200 “Changes in the Natural World” were taught. Each laboratory section had 15 students who took the course in partial fulfillment of the general education requirements of the BA degree. A presentation was made describing bacterial pathogens in general, the research undertaken and results. The students then learned to use 3M PetrifilmTM plates for the identification and enumeration of Coliform and E. coli. These are gel plates that are inoculated with a measured amount of solution and then incubated for 24 – 48 hrs. to determine the presence of coliform by color change of the gel and production of gas bubbles under the cover film. The students learned laboratory quality control, pipetting techniques, and identification and counting strategies. At the close of one class a student remarked, “You guys make learning fun!” Principal Findings and Significance Water sample analysis on each date and each system found both total and fecal coliform counts in measurable numbers. On the first sample date the total coliform in the Aquaponic System was “too numerous to count.” After this date the laboratory included
a dilution range that encompassed high values. In one instance the MPN of total coliform was 50,000,000. Excluding this high point the next highest MPN for total coliform in the Aquaponic System was 3,000 organisms per 100 mL (Table 1.) Fecal coliform ranged from 23 to 1,100 organisms per 100 mL (Table 2.) The Greenwater System had a wide and inconsistent range of total coliform, from low of 900 to high 1,100,000 MPN organisms per 100 mL and fecal coliform from low 23 to 170,000 MPN organisms per 100 mL. No pattern of increasing or decreasing numbers of organisms could be determined from the sample results. The Purge System had a wide range of organisms reported, both total coliform and fecal coliform were present. The range of total coliform was 230 to 500,000 MPN organisms per 100 mL. The range of fecal coliform was 2 to 23,000 MPN organisms per 100 mL.
Coliforms should be considered part of the normal flora of an aquaculture system. They are ubiquitous in the environment and cannot be eliminated. The UVI aquaculture systems are outdoors and open to wildlife and domestic animal contact. Changing this condition would require extensive modification of the system and change the essential nature of the systems. Farmers could set up fencing and nets to reduce intrusions but contact with coliforms is unlikely to be eliminated.
High levels of these indicator bacteria have little or no influence on the quality of fish for human consumption. While alive, the fish is protected from waterborne contaminants by the mucus, scales and skin covering its body. Proper fish cleaning, rinsing, refrigeration and cooking should always be used. This will eliminate the pathogenic bacteria from the food. The implementation of a Hazard Analysis Critical Control Point (HACCP) plan at a fish processing facility will guard the safety of food fish from the farm to the point of sale. The public health risk from eating tilapia produced and sold from UVI designed aquaculture systems cannot be determined from this research. Epidemiological studies that trace illness and disease back to their point of origin are needed to determine if and when coliforms present in aquaculture systems cause disease. The USVI Department of Public Health had no cases reported cases of illness caused by E. coli in the 52 week period ending March 3, 2006 (MWWR 2006. 55:08 p.223). References Eaton, A.D., L.S. Clesceri, and A.E. Greenberg. eds. 1995. Standard Methods for the
Examination of Water and Wastewater. 19th Edition. American Public Health Association. Washington, DC.
Morbidity and Mortality Weekly Review. March 3, 2006. Vol. 55/No. 8. U.S. Dept. of
Health and Human Service, Center for Disease Control and Prevention. Atlanta, GA.

Speck, M.L. ed. 1976. Compendium of Methods for the Microbiological Examination of Foods. American Public Health Association. Washington, DC.
Assessing the Sediment Retention Function of Salt Ponds on theUS Virgin Islands Implications for Management
Basic Information
Title: Assessing the Sediment Retention Function of Salt Ponds on the US VirginIslands Implications for Management
Project Number: 2005VI53B
Start Date: 3/1/2005
End Date: 2/28/2006
Funding Source: 104B
Congressional District: Not applicable
Research Category: Water Quality
Focus Category: Wetlands, Water Quality, Methods
Descriptors:
Principal Investigators: Denise Rennis, Barry Devine, Colin Finney
Publication
Problem and Research Objectives Salt ponds and the specialized salt-tolerant vegetation communities that they support perform a variety of biological, hydrologic and water quality functions with benefits to both wildlife and humans. In the case of sediments in surface water runoff, salt ponds act as a retention basin (Brody et al., 1970; Hodge, undated; Brin et al., 2003) and facilitate deposition of particles within the pond or among the dense root systems of the plants fringing the pond. Methodologies that use a functional approach to habitat assessment are considered to give a balanced perspective of the attributes wetlands provide not only to wildlife but also to society on a sustainable basis (Adamus and Field, 2001). Unfortunately these methodologies are limited, in part, due to a lack of understanding of wetland formation and maintenance processes, particularly in highly altered landscapes (Adamus and Field, 2001). The goal of this study was to evaluate the effectiveness of the sediment retention function of salt ponds and the pond watersheds (salt pond systems) in the US Virgin Islands. To attain this goal, the following objectives were carried out: 1. Identify and evaluate the features of salt pond systems that are important in contributing to the
effectiveness of sediment retention;
2. Evaluate historical changes and trends to the functional capacity of USVI salt pond systems to retain sediments in order to enable sound regulatory and land-use management decisions that will help to ensure a high functional performance;
3. Evaluate remote sensing as a management tool to predict and monitor the performance of sediment retention in salt pond systems.
Methodology The methodology involved seven distinct tasks: 1. Rainfall data between the years 2000 and 2005 were reviewed for a number of stations located on
St. Thomas, St. John and St. Croix. Rain events exceeding 1.0 inch (2.5 cm) of daily precipitation and major storm events in which daily rainfall exceeded 4 inches (10 cm) were identified in order to help focus the search for appropriate remote sensing imagery that would document near-shore coastal sedimentation from terrestrial sources. Average annual rainfall patterns across the islands were also examined to aid in the evaluation of site-specific conditions.
2. Functional assessment methodologies were reviewed to identify pond and watershed parameters considered to be important in contributing to the ability or the effectiveness of a salt pond to trap and retain sediments. An initial set of 40 parameters was identified, and from this, a sub-set of 13 was selected based on i) identification by the local survey team as being applicable to salt ponds in the US Virgin Islands and ii) ability to easily and rapidly collect the information.
3. Site visits to 25 salt ponds were made in order to identify salt pond systems that represented a range of conditions of both natural and human-induced origins. Of the 25 sites initially visited,
17 salt pond systems were selected for further data collection. These were grouped into high, medium or low disturbance categories based on specific land-use criteria.
4. Department of Planning and Natural Resources (DPNR) permits and Environmental Assessment reviews were examined for any development applications affecting the selected 17 ponds. Aerial photographs from 1947-1999 were identified and examined for changes that have occurred over time to the salt pond features.
5. Data for 13 different parameters were obtained through either field collection or through the use of maps. Field collection of data took place between March and December 2005 for parameters that could not be obtained from available maps. The remaining parameters were calculated using GIS-based digital orthophotography.
6. Analysis of the data included justification of parameter inclusion based on literature documentation; analysis of the data with respect to documented performance criteria, site variability and disturbance levels; and evaluation of site-specific features. A conclusion was formulated as to whether the parameter provided evidence of the functioning condition of the salt pond systems. Values of the measured parameters were shown in bar-graph form with each of the disturbance categories (H, M, L) grouped together to facilitate analysis and discussion. The assumption inherent in the analysis was that the selected parameter played an important role in sediment retention.
7. An evaluation was carried out on the use of remote sensing imagery as a tool for monitoring sediment in the nearshore water column. This included an assessment of both Landsat satellite imagery and aerial photography.
Principal Findings and Significance
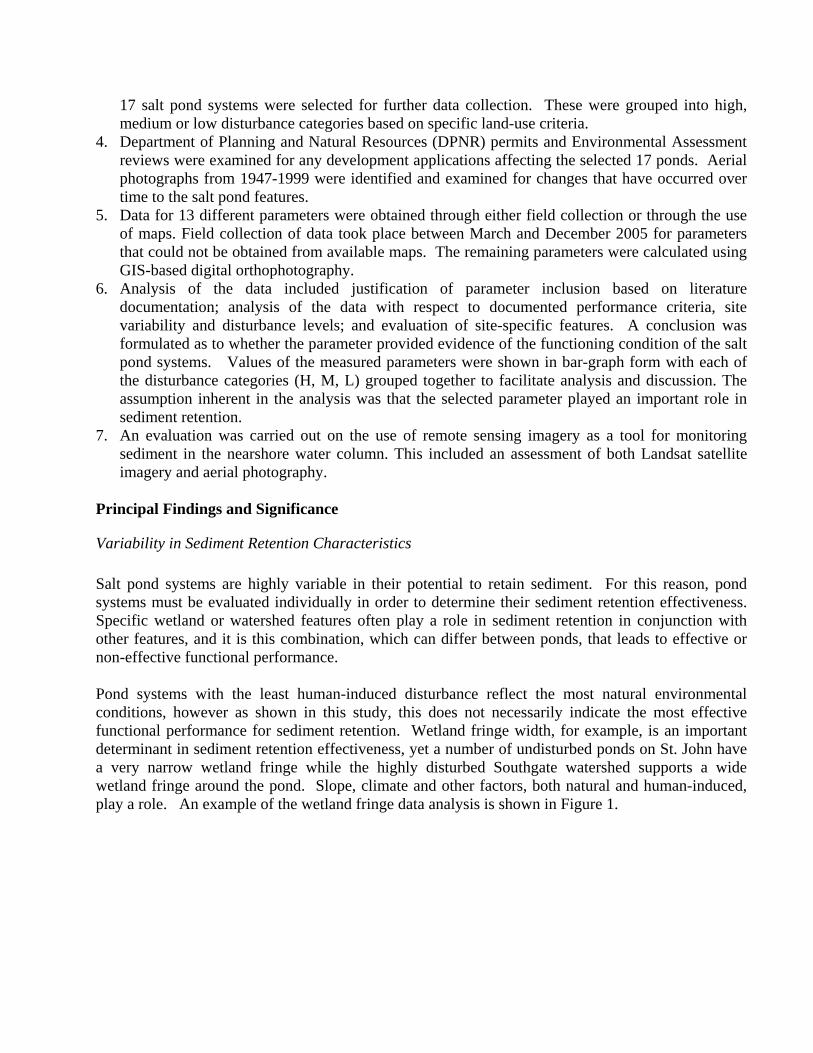
Variability in Sediment Retention Characteristics Salt pond systems are highly variable in their potential to retain sediment. For this reason, pond systems must be evaluated individually in order to determine their sediment retention effectiveness. Specific wetland or watershed features often play a role in sediment retention in conjunction with other features, and it is this combination, which can differ between ponds, that leads to effective or non-effective functional performance. Pond systems with the least human-induced disturbance reflect the most natural environmental conditions, however as shown in this study, this does not necessarily indicate the most effective functional performance for sediment retention. Wetland fringe width, for example, is an important determinant in sediment retention effectiveness, yet a number of undisturbed ponds on St. John have a very narrow wetland fringe while the highly disturbed Southgate watershed supports a wide wetland fringe around the pond. Slope, climate and other factors, both natural and human-induced, play a role. An example of the wetland fringe data analysis is shown in Figure 1.
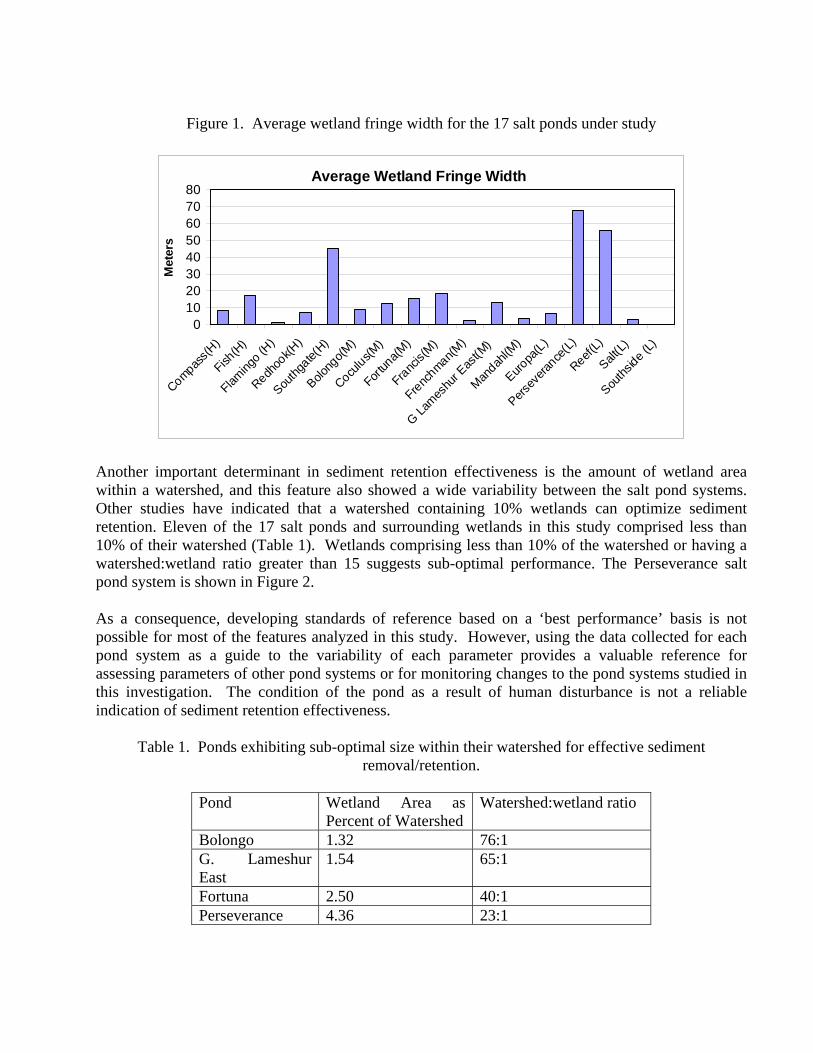
Figure 1. Average wetland fringe width for the 17 salt ponds under study
Average Wetland Fringe Width
01020304050607080
Compass(H
)
Fish(H
)
Flaming
o (H)
Redhoo
k(H)
Southg
ate(H)
Bolong
o(M)
Coculus(M
)
Fortun
a(M)
Francis(
M)
Frenchman(M
)
G Lames
hur E
ast(M
)
Mandah
l(M)
Europa
(L)
Persev
erance
(L)
Reef(L)
Salt(L)
Souths
ide (L)
Met
ers
Another important determinant in sediment retention effectiveness is the amount of wetland area within a watershed, and this feature also showed a wide variability between the salt pond systems. Other studies have indicated that a watershed containing 10% wetlands can optimize sediment retention. Eleven of the 17 salt ponds and surrounding wetlands in this study comprised less than 10% of their watershed (Table 1). Wetlands comprising less than 10% of the watershed or having a watershed:wetland ratio greater than 15 suggests sub-optimal performance. The Perseverance salt pond system is shown in Figure 2. As a consequence, developing standards of reference based on a ‘best performance’ basis is not possible for most of the features analyzed in this study. However, using the data collected for each pond system as a guide to the variability of each parameter provides a valuable reference for assessing parameters of other pond systems or for monitoring changes to the pond systems studied in this investigation. The condition of the pond as a result of human disturbance is not a reliable indication of sediment retention effectiveness.
Table 1. Ponds exhibiting sub-optimal size within their watershed for effective sediment removal/retention.
Pond Wetland Area as
Percent of Watershed Watershed:wetland ratio
Bolongo 1.32 76:1 G. Lameshur East
1.54 65:1
Fortuna 2.50 40:1 Perseverance 4.36 23:1
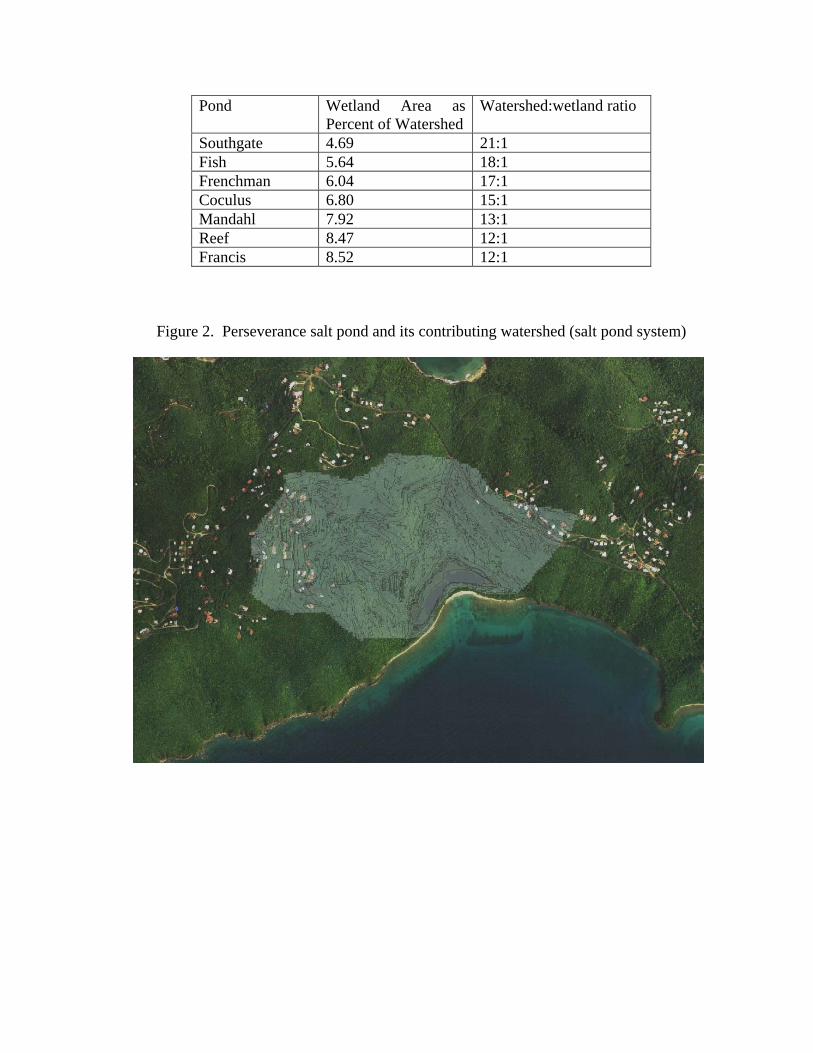
Pond Wetland Area as Percent of Watershed
Watershed:wetland ratio
Southgate 4.69 21:1 Fish 5.64 18:1 Frenchman 6.04 17:1 Coculus 6.80 15:1 Mandahl 7.92 13:1 Reef 8.47 12:1 Francis 8.52 12:1
Figure 2. Perseverance salt pond and its contributing watershed (salt pond system)
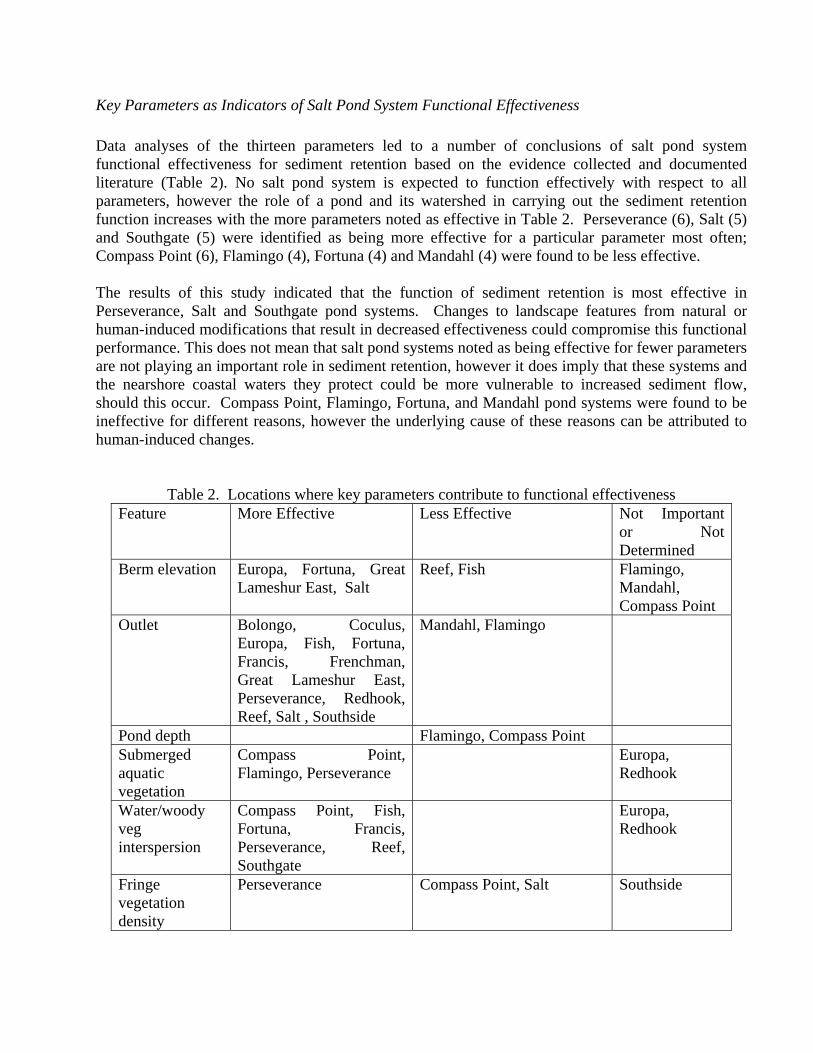
Key Parameters as Indicators of Salt Pond System Functional Effectiveness Data analyses of the thirteen parameters led to a number of conclusions of salt pond system functional effectiveness for sediment retention based on the evidence collected and documented literature (Table 2). No salt pond system is expected to function effectively with respect to all parameters, however the role of a pond and its watershed in carrying out the sediment retention function increases with the more parameters noted as effective in Table 2. Perseverance (6), Salt (5) and Southgate (5) were identified as being more effective for a particular parameter most often; Compass Point (6), Flamingo (4), Fortuna (4) and Mandahl (4) were found to be less effective. The results of this study indicated that the function of sediment retention is most effective in Perseverance, Salt and Southgate pond systems. Changes to landscape features from natural or human-induced modifications that result in decreased effectiveness could compromise this functional performance. This does not mean that salt pond systems noted as being effective for fewer parameters are not playing an important role in sediment retention, however it does imply that these systems and the nearshore coastal waters they protect could be more vulnerable to increased sediment flow, should this occur. Compass Point, Flamingo, Fortuna, and Mandahl pond systems were found to be ineffective for different reasons, however the underlying cause of these reasons can be attributed to human-induced changes.
Table 2. Locations where key parameters contribute to functional effectiveness Feature More Effective Less Effective Not Important
or Not Determined
Berm elevation Europa, Fortuna, Great Lameshur East, Salt
Reef, Fish Flamingo, Mandahl, Compass Point
Outlet Bolongo, Coculus, Europa, Fish, Fortuna, Francis, Frenchman, Great Lameshur East, Perseverance, Redhook, Reef, Salt , Southside
Mandahl, Flamingo
Pond depth Flamingo, Compass Point Submerged aquatic vegetation
Compass Point, Flamingo, Perseverance
Europa, Redhook
Water/woody veg interspersion
Compass Point, Fish, Fortuna, Francis, Perseverance, Reef, Southgate
Europa, Redhook
Fringe vegetation density
Perseverance Compass Point, Salt Southside
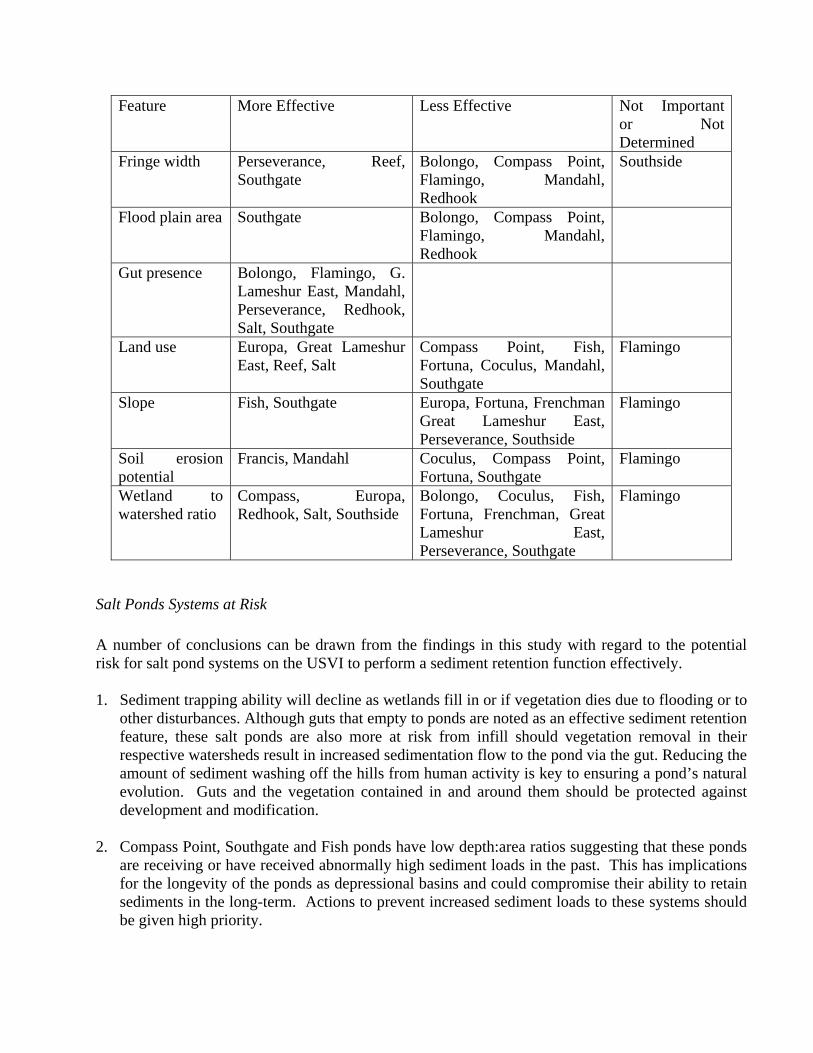
Feature More Effective Less Effective Not Important or Not Determined
Fringe width Perseverance, Reef, Southgate
Bolongo, Compass Point, Flamingo, Mandahl, Redhook
Southside
Flood plain area Southgate Bolongo, Compass Point, Flamingo, Mandahl, Redhook
Gut presence Bolongo, Flamingo, G. Lameshur East, Mandahl, Perseverance, Redhook, Salt, Southgate
Land use Europa, Great Lameshur East, Reef, Salt
Compass Point, Fish, Fortuna, Coculus, Mandahl, Southgate
Flamingo
Slope Fish, Southgate Europa, Fortuna, Frenchman Great Lameshur East, Perseverance, Southside
Flamingo
Soil erosion potential
Francis, Mandahl Coculus, Compass Point, Fortuna, Southgate
Flamingo
Wetland to watershed ratio
Compass, Europa, Redhook, Salt, Southside
Bolongo, Coculus, Fish, Fortuna, Frenchman, Great Lameshur East, Perseverance, Southgate
Flamingo
Salt Ponds Systems at Risk A number of conclusions can be drawn from the findings in this study with regard to the potential risk for salt pond systems on the USVI to perform a sediment retention function effectively. 1. Sediment trapping ability will decline as wetlands fill in or if vegetation dies due to flooding or to
other disturbances. Although guts that empty to ponds are noted as an effective sediment retention feature, these salt ponds are also more at risk from infill should vegetation removal in their respective watersheds result in increased sedimentation flow to the pond via the gut. Reducing the amount of sediment washing off the hills from human activity is key to ensuring a pond’s natural evolution. Guts and the vegetation contained in and around them should be protected against development and modification.
2. Compass Point, Southgate and Fish ponds have low depth:area ratios suggesting that these ponds
are receiving or have received abnormally high sediment loads in the past. This has implications for the longevity of the ponds as depressional basins and could compromise their ability to retain sediments in the long-term. Actions to prevent increased sediment loads to these systems should be given high priority.
3. Although there is no information on the trigger level for human disturbance beyond which a
negative impact might be expected on steeper gradients, watersheds where land modification has exceeded 10% of steep slopes should be monitored for sediment flow to the lower watershed. These include Southgate, Compass Point, Fortuna, Coculus and Mandahl on St. Thomas and Fish on St. John.
4. The greater proportion of roads to other land-use categories in the Fish, Redhook and Frenchman
pond watersheds suggests that these watersheds may experience a loss of vegetated slopes to development in the near future which could further stress the effectiveness of sediment retention. Actions to protect the lower watershed from increased sediment loads should be given high priority.
5. Pond systems with a high Kf-factor that are outside the development protection afforded by the
Virgin Islands National Park system will be more at risk from land-use changes and consequently have more potential for erosion. These include Bolongo, Coculus, Compass Point, Fortuna, Frenchman and Perseverance ponds on St. Thomas and Fish and Southside ponds on St. John. Actions to limit removal of vegetation in these watersheds should be given high priority.
6. The causeway separating Southgate Pond from the marina appears to be at an adequate height to
preserve sediment retention functional performance in the reduced pond, however changes to the historical pond configuration and land-use activities in the upper watershed may be causing reduced sediment retention within the adjacent East Gut with potential damage to nearshore coastal waters. Measures to improve flow reduction, sediment retention and sediment filtering capacity of the East Gut should be implemented.
7. Perseverance and Southgate pond systems are noted as functioning effectively for a number of
key parameters, however, these ponds are also noted as being small relative to their watershed. As a consequence, small land-use changes in the watershed could negatively impact the functional performance of these ponds and threaten the sensitive nearshore coastal resources beyond. Protection of existing vegetation cover and limiting further development or road construction in these watersheds should be given high priority.
Functional Assessment in Management The sustainable management of coastal wetland resources is fundamental to the protection of nearshore coastal resources. Sustainable management is brought about by sound land-use and regulatory decisions, which in turn are limited by the quality of information available to the decision makers. Land managers should ensure that effects from changes to land use do not result in changes to the key parameters that are outside the limits of its range, after evaluating site-specific considerations. This will help to ensure that salt pond systems continue to function effectively with respect to sediment retention so that sensitive downstream resources are not damaged.
A number of recommendations are likely to be of interest in management decisions. These include:
• Deep, straight channels behind the beach berm, such as found at Reef pond, may cause earlier or more frequent breaching of the berm than would occur naturally. This would reduce sediment retention effectiveness and warrants further investigation.
• The ratio of pond depth to surface area is a good indicator for identifying a potentially
impacted condition. • The extensive root network of the mangrove community in the wetland fringe creates a high
frictional resistance to water flow, aiding in the trapping and retention of sediment. The presence of a dense mangrove community is a good indicator of effective sediment retention. Measures to increase mangrove density should be applied where appropriate.
• Where conditions allow the development of a wetland fringe, the greater the fringe width, the
more effective the functional performance of sediment retention will be. Land-use decisions that could hinder the development of the wetland fringe or reduce the wetland fringe should be avoided.
• Human disturbance in the watershed is an important factor affecting the potential functional
effectiveness of sediment retention. To help protect the function, land-use modification should not exceed 25% of the pond watershed, however conditions in the watershed may warrant less than this amount.
• The flood plain is an important contributor to sediment retention, and development within the
flood plain should be avoided.
• The berm creates an extremely effective impoundment which is arguably the most important sediment retention feature; creating an opening in the berm will reduce the functional effectiveness of a pond and should be avoided.
Remote Sensing as a Management Tool Monitoring turbidity events in the nearshore coastal zone will provide evidence to the effectiveness of sediment retention features in the adjacent watershed. Landsat images can be used to illustrate suspended sediment in inshore waters but routine use of Landsat imagery to detect and monitor suspended sediment in the coastal waters of the USVI is unfeasible. Although personal observations of the authors of this report and others indicate that suspended sediment plumes are to be found in the nearshore waters of the USVI, we were able to find no evidence of suspended sediment associated with salt ponds and only limited evidence of suspended sediment at any location in the USVI in the Landsat imagery we examined. This limited evidence of suspended sediment was only associated with extreme precipitation events, more than 23 cm (9 inches) of rain over two to three days. Our inability to find evidence of sediment in coastal waters of the USVI may be due to a number of factors. First, small volcanic islands with a thin layer of topsoil and no perennial streams or rivers
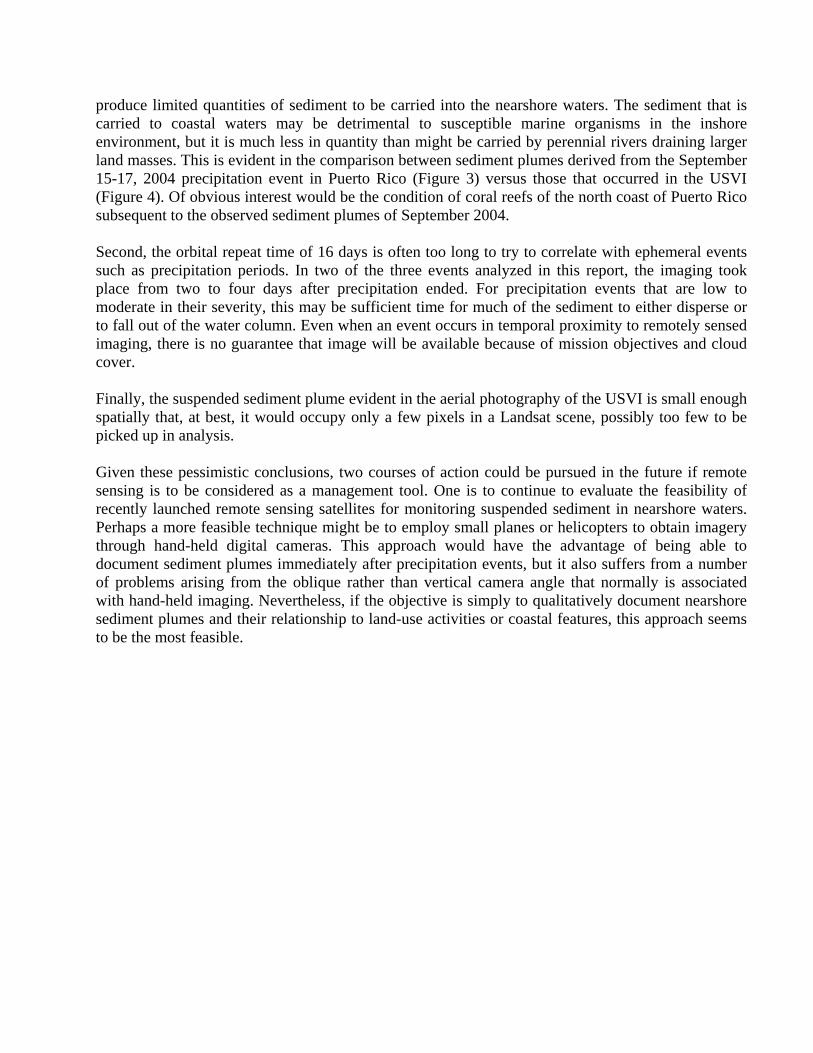
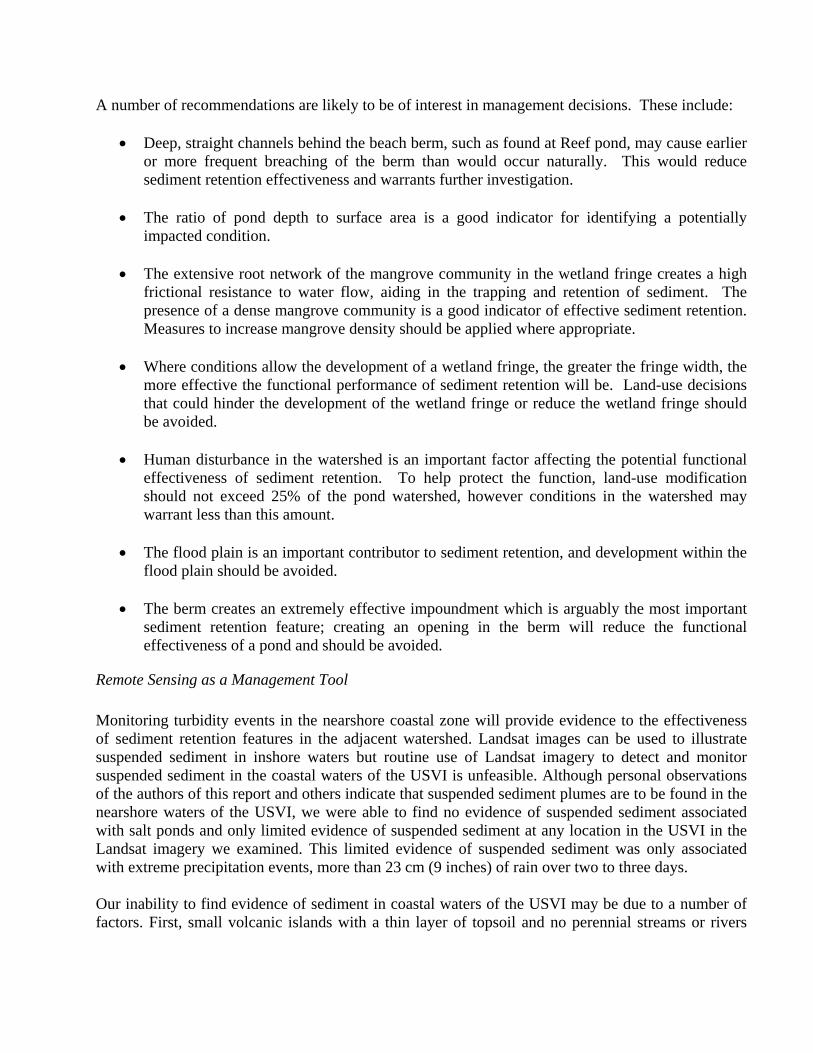
produce limited quantities of sediment to be carried into the nearshore waters. The sediment that is carried to coastal waters may be detrimental to susceptible marine organisms in the inshore environment, but it is much less in quantity than might be carried by perennial rivers draining larger land masses. This is evident in the comparison between sediment plumes derived from the September 15-17, 2004 precipitation event in Puerto Rico (Figure 3) versus those that occurred in the USVI (Figure 4). Of obvious interest would be the condition of coral reefs of the north coast of Puerto Rico subsequent to the observed sediment plumes of September 2004. Second, the orbital repeat time of 16 days is often too long to try to correlate with ephemeral events such as precipitation periods. In two of the three events analyzed in this report, the imaging took place from two to four days after precipitation ended. For precipitation events that are low to moderate in their severity, this may be sufficient time for much of the sediment to either disperse or to fall out of the water column. Even when an event occurs in temporal proximity to remotely sensed imaging, there is no guarantee that image will be available because of mission objectives and cloud cover. Finally, the suspended sediment plume evident in the aerial photography of the USVI is small enough spatially that, at best, it would occupy only a few pixels in a Landsat scene, possibly too few to be picked up in analysis. Given these pessimistic conclusions, two courses of action could be pursued in the future if remote sensing is to be considered as a management tool. One is to continue to evaluate the feasibility of recently launched remote sensing satellites for monitoring suspended sediment in nearshore waters. Perhaps a more feasible technique might be to employ small planes or helicopters to obtain imagery through hand-held digital cameras. This approach would have the advantage of being able to document sediment plumes immediately after precipitation events, but it also suffers from a number of problems arising from the oblique rather than vertical camera angle that normally is associated with hand-held imaging. Nevertheless, if the objective is simply to qualitatively document nearshore sediment plumes and their relationship to land-use activities or coastal features, this approach seems to be the most feasible.
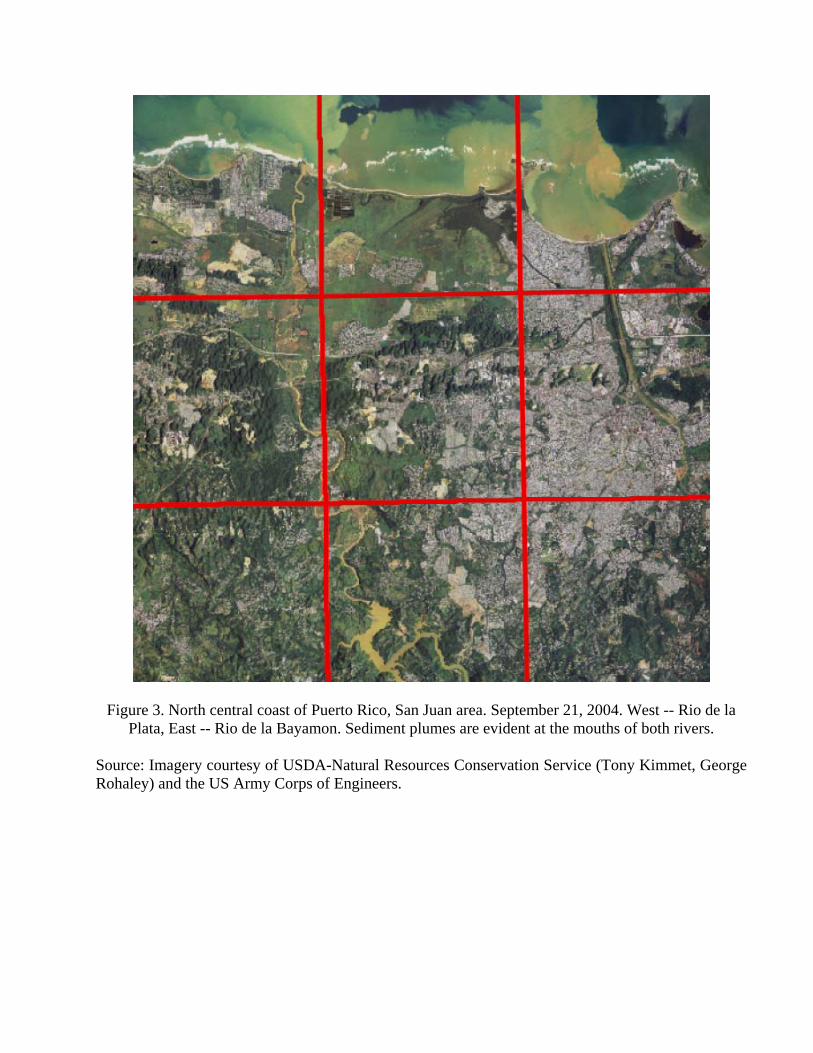
Figure 3. North central coast of Puerto Rico, San Juan area. September 21, 2004. West -- Rio de la Plata, East -- Rio de la Bayamon. Sediment plumes are evident at the mouths of both rivers.
Source: Imagery courtesy of USDA-Natural Resources Conservation Service (Tony Kimmet, George Rohaley) and the US Army Corps of Engineers.
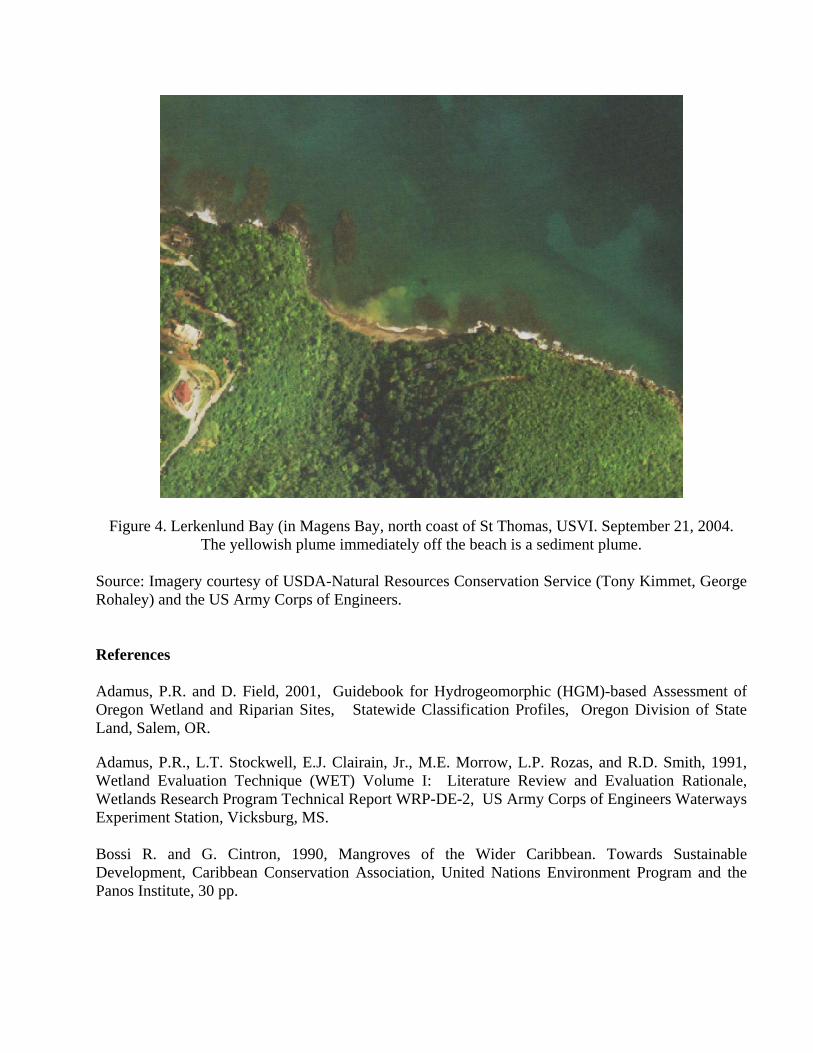
Figure 4. Lerkenlund Bay (in Magens Bay, north coast of St Thomas, USVI. September 21, 2004. The yellowish plume immediately off the beach is a sediment plume.
Source: Imagery courtesy of USDA-Natural Resources Conservation Service (Tony Kimmet, George Rohaley) and the US Army Corps of Engineers. References Adamus, P.R. and D. Field, 2001, Guidebook for Hydrogeomorphic (HGM)-based Assessment of Oregon Wetland and Riparian Sites, Statewide Classification Profiles, Oregon Division of State Land, Salem, OR.
Adamus, P.R., L.T. Stockwell, E.J. Clairain, Jr., M.E. Morrow, L.P. Rozas, and R.D. Smith, 1991, Wetland Evaluation Technique (WET) Volume I: Literature Review and Evaluation Rationale, Wetlands Research Program Technical Report WRP-DE-2, US Army Corps of Engineers Waterways Experiment Station, Vicksburg, MS. Bossi R. and G. Cintron, 1990, Mangroves of the Wider Caribbean. Towards Sustainable Development, Caribbean Conservation Association, United Nations Environment Program and the Panos Institute, 30 pp.
Brin, G., L. Bossi, P. Buscemi, H. Cheslek, A. Gangemi, M. Miilu, D. Rose and C. Stevens, 2003, Water resources and the wetlands study for Haiti and the US Virgin Islands, Caribbean Research Association for the Betterment of Water Resources (CRABS) through the Department of Civil and Environmental Engineering, Massachusetts Institute of Technology, Cambridge, Massachusetts, http://ceeserver3.mit.edu/Final%20Project%20Report.pdf
Brody, R.W., D.I. Grigg, D.M. Raup and R.P. vanEepoel, 1970, A study of the waters, sediment and biota of Chocolate Hole, St. John, with comparison to Cruz Bay, St. John, Prepared for the Government of the Virgin Islands, Department of Health, Division of Environmental Health.
Hodge, J.D., undated, Finding Solutions: Sustainable Coastal Development, Presentation, http://www.nmsfocean.org/chow/Hodge.pdf
Island Resources Foundation, 1977, Water sediments and ecology of the Mangrove Lagoon and Benner Bay, St. Thomas, Unpublished report, Department of Conservation and Cultural Affairs, Natural Resources Management, St. Thomas.
Nemeth, R.S. and J.S. Nowlis, 2001, Monitoring the effects of land development on the near-shore reef environment of St. Thomas, USVI, Bulletin of Marine Science, 69(2), 759-775.
PERL (Pacific Estuarine Research Laboratory), 1990, A Manual For Assessing Restored And Natural Coastal Wetlands, San Diego State University, California Sea Grant College publication.
Stengel, C., 1998, The Survey of the Salt Ponds of the US Virgin Islands, Department of Planning and Natural Resources Final Report, EPA Wetlands Protection C-21.
Information Transfer ProgramThe Water Resources Research Institute at the University of the Virgin Islands is the only unit in theVirgin islands having as its primary mission the conduct of research, dissemination of information andconducting training related to water resources. The VI-WRRI takes this as a very serious responsibility.The public in the Virgin Islands has come to and continues to rely on the WRRI provide information onnew developments having to do with water resources.
Three of the projects summarized below focused on providing information and providing training. Theseactivities were all related to situations that deal with peculiarities of water management in insular settings.The information and training provided by the VI-WRRI most likely could not have been obtainedelsewhere.
The VI-WRRI disseminates its information and provides training through a wide range of sources. In theproject Coral Bay Watershed: Development of Management Measures for Sediment and PollutionReduction the sharing of information and training took place in community meetings. The project VirginIslands Water Conference and Sixth Caribbean Islands Water Resources Congress used a largeterritory-wide meeting and in Improving Water Quality Research Through Hands-onHydrography/Hydrology Training focus was placed on individual training. All other projects conducted atthe WRRI also contain information dissemination elements.
The VI-WRRI maintains a web page on which information on activities being conducted by the WRRI isposted. This web page also makes real-time and historical data from the VI-WRRI meteorological stationavailable to the public. Researchers conducting investigations through the WRRI are encouraged to sharetheir findings through public presentations at seminars and workshops and by way of publications inrefereed and other means. Students UVI and other schools and other groups benefit regularly from fieldtrips and lectures and other presentations made possible through the WRRI. Lastly the UniversitysResearch and Public Service Newsletter is used to disseminate information on work being done at theInstitute and the opportunities that it offers.
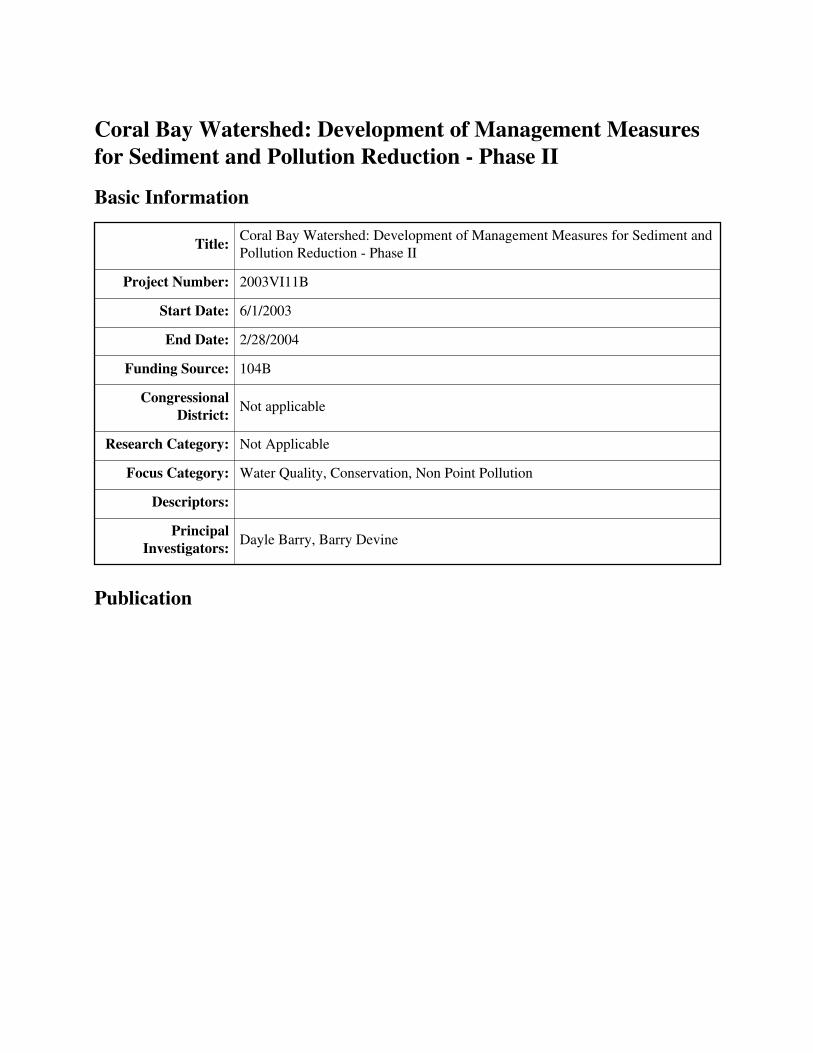
Coral Bay Watershed: Development of Management Measuresfor Sediment and Pollution Reduction - Phase II
Basic Information
Title: Coral Bay Watershed: Development of Management Measures for Sediment andPollution Reduction - Phase II
Project Number: 2003VI11B
Start Date: 6/1/2003
End Date: 2/28/2004
Funding Source: 104B
Congressional District: Not applicable
Research Category: Not Applicable
Focus Category: Water Quality, Conservation, Non Point Pollution
Descriptors:
Principal Investigators: Dayle Barry, Barry Devine
Publication
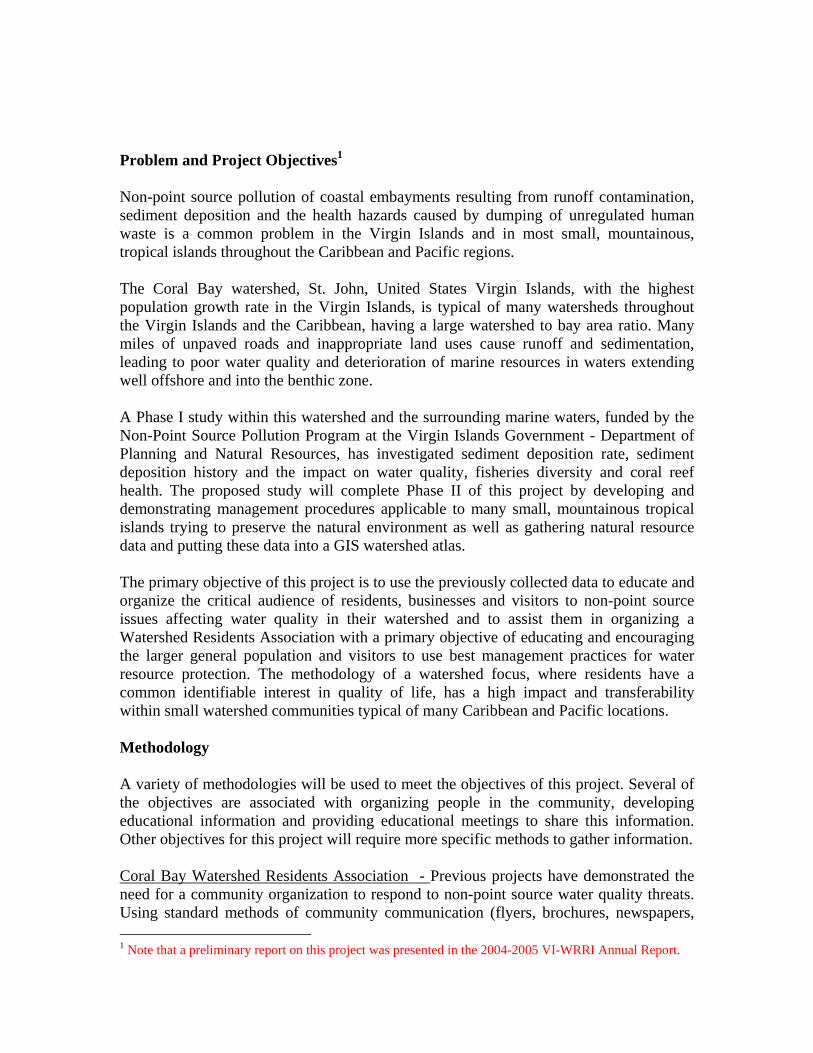
Problem and Project Objectives1 Non-point source pollution of coastal embayments resulting from runoff contamination, sediment deposition and the health hazards caused by dumping of unregulated human waste is a common problem in the Virgin Islands and in most small, mountainous, tropical islands throughout the Caribbean and Pacific regions. The Coral Bay watershed, St. John, United States Virgin Islands, with the highest population growth rate in the Virgin Islands, is typical of many watersheds throughout the Virgin Islands and the Caribbean, having a large watershed to bay area ratio. Many miles of unpaved roads and inappropriate land uses cause runoff and sedimentation, leading to poor water quality and deterioration of marine resources in waters extending well offshore and into the benthic zone.
A Phase I study within this watershed and the surrounding marine waters, funded by the Non-Point Source Pollution Program at the Virgin Islands Government - Department of Planning and Natural Resources, has investigated sediment deposition rate, sediment deposition history and the impact on water quality, fisheries diversity and coral reef health. The proposed study will complete Phase II of this project by developing and demonstrating management procedures applicable to many small, mountainous tropical islands trying to preserve the natural environment as well as gathering natural resource data and putting these data into a GIS watershed atlas. The primary objective of this project is to use the previously collected data to educate and organize the critical audience of residents, businesses and visitors to non-point source issues affecting water quality in their watershed and to assist them in organizing a Watershed Residents Association with a primary objective of educating and encouraging the larger general population and visitors to use best management practices for water resource protection. The methodology of a watershed focus, where residents have a common identifiable interest in quality of life, has a high impact and transferability within small watershed communities typical of many Caribbean and Pacific locations. Methodology A variety of methodologies will be used to meet the objectives of this project. Several of the objectives are associated with organizing people in the community, developing educational information and providing educational meetings to share this information. Other objectives for this project will require more specific methods to gather information. Coral Bay Watershed Residents Association - Previous projects have demonstrated the need for a community organization to respond to non-point source water quality threats. Using standard methods of community communication (flyers, brochures, newspapers, 1 Note that a preliminary report on this project was presented in the 2004-2005 VI-WRRI Annual Report.
radio ads and word of mouth) a residents association was organized to meet and discuss activities to protect water quality of Coral Bay. Stakeholders were organized to form committees to address specific issues. The Coral Bay Community Council formed and elected a board of directors, began a membership drive, held monthly information and educational meetings and focuses on community issues. Island Green Building Association – Using a model developed by the National Green Building Association, a group of concerned residents, both professional and lay persons, formed, elected a Board and began the effort to develop Green Building Standards for use in the USVI as well as on nearby islands. Methods for this organization included development of membership, local advertising, Sustainable Green Building standards and educational events to inform the public and private organizations about the impact of inappropriate land use on coastal water quality. Coral Reef and Natural Resource Assessment – This effort will use the Coral Reef Video Transect Sampling methodology currently in use by U.S. Geological Survey, National Park Service and the University of the Virgin Islands to survey the natural resources of the inner harbor and greater bay area and develop a map of these resource locations for use in planning and management of bay waters. Conceptual Stormwater Management Plan, Coral Bay Watershed - A professional Engineering Firm was hired to complete the task of gathering, modeling and evaluating hydraulic studies of the watershed using the TR55 methodology and physical data supplied by the University’s Conservation Data Center’s Geographic Information System data layers. From these data, preliminary sediment retention and detention ponds and end-of pipe structures were sized sited and proposed for reducing inputs to bay water quality. Drainage computations once completed, and preliminary calculations will determine the stormwater alternatives available to address the sedimentation and runoff problems using standard and new, innovative approaches to protecting water quality in steep, tropical watersheds. Watershed Atlas – Using existing GIS methodology, all data layers useful for watershed planning will be gathered into a hardcopy and digital atlas of the Coral Bay watershed. This will include data layers for topography, vegetation, marine communities, slope analysis, watershed bounds, National Park bounds, Coral Reef National Monument bounds, Area of Particular Concern bounds, soils, bathymetry, flood hazard, existing and proposed zoning and land use changes. Coral Bay Roads Mapping and Rescue Locator System Using Geographic Information System technology, road types (primary, secondary, paved and unpaved) were mapped throughout the watershed to understand the extent of pervious and impervious surfaces and their potential impact on water resources. Principal Findings and Significance
This project commenced on February 1, 2004. Activities completed include the following:
1. Watershed Residents Community Organization- A Residents Association, the
Coral Bay Community Council was organized in February 2004 and membership to date is over 185 of 700 residents. Four committees have been formed; Land Use and Watershed Protection, Ocean Use and Protection, Infrastructure and Services, and Watershed History and Preservation. All committees are active in educating, informing and organizing residents, making choices and implementing Best Management Practices (BMPs). Monthly meetings are held to provide educational programs for residents, Coastal Zone Management and Planning and Natural Resource issues are reviewed and recommendations made, and the group organizes data gathering efforts to provide water quality and natural resource strategies. A website ( www. coralbaycommunitycouncil.org ) provides current information on the group’s activities.
2. Island Green Building Association (IGBA) – A Best Management Practices
(BMP) organization was formed in August 2004. This group developed a publication, “Guiding Principles of Sustainable Green Building Design and Construction” for educating residents, contractors, and government staff in the best management practices. In addition, a website ( www.igba-stjohn.org) was developed to provide current and innovative methods to protect the landscape and water quality around the island. The organization while new, has met monthly, gotten numerous articles published in several local newspapers and provided more than a dozen presentations to local businesses and groups.
3. Watershed Brochure – A watershed brochure has been completed. This
publication has been made available to all residents and describes the resources and issues prevalent in Coral Bay watershed. Contact information for the community organization is also provided.
4. GIS Watershed Atlas – Strategic planning to protect water quality resources
requires the latest information in a digital and printable hardcopy format. The initial data layers for the atlas were gathered and developed into a work-in progress atlas of physical, geographic and biological information. These include layers and maps of topography, vegetation, marine communities, slope analysis, watershed bounds, soils, bathymetry, flood hazard, existing and proposed zoning and land use changes, National Park bounds (VINP), Coral Reef National Monument (VICRNM) bounds, and Area of Particular Concern bounds (APC).
5. Preliminary Stormwater Management Plan – Final delivery of the “Conceptual
Stormwater Management Plan – Coral Bay Watershed, Final Letter Report (May 2005)” has been received from Camp, Dresser, McKee Inc. This detailed report includes, background, data collection, preliminary engineering analysis, hydrologic model, conceptual design alternatives analysis and recommendations for addressing stormwater management from a watershed perspective.
6. Natural Resource Inventory and Reef Assessment – A preliminary report
“Outline for a Coral Bay Area of Particular Concern Marine Inventory” was completed. GIS maps were generated of all existing marine resources will be used to assist in long term planning for the bay and to provide the necessary data for addressing CZM applications within the watershed.
7. Coral Bay Road and Home Maps – The location, size and type of roads in the watershed are critical factors for determining problematic sediment locations. The GIS road and residence data layers have been completed. These data will be incorporated into the Atlas, but the data will also be used to identify problem areas within the watershed for priority restoration. This information was developed into a GIS database and hardcopy mapping of problem areas, guts, home locations, drainage structures took place. The information is used to assist in determining priorities for development of the stormwater management plan. In addition, as the island has no mapping for rescue due to lack of maps and street names, the system is being adapted by St. John Rescue, emergency medical technicians, fire and police as a means of locating and reaching residents in medical emergencies.
Outreach and Information Dissemination Activities Presentations The following presentations of information have been made regarding this project to the Coral Bay Community Council or by persons involved in these projects 1. “Coral Bay Sediment and Reef Assessment Project” (3 presentations) – Barry Devine
Coral Bay Community Organization St. John Rotary NOAA/EPA Land-Based Sources of Pollution Conference –
2. Cooperative Extension Service – “Keeping a Healthy Septic System”, 3. “Planting for erosion control and drought tolerance”. – Eleanor Gibney 4. “Visioning – Planning the Future of Coral Bay” Terri Mars (planning workshop) 5. “Infrastructure Plans for Coral Bay” – Ira Wade, Dept. of Public Works 6. “ Comprehensive Land Use Plans and Zoning Revisions” – CZM/DPNR 7. “Coastal Zone Management and Building Regulations” – Bill Rohring, CZM 8. “ The Coral Reef Early Warning System” – Jim Hendee, NOAA 9. “ Calabash Boom Affordable Housing Project” – Clifford Graham, VIHFA 10. “ Natural Resources Inventory of Coral Bay” – Kimberly Myers 11. “Meet Your Virgin Islands Senators” – Senators, David, Hill and Barschinger 12. “ Innovative Cable and Telephone Services” – Innovative 13. “ Island Green Building Association Guidelines” –
Coral Bay Community Council - Doug White, Architect St. John Rotary – Barry Devine Friends of the Virgin Islands National Park – Joe Kessler

St. John Realtors Association General Meeting – Barry Devine VI Territorial Realtors Association – Christy O’Neill
Vermont Law School Colloquium – Brian Bell St. John Flower and Garden Show – Barry Devine Maho Bay Sustainable Building Forum – Brian Bell 14. “ Emmaus Moravian Church Development Plans” – Karl Percell, Attorney 15. “Voter Registration Drive” – Coral bay Community Council 16. “Coral Bay Roads, Signs and Emergency Services” – Kent Irish 17. “ VI Police Department Neighborhood Watch” – St. John Police Dept.
Other Outreach Activities
Coral Bay Watershed Residents Association
• Coral Bay Community Council (CBCC) brochure. Watershed resources, issues and membership information. 1000 printed and distributed.
• 175+ membership, staff of 20 volunteers • CBCC website ( www. coralbaycommunitycouncil.org ) • CBCC newsletters, newspaper articles sampling
Island Green Building Association – Best Management Practices education
• Island Green Building Association (IGBA) brochure. Mission statement,
principles for sustainable green building design. 1000 printed and distributed to builders, realtors, residents, and business people.
• Membership of 30; website (www.igba-stjohn.org) • Presentations to 6 community groups including, Rotary, Land Trust,
Vermont Law School, Maho Camps, St. John Realtors. • Meetings last Saturday of the month.
GIS Watershed Atlas
• Digital Watershed Data Atlas: The following list of more than 15 data
layers have been gathered as the foundation of this local planning tool. Future plans call for a local GIS workstation for community use.
Data layers: Topography (2’), slope analysis, watershed delineations, vegetation communities, marine communities, bathymetry, sediment deposition, guts and drainage, Area of Particular Concern boundaries, soils, wetlands, VI National Park and Coral Reef National Monument boundaries, parcels, zoning, roads and types of surface, residence locator.
• Hardcopy Atlas: A paper atlas is vital to the planning process and to residents without digital capability. However, it requires considerable artistic talent as well as time to complete. We envision an atlas of 15-20 pages based on multiple layers of
Data. We have included the first 5-6 pages of significant data layers and will continue with volunteer time to complete the full atlas.
Preliminary Stormwater Management Plan
Initial development of a Stormwater Management Plan for the entire
watershed. The consulting report completed with CDC assistance and direction includes background, data collection, preliminary engineering analysis, hydrologic model, subbasin boundaries, existing land use, soils, results and conceptual design alternatives analysis. In addition, plans and measures are offered for types of structures and potential siting locations for Phase II efforts. A number of GIS data layers are prepared along with final recommendations for engineering design.
Coral Bay Watershed Natural Resource Inventory and Reef Assessment
A draft “Outline for a Coral Bay Area of particular Concern Marine
Inventory” has been completed by an Intern working for CBCC. The paper includes Study area and site description, Scope of Inventory, Goals and Objectives, Research and Study Methods, Results, Recommendations and Appendices of biological data collected.
Coral Bay Road and Home Locator System
This initial system maps all roads within the watershed, classifies them to
type and develops quantitative information on amount of roadway surface contributing to non-point source sediment pollution. Problem drainage areas are determined and priorities are established for BMP’ development and application. In addition, the locator system sets the foundation for a rescue locator system for residents.
Recommendations
Coral Bay is a representative watershed in the Virgin Islands and across the Caribbean region. Low-level development and a high growth rate are issues that most watershed communities must deal with. The formation of a citizen’s advisory group and the thoughtful planning of local activities can provide valuable direction for a growing town. The largest and most important issues for small communities are similar and the lessons learned here can be adapted for many other locations. It is a process that is important in setting the stage for citizen action. This project involved several components, citizen action and information as well as research and data collection. The components allowed for the initiation by the residents of a local organization to assist with planning for the future within the watershed. In

addition, specific information was collected and developed for use in aiding the citizens group with their planning activities. Coral Bay has successfully organized residents and action committees to address pressing issues and take a proactive approach to the future. Several of the activities begun with this project should be continued in order to fully address needed changes for protection of water resources within the watershed.
Virgin Islands Water Conference and Sixth Caribbean IslandsWater Resources Congress
Basic Information
Title: Virgin Islands Water Conference and Sixth Caribbean Islands WaterResources Congress
Project Number: 2004VI37B
Start Date: 3/1/2004
End Date: 2/28/2005
Funding Source: 104B
Congressional District: Not applicable
Research Category: Not Applicable
Focus Category: Water Supply, Management and Planning, Education
Descriptors:
Principal Investigators: Henry H. Smith
Publication
Problem and Information Transfer Objectives1 In the U. S. Virgin Islands, responsibility for management of the water resources is split between several agencies. The Virgin Islands Water and Power Authority (WAPA) is responsible for desalination of seawater and distribution of water. The Department of Planning and Natural Resources (DPNR) has responsibility for monitoring the quality of public water supplies and for enforcement of water quality standards. Wastewater management is the responsibility of the newly created Wastewater Management Authority. The Virgin Islands Water Resources Research Institute (VI-WRRI) at the University of the Virgin Islands conducts research on water resources issues in the Virgin Islands and executes information dissemination and training programs. Additional there are several non-governmental organizations in the Virgin Islands including the Environmental Association of St. Thomas and St. John (EAST), the League of Women Voters, the St. Croix Environmental Association (SEA), the Virgin Islands Conservation Society (VICS) and several others that concern themselves with water resources matters. These various units effectively carry out their identified responsibilities however there is no provision for facilitation of the synergy that could occur due to these agencies sharing information and lessons gained in a meaningful, systematic manner. Organizations in many cases are not aware of each other’s existence and collaborations might occur in a piecemeal opportunistic fashion. It is not unusual for these units to at times be competing for the same resources to execute programs that have a common worthy goal. There is need for local discussion among groups with water resources interests to share information, develop priorities and possibly develop plans for ongoing collaboration. The problem of insularity is further compounded because while the local agencies may benefit from their associations with related agencies at the national level within the United States, they do not interact with similar agencies and groups in the neighboring Caribbean Islands with whom they might have more in common. This situation might be brought on by political affiliations and the associated difficulties of restrictions imposed by funding sources. For example, a researcher at the Virgin Islands Water Resources Research Institute in St. Thomas conducting work funded through a U. S. Geological Survey project, might travel around the globe to engage in consultation with a researcher thousands of miles away in Guam. However, in order to travel ten miles to consult with a researcher in the British Virgin Islands, special permission must be sought from the U. S. Geological Survey. An opportunity for regional dialogue on water resources is needed. The activity proposed will result in water resources interests in the U. S. Virgin Islands and the Caribbean region: 1. Developing a familiarity with each others roles and responsibilities
2. Gaining knowledge of resources that may available directly from or through other local or regional agencies
3. Sharing and gaining of ideas and experiences among participating agencies 4. Developing an appreciation for the wealth of knowledge and resources available within the
region 5. Developing and installing mechanisms for future collaboration and cooperation.
The project will consist of a two-day conference to be held in the U. S. Virgin Islands. The conference will be split in to two parts with one day focused principally on specific matters in the U. S. Virgin 1 A preliminary report on this information dissemination activity was included in the VI-WRRI 2004-2005 Annual Report.
Islands and the second day on more general issues having to do with the Caribbean region. The conference is intended for a wide range of persons. These will include government officials, researchers, NGO’s and private interests as well as students. The focus will be on general information sharing so formal presentations will be restricted to overviews and may cover topics including management responsibilities, research activities and implementation of highly successful practices. The objective of the conference is provide a forum in which persons in the U. S. Virgin Islands and the Caribbean region can exchange ideas and develop understandings and relationships that could promote better water resources management in the region. Methodology The conference will convened by the Virgin Islands Water Resources Research Institute in collaboration with local agencies such as the Virgin Islands Water and Power Authority and the Department of Planning and Natural Resources. Additionally, the University of Puerto Rico’s Water Resources Research Institute and the Caribbean District Office of the United States Geological Survey – Water Resources Division will be invited to collaborate as they have in the past on the organizing of the section of the conference focusing on the water issues in the wider Caribbean – the Sixth Caribbean Islands Water Resources Congress. Principal presentations will be invited from knowledgeable persons on subjects determined by the conference’s organizing committee. A limited number of volunteered papers will also be considered. Papers will be presented as part of panel presentations. Each day will feature a keynote speaker at the luncheons. Conference proceedings will be made available on compact disks at the close of the meeting and also posted on the VI-WRRI’s web page. This CD will also include contact information for conference participants. Poster presentations will be invited for the conference and field trips will be conducted to sites in St. Thomas that may be of particular interest to conference participants. Tentative sites are the desalination plant of the Virgin Islands Water and Power Authority and the new wastewater treatment facility on the eastern end of St. Thomas. The first day of the conference will be focused on matters that are local to the Virgin Islands and the second day will address regional matters. With the guidance and active participation of the Advisory Council of the VI-WRRI, its Director will assemble a committee and lead the organization of a meeting for government agencies, non-governmental organizations and others to assess the state of water resources management in the Virgin Islands. It is anticipated that there will be presentations made by representatives of the principal groups and discussions of individual plans for the future as well opportunities for collaborations. This session on water resources in the Virgin Islands will conclude with a meeting of persons interested in developing a mechanism for continuation of the dialog fostered by the conference. The second day of the conference will be the convening of the Sixth Caribbean Islands Water Resources Congress. The first of these meetings was held in the Virgin Islands in 1984 and subsequent meetings were held in San Juan and Mayaguez, Puerto Rico and the Virgin Islands as collaborative efforts between the Virgin Islands and Puerto Rico Water Resources Research Institutes and the Caribbean District Office of the U. S. Geological Survey – Water Resources Division. As in the past, papers on water resources issues applicable to the Caribbean area will be invited for this conference. Principal Accomplishments and Significance During the planning process it was decided that the conference should be split in to two separate conferences occurring at different times and in different places. It was felt that the first conference would
be focused principally on work done through the Virgin Islands Water Resources Research Institute. It would also provide a forum for a broad discussion of local water resources issues and for developing research direction for the VI-WRRI in the coming years. The second conference would be the Sixth Caribbean Islands Water Resources Congress and as planned would be targeted to a Caribbean-wide audience. The first conference was held on Thursday, February 24, 2005 on the St. Thomas campus of the University of the Virgin Islands. A copy of the meeting’s program is inserted at the end of this report. Participation in the meeting was good and from a wide cross-section of persons. The meeting permitted the usual desirable networking, allowed an exchange of information and facilitated dialoging among researchers, practitioners, government officials and the general public that might not otherwise have occurred. Very importantly, the VI-WRRI was able get a better sense of what the perceived water resources research needs in the Virgin Islands are. While planning for the Sixth Caribbean Islands Water Resources Congress started, the conference was not convened. There were internal circumstances occurring at the University of Puerto Rico and changed administrative assignments at the University of the Virgin Islands. These two major factors as well as others made holding the Congress not possible.
UNIVERSITY OF THE VIRGIN ISLANDS
2005 WATER RESOURCES CONFERENCE Thursday, February 24, 2005
Sports and Fitness Center -West Mezzanine 2nd Floor
Agenda 8:30 – 9:00 am Breakfast 9:00 – 9:30 am Welcome James Rakocy, Ph.D. Acting Vice Provost for Research and Public Service
Opening Remarks LaVerne E. Ragster, Ph.D. President, University of the Virgin Islands
Water Resources Presentations
Introduction of Water Resources Research Institute Principal Investigators Henry H. Smith, Ph.D.
Director, Water Resources Research Institute 9:30 – 9:50 am Ms. Katie Flanigan, Environmental Coordination Manager Virgin Islands Environmental Resource Station Water Resources Education at VIERS 9:50 – 10:10 am Ms. Marcia Taylor, Research Specialist Center for Marine and Environmental Studies
Environmental Education and Hands-On Training-Mangrove Restoration Techniques
10:10 – 10:30 am Dr. James Rakocy, Acting Vice Provost, RPS Agricultural Experiment Station Water Research Projects at the Agricultural Experiment Station 10:30 – 10:50 am Dr. Barry Devine, Chief Scientist Eastern Caribbean Center/Conservation Data Center Water Resources Management in Coral Bay Watershed 10:50 – 11:00 am Morning Break 11:00 – 11:20 am Dr. Hosanna Solomon, Assistant Professor of Economics

Social Science Division Production, Pricing, & Distribution Policies of Water 11:20 – 11:40 am Mr. Heath Kelsey, Environmental Health Studies University of South Carolina Hydrology Modeling in Turpentine Run Virgin Islands Experimental Program to Stimulate Competitive Research Presentations
11:40 – 11:50 am Mr. Eugene Gottlieb, Outreach Coordinator Virgin Islands Experimental Program to Stimulate Competitive Research
Introduction of VI-EPSCoR/Dr. Nasseer Idrisi . 11:50 – 12:30 pm Dr. Nasseer Idrisi, Research Assistant Professor VI-EPSCoR/Biocomplexity of Caribbean Coral Reef
Iraq-Advancing Watershed Assessment, Research, & Education (AWARE): Restoring the Southern Iraqi Marshlands after a decade of devastation
12:30 – 1:30 pm Lunch
Presentations by Government Agencies 1:30 – 2:00 pm Mr. Stevie Henry, Data Manager, ECC/Conservation Data Center in collaboration with Department of Planning & Natural Resources Wellhead Protection for the U.S. Virgin Islands/GIS Project 2:00 - 2:20 pm Ms. May Cornwall, Director of Water Distribution, Alternate
Engineering, and Grants Water and Power Authority
Water Distribution System, Capital Improvement Project, and Research Needs
2:20 – 2:40 pm Ms. Sonia Nelthropp, Interim Executive Director Waste Management Authority Water Management in the Territory 2:40 - 2:50 pm Afternoon Break 2:50 – 3:15 pm Dr. Henry H. Smith, Director
Water Resources Research Institute Future Plans and Priorities 3:15 – 4:00 pm Open Discussion/Questions and Answers Closing Remarks Dr. Henry H. Smith, Director WRRI
Improving Water Quality Research Through Hands-onHydrography/Hydrology Training
Basic Information
Title: Improving Water Quality Research Through Hands-onHydrography/Hydrology Training
Project Number: 2005VI62B
Start Date: 5/15/2005
End Date: 2/28/2006
Funding Source: 104B
Congressional District: Not applicable
Research Category: Not Applicable
Focus Category: Water Quality, Methods, Hydrology
Descriptors:
Principal Investigators: Roy A Watlington
Publication
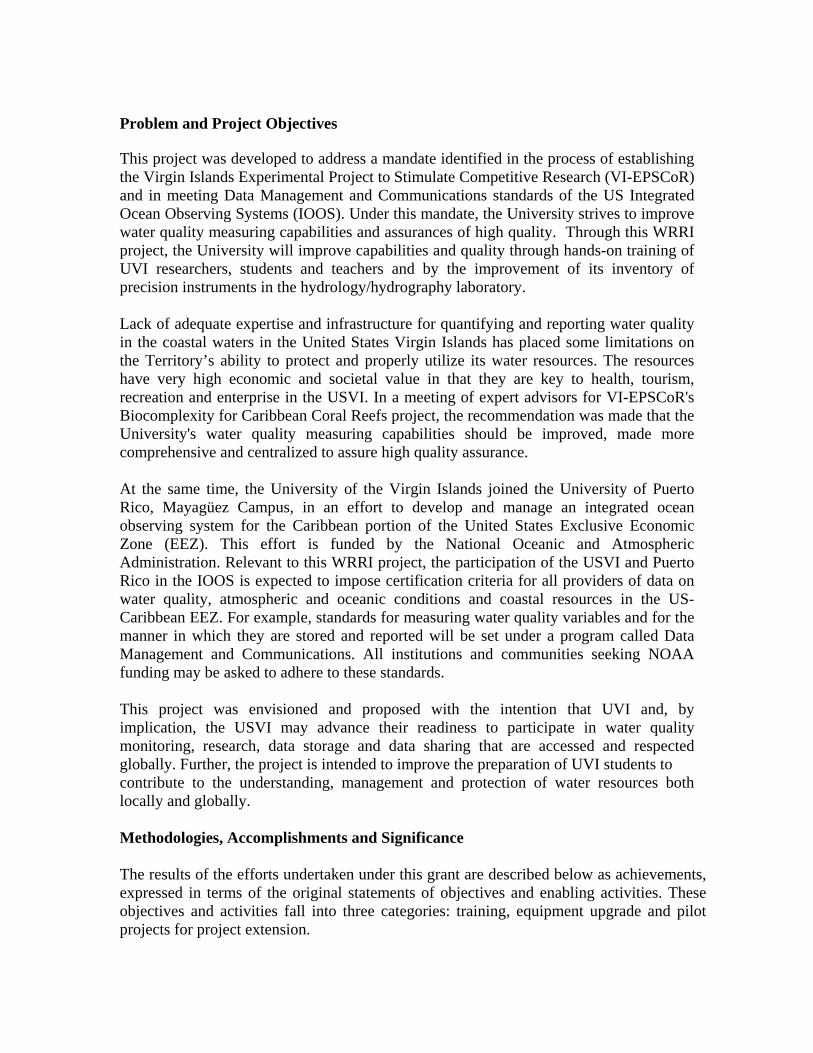
Problem and Project Objectives This project was developed to address a mandate identified in the process of establishing the Virgin Islands Experimental Project to Stimulate Competitive Research (VI-EPSCoR) and in meeting Data Management and Communications standards of the US Integrated Ocean Observing Systems (IOOS). Under this mandate, the University strives to improve water quality measuring capabilities and assurances of high quality. Through this WRRI project, the University will improve capabilities and quality through hands-on training of UVI researchers, students and teachers and by the improvement of its inventory of precision instruments in the hydrology/hydrography laboratory. Lack of adequate expertise and infrastructure for quantifying and reporting water quality in the coastal waters in the United States Virgin Islands has placed some limitations on the Territory’s ability to protect and properly utilize its water resources. The resources have very high economic and societal value in that they are key to health, tourism, recreation and enterprise in the USVI. In a meeting of expert advisors for VI-EPSCoR's Biocomplexity for Caribbean Coral Reefs project, the recommendation was made that the University's water quality measuring capabilities should be improved, made more comprehensive and centralized to assure high quality assurance. At the same time, the University of the Virgin Islands joined the University of Puerto Rico, Mayagüez Campus, in an effort to develop and manage an integrated ocean observing system for the Caribbean portion of the United States Exclusive Economic Zone (EEZ). This effort is funded by the National Oceanic and Atmospheric Administration. Relevant to this WRRI project, the participation of the USVI and Puerto Rico in the IOOS is expected to impose certification criteria for all providers of data on water quality, atmospheric and oceanic conditions and coastal resources in the US-Caribbean EEZ. For example, standards for measuring water quality variables and for the manner in which they are stored and reported will be set under a program called Data Management and Communications. All institutions and communities seeking NOAA funding may be asked to adhere to these standards. This project was envisioned and proposed with the intention that UVI and, by implication, the USVI may advance their readiness to participate in water quality monitoring, research, data storage and data sharing that are accessed and respected globally. Further, the project is intended to improve the preparation of UVI students to contribute to the understanding, management and protection of water resources both locally and globally. Methodologies, Accomplishments and Significance The results of the efforts undertaken under this grant are described below as achievements, expressed in terms of the original statements of objectives and enabling activities. These objectives and activities fall into three categories: training, equipment upgrade and pilot projects for project extension.
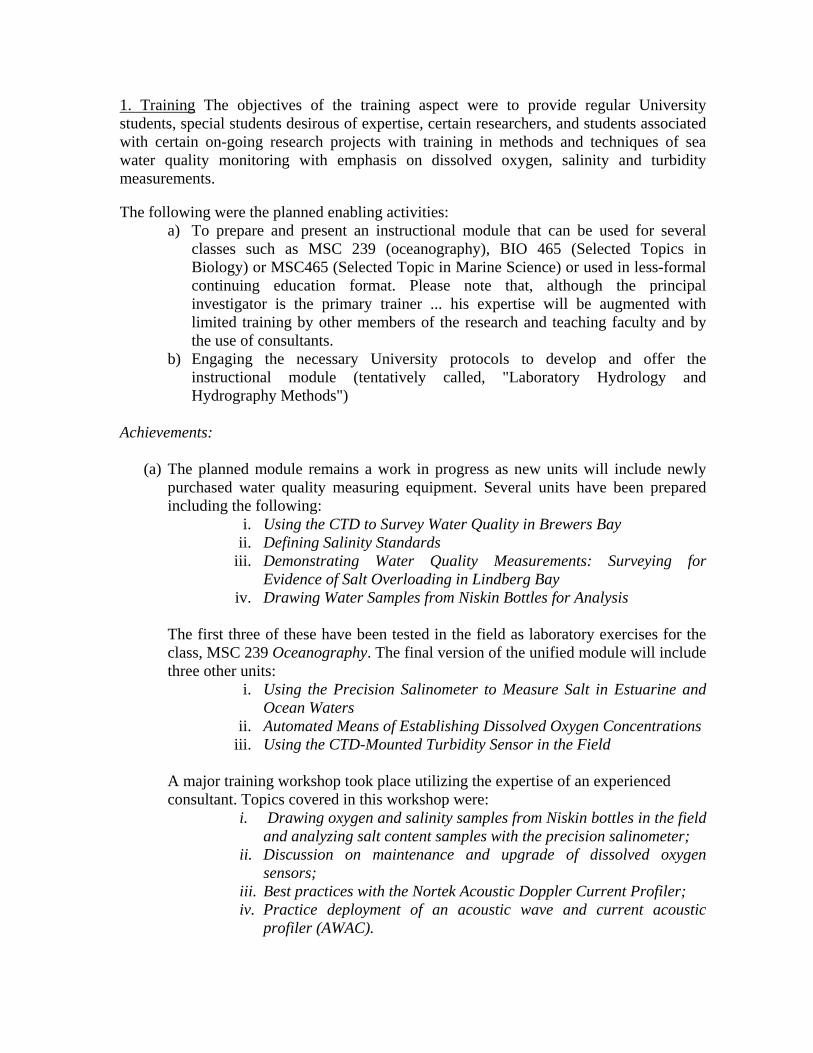
1. Training The objectives of the training aspect were to provide regular University students, special students desirous of expertise, certain researchers, and students associated with certain on-going research projects with training in methods and techniques of sea water quality monitoring with emphasis on dissolved oxygen, salinity and turbidity measurements. The following were the planned enabling activities:
a) To prepare and present an instructional module that can be used for several classes such as MSC 239 (oceanography), BIO 465 (Selected Topics in Biology) or MSC465 (Selected Topic in Marine Science) or used in less-formal continuing education format. Please note that, although the principal investigator is the primary trainer ... his expertise will be augmented with limited training by other members of the research and teaching faculty and by the use of consultants.
b) Engaging the necessary University protocols to develop and offer the instructional module (tentatively called, "Laboratory Hydrology and Hydrography Methods")
Achievements:
(a) The planned module remains a work in progress as new units will include newly purchased water quality measuring equipment. Several units have been prepared including the following:
i. Using the CTD to Survey Water Quality in Brewers Bay ii. Defining Salinity Standards
iii. Demonstrating Water Quality Measurements: Surveying for Evidence of Salt Overloading in Lindberg Bay
iv. Drawing Water Samples from Niskin Bottles for Analysis The first three of these have been tested in the field as laboratory exercises for the class, MSC 239 Oceanography. The final version of the unified module will include three other units:
i. Using the Precision Salinometer to Measure Salt in Estuarine and Ocean Waters
ii. Automated Means of Establishing Dissolved Oxygen Concentrations iii. Using the CTD-Mounted Turbidity Sensor in the Field
A major training workshop took place utilizing the expertise of an experienced consultant. Topics covered in this workshop were:
i. Drawing oxygen and salinity samples from Niskin bottles in the field and analyzing salt content samples with the precision salinometer;
ii. Discussion on maintenance and upgrade of dissolved oxygen sensors;
iii. Best practices with the Nortek Acoustic Doppler Current Profiler; iv. Practice deployment of an acoustic wave and current acoustic
profiler (AWAC).
The training workshops were attended by scientists from the Virgin Islands Department of Planning and Natural Resources. (b) Developing University protocols to include the unified module, entitled “Laboratory Hydrology and Hydrography Methods” has become a less definable goal than any of the many activities listed here. Manpower shortages has made uncertain the timing for offering certain courses and has diverted teaching expertise from curriculum development into increased class loads.
2. Equipment Upgrade objectives included bringing existing water quality measuring equipment up-to state of the art condition with repairs, recalibration and the procurement of accessory sensors. The following were the planned enabling activities:
a) repair and calibrate Guildline Portasal salinometer b) acquire and install nephelometer sensor to match Sea Bird 25 CTD - conductivity-
depth-temperature measuring instrument c) refurbish NOAA-built photometric Winkler dissolved oxygen apparatus. d) build two replicates of the photometric Winkler dissolved oxygen apparatus for use
in class setting. Achievements: With some necessitated modifications all of these activities were conducted as follows:
(a) the Portasal salinometer was repaired and calibrated as planned and was put into use for the workshop mentioned above.
(b) The nephelometer was acquired and put into use as planned. A savings was realized in the purchasing of a combination nephelometer/chlorophyll sensor.
(c) The NOAA-built photometric Winkler dissolved oxygen apparatus was shipped back to NOAA under the terms of its loan. It was returned to UVI tuned and recalibrated.
(d) Replicas of the presently held photometric model are no longer available. In addition, the state of the art in precision has been advanced with available substitute units costing considerably more than was budgeted. Only a single dissolved oxygen apparatus could be afforded but the new state-of-the-art model that was acquired represents a technological improvement over the photometric model.
3. Pilot projects and program extension set objectives of using pilot studies in John Brewers Bay as “capstone” activities demonstrating acquired competence in hydrology/ hydrography field methods and to provide a plan for extending such pilot projects to estuarine areas where the monitoring of additional variables (nutrients, BOD) is critical. The following were the planned enabling activities:
a) Under the auspices of the mentioned BIO and MSC courses and using university vessels, students will be led in conducting field monitoring of water quality in Brewers Bay.
b) The P.I. will develop (i) a laboratory/field teaching module that addresses additional water quality variables and (ii) proposal for training in these additional areas will be extended to both regular and special university training.
Achievements:
a) Field monitoring of water quality was conducted according to plan in the spring of 2005 under the auspices of MSC 239 (Oceanography). Nine students participated in four field exercises. In the fall of 2006 a single field exercise was conducted under the auspices of research in Biocomplexity in Caribbean Coral Reefs with several students participating.
Conclusions and Recommendations As shown above, the major goals of this project were accomplished in spite of the unexpected impediment of an unexpected excessive teaching burden. Already researchers and students are utilizing equipment improved or acquired under this grant. In addition, student interaction with researchers during piloted field activities has served to identify students who have the interest and skills to join on-going or anticipated research in the community. Partially incomplete objectives were in the completion of the publication of training modules in "Laboratory Hydrology and Hydrography Methods" and the effort to inculcate water quality measurements into several aspects of the curriculum. These and the failure to encumber salary funds (with concomitant fringe benefits) resulted from the unexpectedly intense teaching load in both semesters made necessary by manpower shortages in the faculty. The publication of hydrology and hydrology methods, either as a single document or as individual modules, will be shared with University faculty and researchers and with members of the community who attended the workshops or expressed interest in it. The principal recommendation is that close attention be paid to the standards eventually developed and published by DMAC and that all researchers at the University seek to meet DMAC criteria and extend them into other water quality measurement activities in the Virgin Islands. All students should also be apprised of the implications of these standards as they graduate and take careers in water quality work.
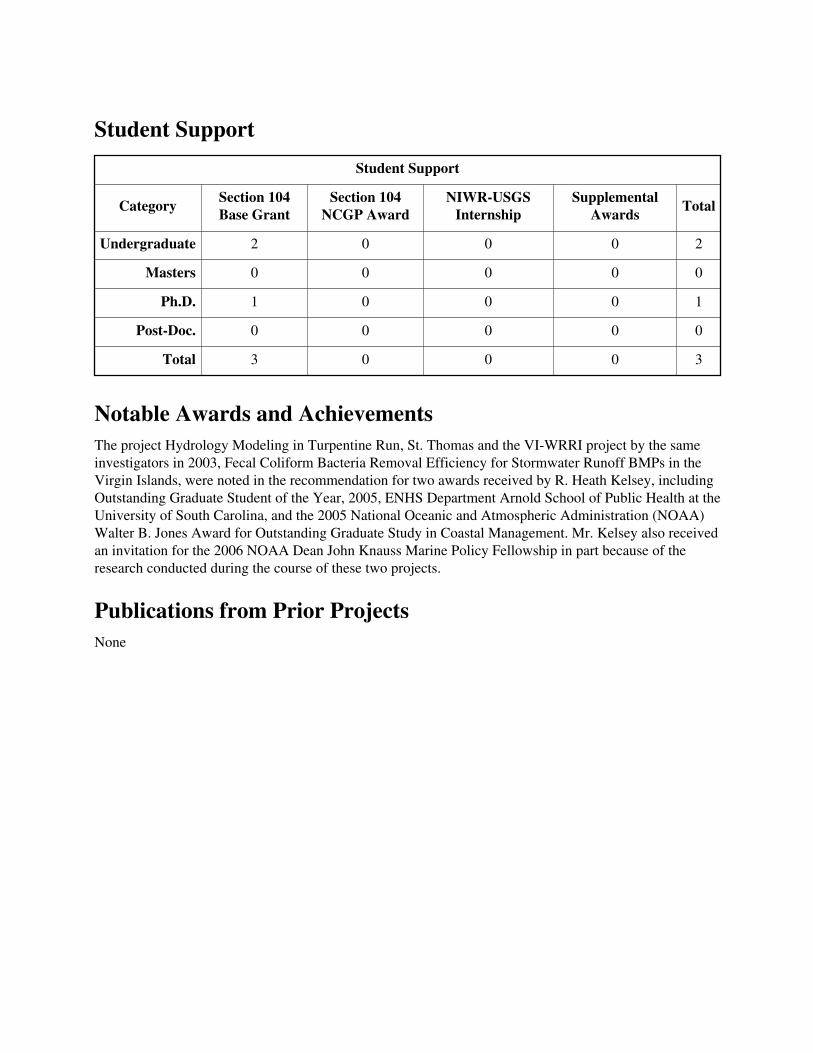
Student SupportStudent Support
Category Section 104Base Grant
Section 104NCGP Award
NIWR-USGS Internship
Supplemental Awards Total
Undergraduate 2 0 0 0 2
Masters 0 0 0 0 0
Ph.D. 1 0 0 0 1
Post-Doc. 0 0 0 0 0
Total 3 0 0 0 3
Notable Awards and AchievementsThe project Hydrology Modeling in Turpentine Run, St. Thomas and the VI-WRRI project by the sameinvestigators in 2003, Fecal Coliform Bacteria Removal Efficiency for Stormwater Runoff BMPs in theVirgin Islands, were noted in the recommendation for two awards received by R. Heath Kelsey, includingOutstanding Graduate Student of the Year, 2005, ENHS Department Arnold School of Public Health at theUniversity of South Carolina, and the 2005 National Oceanic and Atmospheric Administration (NOAA)Walter B. Jones Award for Outstanding Graduate Study in Coastal Management. Mr. Kelsey also receivedan invitation for the 2006 NOAA Dean John Knauss Marine Policy Fellowship in part because of theresearch conducted during the course of these two projects.
Publications from Prior ProjectsNone