dc jug: understanding java garbage collection
TRANSCRIPT
©2014 Azul Systems, Inc. Presented at DC JUG, April 2014
Understanding Java
Garbage Collection
A Shallow Dive into the Deep End of the JVM
Matt Schuetze, Director of Product Management
Azul Systems
A presentation to the Washington DC/NoVA JUG
April 29, 2014

©2014 Azul Systems, Inc. Presented at DC JUG, April 2014
This Talk’s Purpose / Goals
This talk begins with OOMEs.
But really this talk is focused on GC education
This is a talk about how the “GC machine” works
Purpose: Once you understand how it works, you can
use your own brain...
You’ll learn just enough to be dangerous...
The “Azul makes the world’s greatest GC” stuff will only
come at the end, I promise...

©2014 Azul Systems, Inc. Presented at DC JUG, April 2014
About Azul Systems We deal with Java performance issues on a daily
basis
Our solutions focus on consistent response time under load
We enable practical, full use of hardware resources
As a result, we often help characterize problems
In many/most cases, it’s not the database, app, or
network - it’s the JVM, or the system under it…
GC Pauses, OS or Virtualization “hiccups”, swapping, etc.
We use and provide simple tools to help discover
what’s going on in a JVM and the underlying
platform
Focus on measuring JVM/Platform behavior with your app
Non-intrusive, no code changes, easy to add
©2014 Azul Systems, Inc. Presented at DC JUG, April 2014
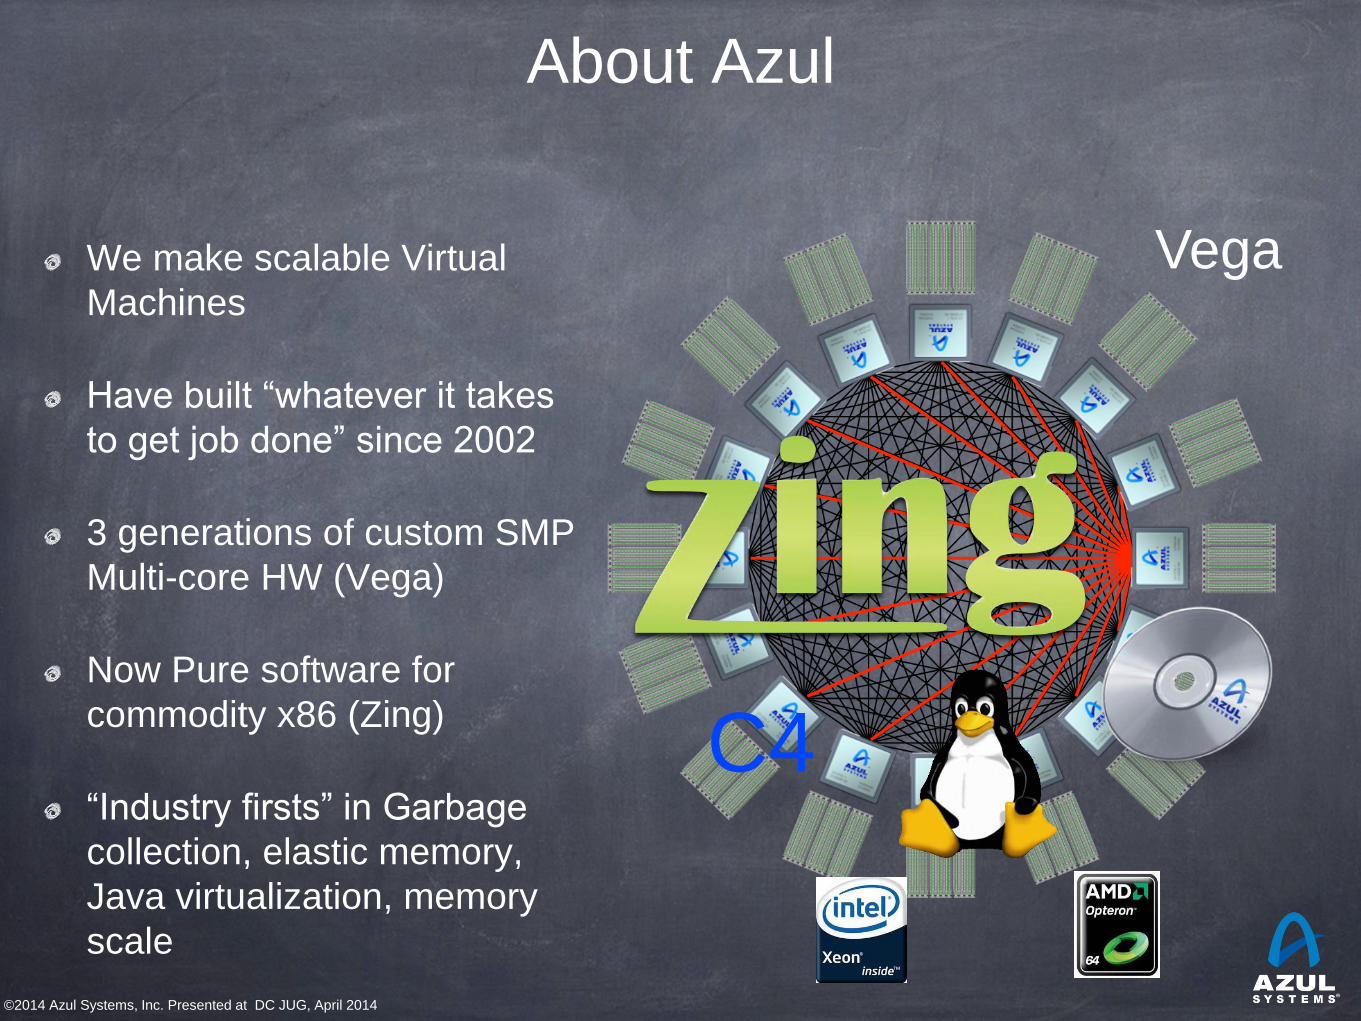
About Azul
We make scalable Virtual
Machines
Have built “whatever it takes
to get job done” since 2002
3 generations of custom SMP
Multi-core HW (Vega)
Now Pure software for
commodity x86 (Zing)
“Industry firsts” in Garbage
collection, elastic memory,
Java virtualization, memory
scale
Vega
C4

©2014 Azul Systems, Inc. Presented at DC JUG, April 2014
High level agenda
What is an OOME and why does it hurt so good?
GC fundamentals and key mechanisms
Some GC terminology & metrics
Classifying current commercially available collectors
Why Stop-The-World is a problem
The C4 collector: What a solution to STW looks like...

©2014 Azul Systems, Inc. Presented at DC JUG, April 2014
Myth or Truth: Claim 1
• Java is Slow!
• Until Hotspot kicks in, JVM is an interpreter
○ And even Hotspot can’t match hand-tuned libraries
• Startup loads lots of classes
○ Don’t use Spring for a command-line filter app
• GC can create inconvenient pauses
http://www.kdgregory.com/misc/presentations/kdgregory-com-presentation-JVM_Internals.pdf
--Keith Gregory, Philly JUG, March 2014
©2014 Azul Systems, Inc. Presented at DC JUG, April 2014
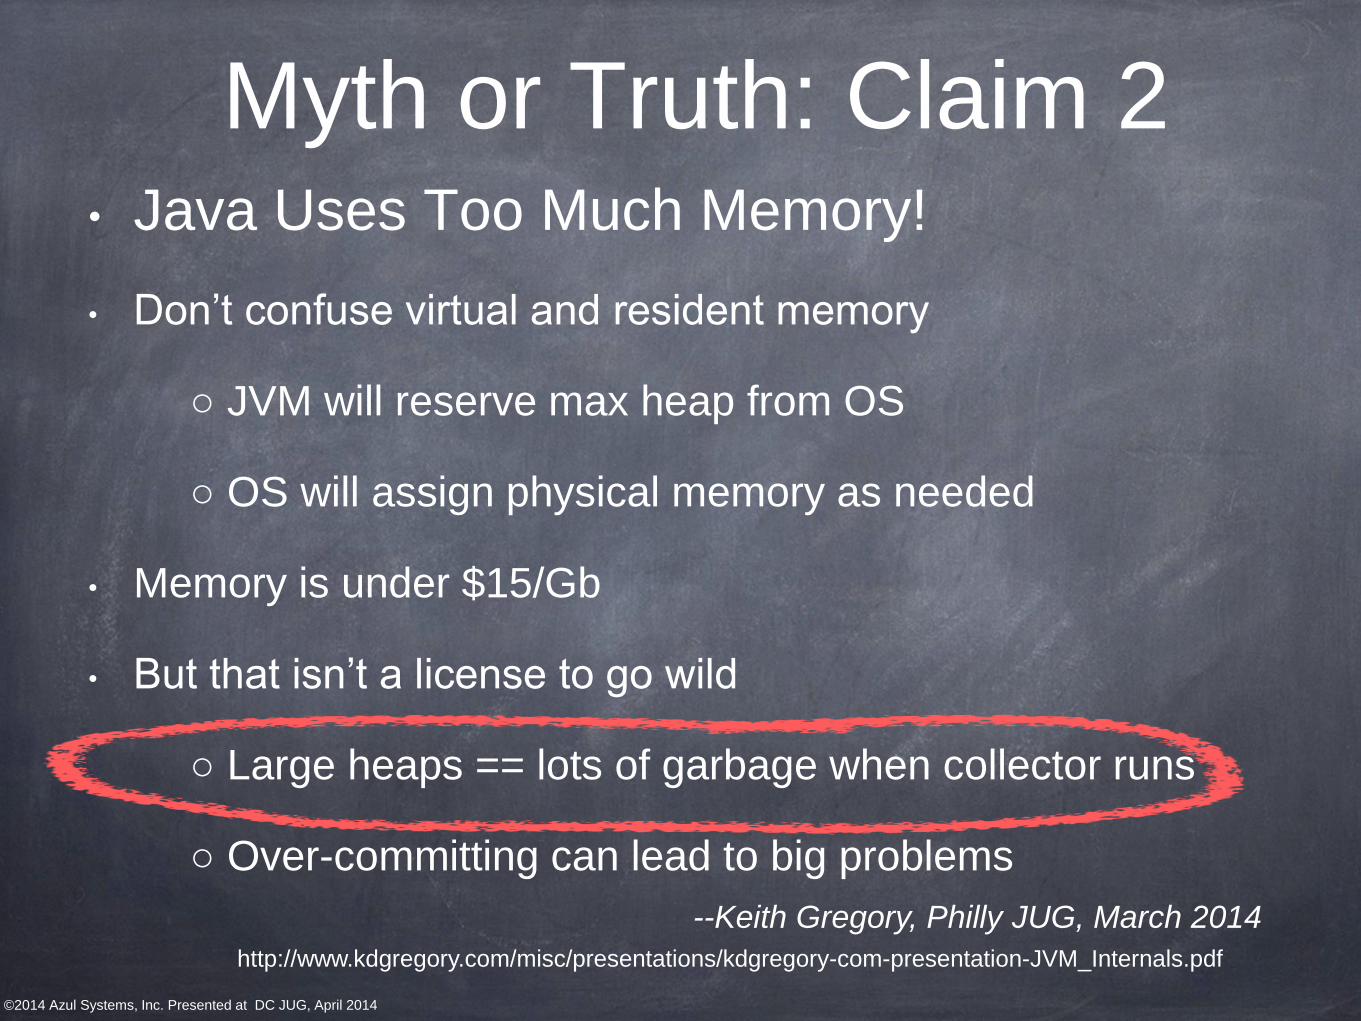
Myth or Truth: Claim 2 • Java Uses Too Much Memory!
• Don’t confuse virtual and resident memory
○ JVM will reserve max heap from OS
○ OS will assign physical memory as needed
• Memory is under $15/Gb
• But that isn’t a license to go wild
○ Large heaps == lots of garbage when collector runs
○ Over-committing can lead to big problems
http://www.kdgregory.com/misc/presentations/kdgregory-com-presentation-JVM_Internals.pdf
--Keith Gregory, Philly JUG, March 2014

©2014 Azul Systems, Inc. Presented at DC JUG, April 2014
OOMEs: the Usual Suspects • Out of Memory Errors represent the end of the end of available memory. There
actually four categories of memory issues with similar and overlapping symptoms, but
varied causes and solutions:
• Performance: usually associated with excessive object creation and deletion, long
delays in garbage collection, excessive operating system page swapping, and more.
• Resource constraints: occurs when there’s either too little memory available or your
memory is too fragmented to allocate a large object—this can be native or, more
commonly, Java heap-related.
• Java heap leaks: the classic memory leak, in which Java objects are continuously
created without being released. This is usually caused by latent object references.
• Native memory leaks: associated with any continuously growing memory utilization
that is outside the Java heap, such as allocations made by JNI code, drivers or even
JVM allocations.

©2014 Azul Systems, Inc. Presented at DC JUG, April 2014
Out of Memory Error • Why didn’t my app throw an OutOfMemoryError?
• Posted by kcpeppe on January 8, 2014 at 8:19 AM PST
• Every once in a while I run into someone that has a JVM
that is running back to back collections and yet the heap is
still almost full after each attempt! When they discover that
their problem is related to the JVM not having enough
memory they often ask the question, why didn't the JVM
throw an OutOfMemoryError? After all my application is
not making any forward progress and the reason is Java
heap is almost completely exhausted.
©2014 Azul Systems, Inc. Presented at DC JUG, April 2014
Empty memory
and CPU/throughput

©2014 Azul Systems, Inc. Presented at DC JUG, April 2014
Two Intuitive limits
If we had exactly 1 byte of empty memory at all times,
the collector would have to work “very hard”, and GC
would take 100% of the CPU time
If we had infinite empty memory, we would never have to
collect, and GC would take 0% of the CPU time
GC CPU % will follow a rough 1/x curve between these
two limit points, dropping as the amount of memory
increases.

©2014 Azul Systems, Inc. Presented at DC JUG, April 2014
100%
CPU%
Heap size Live set
Heap size vs. GC
CPU %
©2014 Azul Systems, Inc. Presented at DC JUG, April 2014
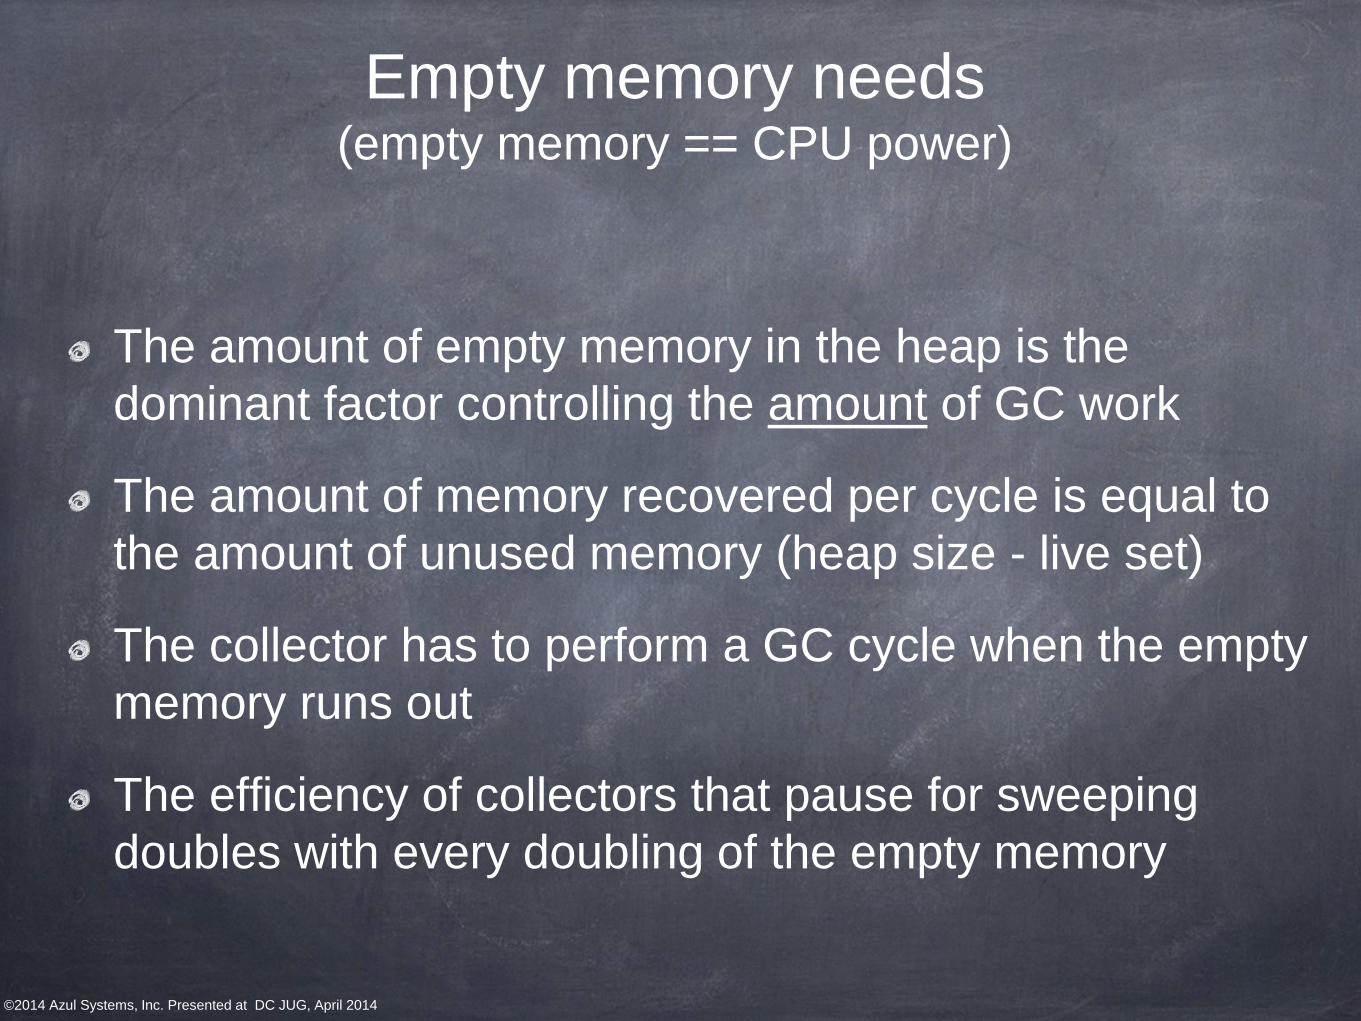
Empty memory needs (empty memory == CPU power)
The amount of empty memory in the heap is the
dominant factor controlling the amount of GC work
The amount of memory recovered per cycle is equal to
the amount of unused memory (heap size - live set)
The collector has to perform a GC cycle when the empty
memory runs out
The efficiency of collectors that pause for sweeping
doubles with every doubling of the empty memory

©2014 Azul Systems, Inc. Presented at DC JUG, April 2014
What empty memory controls
Empty memory controls efficiency (amount of collector
work needed per amount of application work performed)
Empty memory controls the frequency of pauses (if the
collector performs any Stop-the-world operations)
Empty memory DOES NOT control pause times (only
their frequency)
In collectors that pause for sweeping, more empty
memory means less frequent but LARGER pauses

©2014 Azul Systems, Inc. Presented at DC JUG, April 2014
Is GC still a real problem?
“The one big challenge left
for Java on performance is
containing pause times.
Latency jitter is the only
reason to ever use
other languages inside
Twitter.”
--Adam Messinger,
CTO of Twitter
Citation: Oracle Java 8
global launch video,
March 25, 2014

©2014 Azul Systems, Inc. Presented at DC JUG, April 2014
GC behavior of a JVM with little heap tuning -Xms1024m -Xmx1024m -XX:NewSize=200m -XX:MaxNewSize=200m
New generation GC
pauses on average
occurred every 6
seconds and lasted
less than 50
milliseconds.
Any single pause is
unnoticeable to the
users waiting for the
server’s response.
Old generation pauses
on average occurred
less than once per
hour but lasted as much
as almost 8 seconds on
average with a single
outlier even reaching 19
seconds. Many Old Generation Full GC (the grey
lines) Blue = Heap occupancy
Heap used over a period of about 25 hours:

©2014 Azul Systems, Inc. Presented at DC JUG, April 2014
Memory use
• How many of you use heap sizes of:
• more than ½ GB?
• more than 1 GB?
• more than 2 GB?
• more than 4 GB?
• more than 10 GB?
• more than 20 GB?
• more than 50 GB?
• more than 100 GB?

©2014 Azul Systems, Inc. Presented at DC JUG, April 2014
Why should you understand (at least a little) how GC works?

©2014 Azul Systems, Inc. Presented at DC JUG, April 2014
Much of what People seem to “know”
about Garbage Collection is wrong
In many cases, it’s much better than you may think
GC is extremely efficient. Much more so that malloc()
Dead objects cost nothing to collect
GC will find all the dead objects (including cyclic graphs)
...
In many cases, it’s much worse than you may think
Yes, it really does stop for ~1 sec per live GB
No, GC does not mean you can’t have memory leaks
No, those pauses you eliminated from your 20 minute test are not
gone
...

©2014 Azul Systems, Inc. Presented at DC JUG, April 2014
Trying to solve GC problems in application
architecture is like throwing knives
You probably shouldn’t do it blindfolded
It takes practice to do it well without hurting people
You can get very good at it, but do you really want to?
Will all the code you leverage be as good as yours?
Examples of “GC friendly” techniques:
Object pooling
Off heap storage
Distributed heaps
...
(In most cases, you end up building your own garbage collector)

©2014 Azul Systems, Inc. Presented at DC JUG, April 2014
Some GC Terminology

©2014 Azul Systems, Inc. Presented at DC JUG, April 2014
A Concurrent Collector performs garbage collection work
concurrently with the application’s own execution
A Parallel Collector uses multiple CPUs to perform
garbage collection
Classifying a collector’s operation
An Incremental collector performs a garbage collection
operation or phase as a series of smaller discrete
operations with (potentially long) gaps in between
A Stop-the-World collector performs garbage collection
while the application is completely stopped
Mostly means sometimes it isn’t (usually means a
different fall back mechanism exists)

©2014 Azul Systems, Inc. Presented at DC JUG, April 2014
Compact
Over time, heap will get “swiss cheesed”: contiguous
dead space between objects may not be large enough
to fit new objects (aka “fragmentation”)
Compaction moves live objects together to reclaim
contiguous empty space (aka “relocate”)
Compaction has to correct all object references to
point to new object locations (aka “remap”)
Remap scan must cover all references that could
possibly point to relocated objects
Note: work is generally linear to “live set”

©2014 Azul Systems, Inc. Presented at DC JUG, April 2014
Copy
A copying collector moves all lives objects from a
“from” space to a “to” space & reclaims “from” space
At start of copy, all objects are in “from” space and all
references point to “from” space.
Start from “root” references, copy any reachable
object to “to” space, correcting references as we go
At end of copy, all objects are in “to” space, and all
references point to “to” space
Note: work generally linear to “live set”

©2014 Azul Systems, Inc. Presented at DC JUG, April 2014
Generational Collection
Weak Generational Hypothesis; “most objects die young”
Focus collection efforts on young generation:
Use a moving collector: work is linear to the live set
The live set in the young generation is a small % of the space
Promote objects that live long enough to older generations
Only collect older generations as they fill up
“Generational filter” reduces rate of allocation into older generations
Tends to be (order of magnitude) more efficient
Great way to keep up with high allocation rate
Practical necessity for keeping up with processor throughput

©2014 Azul Systems, Inc. Presented at DC JUG, April 2014
Why Generational Garbage Collection
Here is an example of such data. Y axis = number of bytes
allocated; X access = number of bytes allocated over time
Having to mark and compact all
the objects in a JVM is
inefficient. As more and more
objects are allocated, the list of
objects grows and grows
leading to longer and longer
garbage collection time.
However, empirical analysis of
applications has shown that
most objects are short lived.
This is called the ‘weak
generational hypothesis’
As you can see, fewer and
fewer objects remain allocated
over time. In fact most objects
have a very short life as shown
by the higher values on the left
side of the graph Bytes allocated over time
X = number of Bytes allocated; Y = number of Bytes allocated over time

©2014 Azul Systems, Inc. Presented at DC JUG, April 2014
Mutator
Your program…
Parallel
Can use multiple CPUs
Concurrent
Runs concurrently with program
Pause
A time duration in which the
mutator is not running any code
Stop-The-World (STW)
Something that is done in a pause
Monolithic Stop-The-World
Something that must be done in it’s
entirety in a single pause
Useful terms for discussing garbage
collection
Generational
Collects young objects and long lived
objects separately.
Promotion
Allocation into old generation
Marking
Finding all live objects
Sweeping
Locating the dead objects
Compaction
Defragments heapMoves objects in
memory. Remaps all affected references.
Frees contiguous memory regions

©2014 Azul Systems, Inc. Presented at DC JUG, April 2014
Useful metrics for discussing garbage
collection
Cycle time How long it takes the collector to free
up memory
Marking time How long it takes the collector to find all
live objects
Sweep time How long it takes to locate dead
objects
* Relevant for Mark-Sweep
Compaction time How long it takes to free up memory by
relocating objects
* Relevant for Mark-Compact
Heap population (aka Live set) How much of your heap is alive
Allocation rate How fast you allocate
Mutation rate How fast your program updates
references in memory
Heap Shape The shape of the live object graph
* Hard to quantify as a metric...
Object Lifetime How long objects live

©2014 Azul Systems, Inc. Presented at DC JUG, April 2014
Classifying common collectors
©2014 Azul Systems, Inc. Presented at DC JUG, April 2014
HotSpot™ ParallelGC Collector mechanism classification
Monolithic Stop-the-world copying NewGen
Monolithic Stop-the-world Mark/Sweep/Compact OldGen

©2014 Azul Systems, Inc. Presented at DC JUG, April 2014
HotSpot™ ConcMarkSweepGC (aka CMS) Collector mechanism classification
Monolithic Stop-the-world copying NewGen (ParNew)
Mostly Concurrent, non-compacting OldGen (CMS)
Mostly Concurrent marking
Mark concurrently while mutator is running
Track mutations in card marks
Revisit mutated cards (repeat as needed)
Stop-the-world to catch up on mutations, ref processing, etc.
Concurrent Sweeping
Does not Compact (maintains free list, does not move objects)
Fallback to Full Collection (Monolithic Stop the world).
Used for Compaction, etc.

©2014 Azul Systems, Inc. Presented at DC JUG, April 2014
HotSpot™ G1GC (aka “Garbage First”) Collector mechanism classification
Monolithic Stop-the-world copying NewGen
Mostly Concurrent, OldGen marker
Mostly Concurrent marking
Stop-the-world to catch up on mutations, ref processing, etc.
Tracks inter-region relationships in remembered sets
Stop-the-world mostly incremental compacting old gen
Objective: “Avoid, as much as possible, having a Full GC…”
Compact sets of regions that can be scanned in limited time
Delay compaction of popular objects, popular regions
Fallback to Full Collection (Monolithic Stop the world).
Used for compacting popular objects, popular regions, etc.

©2014 Azul Systems, Inc. Presented at DC JUG, April 2014
Delaying the inevitable
Some form of copying/compaction is inevitable in practice And compacting anything requires scanning/fixing all references to it
Delay tactics focus on getting “easy empty space” first This is the focus for the vast majority of GC tuning
Most objects die young [Generational] So collect young objects only, as much as possible. Hope for short STW.
But eventually, some old dead objects must be reclaimed
Most old dead space can be reclaimed without moving it [e.g. CMS] track dead space in lists, and reuse it in place
But eventually, space gets fragmented, and needs to be moved
Much of the heap is not “popular” [e.g. G1, “Balanced”] A non popular region will only be pointed to from a small % of the heap
So compact non-popular regions in short stop-the-world pauses
But eventually, popular objects and regions need to be compacted
Young generation pauses are only small because heaps are tiny
A 200GB heap will regularly have several GB of live young stuff…

©2014 Azul Systems, Inc. Presented at DC JUG, April 2014
Monolithic-STW GC Problems

©2014 Azul Systems, Inc. Presented at DC JUG, April 2014
One way to deal with Monolithic-STW GC

©2014 Azul Systems, Inc. Presented at DC JUG, April 2014
Another way to cope: “Creative Language”
“Guarantee a worst case of X msec, 99% of the time”
“Mostly” Concurrent, “Mostly” Incremental
• Translation: “Will at times exhibit long monolithic stop-
the-world pauses”
“Fairly Consistent”
• Translation: “Will sometimes show results well outside
this range”
“Typical pauses in the tens of milliseconds”
• Translation: “Some pauses are much longer than tens
of milliseconds”

©2014 Azul Systems, Inc. Presented at DC JUG, April 2014
Actually measuring things
(e.g. jHiccup)

©2012 Azul Systems, Inc. ©2014 Azul Systems, Inc. Presented at DC JUG, April 2014

©2014 Azul Systems, Inc. Presented at DC JUG, April 2014
Getting past a monolithic-STW Garbage Collection world

©2014 Azul Systems, Inc. Presented at DC JUG, April 2014
We need to solve the right problems
Scale is artificially limited by responsiveness
Responsiveness must be unlinked from scale:
Heap size, Live Set size, Allocation rate, Mutation rate
Transaction Rate, Concurrent users, Data set size, etc.
Responsiveness must be continually sustainable
Can’t ignore “rare” events
Eliminate all Stop-The-World Fallbacks
At modern server scales, any STW fall back is a failure

©2014 Azul Systems, Inc. Presented at DC JUG, April 2014
The problems that need solving (areas where the state of the art needs improvement)
Robust Concurrent Marking
In the presence of high mutation and allocation rates
Cover modern runtime semantics (e.g. weak refs, lock deflation)
Compaction that is not monolithic-stop-the-world
E.g. stay responsive while compacting ¼ TB heaps
Must be robust: not just a tactic to delay STW compaction
[current “incremental STW” attempts fall short on robustness]
Young-Gen that is not monolithic-stop-the-world
Stay responsive while promoting multi-GB data spikes
Concurrent or “incremental STW” may both be ok
Surprisingly little work done in this specific area

©2014 Azul Systems, Inc. Presented at DC JUG, April 2014
Azul’s “C4” Collector Continuously Concurrent Compacting Collector
Concurrent guaranteed-single-pass marker
Oblivious to mutation rate
Concurrent ref (weak, soft, final) processing
Concurrent Compactor
Objects moved without stopping mutator
References remapped without stopping mutator
Can relocate entire generation (New, Old) in every GC cycle
Concurrent, compacting old generation
Concurrent, compacting new generation
No stop-the-world fallback
Always compacts, and always does so concurrently

©2014 Azul Systems, Inc. Presented at DC JUG, April 2014
C4 algorithm highlights
Same core mechanism used for both generations
Concurrent Mark-Compact
A Loaded Value Barrier (LVB) is central to the algorithm
Every heap reference is verified as “sane” when loaded
“Non-sane” refs are caught and fixed in a self-healing barrier
Refs that have not yet been “marked through” are caught
Guaranteed single pass concurrent marker
Refs that point to relocated objects are caught
Lazily (and concurrently) remap refs, no hurry
Relocation and remapping are both concurrent
Uses “quick release” to recycle memory
Forwarding information is kept outside of object pages
Physical memory released immediately upon relocation
“Hand-over-hand” compaction without requiring empty memory

©2014 Azul Systems, Inc. Presented at DC JUG, April 2014
GC Tuning

©2014 Azul Systems, Inc. Presented at DC JUG, April 2014
GC Tuning – how many options?
45
Copyright Frank Pavageau
©2014 Azul Systems, Inc. Presented at DC JUG, April 2014
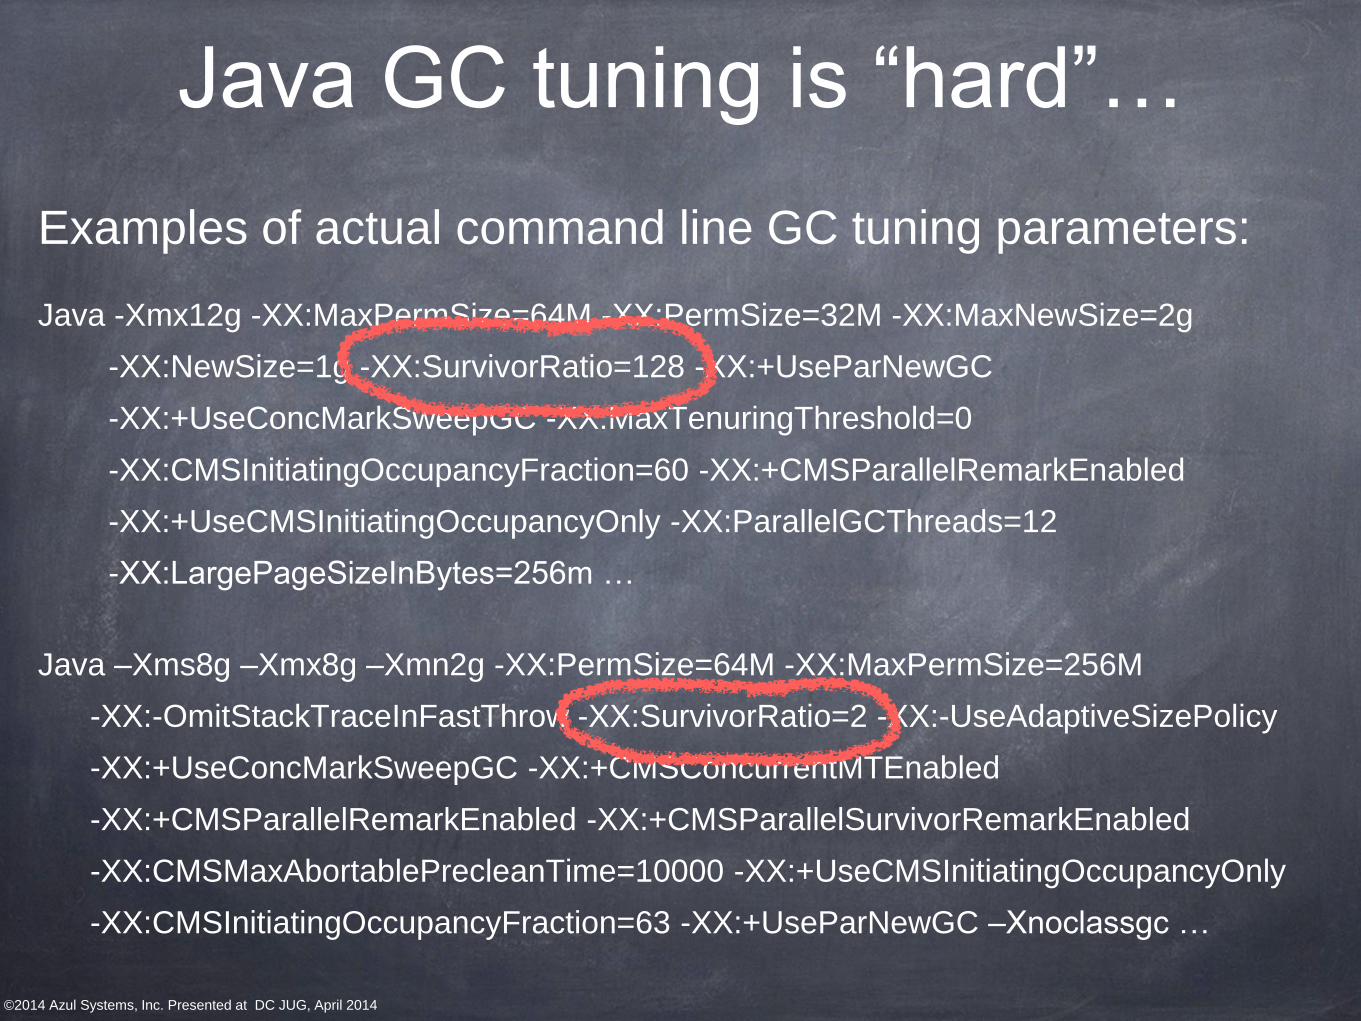
Java GC tuning is “hard”…
Examples of actual command line GC tuning parameters:
Java -Xmx12g -XX:MaxPermSize=64M -XX:PermSize=32M -XX:MaxNewSize=2g
-XX:NewSize=1g -XX:SurvivorRatio=128 -XX:+UseParNewGC
-XX:+UseConcMarkSweepGC -XX:MaxTenuringThreshold=0
-XX:CMSInitiatingOccupancyFraction=60 -XX:+CMSParallelRemarkEnabled
-XX:+UseCMSInitiatingOccupancyOnly -XX:ParallelGCThreads=12
-XX:LargePageSizeInBytes=256m …
Java –Xms8g –Xmx8g –Xmn2g -XX:PermSize=64M -XX:MaxPermSize=256M
-XX:-OmitStackTraceInFastThrow -XX:SurvivorRatio=2 -XX:-UseAdaptiveSizePolicy
-XX:+UseConcMarkSweepGC -XX:+CMSConcurrentMTEnabled
-XX:+CMSParallelRemarkEnabled -XX:+CMSParallelSurvivorRemarkEnabled
-XX:CMSMaxAbortablePrecleanTime=10000 -XX:+UseCMSInitiatingOccupancyOnly
-XX:CMSInitiatingOccupancyFraction=63 -XX:+UseParNewGC –Xnoclassgc …

©2014 Azul Systems, Inc. Presented at DC JUG, April 2014
The complete guide to
Zing GC tuning
• java -Xmx40g

©2014 Azul Systems, Inc. Presented at DC JUG, April 2014
Fun with jHiccup

©2014 Azul Systems, Inc. Presented at DC JUG, April 2014
Optional SLA
plotting
Max Time per
interval
Hiccup duration
at percentile
levels

©2014 Azul Systems, Inc. Presented at DC JUG, April 2014

©2014 Azul Systems, Inc. Presented at DC JUG, April 2014

©2014 Azul Systems, Inc. Presented at DC JUG, April 2014

©2014 Azul Systems, Inc. Presented at DC JUG, April 2014
Sustainable Throughput: The throughput achieved while safely maintaining service levels
Unsustainable
Throughout

©2014 Azul Systems, Inc. Presented at DC JUG, April 2014
Instance capacity test: “Fat Portal” HotSpot CMS: Peaks at ~ 3GB / 45 concurrent users
* LifeRay portal on JBoss @ 99.9% SLA of 5 second response times

©2014 Azul Systems, Inc. Presented at DC JUG, April 2014
Instance capacity test: “Fat Portal” C4: still smooth @ 800 concurrent users

©2014 Azul Systems, Inc. Presented at DC JUG, April 2014
©2014 Azul Systems, Inc. Presented at DC JUG, April 2014

©2014 Azul Systems, Inc. Presented at DC JUG, April 2014
How is Azul’s Java Platform Different? Same JVM standard -
Licensed JCK compliant JVM for JSE6 and JSE7. JSE 8 in flight.*
Derived from same base as Hotspot, fully Java compatible
passes Java Compatibility Kit (JCK) server-level compatibility (~53000 tests )
A different approach
Garbage is good!
Designed with insight that worst case must eventually happen
Unique values
Highly scalable … 100s GB with consistent low pause times – other JVMs will have longer
“stop-the-world” pauses in proportion to size of JVM and memory allocation rate
Elastic memory … insurance for JVMs to handle dynamic load – unlike other JVMs which
are rigidly tuned
Collects New Garbage and Old Garbage concurrently with running application threads …
there is no “stop-the-world” for GC purposes (you will only see extremely short pause times to
reach safepoints) – unlike other JVMs which will eventually stop-the-world.
Compacts Memory concurrently with your application threads running … Zing will move
objects without “stop-the-world” or single-threading – which is a major issue with other JVMs
Measuring pause times from FIRST thread stopped (unlike other JVMs)
Rich non-intrusive production visibility with ZVision and ZVRobot
WYTIWYG (What You Test Is What You Get)
* Zing for JSE8 in dev
with JCK 8 in QA as of
today’s talk
©2014 Azul Systems, Inc. Presented at DC JUG, April 2014
"We were originally designed for extremely large heaps, and
some people use us in huge-data-set situations – which is
why a typical 5GB or 10GB heap that challenges most JVMs
is a walk in the park for Zing"

©2014 Azul Systems, Inc. Presented at DC JUG, April 2014
Some people have big problems to solve
in the big data world and Zing doesn’t
pause for GC
Tests were performed with varying live data set sizes,
and a 250GB heap:
55 GB:
• Zing: 35 milliseconds; Hotspot G1: 357 seconds
110 GB:
• Zing: 75 milliseconds; Hotspot G1: 225 seconds
215 GB:
• Zing: 20 milliseconds; Hotspot G1: 1,055 seconds
JavaOne 2012: Neil Ferguson, Causata:
CON4623 - Big RAM: How Java Developers Can Fully Exploit Massive Amounts of RAM

©2014 Azul Systems, Inc. Presented at DC JUG, April 2014
What you can expect (from Zing)
in the low latency world
Assuming individual transaction work is “short” (on
the order of 1 msec), and assuming you don’t have
100s of runnable threads competing for 10 cores...
“Easily” get your application to < 10 msec worst case
With some tuning, 2-3 msec worst case
Can go to below 1 msec worst case...
May require heavy tuning/tweaking
Mileage WILL vary

©2014 Azul Systems, Inc. Presented at DC JUG, April 2014
Oracle HotSpot (pure newgen) Zing
Low latency trading application

©2014 Azul Systems, Inc. Presented at DC JUG, April 2014
Low latency - Drawn to scale
Oracle HotSpot (pure newgen) Zing

©2014 Azul Systems, Inc. Presented at DC JUG, April 2014
Q & A GC : G. Tene, B. Iyengar and M. Wolf
C4: The Continuously Concurrent Compacting Collector
In Proceedings of the international symposium on Memory management,
ISMM’11, ACM, pages 79-88
Jones, Richard; Hosking, Antony; Moss, Eliot (25 July 2011).
The Garbage Collection Handbook: The Art of Automatic Memory
Management. CRC Press. ISBN 1420082795.
jHiccup: http://www.azulsystems.com/dev_resources/jhiccup

©2014 Azul Systems, Inc. Presented at DC JUG, April 2014
Thanks for Attending
www.azulsystems.com
Please share feedback!
Take a card!
To contact the speaker email: Matt Schuetze, Director of Product Management [email protected] Refer to DC JUG