dbid 2017 renewal business plan dc... · 6 executive summary the renewal plan for the downtown...
TRANSCRIPT
Business Plan for the Five-Year Renewal
of the Downtown Business Improvement District Corporation
(DowntownDC)
January 2017
2
Table&of&Contents&
Executive)Summary)................................................................................................................)6!
A)Vision)for)the)Next)Five)Years)..............................................................................................)8!
Why)Renew)the)Downtown)BID?)............................................................................................)9!Reasons)to)Renew)............................................................................................................................)9!Maintain)Competitiveness)................................................................................................................)9!Continue)to)Add)Value)......................................................................................................................)9!Provide)the)“Private”)in)“PublicMPrivate)Partnership”).....................................................................)10!
Accomplishments)Since)2012).................................................................................................)11!Communications).............................................................................................................................)11!Technology!Integration!.......................................................................................................................!11!Activation/Placemaking!......................................................................................................................!11!Partnerships!........................................................................................................................................!12!Brand/Leadership!...............................................................................................................................!12!
Economic)Development)..................................................................................................................)13!Infrastructure).................................................................................................................................)14!Public)Space)Operations).................................................................................................................)15!Safety!&!Maintenance!(SAM)!.............................................................................................................!15!Public!Space!Management/Public!Safety!&!Preparedness!.................................................................!16!Homeless!Services!..............................................................................................................................!17!
Sustainability)..................................................................................................................................)19!
Downtown)Economic)Indicators)of)Change)............................................................................)20!
Downtown)BID)Map)and)Boundaries).....................................................................................)22!
Renewal)Plan)........................................................................................................................)23!Process)...........................................................................................................................................)23!
Service)Plan)...........................................................................................................................)24!Marketing)and)Communications).....................................................................................................)24!Economic)Development)..................................................................................................................)30!Infrastructure).................................................................................................................................)34!Public)Space)Operations).................................................................................................................)37!Operations!..........................................................................................................................................!37!Public!Safety!.......................................................................................................................................!41!Homeless!Outreach!............................................................................................................................!43!
Sustainability)..................................................................................................................................)46!
FiveMYear)Financial)Plan)and)Tax)Assessments).......................................................................)49!History)of)BID)Assessments).............................................................................................................)49!
Budget)..................................................................................................................................)50!The)5Myear)financial)plan))is)summarized)below)to))show)anticipated)revenue)and)anticipated)expenditures)each)year—FY2018)through)FY2022)...........................................................................)50!Proposed)Revenue)..........................................................................................................................)51!Proposed)FiveMYear)Revenue)..........................................................................................................)51!Property!Assessment!Income!(BID!Tax)!..............................................................................................!51!

3
Proposed)Commercial)Rate:)............................................................................................................)51!Proposed)Hotel)Rate:)......................................................................................................................)52!Annual!Allowable!Tax!Rate!Increase!...................................................................................................!52!Property!Type/Class!............................................................................................................................!52!Current!FY2017!Property!Information!................................................................................................!53!Time!and!Manner!for!Collecting!BID!Taxes!.........................................................................................!53!Other!Revenue!Sources!......................................................................................................................!53!
Participation)of)FederallyMOwned)Buildings)....................................................................................)53!Participation)from)Other)Exempt)Properties)...................................................................................)54!Residential)Inclusion).......................................................................................................................)54!Franklin)Park)...................................................................................................................................)54!Proposed)FiveMYear)Expense)Budget)...............................................................................................)55!Proposed)FiveMYear)Expense)Budget)...............................................................................................)56!
Administrative)Organization)..................................................................................................)57!Account)Management)....................................................................................................................)57!Governance)....................................................................................................................................)57!The)City’s)Role)in)Governance).........................................................................................................)57!Continuation)of)City)Services)..........................................................................................................)58!
Business)Improvement)District)Policies).................................................................................)59!Local)Purchasing)Preference)Policy).................................................................................................)59!Competitive!Bidding!...........................................................................................................................!59!Equal!Employment!Opportunity!.........................................................................................................!59!Lobbying!Policy!...................................................................................................................................!59!

2017 Letter from the Executive Director & Chairman Dear Downtown Stakeholder: This year marks the 20th anniversary of the Downtown Business Improvement District (BID) Corporation (also known as DowntownDC BID). DowntownDC has undergone a tremendous resurgence since 1997. It has been transformed from a dull, dirty, and dangerous place to a thriving and safe place to live, work, visit, and play. DowntownDC is not only the economic engine of DC and the DC region but is critical to the region's entertainment and cultural reputation. To help shape the future of DowntownDC, we held a series of stakeholder sessions during the summer and fall of 2016. We endeavored to gather feedback from many stakeholder groups including property owners, investors, property managers, asset managers, retailers, real estate brokers, leaders of cultural institutions, representatives from sports and entertainment venues, leaders in the tourism industry, the fashion industry, homeless service providers, residents, local government leaders and staff of DowntownDC. This business plan reflects that stakeholder input and suggestions for programs and initiatives to meet the many challenges faced by DowntownDC. These challenges include:
•! increased competition within the office market from other BIDs and surrounding counties;
•! an aging and unsafe transit system; •! growing traffic congestion; •! supporting the growing number of people choosing to live downtown and
meeting their needs; •! providing useful parks and public spaces; •! supporting the needs of people experiencing homelessness; •! improving the retail experience; •! refreshing the DowntownDC brand; •! creating a more sustainable downtown; and •! leveraging entertainment and cultural assets within the BID.

5
To help meet these challenges and provide meaningful programs and services, we are proposing a 3% increase in assessments in fiscal years 2018 and 2019 only. These slight increases, coupled with savings projected from operational efficiencies, will:
•! help fund the cost of new and enhanced maintenance and programming in Franklin Park and other public parks in DowntownDC;
•! ensure optimal SAM staffing to meet the needs of a growing residential community and nightlife economy;
•! provide resources to improve our response to safety issues and to the needs of people experiencing homelessness;
•! enhance branding and marketing of DowntownDC to ensure it remains competitive, and establish a much-needed capital replacement fund.
DowntownDC is working hard to make our downtown one of the best in the world. In a few areas, we are already there, but in others it is a transition that we will be working on for the next five years. We're glad we can count on your support. Sincerely, Neil Albert Executive Director, Downtown Business Improvement District Randall Boe Chairman of the Board, Downtown Business Improvement District
6
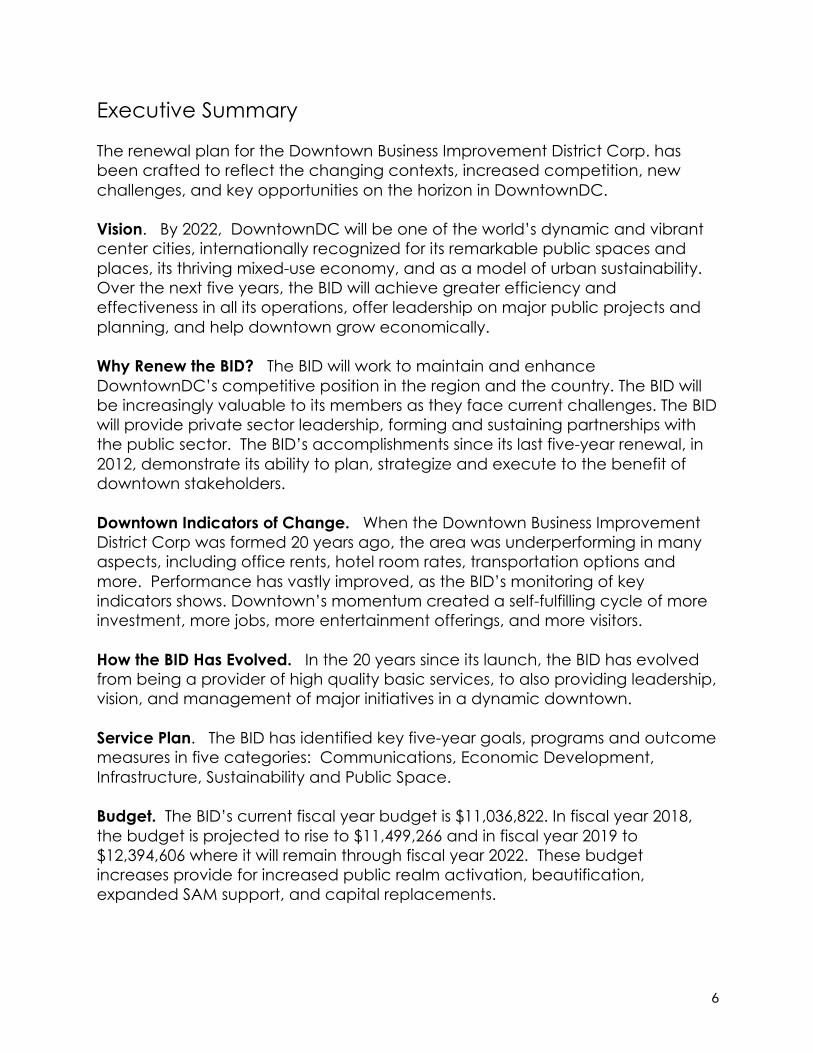
Executive Summary The renewal plan for the Downtown Business Improvement District Corp. has been crafted to reflect the changing contexts, increased competition, new challenges, and key opportunities on the horizon in DowntownDC. Vision. By 2022, DowntownDC will be one of the world’s dynamic and vibrant center cities, internationally recognized for its remarkable public spaces and places, its thriving mixed-use economy, and as a model of urban sustainability. Over the next five years, the BID will achieve greater efficiency and effectiveness in all its operations, offer leadership on major public projects and planning, and help downtown grow economically. Why Renew the BID? The BID will work to maintain and enhance DowntownDC’s competitive position in the region and the country. The BID will be increasingly valuable to its members as they face current challenges. The BID will provide private sector leadership, forming and sustaining partnerships with the public sector. The BID’s accomplishments since its last five-year renewal, in 2012, demonstrate its ability to plan, strategize and execute to the benefit of downtown stakeholders. Downtown Indicators of Change. When the Downtown Business Improvement District Corp was formed 20 years ago, the area was underperforming in many aspects, including office rents, hotel room rates, transportation options and more. Performance has vastly improved, as the BID’s monitoring of key indicators shows. Downtown’s momentum created a self-fulfilling cycle of more investment, more jobs, more entertainment offerings, and more visitors. How the BID Has Evolved. In the 20 years since its launch, the BID has evolved from being a provider of high quality basic services, to also providing leadership, vision, and management of major initiatives in a dynamic downtown. Service Plan. The BID has identified key five-year goals, programs and outcome measures in five categories: Communications, Economic Development, Infrastructure, Sustainability and Public Space. Budget. The BID’s current fiscal year budget is $11,036,822. In fiscal year 2018, the budget is projected to rise to $11,499,266 and in fiscal year 2019 to $12,394,606 where it will remain through fiscal year 2022. These budget increases provide for increased public realm activation, beautification, expanded SAM support, and capital replacements.
7
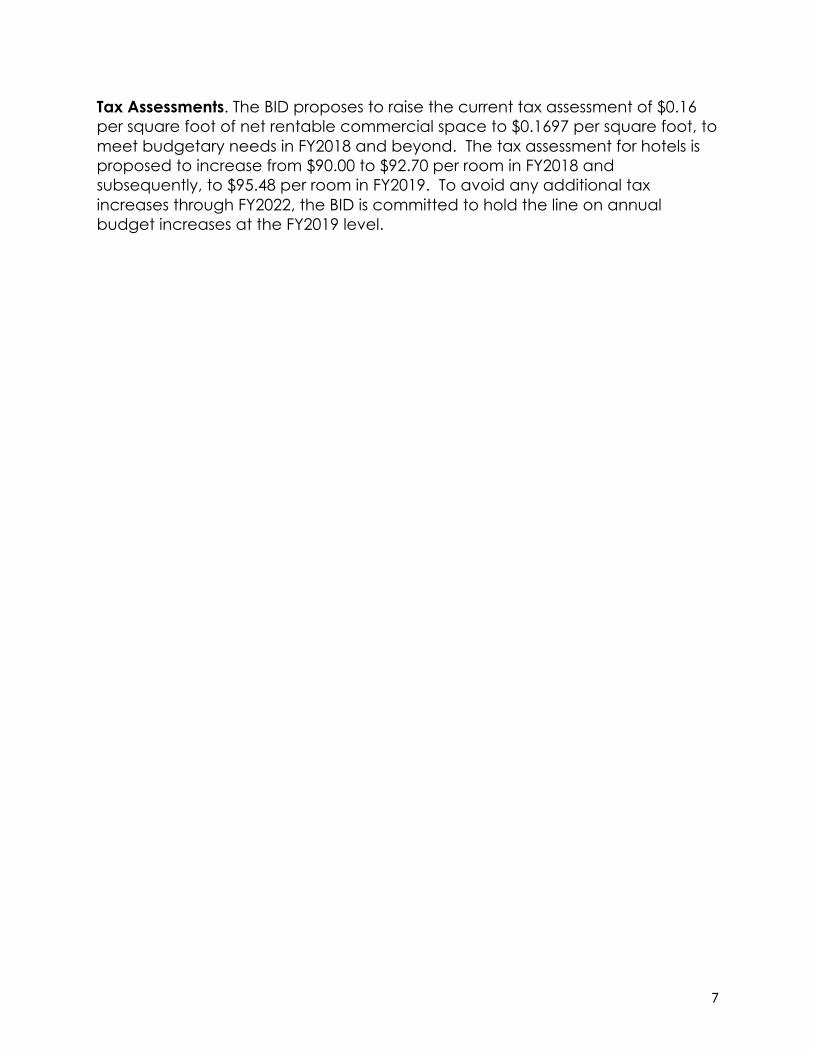
Tax Assessments. The BID proposes to raise the current tax assessment of $0.16 per square foot of net rentable commercial space to $0.1697 per square foot, to meet budgetary needs in FY2018 and beyond. The tax assessment for hotels is proposed to increase from $90.00 to $92.70 per room in FY2018 and subsequently, to $95.48 per room in FY2019. To avoid any additional tax increases through FY2022, the BID is committed to hold the line on annual budget increases at the FY2019 level.
8
A Vision for the Next Five Years In 2022, the quantity of engaging public spaces that are clean, safe and attractive will be significantly increased because of a larger BID management presence. A public spaces partnership will be implemented in 2018 between National Park Service and the city that empowers the BID to operate and manage an increasing number of parks and plazas to achieve the highest standards of performance. Through its collaboration with public agencies and private interests, the BID will provide momentum to the creation of the long-anticipated east-west transit way that eases the grip of traffic congestion. The BID’s piloting of innovative street designs will increase pedestrian spaces in the most densely used areas within downtown. The reallocation of the public right of way to facilitate efficient travel, with a priority for bus transit, will produce measurable improvements in travel time and reliability for all users. Through the BID’s working with other nonprofits and the city, the number of chronically homeless individuals living outdoors in the BID-area will be reduced from the 2017 level. A daytime drop-in center will provide a safety net for individuals in need of a variety of support services. Public and private buildings will reach higher levels of sustainability through innovative energy projects that the BID has promoted with its stakeholders. New standards of storm water management will be set by private developers and public works projects in downtown that the BID will highlight through its education and communications programs. As DowntownDC continues to grow, the BID will continue to advocate for the systems that protect it, using new technology platforms. Through social media, video technology and more, the BID will promote the high-value brand of DowntownDC in cutting-edge ways. Residential inclusion in the BID in 2018 will provide additional impetus for quality of life improvements that will benefit workers and visitors as well. With over 10,000 residents in 2022, the BID will be closer to reaching the goal of a 24/7 downtown experience.
9
Why Renew the Downtown BID?
Reasons to Renew
Downtown’s challenges in the next five years reflect changing contexts and new realities. Therefore, the reasons to renew the BID include: Maintain Competitiveness The BID will work to maintain and enhance DowntownDC’s competitive position in the region and the country. Urban centers are gaining popularity, regionally and nationally. Walkable, accessible, multi-use downtowns and town centers are attracting investment and attention. Over the next five years, DowntownDC will face new competition for commercial tenants, hotel visitors, patrons seeking cultural amenities, consumers in search of food and entertainment, and government resources. In this highly competitive context, the BID will focus on managing the “place” that is DowntownDC – enhancing its distinctiveness, accessibility, and diversity, all to ensure that DowntownDC is the economic and cultural heart of the region. Continue to Add Value
The BID will be increasingly valuable to its members as they face modern challenges. The BID’s stakeholders were once most worried about street crime, trash and other immediate problems outside their front doors. By successfully addressing these problems and making DowntownDC clean and safe, the BID has built a foundation for more intensified efforts. The BID will continue to provide high-quality clean and safety services but will also be expanding its focus on creating beautiful and useful public spaces and will be “going inside” – serving residents, developers, property managers, businesses and cultural institutions in new ways. This includes helping BID members reduce costs through sustainability efforts; providing leadership and research to aid in recruitment and retention; taking a lead role in economic development and planning efforts that directly benefit downtown; and helping leverage new sources of funding for key projects. Growth and change create new challenges and the BID stands ready to meet them: from homeland security surveillance and preparedness efforts, to addressing the problems of the electricity grid and energy prices, to solving intractable homelessness issues.
10
The BID’s added value will also be manifest in projects that make DowntownDC remarkable – highlighting its great places and spaces and creating new ones; ensuring a high level of upkeep for all assets in the public realm; and advancing regulations and policies that create an environment ripe for creative growth and attractive offerings. Provide the “Private” in “Public-Private Partnership”
The BID will provide private sector leadership, forming and sustaining partnerships with the public sector. In the next five years, downtown must tackle some major issues, and it is essential that the private sector have a partnership in forming the solutions. This includes addressing the failures of Metro while advocating for normalizing rail service that is critical to the downtown economy; stronger congestion management tactics such as doubling down on goods delivery management and expanding performance parking in downtown; and addressing the needs of individuals experiencing homelessness, unemployment and illness who occupy public spaces in downtown. These efforts will be complicated, with many stakeholders. Our members will be well-served by having strong leadership from the BID on these and other issues.
11
Accomplishments Since 2012
Communications
Technology Integration
Launched a new, interactive and mobile-friendly website which included enhanced search capabilities, content subscription options, social media integration and provided avenues for direct interaction between BID staff and site visitors, permitting the public for the first time to personally maintain their events and business information.
Implemented a BID property manager outreach program with a property manager web portal and blog. Designed and customized a comprehensive database consolidating 15 years of data using Salesforce software. Invested in more sophisticated email marketing systems that integrated with Salesforce and implemented email segmentation. Introduced in-house video production and began utilizing YouTube to share informational and promotional video on homelessness services and other topics. Produced 10 original online videos. Overhauled the BID's e-newsletter to best showcase DowntownDC stakeholders, original content, partner content, Downtown businesses and successfully increase open rates. Developed an online interactive dashboard to highlight economic development trends. Enhanced digital technology offerings by creating online annual reports, integrating the BID’s retail map with the website and partnered to create free Wifi at the Downtown Holiday Market as well as created an app for the market. Activation/Placemaking
Hosted Workout Wednesdays free exercise classes in Franklin Park for two consecutive summers, activating this park and supporting DowntownDC residents and workers.
Created a successful summer concert series in Franklin Park, DowntownDC Live, drawing hundreds of people to the park and exposing them to a variety of DowntownDC partners including Capital Fringe, the DC Jazz Festival, the Martin Luther King Jr. Memorial Library, Split This Rock and Words Beats & Life. Unveiled a healthy community initiative promoting #healthy247.

12
Partnered to host a World Cup Viewing Party on Freedom Plaza, drawing nearly 5,000 attendees, pushing the BID's Twitter followers over 5,000, drawing international and national media coverage. Bus shelter maps were redesigned and updated in more than 80 locations, featuring Downtown events, DowntownDC SAMs, providing wayfinding and branding the BID. The BID produced 100,000 Visitors Maps. Defined the borders of the BID by doubling the numbers of street pole banners and strategically placing them, including designing new banners for Chinatown. Partnerships
Partnered with key DowntownDC cultural stakeholders for the 2016 DowntownDC Live concert series including Capital Fringe, the Martin Luther King Jr. Memorial Library, Words, Beats & Life, Split This Rock. Partnered with HipCityVeg, Penn Commons, Penn Social, Buredo and other DowntownDC retailers as well as Woolly Mammoth Theatre and Capital Bikeshare through promotion opportunities to expose more members of the DowntownDC community to their businesses. Partnered with major entertainment and cultural venues including The Newseum, site of the annual State of Downtown forum, sharing these venues with hundreds of key Downtown stakeholders. Partnered with the Washington Nationals to hang promotional street pole banners in Downtown supporting their playoff run. Sponsored 1776 Challenge Cup competitions. Established a partnership with RAMW for a 2017 video series promoting Downtown restaurants. Brand/Leadership
Created a successful communications plan surrounding late-night Metro that produced a Letter to the Editor and a Close to Home article in the Washington Post, an Opinion article in the Washington Business Journal, 3 local television network affiliate interviews and inclusion in a transit leaders’ panel at Georgetown University. Gained national and local media attention for initiatives, pilots, policies and activities of the BID.
13
Economic Development
Developed a Commercial Taxes Competitiveness Proposal, which helped generate the interest in creating the DC Tax Revision Commission. Collaborated with the District of Columbia Government in the development of its Five-Year Economic Development Strategy. Provided executive leadership to the DC Tax Revision Commission, whose recommendations are in the process of being implemented from 2015 -- 2022 (including significant reductions in the personal income tax rate, business income tax rate and estate tax). Analyzed the properties surrounding Franklin Park to estimate the value increases that may be anticipated from the reconstruction of Franklin Park. Began discussions with the National Theatre on how to analyze the economic and fiscal benefits to the city of its investing in a multi-million upgrade to the National Theater.
Conducted research, analysis, constituent outreach, and fundraising activities to help launch the DC Policy Center, an organization engaged in research, communication and education activities to advance the objective of an economically vibrant and equitable District of Columbia. In collaboration with the DC BID Council, produced an office market study to inform a long-term economic strategy for DC’s office market. Collaborated with the District of Columbia Government in the development of a DC Economy Strategy to replace the 2012 Economic Development Strategy. Partnered with the Golden Triangle BID in developing a pilot program for incentivizing the conversion of office buildings to residential use, and began developing an analytical framework for estimating the city's return on investment from such a pilot program. Produced the State of Downtown, an annual economic report on the Downtown and DC economies, which highlights the strengths, weaknesses, opportunities and threats to those economies and suggests several actions to improve the performance of those economies in order to grow the city's employment and tax base.
14
Infrastructure
Completed Chinatown Park renovation in cooperation with the National Park Service that included a new irrigation system, new sidewalks and curbs, new trash cans and benches, 8 new trees, new turf and repaired historic fencing. Completed planning and environmental review of Franklin Park in collaboration with National Park Service, D.C. government and BID stakeholders. Developed the management and business plans for the renovated Franklin Park. Obtained the city’s commitment of $15 million in the DC Capital Improvement Plan for 2018. Implemented place-making in Herald Square and Franklin Park with the introduction of moveable tables, chairs and umbrellas, and new plantings in the square. In partnership with the District Department of Transportation and the National Park Service, assisted with the launch of Circulator bus service on the National Mall, linking visitors to the downtown economy. The BID provided project management services to the government agencies for service planning, including marketing and route development. Installed parking for over 500 bicycles in public spaces. In partnership with DDOT, conducted stakeholder outreach in the planning and design of the L and M Street protected bike lanes. Produced annual Bike to Work Day encouragement events that attracted over 4,000 registered participants over 5 years. Provided stakeholder outreach and field observations for DDOT as part of the Chinatown Parking Pilot planning and implementation. The pilot includes a parking availability app for on-street and off-street parking in Chinatown.
15
Public Space Operations
Safety & Maintenance (SAM)
Provided stable, low-entry, living-wage jobs with training opportunities and excellent benefits to 150 people. The clear majority (over 70%) are DC residents, which is reflected in the pride and dedication of their service to DowntownDC. Some are entering the fulltime workforce for the first time or have overcome barriers of past incarceration, homelessness, and other challenges to meaningful employment. The BID partners with community agencies such as Project Empowerment, StriveDC, the Spanish Catholic Center and others to ensure significant representation from underserved populations . 65% of the current SAMs have been team members for over 5 years. Enhanced the safe and welcoming atmosphere within the BID. Since 2012 Safety SAMs have engaged with over 1,500,000 patrons, helping in a variety of ways—giving directions, providing escorts and enriching their downtown experience. Fostered safety by increasing the “eyes and ears” on the street. SAMs logged 6,586 incidents which include lost personal items, homeless activity, accidents, and police activity. SAMS helped keep the city clean. Every day, SAMS swept sidewalks, swept curbs and removed trash and gum along the 550 blockfaces and 30 parks and smaller green spaces within the BID. This includes servicing 1,100 trash and recycling receptacles multiple times daily. Collected 1,051,197 bags of trash and 286,728 bags of recycling. This resulted in 629 tons of trash being removed from the Downtown BID. Abated over 1,800 graffiti/vandalism instances annually. Maintained through an annual painting program 3,274 light poles. Augmented the City’s snow emergence response efforts with the clearing of bike lanes, bus shelters, emergency ramps and fire hydrants. Provided additional safety and maintenance support to the hundreds of private events hosted within the BID such as the Cherry Blossom Festival, Rolling Thunder, National Police Week, The BBQ Battle, Taste of DC, and The Papal visit. Supported property managers in marketing initiatives, tenant events and safety fairs with maintenance and/or hospitality services as requested.

16
Implemented annual greening programs to beautify the BID. Installed 12.5 tons of mulch around tree bases and flower boxes. Curated and managed numerous green projects such as Freedom Plaza, the NY Ave. median, and Herald Square. Facilitated the planting of 300 new trees though collaboration with Urban Forestry, and installed and maintained 180 hanging flower baskets annually. Piloted a training program with the National Park Service that trained 20 SAMs on the repair and replacement of sidewalk pavers. In 2016 over 900 pavers were repaired and/or replaced. Provided summer jobs for 20 students participating in the DC Summer Youth Employment Program. Two of our current SAMs were hired from this program. Participated in the DC Office of Attorney General (OAG) Community Service Diversion Program to provide 25,800 hours of community service for non-violent offenders. Public Space Management/Public Safety & Preparedness
Resolved over 5,000 public space conditions. Developed GIS database and custom iOS application to monitor 90 unique public space issues and infrastructure assets. Created an inventory of 23,000 permanent assets there were inspected periodically using BID’s Quality Assurance Team. Responded to over 2,000 public space inquiries for roughly 400 unique constituents. Conducted approximately 1,750 field inspections annually. Installed seven pedestrian counters within the BID’s Entertainment Zone which document over 105,000 people on average each day. Hosted monthly Safety Alliance Council Meetings with local law enforcement partners, property managers and security managers to keep stakeholders informed and connected around safety issues within the BID.
17
Facilitated trainings and table top exercises with properties on topics such as active shooter preparedness, suspicious activity reporting, winter weather preparedness, and shelter in places scenarios. Created the BID’s Publicly Accessible AED Program resulting in data collection of over 150 locations in the BID and included seven donated AEDs from the Cheney Cardiovascular Institute at George Washington University. Certified BID staff and SAMs on first aid and AED use through the George Washington Training Center. Hosted and coordinated 13 DHS-led Surveillance Detection Courses for Local Law Enforcement Officials. Conducted lighting assessment to determine lighting standards and quality, along with any lighting conditions resulting in nearly 200 resolved lighting issues. Conducted noise/decibel assessment to determine thresholds, better understand standards and to assist in updating current noise regulations. Installed 14 new CCTV cameras in 2014 near hot spot areas, assisting MPD’s ability to receive quality footage forensically and more closely monitor criminal activity. Shared 664 alerts and notifications with stakeholders regarding public safety, infrastructure maintenance and emergency preparedness/response. Hosted 57th Presidential Inauguration Briefing with United States Secret Service and the Metropolitan Police Department to plan and educate stakeholders on impacts to downtown. Homeless Services
Engaged with homeless patrons on a daily basis in a variety of ways depending on the need. Since 2012 SAMs have logged 25,902 contacts with homeless members of the BID community. In addition, we partner with outside service providers to provide more intensive assistance aimed at moving people out of homelessness. Placed approximately 100 individuals in permanent supportive housing. Initiated 4,800 outreach interactions annually with 550 unique individuals on average each year.

18
Conducted over 200 medical and mental health services assists and 200 income and benefits assists on individuals experiencing homelessness over five years. Assessed 4,000 individuals experiencing homelessness with over 65% being recommended for permanent supportive housing. Conducted quarterly nighttime censuses since 2012 to gain a better understanding and needs of downtown’s nighttime homeless population. Piloted a weekly drop in center for homeless and vulnerable youth in partnership with Sasha Bruce Youthworks that is currently serving at least 30 young people weekly. Created the CCNV/East End Neighborhood Stakeholder Group which meets bi-monthly to address needs and conditions associated with the area. As a result of the group's collaborative efforts, the BID has been able to remedy several physical conditions around the shelter such as lighting, tree maintenance and waste management. Furthermore, the BID has helped spearhead efforts to mitigate loitering in the adjacent alleyway, broker plans for improved camera infrastructure around the shelter and help encourage increased patrols by MPD.
19
Sustainability
Produced the first of three subsequent DC Building Energy Summits aimed at property owners and manager to help them significantly reduce energy consumption and costs in their properties. The BID now has the highest concentration in the world of Energy Star labeled and LEED certified buildings. The continued production of the Building Energy Summit has been included as an action in the new five-year Clean Energy Plan by DOEE. Led participation in the Global Cities Team Challenge in partnership with the city that leveraged support from federal government, universities, nonprofit organizations and several private companies to develop a trash can sensor pilot program in the BID. The sensors provide information about the fill levels in the cans enabling BID Operations to perform trash removal in real time. Piloted the SmarterDC Business Challenge with over 100 buildings who were asked to take actions and make commitment to become more sustainable, while identifying what resources and programs would assist them in sustaining their efforts. The program was expanded and deployed citywide as the SmarterDC Challenge by the District Department of Energy and Environment, who awarded the BID its 2013 Sustainability Award for business engagement.
20
Downtown Economic Indicators of Change Over the last five years the Downtown BID has continued to experience a growth in its mixed-use market. Originally, an office destination, Downtown has been able shift its image away from the office market to a destination of retail, residential, restaurants, culture, entertainment, and hotels. With development projects, such as CityCenterDC, Capitol Crossing, and the Midtown Center Downtown is increasing its offering in sectors other than office. While this transformation is occurring, the office market remains an important force in the Downtown economy. Downtown class A office space continues to command over $60 per square foot (SF) in rent, and remains one of the lowest vacancy rates in the region at 11.9%. Even though the office market remains strong, it has become stagnant over the last two years. As the private sector concludes its process of densification, the federal government has now begun to focus on consolidating and moving its leased space outside the Downtown area. These moves have not affected the willingness of further investment in Downtown, with a further $1.6 billion worth of projects under construction at the end of 2016 Downtown hotels revenue per available room night (RevPAR) has increased from $168 to $184. Hotels have seen both increased occupancy and increased average room rates. In 1997, the average room rate in the DowntownDC BID was $142. Average rates hit $231 in 2015, only behind New York City, Boston and San Francisco. Further, the number of hotel rooms in Downtown increased from 9,602 in 2012 to 9,782 in 2016, with the addition of 3 more hotels. The convention center has also been a driver for the increase in hotel performance with 236 events occurring in 2015 compared to 208 in 2012. Downtown has experienced continuous growth in its retail and restaurant markets with more than 161 stores and 160 destination restaurants. In the last year, Downtown gained its first two Michelin star restaurant with Minibar by Jose Andres. Over the next five years Downtown expects a further 96,000 (SF) in retail and restaurant coming online, along with 283 residential units. These The growth of the retail, restaurant, entertainment, and cultural sectors has helped create a more vibrant nightlife in Downtown, helping us evolve past a daytime only economy. This shift has attracted more people to live Downtown with more than 10,300 residents in 2015. Also, Downtown has seen a huge increase in visitors since its formation in 1997 with more than 10.9 million people visiting Downtown in 2015. The array of offerings in Downtown are what is going to keep it competitive moving forward.
21
These are just some of the indicators of change in the Downtown BID since its inception. Remarkably, the Downtown BID now monitors well over 100 economic indicators in downtown, reporting on them annual in its “State of Downtown” report. Much more information indicating change over the last 20 years in the Downtown BID can be found at http://www.downtowndc.org/reports/state-of-downtown-report .
22
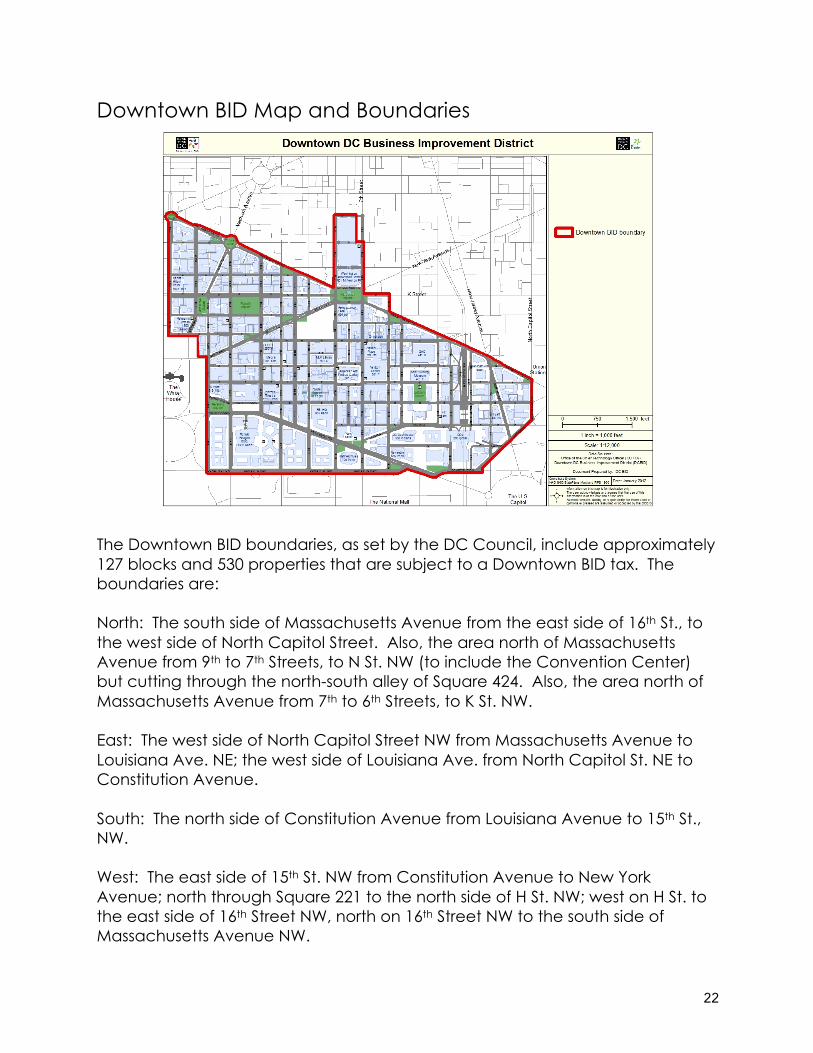
Downtown BID Map and Boundaries
The Downtown BID boundaries, as set by the DC Council, include approximately 127 blocks and 530 properties that are subject to a Downtown BID tax. The boundaries are: North: The south side of Massachusetts Avenue from the east side of 16th St., to the west side of North Capitol Street. Also, the area north of Massachusetts Avenue from 9th to 7th Streets, to N St. NW (to include the Convention Center) but cutting through the north-south alley of Square 424. Also, the area north of Massachusetts Avenue from 7th to 6th Streets, to K St. NW. East: The west side of North Capitol Street NW from Massachusetts Avenue to Louisiana Ave. NE; the west side of Louisiana Ave. from North Capitol St. NE to Constitution Avenue. South: The north side of Constitution Avenue from Louisiana Avenue to 15th St., NW. West: The east side of 15th St. NW from Constitution Avenue to New York Avenue; north through Square 221 to the north side of H St. NW; west on H St. to the east side of 16th Street NW, north on 16th Street NW to the south side of Massachusetts Avenue NW.

23
Renewal Plan
Process
The Downtown BID launched its renewal planning process in Summer 2016 by convening feedback sessions with BID members and other stakeholders representing four interest areas: commercial property, culture and entertainment, property management and retail and restaurants. Feedback from downtown residents had been collected earlier in the fall as part of the BID’s residential inclusion process and was also included the BID’s renewal planning. Members were asked to respond to the following questions: What would make Downtown more livable? An ideal place to work? A great place to visit? What is the Downtown BID doing to make Downtown more thriving and dynamic? What more could it be doing?
The stakeholders identified the following broad themes as priorities for Downtown and the BID over the next five years:
1. Keep public spaces clean and safe.
2. Activate the public realm through parks infrastructure improvements and programming.
3. Increase the focus on and services to people experiencing homelessness.
4. Attract a mix of uses to Downtown.
5. Improve accessibility to, from and within Downtown.
6. Create a clear sense of identity/place.
7. Enhance promotion of Downtown.
The BID staff produced a five-year service plan to accomplish stakeholder priorities and presented it to the BID Executive Committee on November 9, 2015. The Executive Committee approved the 2018-2022 service plan and it will be presented to the BID Board of Directors and members on January 23, 2016 for their approval. As required by law, the Mayor will hold a hearing on renewing the BID at a date to be determined in the summer of 2017.

24
Service Plan Marketing and Communications
GOALS 2018-2022 PROGRAMS OUTCOME MEASURES
Create a strong voice and identity for DowntownDC through branding and marketing to benefit all DowntownDC businesses, residents, and visitors.
Expand signature BID events (the State of Downtown Forum, Momentum Awards) to more effectively involve the public and stakeholders and increase attendance.
Brand and promote BID neighborhoods to facilitate marketing and promotion of cultural and entertainment venues and retail.
Increase BID branding and visibility in sponsored events and programming.
Increase BID’s appearances in national and local broadcast and print publications.
Facilitate public art in DowntownDC.
Facilitate earned media in national news at least 5 times per year and local news at least 15-20 beginning in FY18 and increasing thereafter.
Facilitate public art in DowntownDC by FY18. Expand that effort by FY22.
Establish placemaking that becomes a destination for locals and tourists alike by FY22.
Create distinct neighborhood maps of the BID to be displayed on bus shelters, digital and static wayfinding signs and for the website by FY18.
Create neighborhood guides by FY22 for retail and entertainment/culture.
Expand visibility related to the National Cherry Blossom Festival, FRESHFARM and other partner events

25
Develop and implement new marketing strategies for the BID related to events and programming such as the National Cherry Blossom Festival and FRESHFARM Farmers Markets
Use placemaking beginning in FY18 to activate Downtown’s public spaces and create more identity.
Reimagine BID street pole banners and refresh. Better define BID area with holiday decorations, banners, etc.
beginning in FY18 and increase by FY22.
Invest in LED snowflake lights to increase longevity and improve sustainability of holiday decorations. Begin this effort in FY18 and complete by FY22, funds permitting.
Create new ways to promote BID events in printed materials beginning in FY18.
Achieve branding consistency in the BID by FY19 including in Operations.
Increase direct engagement with stakeholders, create more opportunities for two-way communication and better communications to improve support for the DowntownDC community.
Facilitate emergency communications for stakeholders.
Host membership events quarterly.
Create “welcome” materials for businesses and office tenants.
Increase open rates for newsletter to 30-40% by FY22.
Develop and utilize apps, geofilters social media ads beginning in FY18 and increase pertinent usage each year thereafter.
Host at least four membership events per year, drawing at least 60 guests per event in FY18 and increasing average attendance each year.
26
Segment email marketing to target stakeholders with pertinent information.
Utilize technology to engage stakeholders.
Create an attractive and relevant DowntownDC Living space on the website.
Provide direct support to residents
Continue to strengthen social media strategy by retooling and updating annually.
Create a video series about restaurants and secure buy-in from partners to promote dining.
Engage community champions to promote DowntownDC.
Identify and implement ways to collect stakeholder needs and opinions.
Distribute welcome materials to every new BID businesses and tenants beginning in FY18.
Implement a residential communications plan in FY18 that includes new residential events.
Increase overall social media followers by 5,000 by FY22 and increase organic followers by 8-10% each year beginning in FY18.
Increase YouTube engagement in FY18 with a video series, to double engagement and views that year, increasing each year thereafter for the series overall with support from partners.

27
Activate DowntownDC with a wide range of programming to increase vibrancy, enhance Downtown’s reputation as a destination, improve public spaces and improve the overall perception of Downtown parks and public spaces.
Reprise and improve the DowntownDC Live Summer Concert Series beginning in Franklin Park and offer more year-round programing in the park.
Program Chinatown Park year-round with partners to make that park more of a purposeful and attractive space.
Feature Freedom Plaza, Herald Square and McPherson Square as activation sites.
Direct the expansion of updated BID branding across Operations as well as in the corporate office.
Create a new marquee public event for DowntownDC that is reprised annually. Draw between 5,000-10,000 attendees by FY22.
Implement new ways to enliven DowntownDC during the winter holidays with decorations and programming beginning in FY18. Partner to activate the National Building Museum lawn.
Create year-round programming in Franklin Park beginning in FY18 and increase attendance and exposure, including news coverage, beginning in FY19.
Create a New Year’s Eve event through partners in Downtown that helps fill hotel rooms at that time of year and eventually becomes annual and brings Downtown in line with other major New Year’s destinations in the U.S.
Draw at least 200 attendees to Chinatown Park events beginning in FY18.
28
Create a signature event on Freedom Plaza by FY22 that draws between 200-500 attendees.
Achieve branding consistency across the BID by FY19.
Secure new revenue and sponsorships to fund BID events, programming, marketing initiatives and activations.
Pilot a DowntownDC Holiday Market store.
Explore selling BID merchandise online.
Create new corporate and city partnerships that yield direct monetary support.
Earn revenue from a DowntownDC Holiday Market store in FY18 and increase that amount in FY19/20.
Earn revenue from an online store by FY22.
Secure five-figure funding and more for signature events and public programming in preparation for Franklin Park.
29
Redesign the BID website.
Redesign the website to be completed in FY18.
Improve promotion of culture and entertainment venues.
Improve promotion of retail, which continues to drive current web traffic.
Create more prominent promotion of events and happenings.
Enhance design to be more updated, more visual and more social-media integrated.
Produce more resident-relevant content on the website.
Increase traffic to a level that earns an Alexa ranking, globally at least 500,000 and domestically 150,000 by FY22.
Lower bounce rate to 60% by FY22.
Create areas for more engagement on the website.
Create a way for BID stakeholders to learn about and pay for taxes online.
Increase residents use of the website by 15% annually.
30
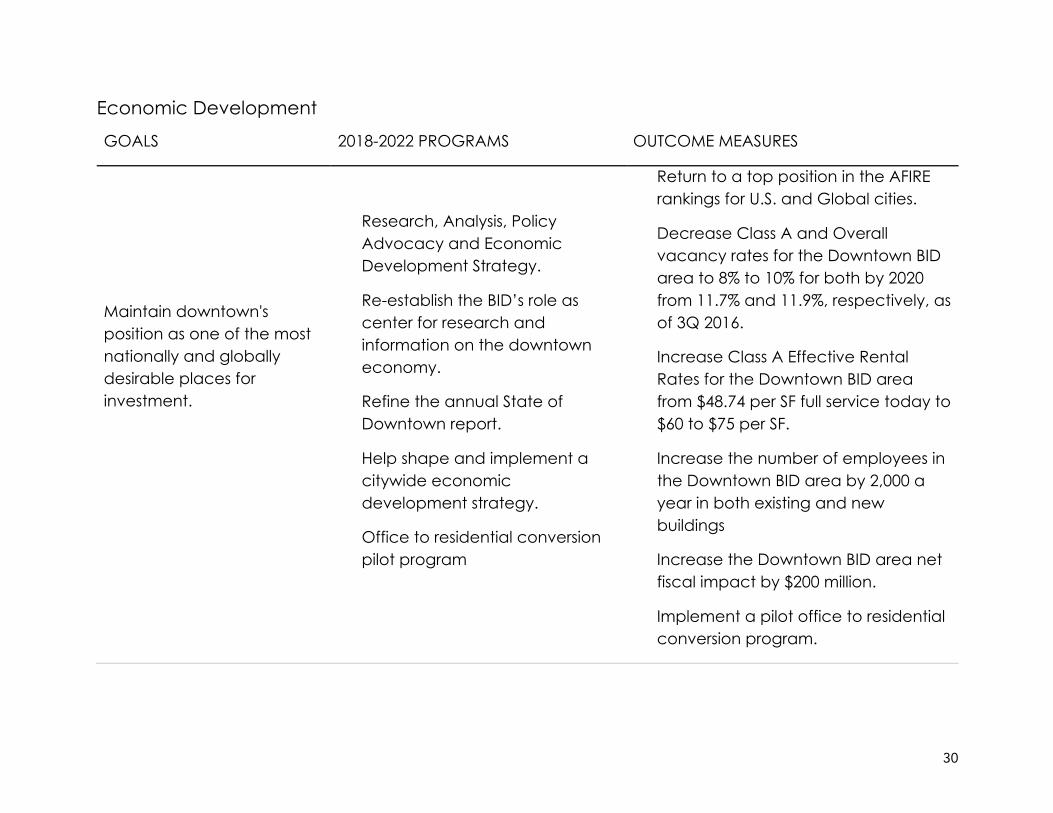
Economic Development
GOALS 2018-2022 PROGRAMS OUTCOME MEASURES
Maintain downtown's position as one of the most nationally and globally desirable places for investment.
Research, Analysis, Policy Advocacy and Economic Development Strategy.
Re-establish the BID’s role as center for research and information on the downtown economy.
Refine the annual State of Downtown report.
Help shape and implement a citywide economic development strategy.
Office to residential conversion pilot program
Return to a top position in the AFIRE rankings for U.S. and Global cities.
Decrease Class A and Overall vacancy rates for the Downtown BID area to 8% to 10% for both by 2020 from 11.7% and 11.9%, respectively, as of 3Q 2016.
Increase Class A Effective Rental Rates for the Downtown BID area from $48.74 per SF full service today to $60 to $75 per SF.
Increase the number of employees in the Downtown BID area by 2,000 a year in both existing and new buildings
Increase the Downtown BID area net fiscal impact by $200 million.
Implement a pilot office to residential conversion program.
31
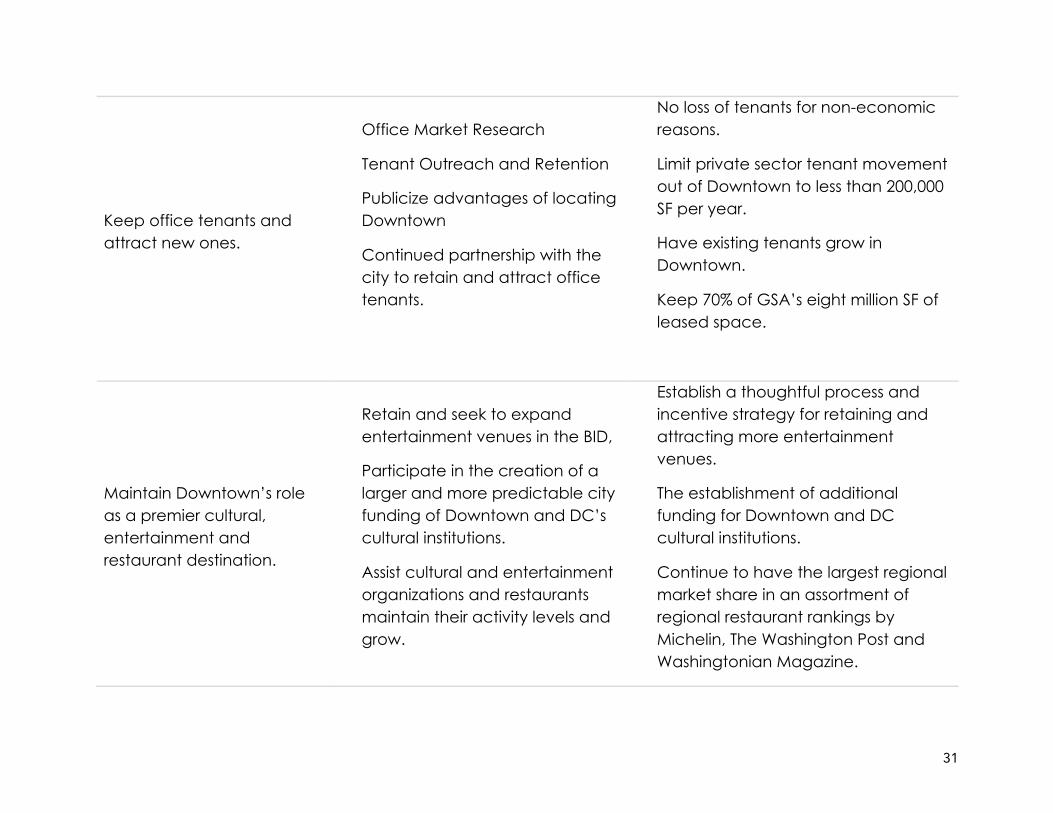
Keep office tenants and attract new ones.
Office Market Research
Tenant Outreach and Retention
Publicize advantages of locating Downtown
Continued partnership with the city to retain and attract office tenants.
No loss of tenants for non-economic reasons.
Limit private sector tenant movement out of Downtown to less than 200,000 SF per year.
Have existing tenants grow in Downtown.
Keep 70% of GSA’s eight million SF of leased space.
Maintain Downtown’s role as a premier cultural, entertainment and restaurant destination.
Retain and seek to expand entertainment venues in the BID,
Participate in the creation of a larger and more predictable city funding of Downtown and DC’s cultural institutions.
Assist cultural and entertainment organizations and restaurants maintain their activity levels and grow.
Establish a thoughtful process and incentive strategy for retaining and attracting more entertainment venues.
The establishment of additional funding for Downtown and DC cultural institutions.
Continue to have the largest regional market share in an assortment of regional restaurant rankings by Michelin, The Washington Post and Washingtonian Magazine.
32
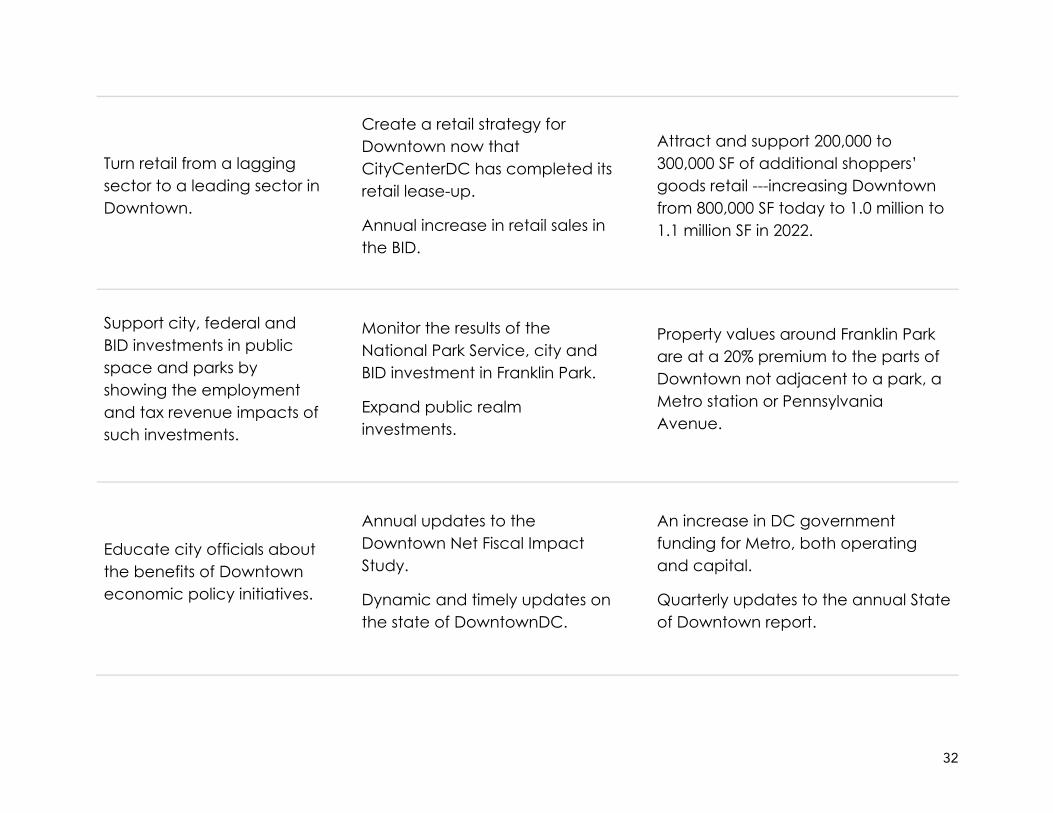
Turn retail from a lagging sector to a leading sector in Downtown.
Create a retail strategy for Downtown now that CityCenterDC has completed its retail lease-up.
Annual increase in retail sales in the BID.
Attract and support 200,000 to 300,000 SF of additional shoppers’ goods retail ---increasing Downtown from 800,000 SF today to 1.0 million to 1.1 million SF in 2022.
Support city, federal and BID investments in public space and parks by showing the employment and tax revenue impacts of such investments.
Monitor the results of the National Park Service, city and BID investment in Franklin Park.
Expand public realm investments.
Property values around Franklin Park are at a 20% premium to the parts of Downtown not adjacent to a park, a Metro station or Pennsylvania Avenue.
Educate city officials about the benefits of Downtown economic policy initiatives.
Annual updates to the Downtown Net Fiscal Impact Study.
Dynamic and timely updates on the state of DowntownDC.
An increase in DC government funding for Metro, both operating and capital.
Quarterly updates to the annual State of Downtown report.
33
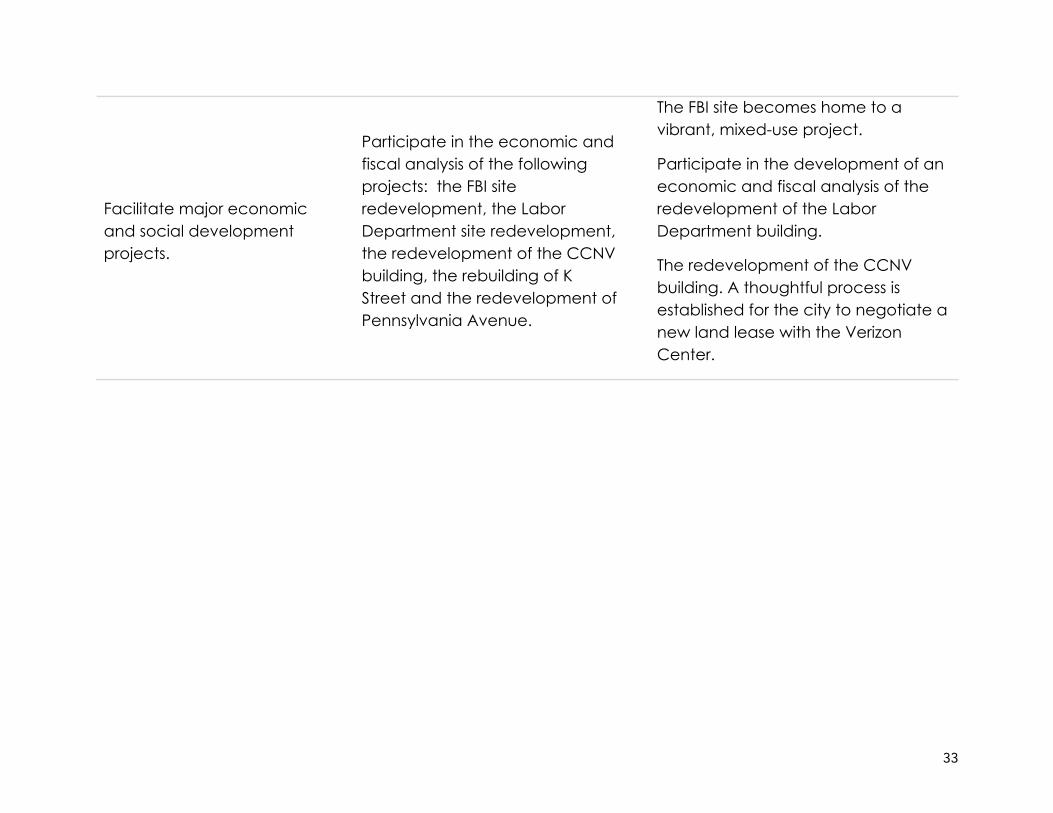
Facilitate major economic and social development projects.
Participate in the economic and fiscal analysis of the following projects: the FBI site redevelopment, the Labor Department site redevelopment, the redevelopment of the CCNV building, the rebuilding of K Street and the redevelopment of Pennsylvania Avenue.
The FBI site becomes home to a vibrant, mixed-use project.
Participate in the development of an economic and fiscal analysis of the redevelopment of the Labor Department building.
The redevelopment of the CCNV building. A thoughtful process is established for the city to negotiate a new land lease with the Verizon Center.

34
Infrastructure
GOALS 2018-2022 PROGRAMS OUTCOME MEASURES
Ensure convenient and safe access to downtown for all types of users through congestion management, improved transit, enhanced walking and bicycling conditions.
Promote the use of off-street parking to meet downtown motorist’s needs and the reallocation of on-street parking lanes for more efficient traffic flows through major downtown travel corridors.
Provide leadership for additional dedicated transit facilities in downtown, including the K Street transit-way, H and I street bus lanes and 16th Street bus lanes.
Support WMATA’s rebuilding efforts to improve bus and rail service reliability and DDOT’s Circulator improvement efforts.
Preserve WMATA late-night rail service; advocate for a network of late night bus routes; advocate for fare policy changes to boost transit ridership.
Achieve more reliable travel times for all modes on major street corridors.
Communicate the value to downtown of congestion management strategies to BID members through internal and external media outlets.
Incorporate transportation demand management messaging for all BID programming.
Serve as a conduit for property management, employers, retailers and hospitality destinations to existing transportation demand management services.
Represent BID interests in DDOT/WMATA service and facility planning.
Provide information and recommendations to improve
35
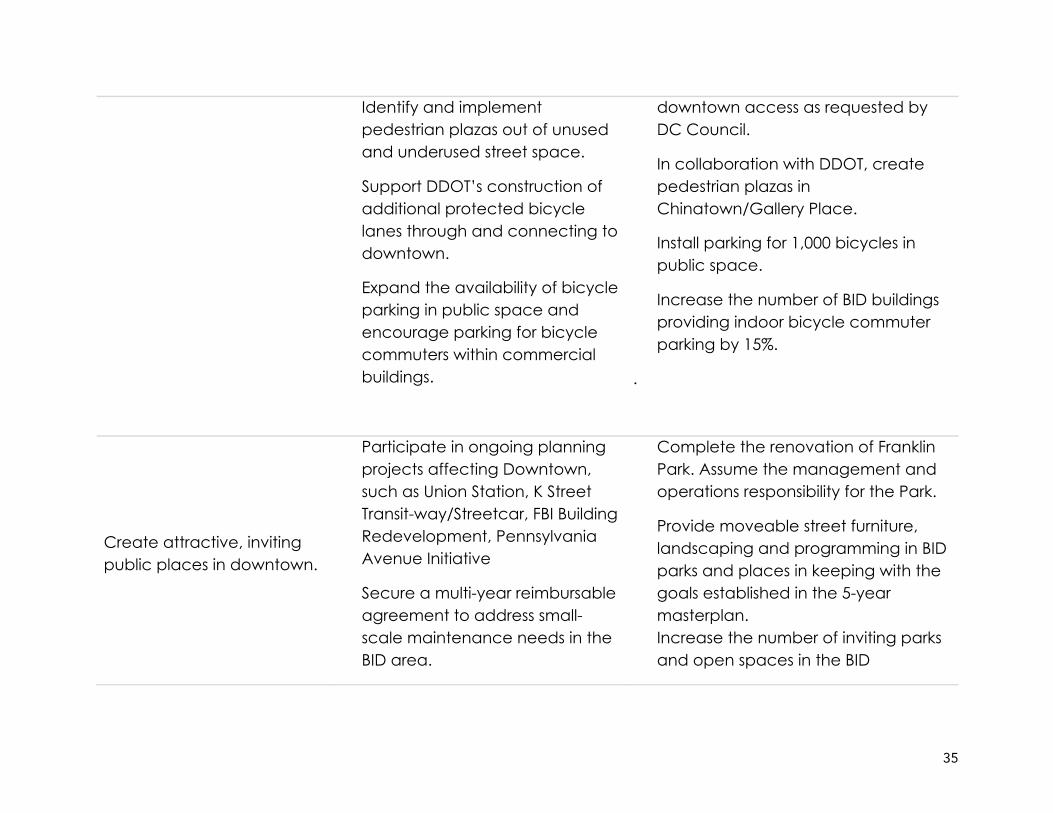
Identify and implement pedestrian plazas out of unused and underused street space.
Support DDOT’s construction of additional protected bicycle lanes through and connecting to downtown.
Expand the availability of bicycle parking in public space and encourage parking for bicycle commuters within commercial buildings.
downtown access as requested by DC Council.
In collaboration with DDOT, create pedestrian plazas in Chinatown/Gallery Place.
Install parking for 1,000 bicycles in public space.
Increase the number of BID buildings providing indoor bicycle commuter parking by 15%.
.
Create attractive, inviting public places in downtown.
Participate in ongoing planning projects affecting Downtown, such as Union Station, K Street Transit-way/Streetcar, FBI Building Redevelopment, Pennsylvania Avenue Initiative
Secure a multi-year reimbursable agreement to address small-scale maintenance needs in the BID area.
Complete the renovation of Franklin Park. Assume the management and operations responsibility for the Park.
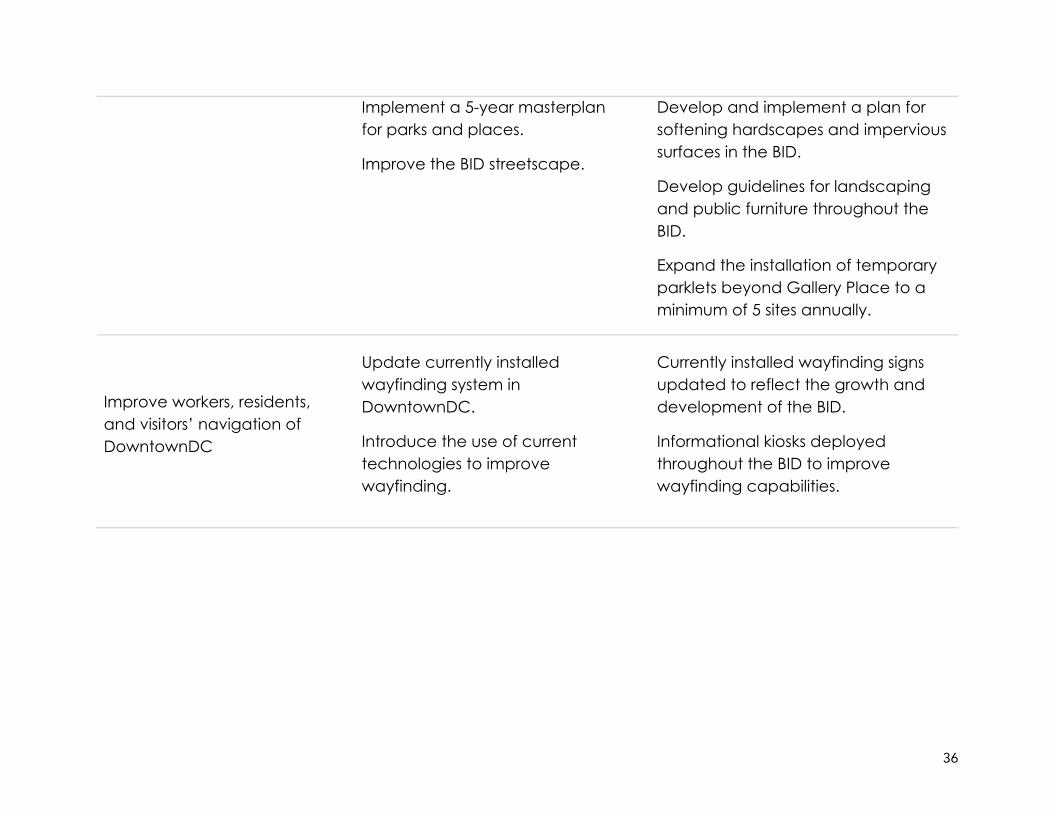
Provide moveable street furniture, landscaping and programming in BID parks and places in keeping with the goals established in the 5-year masterplan. Increase the number of inviting parks and open spaces in the BID
36
Implement a 5-year masterplan for parks and places.
Improve the BID streetscape.
Develop and implement a plan for softening hardscapes and impervious surfaces in the BID.
Develop guidelines for landscaping and public furniture throughout the BID.
Expand the installation of temporary parklets beyond Gallery Place to a minimum of 5 sites annually.
Improve workers, residents, and visitors’ navigation of DowntownDC
Update currently installed wayfinding system in DowntownDC.
Introduce the use of current technologies to improve wayfinding.
Currently installed wayfinding signs updated to reflect the growth and development of the BID.
Informational kiosks deployed throughout the BID to improve wayfinding capabilities.

37
Public Space Operations
Operations
GOALS 2018-2022 PROGRAMS OUTCOME MEASURES
Deploy the Safety and Maintenance personnel (SAMs) in a way that enhances the perception of Downtown as a welcoming, and inviting place.
Develop a dynamic deployment system for SAMs to best address the dynamic needs of patrons and to optimize impact.
Increase the numbers and types of assists provided by SAMs.
Ensure consistently high levels of cleanliness throughout the BID.
Analyze schedules and adjust deployment of machine teams and zone cleaners to support the dynamic nature of how patrons experience the BID.
Standardize procedures to ensure consistent levels of cleanliness across all teams.
Manage the "up time" of vehicles and machines and keep it over 80%.
Service 1,100 trash and recycling bins several times daily.
Sweep sidewalks, sweep curb lines, remove trash across all 550 blockfaces within the BID several times daily.
Power wash every sidewalk within the BID 2x each year.
Remove gum and remove graffiti as necessary.

38
Maintain capital replacement plan for large equipment; establish procurement process that thoroughly evaluates all options.
Create standard operating procedures for all tasks.
Create and maintain a calendar of seasonal priorities.
Seasonally, augment City services such as snow and leaf removal as necessary.
High-quality maintenance of public assets within the BID.
Maintain the practice of regular, thorough quality assurance surveys by SAMs, measuring all aspects of the public realm.
Serve as the premier point of contact for BID stakeholders to get defects reported and addressed either by maintenance SAMs or by the appropriate City agency.
Use quality assurance data to inform and direct the maintenance activities of SAMs as appropriate.
Maintain annual closure rate of 75% or greater of issues reported to the partner agencies.
Documented 24-hour response to constituent concerns and immediate reporting to appropriate city agency.
Use of technology to feed and receive feedback on public space defects reports to the city's 311 system.
Dramatically reduce the backlog of sidewalk repairs within the BID.
39
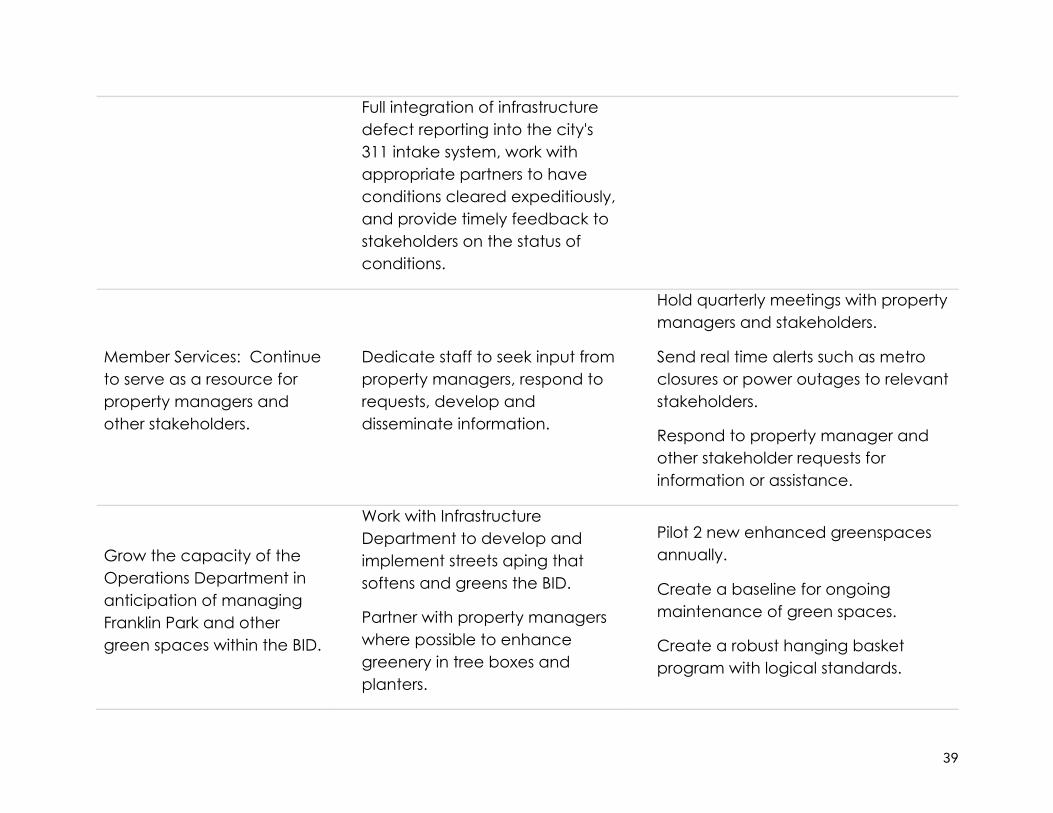
Full integration of infrastructure defect reporting into the city's 311 intake system, work with appropriate partners to have conditions cleared expeditiously, and provide timely feedback to stakeholders on the status of conditions.
Member Services: Continue to serve as a resource for property managers and other stakeholders.
Dedicate staff to seek input from property managers, respond to requests, develop and disseminate information.
Hold quarterly meetings with property managers and stakeholders.
Send real time alerts such as metro closures or power outages to relevant stakeholders.
Respond to property manager and other stakeholder requests for information or assistance.
Grow the capacity of the Operations Department in anticipation of managing Franklin Park and other green spaces within the BID.
Work with Infrastructure Department to develop and implement streets aping that softens and greens the BID.
Partner with property managers where possible to enhance greenery in tree boxes and planters.
Pilot 2 new enhanced greenspaces annually.
Create a baseline for ongoing maintenance of green spaces.
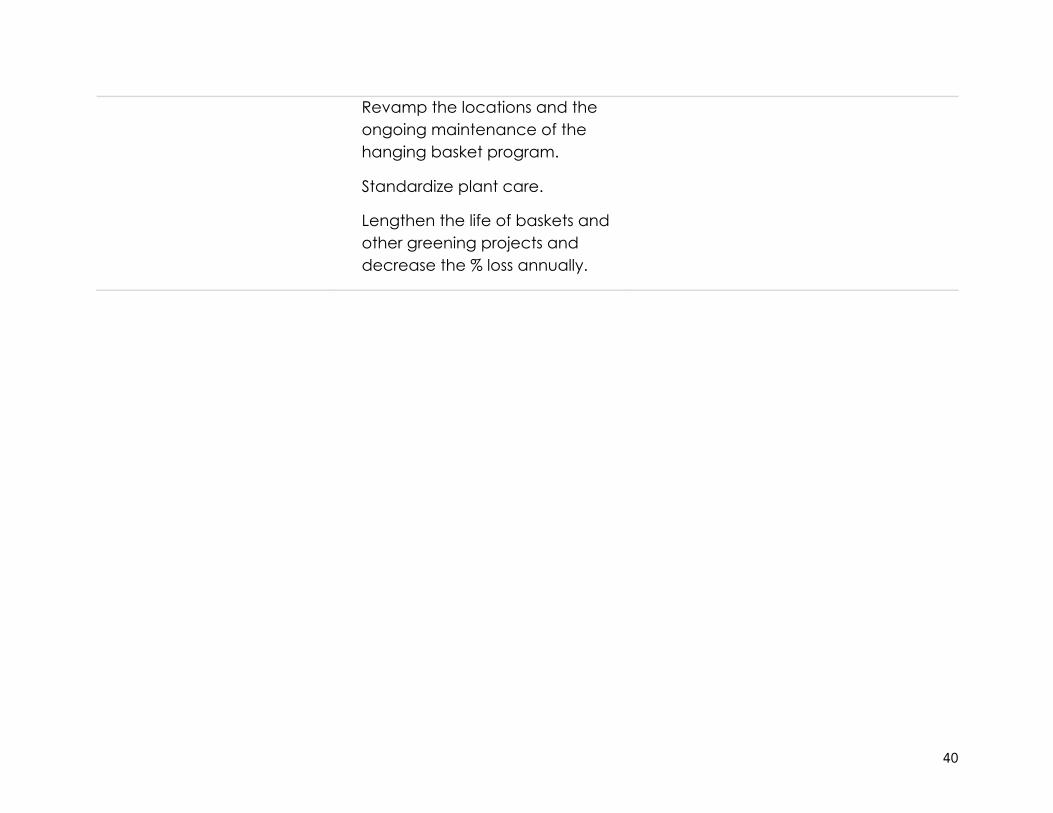
Create a robust hanging basket program with logical standards.
40
Revamp the locations and the ongoing maintenance of the hanging basket program.
Standardize plant care.
Lengthen the life of baskets and other greening projects and decrease the % loss annually.
41
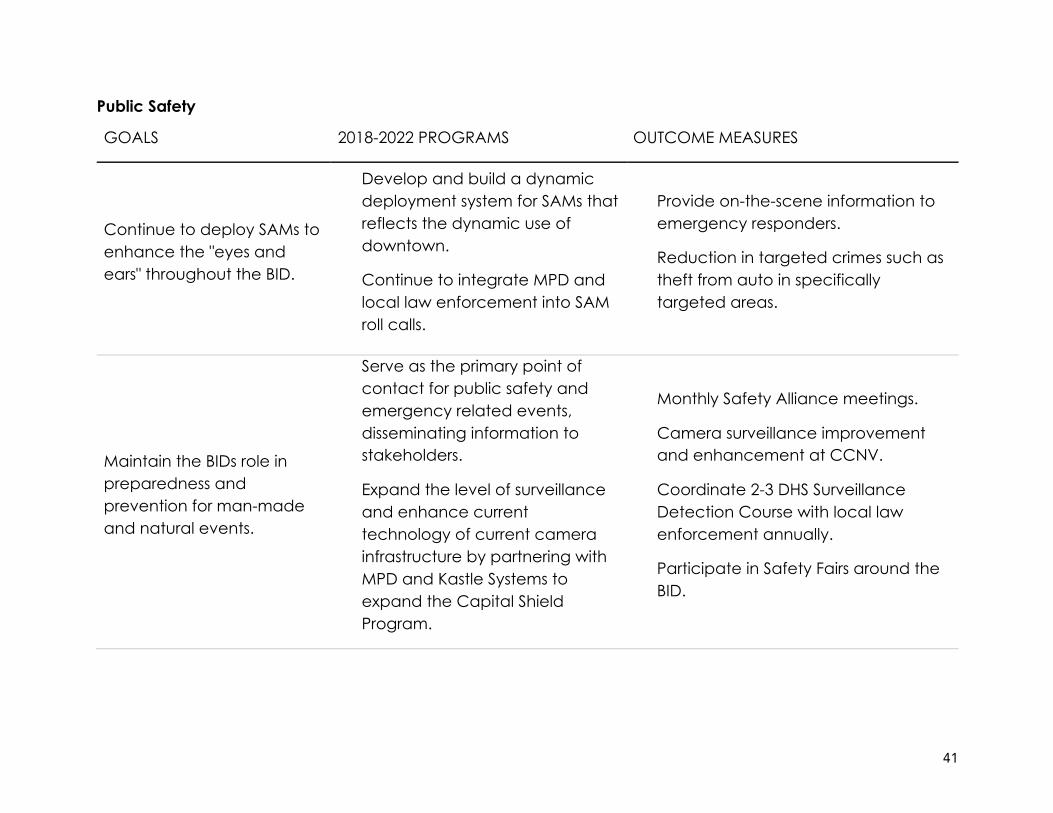
Public Safety
GOALS 2018-2022 PROGRAMS OUTCOME MEASURES
Continue to deploy SAMs to enhance the "eyes and ears" throughout the BID.
Develop and build a dynamic deployment system for SAMs that reflects the dynamic use of downtown.
Continue to integrate MPD and local law enforcement into SAM roll calls.
Provide on-the-scene information to emergency responders.
Reduction in targeted crimes such as theft from auto in specifically targeted areas.
Maintain the BIDs role in preparedness and prevention for man-made and natural events.
Serve as the primary point of contact for public safety and emergency related events, disseminating information to stakeholders.
Expand the level of surveillance and enhance current technology of current camera infrastructure by partnering with MPD and Kastle Systems to expand the Capital Shield Program.
Monthly Safety Alliance meetings.
Camera surveillance improvement and enhancement at CCNV.
Coordinate 2-3 DHS Surveillance Detection Course with local law enforcement annually.
Participate in Safety Fairs around the BID.

42
Integrate SAM preparedness & prevention role into regular duties.
Establish training and policies to prepare SAMs to play a role in preparedness and prevention efforts - including participation in joint safety training exercises, "see something, say something" programs and more.
43
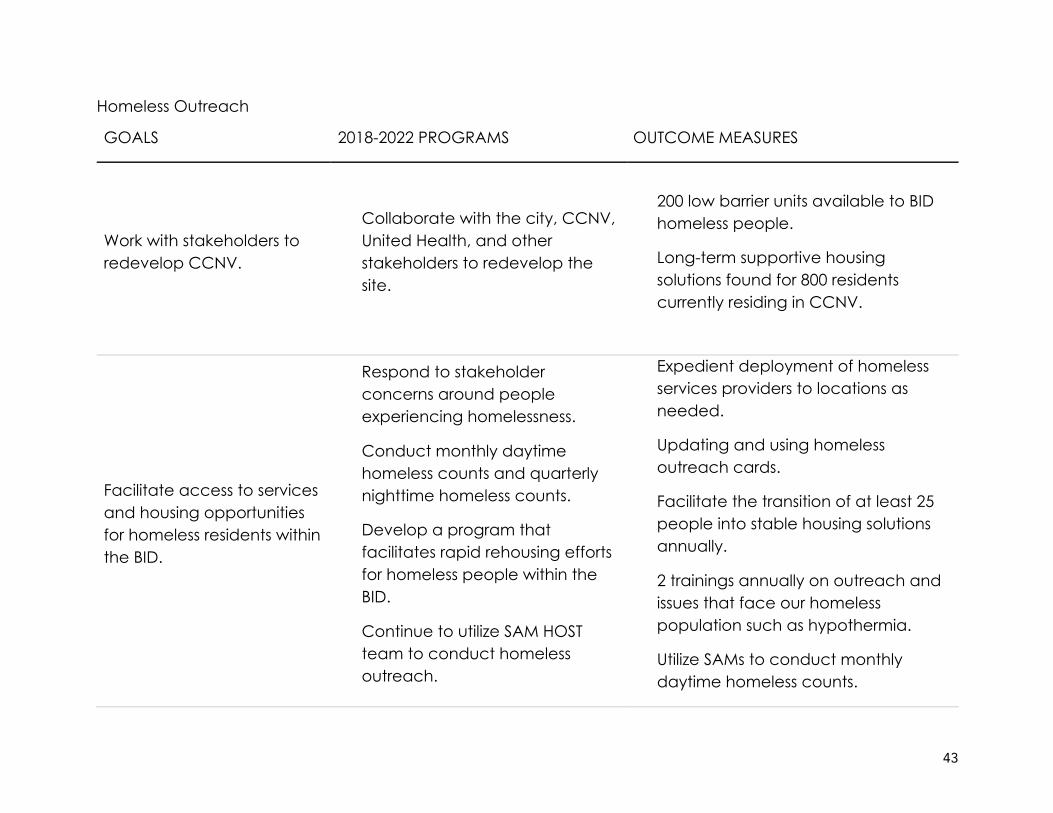
Homeless Outreach
GOALS 2018-2022 PROGRAMS OUTCOME MEASURES
Work with stakeholders to redevelop CCNV.
Collaborate with the city, CCNV, United Health, and other stakeholders to redevelop the site.
200 low barrier units available to BID homeless people.
Long-term supportive housing solutions found for 800 residents currently residing in CCNV.
Facilitate access to services and housing opportunities for homeless residents within the BID.
Respond to stakeholder concerns around people experiencing homelessness.
Conduct monthly daytime homeless counts and quarterly nighttime homeless counts.
Develop a program that facilitates rapid rehousing efforts for homeless people within the BID.
Continue to utilize SAM HOST team to conduct homeless outreach.
Expedient deployment of homeless services providers to locations as needed.
Updating and using homeless outreach cards.
Facilitate the transition of at least 25 people into stable housing solutions annually.
2 trainings annually on outreach and issues that face our homeless population such as hypothermia.
Utilize SAMs to conduct monthly daytime homeless counts.
44
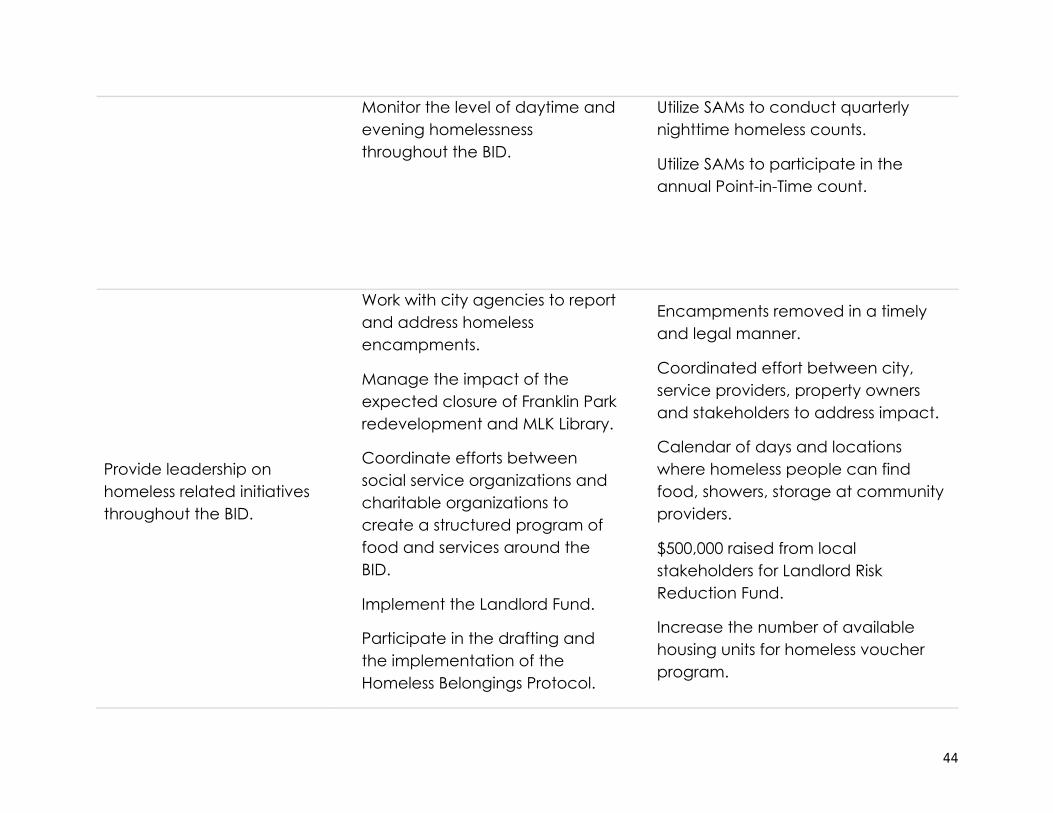
Monitor the level of daytime and evening homelessness throughout the BID.
Utilize SAMs to conduct quarterly nighttime homeless counts.
Utilize SAMs to participate in the annual Point-in-Time count.
Provide leadership on homeless related initiatives throughout the BID.
Work with city agencies to report and address homeless encampments.
Manage the impact of the expected closure of Franklin Park redevelopment and MLK Library.
Coordinate efforts between social service organizations and charitable organizations to create a structured program of food and services around the BID.
Implement the Landlord Fund.
Participate in the drafting and the implementation of the Homeless Belongings Protocol.
Encampments removed in a timely and legal manner.
Coordinated effort between city, service providers, property owners and stakeholders to address impact.
Calendar of days and locations where homeless people can find food, showers, storage at community providers.
$500,000 raised from local stakeholders for Landlord Risk Reduction Fund.
Increase the number of available housing units for homeless voucher program.

45
Reduced disorder in public spaces.
Clearly articulated process for collecting, storing and or removing the belongings of homeless people within the BID.
Continue to partner with the City to develop and maintain a day time service center for the homeless.

46
Sustainability
GOALS 2018-2022 PROGRAMS OUTCOME MEASURES
Smart:
Establish the BID as an internationally-recognized “smart” innovation district.
Work with DOEE to develop and apply the USGBC LEED for Cities platform into a global standard for automated monitoring and reporting sustainability progress.
Lead the development of the Global Cities Team Challenge Built Environment Super Cluster to attract new investment to the District.
Participate in the OCTO led Tiger Team to provide coordinated development and implementation of Smart City solutions citywide.
Promote DowntownDC as a venue for implementing innovative solutions by providing extensive recognition for best in class solutions.
Creation of a streamlined one-stop platform for entering building data needed for multiple reporting certifications – LEED, WELL, GRESB, EDGE, etc.
On-demand performance metrics to compare individual buildings and portfolios to progress levels at the district, city and region.
Open data, disruptive technologies, and innovative processes are routinely integrated, deployed, and reported upon at a business, building and district level.
Historical and real-time sensor and meter data is utilized to inform decision making.
Raises profile of DowntownDC and attracts companies and talent to locate in the area.

47
Sustainable:
Achieve greater annual reductions in GHG emissions and resource consumption (energy, water, raw materials, food) to meet and exceed SustainableDC Plan targets.
SmarterDC Challenge – automate ability for businesses and buildings to participate using Maalka’s data normalization platform.
Expand the transparent DGS Build Smart DC platform usage to include private sector buildings of all sizes.
Prioritize achievement of the District’s Better Buildings Challenge commitment for energy use reduction.
Work with DOE to optimize implementation of demand side management solutions by targeting incentives and finance solutions.
Work with DPW and DOEE to craft and implement a performance-based Zero Waste program for the District that emphasizes data and education.
Minimum of 200% increase in participation and retention rates as barriers removed, benefits become tangible, and reporting is generated monthly or on-demand.
Achieve engagement of B & C Class properties as well as small business at scale and to their great financial benefit.
Buildings will have reduced energy consumption by 20% or more by 2020 when compared to 2011 baselines.
Buildings become virtual generators of energy, reducing infrastructure needs and increasing ability to reduce peak rates, generate revenue from grid market, and reduce risk related to system outages.
Buildings have easier means of accurately reporting diversion rates, GHG emissions and engaging occupants in program.
Creation of a pipeline of projects required to create stable pathways to address unemployment that also

48
Work with DOEE, DOES and DMPED to prioritize high-return investments in programs like LED replacements.
provide economic return for participating buildings.
Connected:
Maintain, enhance, and secure the District’s broadband and other communications infrastructure.
Implement closed LoRaWan Network for enterprise level business and open development network to spur start-up businesses and workforce development.
Support District’s participation in the Advanced Wireless Research Platform and expansion of scope and quality of public WiFi.
Work with OCTO to expand benefits of participation in Gigabit City program.
Provide DowntownDC stakeholders with a low-cost, secure solution for deployment of sensor systems necessary to monitor a variety of building conditions in real-time.
Ensures that the District remains competitive in the attraction of businesses dependent on stable, secure high-speed communications.
Achieve engagement of the universities, think tanks, national labs, corporations, and small companies as research partners.
49
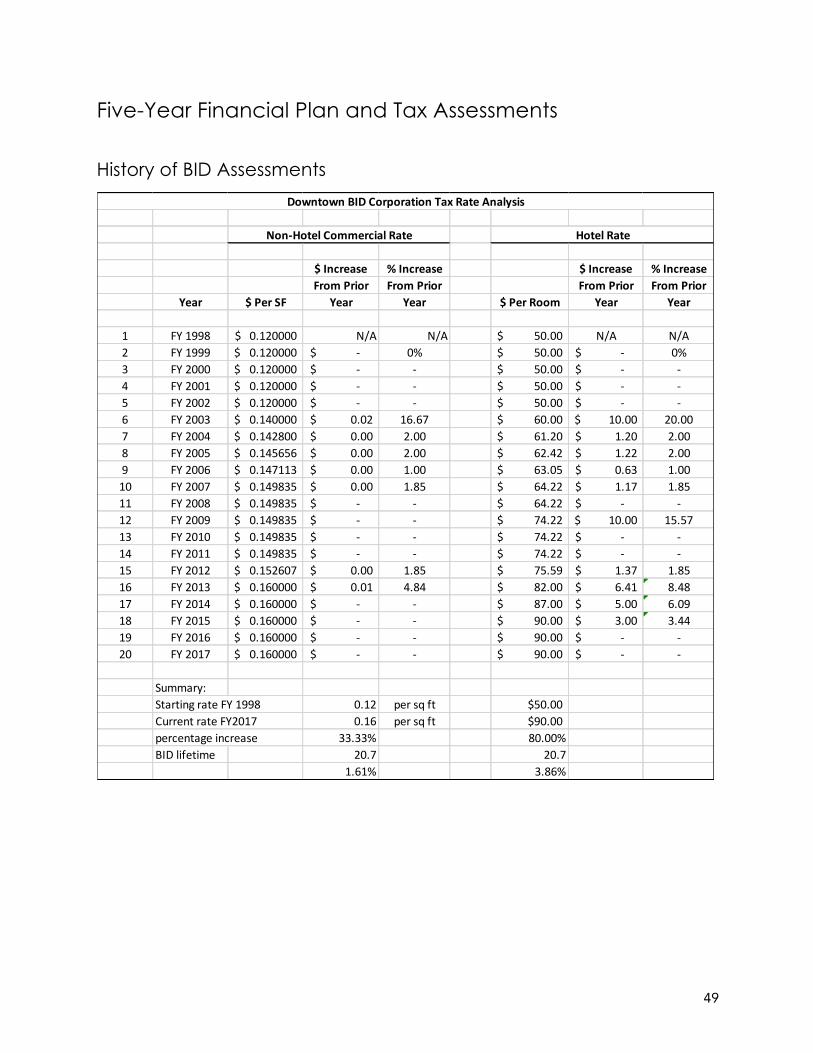
Five-Year Financial Plan and Tax Assessments
History of BID Assessments
$"Increase %"Increase $"Increase %"IncreaseFrom"Prior From"Prior From"Prior From"Prior
Year $"Per"SF Year Year $"Per"Room Year Year
1 FY$1998 0.120000$$$$$ N/A N/A 50.00$$$$$$$$$$$$$ N/A N/A2 FY$1999 0.120000$$$$$ /$$$$$$$$$$$$$$$$ 0% 50.00$$$$$$$$$$$$$ /$$$$$$$$$$$$$$$$ 0%3 FY$2000 0.120000$$$$$ /$$$$$$$$$$$$$$$$ / 50.00$$$$$$$$$$$$$ /$$$$$$$$$$$$$$$$ /4 FY$2001 0.120000$$$$$ /$$$$$$$$$$$$$$$$ / 50.00$$$$$$$$$$$$$ /$$$$$$$$$$$$$$$$ /5 FY$2002 0.120000$$$$$ /$$$$$$$$$$$$$$$$ / 50.00$$$$$$$$$$$$$ /$$$$$$$$$$$$$$$$ /6 FY$2003 0.140000$$$$$ 0.02$$$$$$$$$$$$$$ 16.67 60.00$$$$$$$$$$$$$ 10.00$$$$$$$$$$$$ 20.007 FY$2004 0.142800$$$$$ 0.00$$$$$$$$$$$$$$ 2.00 61.20$$$$$$$$$$$$$ 1.20$$$$$$$$$$$$$$ 2.008 FY$2005 0.145656$$$$$ 0.00$$$$$$$$$$$$$$ 2.00 62.42$$$$$$$$$$$$$ 1.22$$$$$$$$$$$$$$ 2.009 FY$2006 0.147113$$$$$ 0.00$$$$$$$$$$$$$$ 1.00 63.05$$$$$$$$$$$$$ 0.63$$$$$$$$$$$$$$ 1.0010 FY$2007 0.149835$$$$$ 0.00$$$$$$$$$$$$$$ 1.85 64.22$$$$$$$$$$$$$ 1.17$$$$$$$$$$$$$$ 1.8511 FY$2008 0.149835$$$$$ /$$$$$$$$$$$$$$$$ / 64.22$$$$$$$$$$$$$ /$$$$$$$$$$$$$$$$ /12 FY$2009 0.149835$$$$$ /$$$$$$$$$$$$$$$$ / 74.22$$$$$$$$$$$$$ 10.00$$$$$$$$$$$$ 15.5713 FY$2010 0.149835$$$$$ /$$$$$$$$$$$$$$$$ / 74.22$$$$$$$$$$$$$ /$$$$$$$$$$$$$$$$ /14 FY$2011 0.149835$$$$$ /$$$$$$$$$$$$$$$$ / 74.22$$$$$$$$$$$$$ /$$$$$$$$$$$$$$$$ /15 FY$2012 0.152607$$$$$ 0.00$$$$$$$$$$$$$$ 1.85 75.59$$$$$$$$$$$$$ 1.37$$$$$$$$$$$$$$ 1.8516 FY$2013 0.160000$$$$$ 0.01$$$$$$$$$$$$$$ 4.84 82.00$$$$$$$$$$$$$ 6.41$$$$$$$$$$$$$$ 8.4817 FY$2014 0.160000$$$$$ /$$$$$$$$$$$$$$$$ / 87.00$$$$$$$$$$$$$ 5.00$$$$$$$$$$$$$$ 6.0918 FY$2015 0.160000$$$$$ /$$$$$$$$$$$$$$$$ / 90.00$$$$$$$$$$$$$ 3.00$$$$$$$$$$$$$$ 3.4419 FY$2016 0.160000$$$$$ /$$$$$$$$$$$$$$$$ / 90.00$$$$$$$$$$$$$ /$$$$$$$$$$$$$$$$ /20 FY$2017 0.160000$$$$$ /$$$$$$$$$$$$$$$$ / 90.00$$$$$$$$$$$$$ /$$$$$$$$$$$$$$$$ /
Summary:Starting$rate$FY$1998 0.12 per$sq$ft $50.00Current$rate$FY2017 0.16 per$sq$ft $90.00percentage$increase 33.33% 80.00%BID$lifetime 20.7 20.7
1.61% 3.86%
Non4Hotel"Commercial"Rate Hotel"Rate
Downtown"BID"Corporation"Tax"Rate"Analysis
50
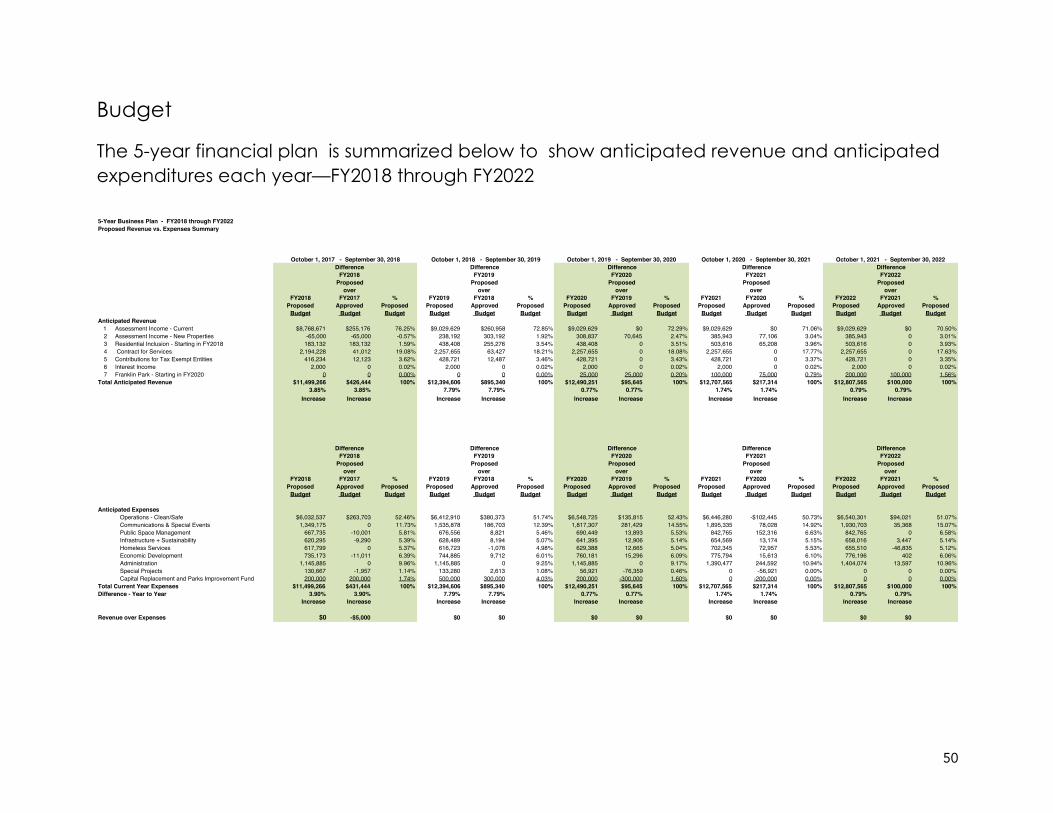
Budget
The 5-year financial plan is summarized below to show anticipated revenue and anticipated expenditures each year—FY2018 through FY2022
5-Year Business Plan - FY2018 through FY2022Proposed Revenue vs. Expenses Summary
Difference Difference Difference Difference DifferenceFY2018 FY2019 FY2020 FY2021 FY2022
Proposed Proposed Proposed Proposed Proposedover over over over over
FY2018 FY2017 % FY2019 FY2018 % FY2020 FY2019 % FY2021 FY2020 % FY2022 FY2021 %Proposed Approved Proposed Proposed Approved Proposed Proposed Approved Proposed Proposed Approved Proposed Proposed Approved Proposed
Budget Budget Budget Budget Budget Budget Budget Budget Budget Budget Budget Budget Budget Budget BudgetAnticipated Revenue
1 Assessment Income - Current $8,768,671 $255,176 76.25% $9,029,629 $260,958 72.85% $9,029,629 $0 72.29% $9,029,629 $0 71.06% $9,029,629 $0 70.50%2 Assessment Income - New Properties -65,000 -65,000 -0.57% 238,192 303,192 1.92% 308,837 70,645 2.47% 385,943 77,106 3.04% 385,943 0 3.01%3 Residential Inclusion - Starting in FY2018 183,132 183,132 1.59% 438,408 255,276 3.54% 438,408 0 3.51% 503,616 65,208 3.96% 503,616 0 3.93%4 Contract for Services 2,194,228 41,012 19.08% 2,257,655 63,427 18.21% 2,257,655 0 18.08% 2,257,655 0 17.77% 2,257,655 0 17.63%5 Contributions for Tax Exempt Entities 416,234 12,123 3.62% 428,721 12,487 3.46% 428,721 0 3.43% 428,721 0 3.37% 428,721 0 3.35%6 Interest Income 2,000 0 0.02% 2,000 0 0.02% 2,000 0 0.02% 2,000 0 0.02% 2,000 0 0.02%7 Franklin Park - Starting in FY2020 0 0 0.00% 0 0 0.00% 25,000 25,000 0.20% 100,000 75,000 0.79% 200,000 100,000 1.56%
Total Anticipated Revenue $11,499,266 $426,444 100% $12,394,606 $895,340 100% $12,490,251 $95,645 100% $12,707,565 $217,314 100% $12,807,565 $100,000 100%3.85% 3.85% 7.79% 7.79% 0.77% 0.77% 1.74% 1.74% 0.79% 0.79%
Increase Increase Increase Increase Increase Increase Increase Increase Increase Increase
Difference Difference Difference Difference DifferenceFY2018 FY2019 FY2020 FY2021 FY2022
Proposed Proposed Proposed Proposed Proposedover over over over over
FY2018 FY2017 % FY2019 FY2018 % FY2020 FY2019 % FY2021 FY2020 % FY2022 FY2021 %Proposed Approved Proposed Proposed Approved Proposed Proposed Approved Proposed Proposed Approved Proposed Proposed Approved Proposed
Budget Budget Budget Budget Budget Budget Budget Budget Budget Budget Budget Budget Budget Budget Budget
Anticipated Expenses Operations - Clean/Safe $6,032,537 $263,703 52.46% $6,412,910 $380,373 51.74% $6,548,725 $135,815 52.43% $6,446,280 -$102,445 50.73% $6,540,301 $94,021 51.07% Communications & Special Events 1,349,175 0 11.73% 1,535,878 186,703 12.39% 1,817,307 281,429 14.55% 1,895,335 78,028 14.92% 1,930,703 35,368 15.07% Public Space Management 667,735 -10,001 5.81% 676,556 8,821 5.46% 690,449 13,893 5.53% 842,765 152,316 6.63% 842,765 0 6.58% Infrastructure + Sustainability 620,295 -9,290 5.39% 628,489 8,194 5.07% 641,395 12,906 5.14% 654,569 13,174 5.15% 658,016 3,447 5.14% Homeless Services 617,799 0 5.37% 616,723 -1,076 4.98% 629,388 12,665 5.04% 702,345 72,957 5.53% 655,510 -46,835 5.12% Economic Development 735,173 -11,011 6.39% 744,885 9,712 6.01% 760,181 15,296 6.09% 775,794 15,613 6.10% 776,196 402 6.06% Administration 1,145,885 0 9.96% 1,145,885 0 9.25% 1,145,885 0 9.17% 1,390,477 244,592 10.94% 1,404,074 13,597 10.96% Special Projects 130,667 -1,957 1.14% 133,280 2,613 1.08% 56,921 -76,359 0.46% 0 -56,921 0.00% 0 0 0.00% Capital Replacement and Parks Improvement Fund 200,000 200,000 1.74% 500,000 300,000 4.03% 200,000 -300,000 1.60% 0 -200,000 0.00% 0 0 0.00%
Total Current Year Expenses $11,499,266 $431,444 100% $12,394,606 $895,340 100% $12,490,251 $95,645 100% $12,707,565 $217,314 100% $12,807,565 $100,000 100%Difference - Year to Year 3.90% 3.90% 7.79% 7.79% 0.77% 0.77% 1.74% 1.74% 0.79% 0.79%
Increase Increase Increase Increase Increase Increase Increase Increase Increase Increase
Revenue over Expenses $0 -$5,000 $0 $0 $0 $0 $0 $0 $0 $0
October 1, 2021 - September 30, 2022October 1, 2017 - September 30, 2018 October 1, 2018 - September 30, 2019 October 1, 2019 - September 30, 2020 October 1, 2020 - September 30, 2021

51
Proposed Revenue
The BID’s anticipated revenue for the current year, FY2017, is $11,072,822 including $8,513,495 from the BID tax. Over the next five years, there are proposed changes anticipated in the Downtown BID’s revenue sources. In addition to the income sources contained in the current year (FY2017) revenue stream—property assessments, contract for services, and tax exempt contributions, two (2) income sources are projected to generate funds in the 5-year plan. Specifically, residential assessments and revenues from Franklin Park activities are projected as new revenue sources in year FY2018 and FY2020 respectively. A summary of the 5-Year revenue budget is below along with a brief description of each revenue source.
Proposed Five-Year Revenue
Proposed Revenue: FY2018 FY2019 FY2020 FY2021 FY2022 Assessment Income – Current $8,768,671 $9,029,629 $9,029,629 $9,029,629 $9,029,629 Assessment Income – New -65,000 238,192 308,837 385,943 385,943 Residential Inclusion (starting in FY2018) 183,132 438,408 438,408 503,616 503,616 Contract for Services 2,194,228 2,257,655 2,257,655 2,257,655 2,257,655 Contributions for Tax Exempt Entities 416,234 428,721 428,721 428,721 428,721 Interest Income 2,000 2,000 2,000 2,000 2,000 Franklin Park (starting in FY2020) 0 0 25,000 100,000 200,000 Total Expenses $11,499,266 $12,394,606 $12,490,251 $12,707,565 $12,807,565
Property Assessment Income (BID Tax)
The five-year plan calls for the assessment rate to rise in FY2018 and FY2019 only. There is no change in the rates for year FY2020, FY2021 and FY2022. The current FY2017 rate is $.16 per square foot for commercial properties and $90 per hotel room. With the recommendation of its Board and membership, the BID will ask the Mayor to authorize the following BID tax rate(s):
Proposed Commercial Rate:
FY2018 – 3% Increase – from $.16 to $.1648 per square foot FY2019 - 3% Increase – from $.1648 to $.1697 per square foot FY2020 – No Increase – will Remain at $.1697 per square foot FY2021 – No Increase – will Remain at $.1697 per square foot FY2022 -- No Increase – will Remain at $.1697 per square foot
52
Proposed Hotel Rate:
FY2018 – 3% Increase -- from $90 to $92.70 per room FY2019 - 3% Increase -- from $92.70 to $95.48 per room FY2020 – No Increase – will Remain at $95.48 per room FY2021 - No Increase – will Remain at $95.48 per room FY2022 - No Increase – will Remain at $95.48 per room Annual Allowable Tax Rate Increase
The Business Improvement Districts Amendment Act of 1997 provides for up to a 3% annual increase in the tax rate, subject to approval by the Board. As a matter of process, the BID tax rate may be adjusted each year subject to approval of the Board, ratification of the members and review of the Mayor, without returning to the DC Council to adjust the tax rate. In the 5-year plan, the Downtown BID is proposing to exercise this option to increase the rate in the first two (2) years--FY2018 and FY2019. Property Type/Class
Annual Downtown BID taxes will be levied on all non-exempt properties. The rate for commercial, class 4 properties include: Improved class 4 properties – rate per net rentable square foot of space (NRA) (or per each square foot on improved properties with buildings that are going through gut rehabilitation), Unimproved Class 4 and 5 Property, or Improved Class 4 Surface Parking Lot and Annual rate to be applied to either Net Rentable Area (NRA) or Gross Building Area (GBA). If a class 4 property does not report a NRA to the DC Tax Assessor, the NRA is computed at 90% of the Gross Building Area (GBA).
53
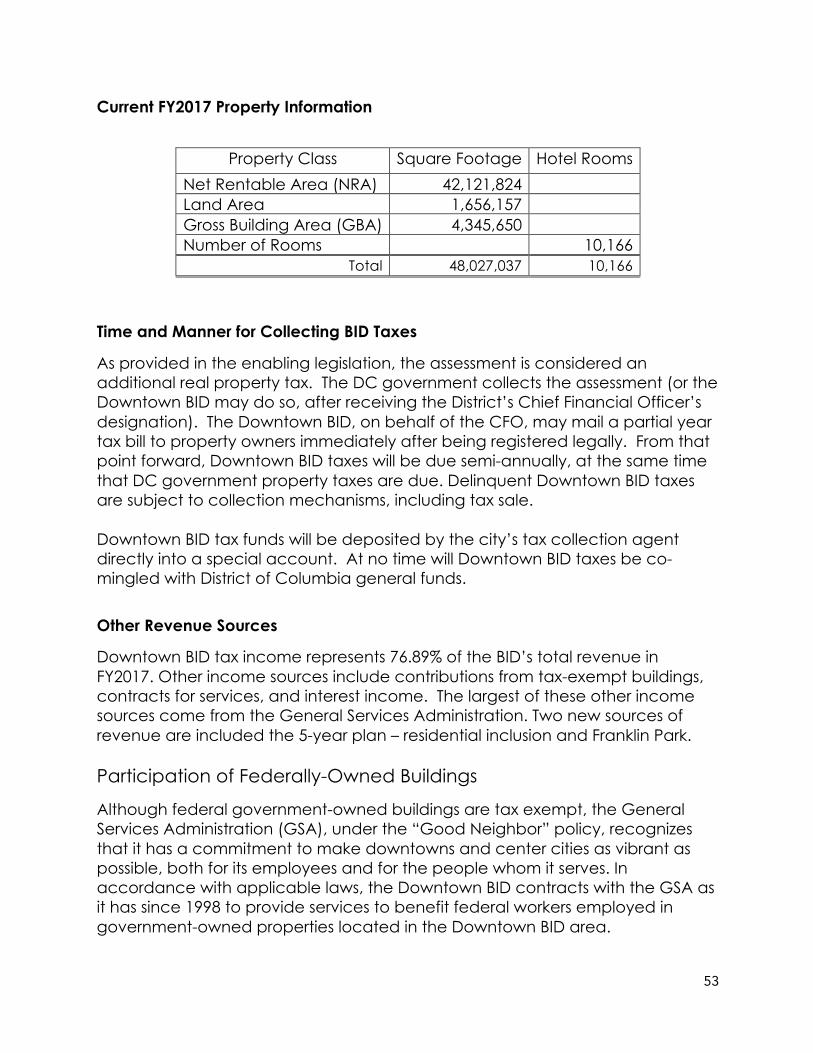
Current FY2017 Property Information
Property Class Square Footage Hotel Rooms
Net Rentable Area (NRA) 42,121,824 Land Area 1,656,157 Gross Building Area (GBA) 4,345,650 Number of Rooms 10,166
Total 48,027,037 10,166
Time and Manner for Collecting BID Taxes
As provided in the enabling legislation, the assessment is considered an additional real property tax. The DC government collects the assessment (or the Downtown BID may do so, after receiving the District’s Chief Financial Officer’s designation). The Downtown BID, on behalf of the CFO, may mail a partial year tax bill to property owners immediately after being registered legally. From that point forward, Downtown BID taxes will be due semi-annually, at the same time that DC government property taxes are due. Delinquent Downtown BID taxes are subject to collection mechanisms, including tax sale. Downtown BID tax funds will be deposited by the city’s tax collection agent directly into a special account. At no time will Downtown BID taxes be co-mingled with District of Columbia general funds.
Other Revenue Sources
Downtown BID tax income represents 76.89% of the BID’s total revenue in FY2017. Other income sources include contributions from tax-exempt buildings, contracts for services, and interest income. The largest of these other income sources come from the General Services Administration. Two new sources of revenue are included the 5-year plan – residential inclusion and Franklin Park. Participation of Federally-Owned Buildings
Although federal government-owned buildings are tax exempt, the General Services Administration (GSA), under the “Good Neighbor” policy, recognizes that it has a commitment to make downtowns and center cities as vibrant as possible, both for its employees and for the people whom it serves. In accordance with applicable laws, the Downtown BID contracts with the GSA as it has since 1998 to provide services to benefit federal workers employed in government-owned properties located in the Downtown BID area.
54
Participation from Other Exempt Properties
The BID Act allows the Downtown BID to solicit and accept voluntary contributions from exempt properties in the BID Area. The Downtown BID actively will solicit voluntary contributions from all exempt properties that receive the benefit of services that we provide. Residential Inclusion
The 5-Year plan calls for the assessment of condominiums and apartment buildings in the Downtown BID area. There are 2408 condominiums and 3584 apartments eligible for assessment at $120 per unit. The plan takes a conservative approach anticipating a percentage of the total assessment each year. The assessment of these residential properties will begin in January FY2018 and the anticipated income is $183,132 in FY2018; $438,408 in FY2019 and in FY2020; and $503,616 in years FY2021 and FY2022. Franklin Park
The BID has been working with the DC Government for over 10 years on a plan to renovate, manage, and operate Franklin Park. The Mayor generously allocated $14 million for the renovation of the park and recently indicated that additional funds will be added in her FY 18 budget and the timing of the availability of funds will be moved up from 2019 to 2018. Construction of the park is expected to start in the spring of 2018. The BID is finalizing an agreement with the city and the National Park Service for the ongoing maintenance, operations and programming of the park. In addition to Franklin Park, stakeholders have requested the BID aggressively improve other parks and open spaces in the BID and work on locating and developing a dog park for the BID's nearly 10,000 residents and their dogs. The expected annual cost of operating a robust public realm program is $1 million, a portion of which will be raised from revenue generated through park activities. As shown in the 5-Year budget revenue sources, there is no income anticipated from Franklin Park in the first two years—FY2018 and FY2019; however, income is anticipated at $25,000 in FY2020; $75,000 in FY2021 and $200,000 in FY2022. This revenue will be generated from the leasing of new café space in the park, park rental fees for events, sponsorship and ticketed events conducted by the BID in the park.
55
Proposed Five-Year Expense Budget
The projected operating budget for the Downtown BID from FY2018 - FY2022 is provided below. The projections are based on the assumption that the BID's annual recurring expenses will grow at 3%, for the first two years—FY2018 and FY2019; and remain the same for the remaining years as the Downtown BID continues to aim to hold and/or decrease annual recurring cost. As such, there is no increase in most recurring cost in years FY2020 through FY2022. New funding will be used to offset the cost of providing services to residents, standing up a capital replacement fund and funding the BID's parks and open space improvement efforts.

56
Proposed Five-Year Expense Budget
Proposed Expenses: FY2018 FY2019 FY2020 FY2021 FY2022 Operations - Clean/Safe Communications & Special Events
$6,032,537
$6,412,910
$6,548,725
$6,446,280
$6,540,301 Communications & Special Events
1,349,175
1,535,878
1,817,307
1,895,335
1,930,703
Public Space Management
667,735
676,556
690,449
842,765
842,765 Infrastructure + Sustainability
Homeless Services
620,295
628,489
641,395
654,569
658,016 Homeless Services
617,799
616,723
629,388
702,345
655,510
Economic Development
735,173
744,885
760,181
775,794
776,196 Administration
1,145,885
1,145,885
1,145,885
1,390,477
0 1,404,074
0 Special Projects Capital Replacement and Parks Improvement Fund
130,667
133,280
56,921
0 0 Capital Replacement and Parks Improvement Fund
200,000
500,000
200,000
0 0 Total Expenses $11,499,266 $12,394,606 $12,490,251 $12,707,565 $12,807,565
In the 5-Year plan, the BID’s program expenses cover the ongoing seven major program areas, in addition to Administration, special projects (office relocation) and also include expenses related to the two (2) new planned programs--residential inclusion and parks and open space development and maintenance. The cost associated with residential inclusion is absorbed in the Clean and Safety budgets as it is an extension of the existing program. The plan establishes a new department for the Capital Replacement and Parks Infrastructure efforts. This department combines the capital cost for parks and other public realm infrastructure of Franklin Park and other park spaces. The plan calls for establishing a $900,000 replacement fund over a three-year period. This fund will be capitalized by a combination of sources including administrative savings, a portion of assessment increases, and a portion of residential inclusion revenue.
57
Administrative Organization
Account Management
The Downtown BID receives most of its revenues from the DC government’s collection agent on a monthly basis. Wells Fargo collects, separates and disburses all District of Columbia property tax funds before deposit into the city’s general fund. The Downtown BID maintains its own accounts separate from the DC government. Downtown BID funds may be carried over from one fiscal year to the next, and may be placed in special accounts in order to build reserves or save for capital expenditures. The BID law requires that Downtown BID funds must be maintained in a federally-insured institution, approved by the city’s Chief Financial Officer, with assets in excess of $50 million. Governance
The Downtown BID is a 501(c)(6) corporation governed by a Board of Directors consisting of 31 to 45 individuals. The Business Improvement Districts Amendment Act of 1997 requires that a majority of Downtown BID board members are property owners, in order to ensure that these groups, who are assessed by the Downtown BID tax, determine how the tax is used to improve the area. The Act also provides that the Downtown BID Board must include commercial tenants of non-exempt property. The Downtown BID Board aims to also represent community and civic, cultural and religious, and social service organizations. The Business Improvement Act of 1997 makes every property owner and every commercial tenant of non-exempt property a member of the Downtown BID. The Downtown BID holds an annual meeting where members of the Board of Directors review the annual budget and work plan. An executive committee carries out day-to-day governance of the Downtown BID. The President/Executive Director carries out the day-to-day management. The City’s Role in Governance
The Downtown BID Corporation is an independent non-profit corporation and the BID Act does not provide for city government or its representatives to have a formal role in its governance. However, in addition to receiving Downtown BID financial statements, along with the CFO and the City Council, the Mayor reviews any proposed changes to the Downtown BID plan or tax rate

58
adjustment that the Board and members approve. The Downtown BID works closely with city agencies to ensure that city services are efficiently and effectively delivered to the Downtown BID area. The Downtown BID also works with the city to leverage federal funds for specific Downtown BID projects. To these ends, the Downtown BID Board has, from time to time, invited officers of the city government to participate in Board meetings as guests. Continuation of City Services
Section 20 of the BID Act states: “The District government shall not eliminate or reduce the level of any services customarily provided in the District to any similar geographic area because such area is subject to a BID, and shall continue to provide its customary services and levels of each service to such area notwithstanding that such area is or may be encompassed in a BID unless a reduction in services is part of a District-wide pro rata reduction in services necessitated by fiscal considerations or budgetary priorities.” The Downtown BID has both formal and informal relationships with city agencies to ensure that the base level of city services is neither reduced nor replaced by the Downtown BID activities. The Downtown BID has traded services with city agencies effectively in order to realize better and more efficiently delivered services to the area.
59
Business Improvement District Policies
Local Purchasing Preference Policy
The Downtown BID has a local purchasing preference policy that directs that Downtown BID-funded improvements and activities attempt to utilize goods and services from District of Columbia vendors, provided that pricing and standards of quality are competitive. Competitive Bidding
The Downtown BID competitively bids its purchase of services, products and equipment. This policy aims to maximize service quality, efficiency and cost-effectiveness. Equal Employment Opportunity
The Downtown BID is an equal opportunity employer. Lobbying Policy
The Downtown BID does not represent any position of interest to the Congress of the United States that is in conflict with, or is not a stated policy or preference of elected officials of the District of Columbia government.