data visualisation: types, principles, and tools
TRANSCRIPT
ICSSR Research Methodology WorkshopDecember 18, 2015
Data Visualisation:Types, Principles, and Tools
Sumandro [email protected]

The Centre for Internet and Societycis-india.org
Established in 2008. Offices in Bengaluru and Delhi.
Works on issues of Internet governance and telecommunication policy, open knowledge and accessibility, privacy and cyber-security.
My work focuses on openness and e-governance policies, and critical research on internet and society in India.

Sexual Violence in IndiaRukmini S, The Hindu

The Billion Pound-o-GramDavid McCandless

Cholera Map, London, 1854John Snow

Rainfall in Kausani, 1990India Water Portal

OpenStreetMap - KathmanduContributions by Volunteers
What is Data?
- It depends on the context
- It depends on the question
- It depends on the (hypothetical) answer

Types of Data
- Quantitative
- Discrete- Continuous- Categorical
- Qualitative
- Quantified- Not-quantified
- Spatial
- Rastar- Vector
Types of Data Relationship
- Comparison
- Ranking
- Part-to-Whole
- Distribution
- Time Series
- Map
- Correlation

Types of Data Visualisation
- Various: Scatterplot, Line Chart, Area Chart, and Bar Chart
- Part-to-Whole: Pie Chart, Tree Map, and Parallel Sets
- Multiple Variables: Radar Chart and Bubble Chart
- Time: Time Line, Flow Chart, and Steam Graph
- Space: Choropleth, Heatmap, Flow Map, and Cartogram

Types of Data VisualisationVarious

Types of Data VisualisationScatterplot

Types of Data VisualisationLine Chart

Types of Data VisualisationArea Chart
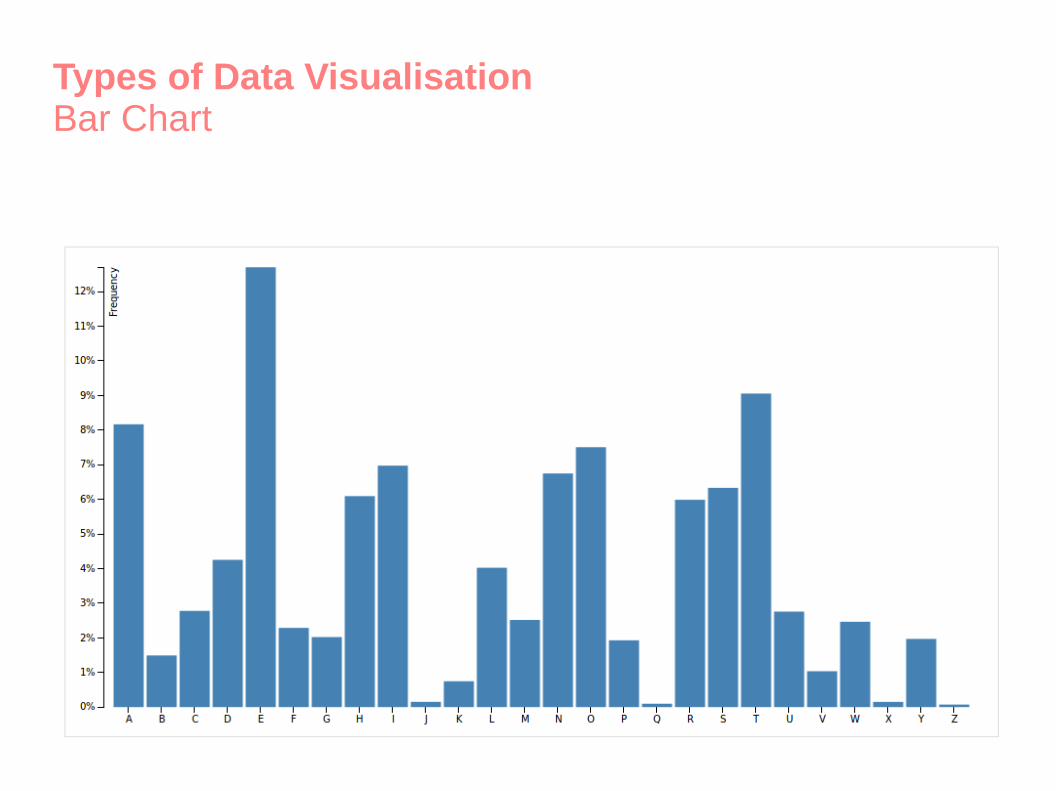
Types of Data VisualisationBar Chart
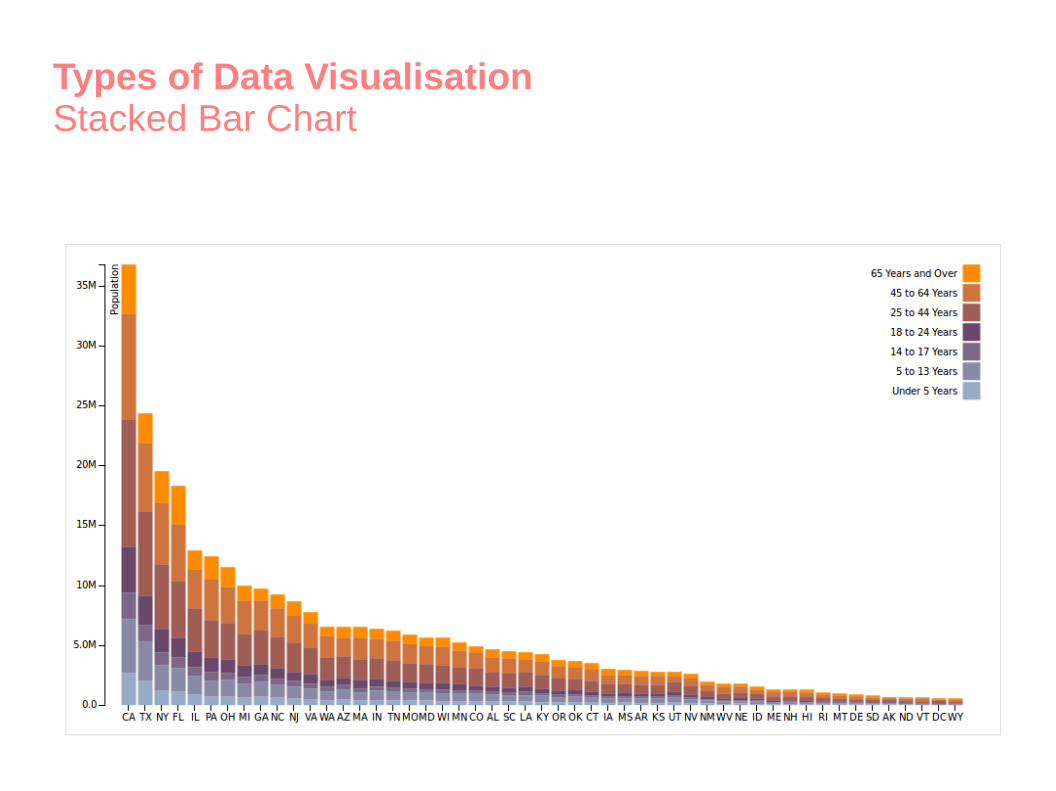
Types of Data VisualisationStacked Bar Chart
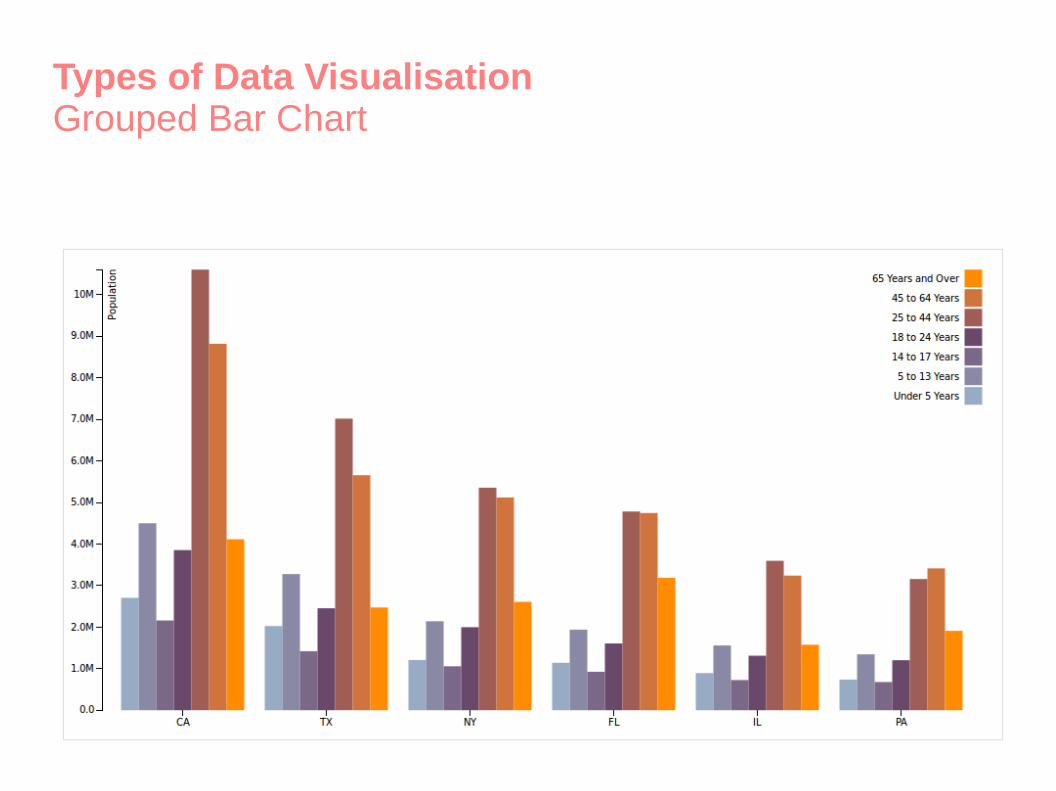
Types of Data VisualisationGrouped Bar Chart

Types of Data VisualisationPart-to-Whole

Types of Data VisualisationPie Chart

Types of Data VisualisationDoughnut Chart

Types of Data VisualisationPie Chart (Two Layers)

Types of Data VisualisationSunburst
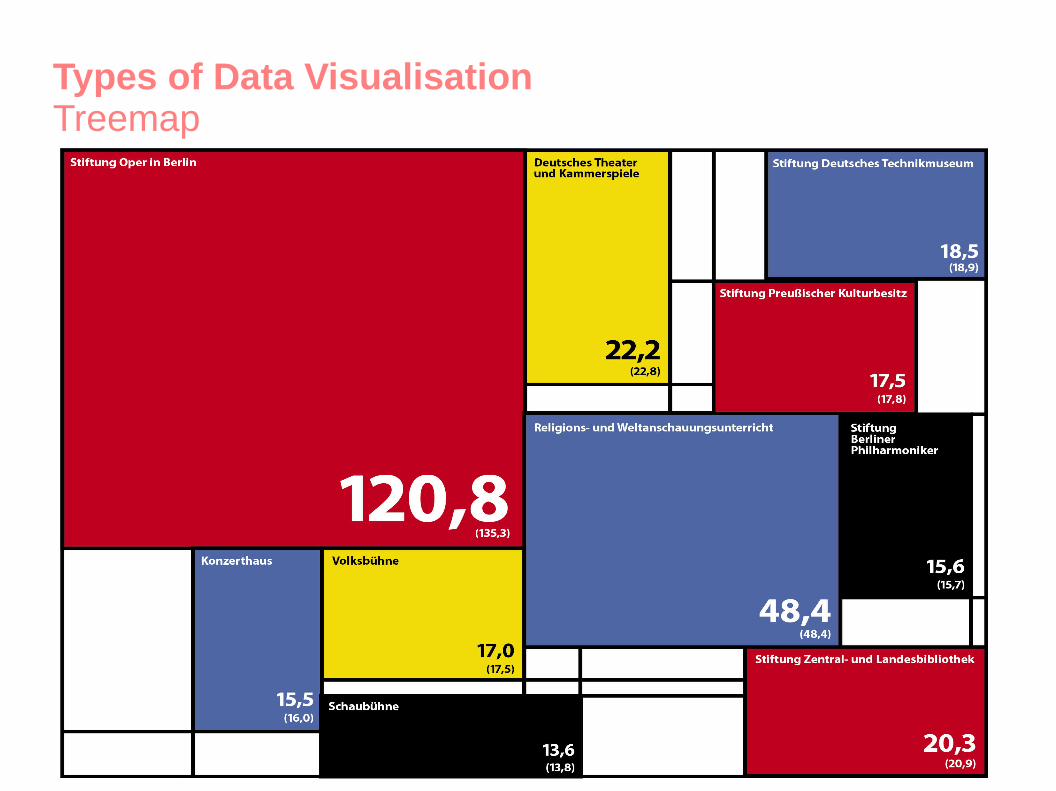
Types of Data VisualisationTreemap

Types of Data VisualisationParallel Sets
Types of Data VisualisationMultiple Variables

Types of Data VisualisationRadar Chart (Discrete)

Types of Data VisualisationRadar Chart (Continuous)
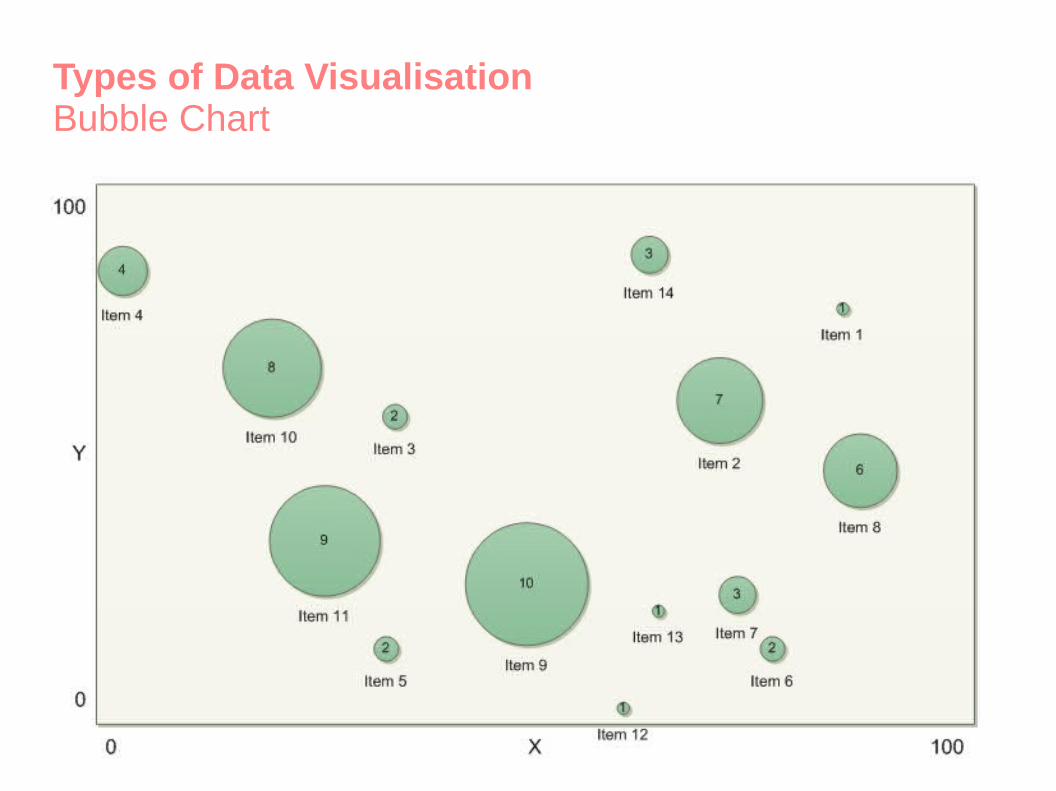
Types of Data VisualisationBubble Chart

Types of Data VisualisationTime

Types of Data VisualisationTime Line

Types of Data VisualisationFlow Chart

Types of Data VisualisationSteam Graph

Types of Data VisualisationSpace

Types of Data VisualisationChoropleth

Types of Data VisualisationHeatmap

Types of Data VisualisationCartogram
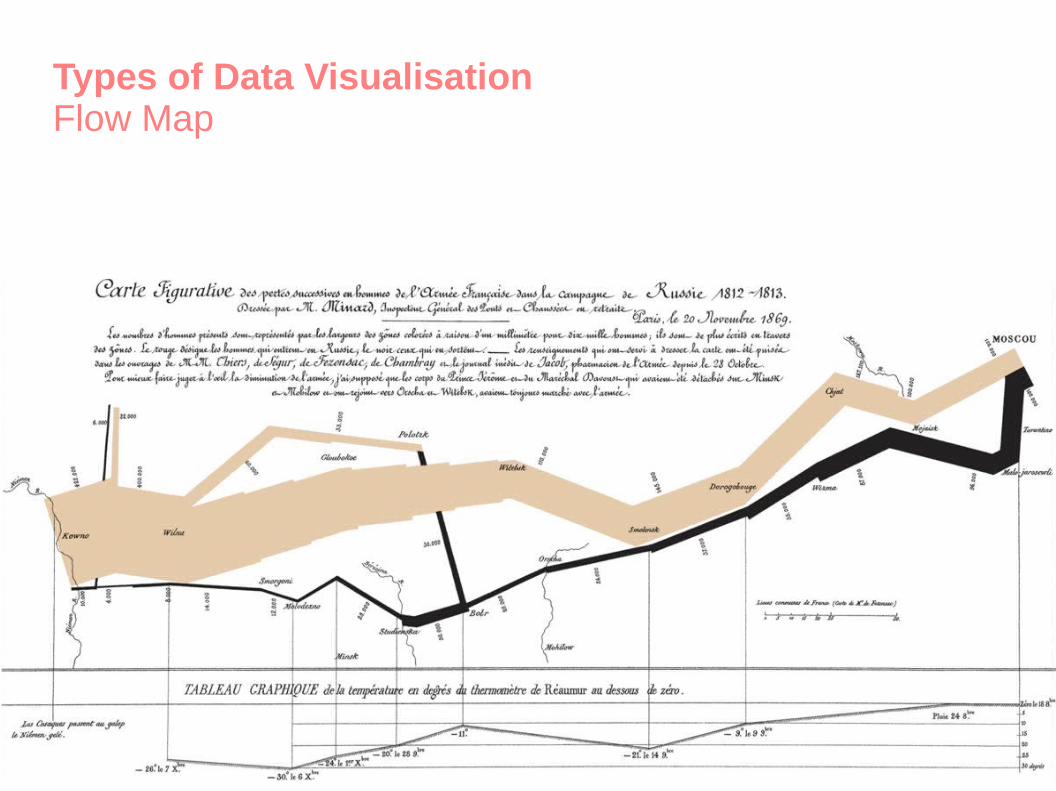
Types of Data VisualisationFlow Map
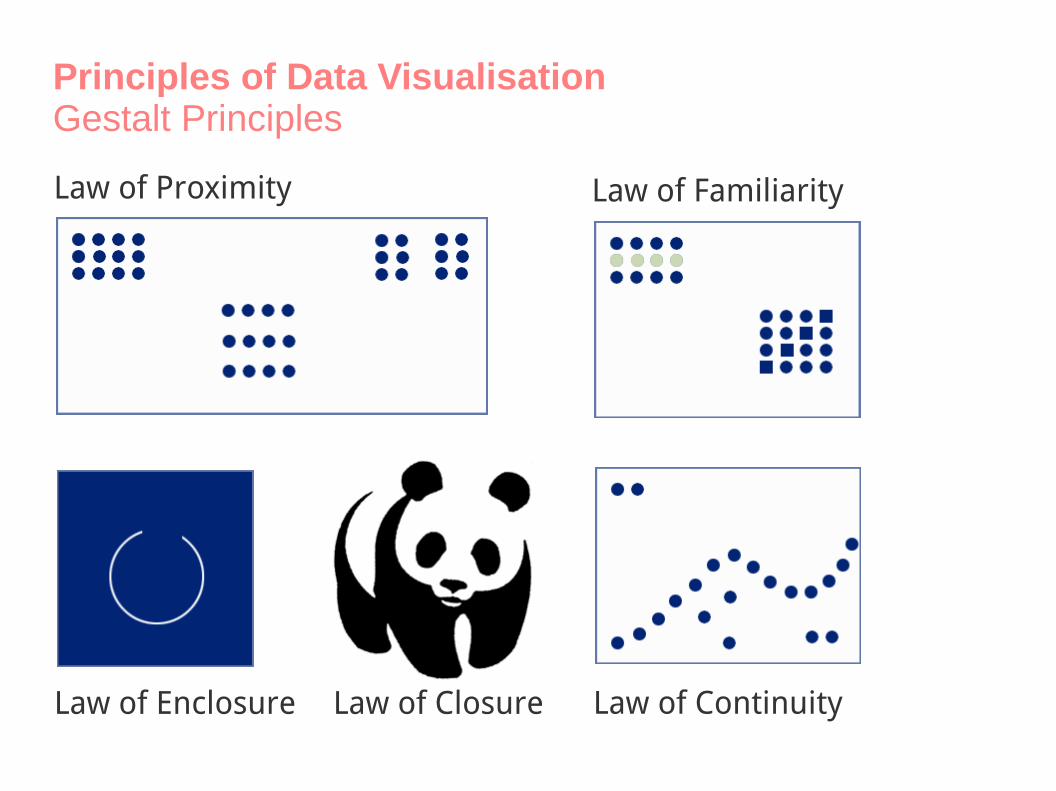
Principles of Data VisualisationGestalt Principles
Law of Proximity Law of Familiarity
Law of ContinuityLaw of ClosureLaw of Enclosure
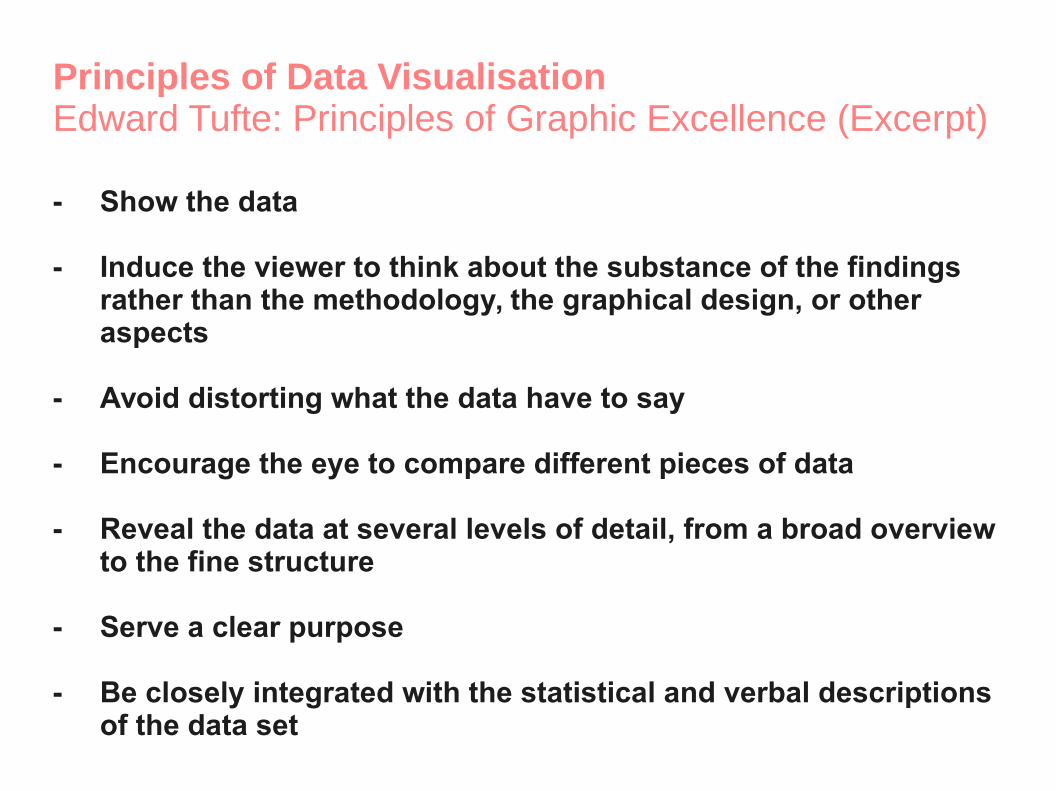
Principles of Data VisualisationEdward Tufte: Principles of Graphic Excellence (Excerpt)
- Show the data
- Induce the viewer to think about the substance of the findings rather than the methodology, the graphical design, or other aspects
- Avoid distorting what the data have to say
- Encourage the eye to compare different pieces of data
- Reveal the data at several levels of detail, from a broad overview to the fine structure
- Serve a clear purpose
- Be closely integrated with the statistical and verbal descriptions of the data set

Principles of Data VisualisationManuel Lima: Information Visualization Manifesto (Excerpt)
- Form follows function
- Start with a question
- Interactivity is key
- Cite your source
- The power of narrative
- Do not glorify aesthetics
- Embrace time
- Avoid gratuitous visualisations

Tools for Working with Data
- Collection
- Organisation
- Analysis
- Visualisation
Tools for Working with DataCollection
- Nokia Data Gathering
- Open Data Kit
- RapidSMS
- OpenStreetMap and Field Papers
- Ushahidi and Crowdmap
- Google Earth
- Tabula
Tools for Working with DataOrganisation
- Open Refine
- Mr. Data Converter
- CKAN
- GitHub and GitLab

Tools for Working with DataAnalysis
- Microsoft Excel and Libre Office Calc
- SPSS and Stata
- R and R Studio
- GRASS and Quantum GIS

Tools for Working with DataVisualisation
- ManyEyes and Tableau
- Google Fusion Tables and Google Chart Tools
- Datawrapper and RAW
- D3.js, Recline.js, Raphaël, and Tangle
- Graph Commons, Gephi, Arbor.js, and Sigma.js
- Leaflet.js, GeoCommons, CartoDB, and MapBox Studio
- Timeline JS and StoryMap JS
- Processing
- ColorBrewer

What is Open Data?
- Open for studying
- Open for using
- Open for making products and services
- Open for sharing
What is the 'Open Data Movement'?
- A movement for open data practices by everyone – government, non-government / civil society organisations, international organisations, researchers, everyone.
- A movement that recognises that allowing other people to see, use, and share your data is a good thing for everyone
- A movement to make data available for decision-making, but also to understand how decisions are made
- A movement that is distributed, and took forward by different people in different contexts – no single international leader!

How to Contribute to Open Data Movement?
- Open up the data you have
- Contribute to open data projects (like OpenStreetMap)
- Ask the government to open up data (via data.gov.in)
- Ask all organisations you work with to open up data
- Help organisations to open up their data
(and join DataMeet: datameet.org)
ICSSR Research Methodology WorkshopDecember 18, 2015
Thank you.
Sumandro [email protected]
CIS: cis-india.orgTwitter: @cis_india
Personal: ajantriks.netTwitter: @ajantriks