data-driven insights for the new sat · of graphics: bar graphs, pie charts, line graphs, and...
TRANSCRIPT
Ivy Global
Data-Driven Insights for the New SAT Edition 1.0
To learn more about the New SAT, visit: sat.ivyglobal.com


Section 1
Introduction The College Board recently released Official SAT Study Guide and 4 Practice Tests for the New SAT. The curriculum development team at Ivy Global assessed items such as the difficulty, length, and frequency of different question types across the Reading, Writing, and Math Sections of these tests. The Ivy Global team also assessed the length and difficulty of passages in the Reading and Writing sections. The new tests were compared to earlier exams released by the College Board in the test format in use until March of 2016.
This analysis considers various factors that may affect the difficulty of the exam. However, it’s important to note that the SAT is not a pass-fail exam: the SAT is scored on a curve, and student performance is measured against the performance of other students in a testing cohort. Because a change in difficulty would affect all students, it is not useful to consider only whether the exam will be more or less difficult. The fact that the SAT is scored on a curve does not imply that a change in difficulty would affect all students equally, however, so it is useful to consider how the format of the exam has changed in ways that will affect the type of the challenge presented by the exam, in order to best prepare students for the changes.
A few large changes to be aware of: while the Reading, Writing, and Math sections all remain, each is substantially different from the old test. The scoring for the new test has been changed substantially. A new scale will be used for overall scores, and additional information on cross- and subtest scores will be reported. The essay will now be optional, and thus not a part of the overall score. For more detailed information please see Ivy Global’s New SAT Guide or the College Board’s website.
We hope that these insights will help you better understand the new test and how to approach it successfully. For more information on how to tackle the new SAT, please see Ivy Global’s New SAT Guide and our online resources at sat.ivyglobal.com. Best of luck on the new SAT!
Data-Driven Insights for the New SAT 1


Section 2
Reading Test The newly redesigned SAT for 2016 includes changes to the form and substance of the Reading Test. The following
insights are based on a review of the 24 passages that appear in the College Board’s Official SAT Study Guide and 4
New SAT Practice Tests. Overall, analysis of the newly released College Board exams reveal slightly longer and
more challenging passages, wordier questions, and longer answer options.
What is different about the Reading Test?
One of the largest changes to the Reading sections is the elimination of sentence completion questions. Now, 100% of questions on the Reading Test are those associated with passages.
While the new test contains passages that are generally similar to those on the old test, they are now codified into specific types that will appear on each test. Each test will include the following:
Reading Analysis - Tables
Passage Type Topics Number of Passages
Literature Classic and contemporary literature from the United States and around the world. 1
Science Both basic concepts and recent developments in the natural sciences, including Earth science, biology, chemistry, and physics.
2
History and Social Studies
Anthropology, communication studies, economics, education, geography, law, linguistics, political science, psychology, and sociology. One of these passages will be a Founding Documents (historically important, foundational texts from the United States) or Great Global Conversation (other historically and culturally important works dealing with issues at the heart of civic and political life) passage.
2
Data-Driven Insights for the New SAT 3
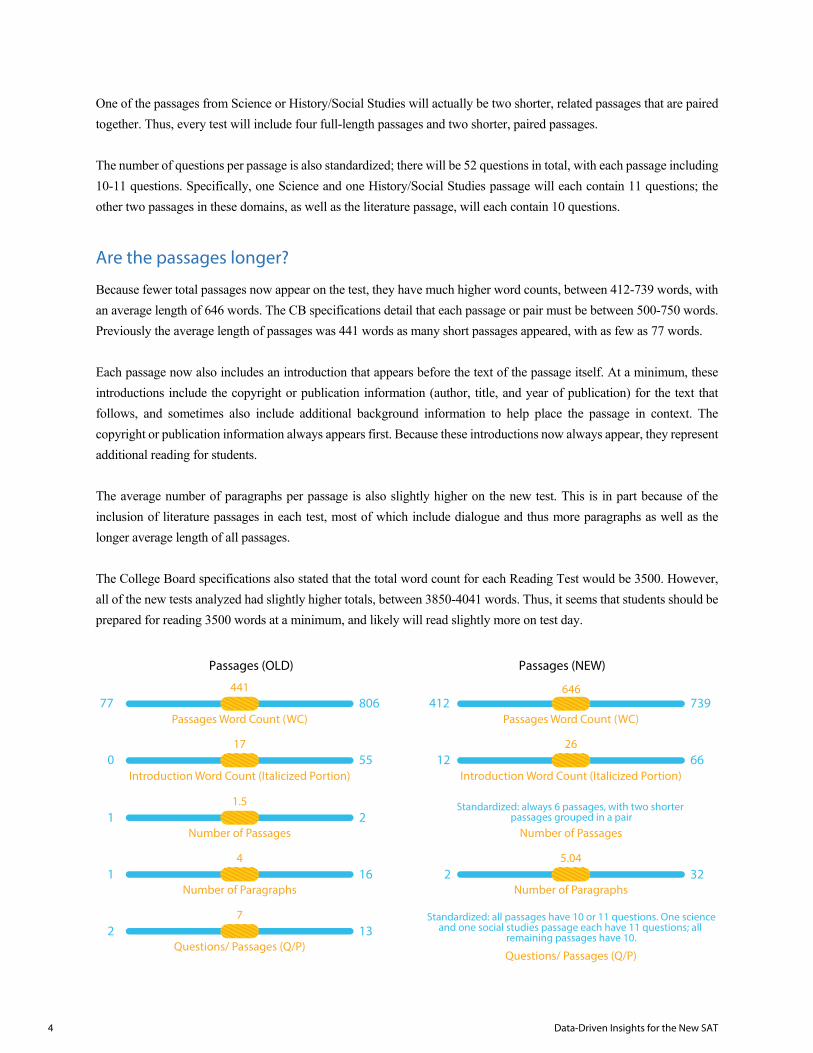
One of the passages from Science or History/Social Studies will actually be two shorter, related passages that are paired together. Thus, every test will include four full-length passages and two shorter, paired passages.
The number of questions per passage is also standardized; there will be 52 questions in total, with each passage including 10-11 questions. Specifically, one Science and one History/Social Studies passage will each contain 11 questions; theother two passages in these domains, as well as the literature passage, will each contain 10 questions.
Are the passages longer?
Because fewer total passages now appear on the test, they have much higher word counts, between 412-739 words, with an average length of 646 words. The CB specifications detail that each passage or pair must be between 500-750 words. Previously the average length of passages was 441 words as many short passages appeared, with as few as 77 words.
Each passage now also includes an introduction that appears before the text of the passage itself. At a minimum, these introductions include the copyright or publication information (author, title, and year of publication) for the text that follows, and sometimes also include additional background information to help place the passage in context. The copyright or publication information always appears first. Because these introductions now always appear, they represent additional reading for students.
The average number of paragraphs per passage is also slightly higher on the new test. This is in part because of the inclusion of literature passages in each test, most of which include dialogue and thus more paragraphs as well as the longer average length of all passages.
The College Board specifications also stated that the total word count for each Reading Test would be 3500. However, all of the new tests analyzed had slightly higher totals, between 3850-4041 words. Thus, it seems that students should be prepared for reading 3500 words at a minimum, and likely will read slightly more on test day.
Passages (OLD) Passages (NEW)
0 55
Passages Word Count (WC)
17
1 16
Number of Passages
4
1 2
Introduction Word Count (Italicized Portion)
1.5
2 13Questions/ Passages (Q/P)
Number of Paragraphs
7
44177 806
12 66
Passages Word Count (WC)
26
2 32
Introduction Word Count (Italicized Portion)
Standardized: always 6 passages, with two shorter passages grouped in a pair
Number of Passages
5.04
Number of Paragraphs
Standardized: all passages have 10 or 11 questions. One scienceand one social studies passage each have 11 questions; all
remaining passages have 10.
Questions/ Passages (Q/P)
646412 739
4 Data-Driven Insights for the New SAT
Are the passages harder?
Passages on the new test fall within a tighter range of difficulty, from grade 9 to college-level. As there are fewer passages with lower difficulty, the overall challenge of the Reading Test has increased. However, because many of the passages have a more informational tone, as commonly found in popular press aimed at adults (from which the passages are commonly sourced), some passages may seem easier to certain students.
Because of the inclusion of the Founding Documents/Great Global Conversation category, students may also encounter more passages that contain older language with which they are less familiar, as well as more rhetorical devices and persuasive language. These passages may be more challenging for some students.
What types of graphics are used?
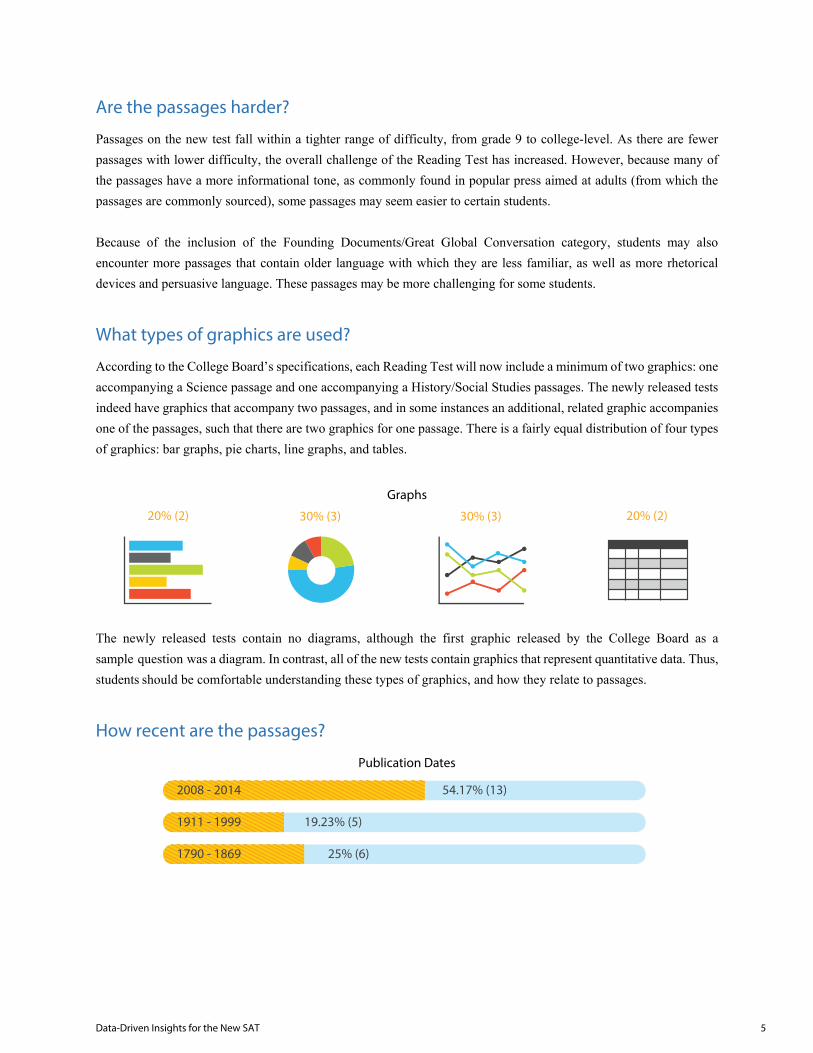
According to the College Board’s specifications, each Reading Test will now include a minimum of two graphics: one accompanying a Science passage and one accompanying a History/Social Studies passages. The newly released tests indeed have graphics that accompany two passages, and in some instances an additional, related graphic accompanies one of the passages, such that there are two graphics for one passage. There is a fairly equal distribution of four types of graphics: bar graphs, pie charts, line graphs, and tables.
Graphs
The newly released tests contain no diagrams, although the first graphic released by the College Board as a sample question was a diagram. In contrast, all of the new tests contain graphics that represent quantitative data. Thus, students should be comfortable understanding these types of graphics, and how they relate to passages.
How recent are the passages?
Publication Dates
20% (2) 30% (3) 30% (3) 20% (2)
54.17% (13)2008 - 2014
19.23% (5)1911 - 1999
25% (6)1790 - 1869
Data-Driven Insights for the New SAT 5
All passages that appear in the Reading Test come from high quality, previously published sources. The new tests reveal a specific focus on recently published materials. In fact, more than half of the passages were published in 2008 or more recently, and nearly 38% of passages were originally published between 2011-2014.
There is a particular focus on newer sources in the Science domain. Indeed, only one passage, from the famous scientists Watson and Crick, has a publication date before 2008.
The passages with publication dates prior to 1900 are exclusively from the Founding Documents or Literature domain. Only one passage, from Charlotte Brontë, comes from Literature, while the remainder are Founding Documents.
The new tests also demonstrate a new trend of including paired passages that respond directly to one another, and thus are published in the same year or in consecutive years. The two more modern pairs were both published in the same year, while the older Founding Documents paired passages were published in consecutive years.
What is different about the questions?
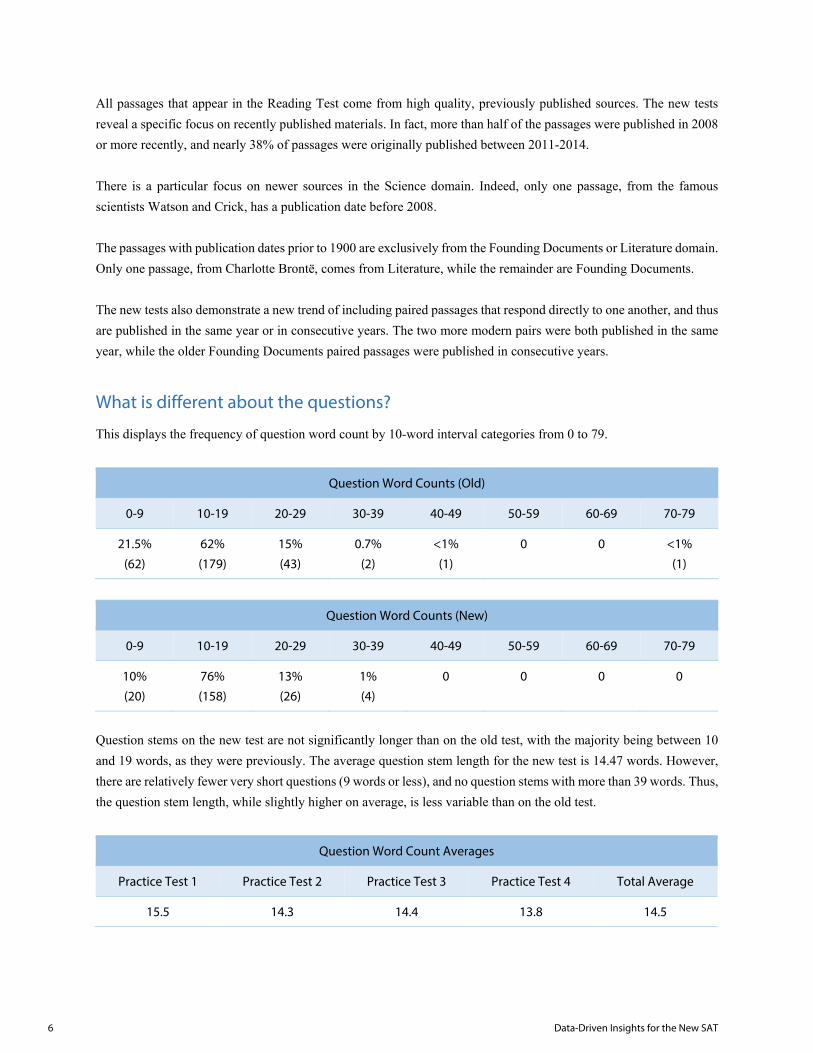
This displays the frequency of question word count by 10-word interval categories from 0 to 79.
Question Word Counts (Old)
0-9 10-19 20-29 30-39 40-49 50-59 60-69 70-79
21.5%
(62)
62%
(179)
15%
(43)
0.7%
(2)
<1%
(1)
0 0 <1%
(1)
Question Word Counts (New)
0-9 10-19 20-29 30-39 40-49 50-59 60-69 70-79
10% (20)
76% (158)
13% (26)
1% (4)
0 0 0 0
Question stems on the new test are not significantly longer than on the old test, with the majority being between 10 and 19 words, as they were previously. The average question stem length for the new test is 14.47 words. However, there are relatively fewer very short questions (9 words or less), and no question stems with more than 39 words. Thus, the question stem length, while slightly higher on average, is less variable than on the old test.
Question Word Count Averages
Practice Test 1 Practice Test 2 Practice Test 3 Practice Test 4 Total Average
15.5 14.3 14.4 13.8 14.5
6 Data-Driven Insights for the New SAT

What is different about the answers?
This displays the frequency of answer word counts.
Answer Word Count (Old)
1 2-4 5-9 10-14 15-19 20-24
19%
(53)
14%
(41)
43 %
(125)
20%
(57)
3%
(9)
1 %
(3)
Answer Word Count (New)
1 2-4 5-9 10-14 15-19 20-24 25-29 30-34 35-39 40+
15% (121)
13% (108)
27% (224)
22% (184)
10% (82)
5% (43)
4% (31)
2% (17)
1% (11)
1% (11)
Answers on the new test are longer than those on the old test. While there are still many one-word answers, and the bulk of answer choices remain between 5 and 9 words, there are three times as many answer choices with 15-19 words than there were on the previous test and five times as many choices with 20-24 words. The new tests also have even longer answer choices (up to 60 words), which did not appear on the previous test. The average word length across the four new tests was 10.5 words.
Answer Word Count Averages
Practice Test 1 Practice Test 2 Practice Test 3 Practice Test 4 Total Average
10.7 11.5 10.2 10.5 10.7
How are questions and answers phrased?
On the new test, answers are split fairly evenly between two formats: they are phrased either as completions of a sentence started in the question stem, or as separate answers to a question posed in the stem.
Example Completion
As used in line 58, “clashes” most nearly means
A) conflicts.B) mismatches.C) collisions.D) brawls.
Page 457, Official SAT Study Guide and 4 Practice Tests for the New SAT.
Data-Driven Insights for the New SAT 7

Example Question
Which choice best summarizes the passage?
A) A character describes his dislike for his new job and considers the reasons why.B) Two characters employed in the same office become increasingly competitive.C) A young man regrets privately a choice that he defends publicly.D) A new employee experiences optimism, then frustration, and finally despair.
Page 453, Official SAT Study Guide and 4 Practice Tests for the New SAT.
Previously, answers phrased as completions appeared far more frequently. When phrased as an answer to a full question in the stem, answer choices tend to be longer.
Question Phrasing (Old)
Question Phrasing (New)
New Test Old Test
Yes No Yes No
References line numbers? (e.g. “In line 12,”) 33% (68) 67% (140) 68% (196) 32% (92)
Uses Quotes? 26% (54) 74% (154) 52% (151) 48% (137)
Uses Brackets? 3% (6) 97% (202) 36% (103) 64% (185)
Fewer questions include explicit line references than they did on the old test. However, it is still common for questions to refer to specific items discussed in the passage, which provides students guidance on which portion to reference without providing the exact line. There is also less use of quotes and brackets in question stems.
All of these findings suggest that there are somewhat fewer questions that ask students to respond to very specific portions or words in the passage. This matches the new focus on question types that ask about relationships, arguments, or structure.
82% (237) 18% (51)
51.9% (27) 48.1% (25)
8 Data-Driven Insights for the New SAT

What question types appear most frequently?
The following table shows the frequency of question types on the new SAT. For definitions for each question type, please see Ivy Global’s New SAT Guide or the College Board’s Official SAT Study Guide.
Domain Question Type Occurrence
Information and Ideas
Citing Textual Evidence 41
Determining Explicit Meaning 29
Determining Implicit Meaning 13
Understanding Relationships 1
Summarizing 3
Determining Central Ideas and Themes 7
Interpreting Words and Phrases in Context 31
Rhetoric
Analyzing Claims and Counterclaims 2
Analyzing Overall Text Structure 4
Analyzing Purpose 23
Analyzing Reasoning 1
Analyzing Point of View 5
Analyzing Word Choice 11
Synthesis Analyzing Multiple Texts 14
Analyzing Quantitative Information 23
The most common question type was Citing Textual Evidence, a new question type that requires students to choose specific lines from the passage that provide support for their answer to a previous question.
The next most common type was Interpreting Words and Phrases in Context. While these types of questions did appear on the previous test, they have been redefined for the new test and follow a specific format.
These two question types usually correspond to the Command of Evidence and Words in Context subtypes, respectively. The College Board has specified that two questions corresponding to each of these subtypes will appear with every passage, and will determine students’ subscores in these domains.
Data-Driven Insights for the New SAT 9

Analyzing Quantitative Information is another new question type, as this refers to questions about graphics, which did not previously appear on the SAT. These questions accounted for 11% of all questions on the test; thus, being able to interpret graphics will be an important skill for students to master for the new Reading Test.
There were 14 questions that required analyzing multiple texts, which always accompanied paired passages. Those 14 questions could be further broken down into specific question types, with those testing Implicit Meaning and Relationships being the most common.
What question phrases appear most frequently?
Much of the language used on the new tests is similar to that which appeared on the old tests. Some of the most frequently used phrases are shown below.
The Most Frequent Phrases Used in Questions
12.0% (25) Most nearly means
1.9% (4) Suggest(s) that
2.9% (6) Implies that
1.4% (3) Closest in meaning to
1.0% (2) Best described/describes
1.0% (2) Primarily to
0.5% (1) Primary purpose
4.3% (9) Author … most likely respond/agree/use
6.3% (13) Which of the following
4.8% (10) Most likely
10 Data-Driven Insights for the New SAT

Section 3
Writing Test What’s different about the Writing Test?
There are significant changes to the new Writing test. The essay is now optional, and is no longer included in the Writing score; it is therefore not considered further in this analysis, which will focus on the required multiple-choice component. The old Writing sections included three question types in three different formats: Identifying Sentence Errors, Sentence Improvement, and Passage Improvement. On the new Writing test, all questions are presented in the context of a longer passage. Some questions focus on possible revisions to sentences, while some ask about changes to paragraphs or to the passage as a whole, so sentence and passage improvement are both still tested. Most questions ask about revisions to the passage and include an option to make no change, so the skill of identifying errors is also still tested.
In what ways is the new format harder or easier?
The overall difficulty of the new exam appears to be somewhat greater; our analysis suggests that this is mainly because the new format of the exam presents a somewhat greater reading challenge, not because the test is focusing on more challenging grammatical concepts.
The changes which are likely to have the greatest impact on the experience and outcomes of students taking the exam are the timing of the exam, the complexity of the passages in which questions are placed, and the extent of the context in which questions must be considered to determine the correct answer. Each of these is considered below.
How is the timing of the Writing Test changing?
On the old SAT, 35 minutes were allocated for the multiple-choice Writing section, which is also the amount of time allotted on the new format of the exam. That time is now allotted for a single 35-minute section, rather than a 25-minutes section and a 10-minute section. The number of questions has decreased slightly, from 49 to 44, so a simple division of minutes by questions suggests that students have slightly more time per question on the new format of the SAT Writing section.
Data-Driven Insights for the New SAT 11

However, the wordiness of the new exam might require more time of students simply to read all of the material presented. We therefore examine “reading time,” an estimate of how long it might take students to read and comprehend all passages, questions, and answer options, and separate that from “working time,” in which students can reflect and consider the options after reading them.
While the passages on the new Writing test are significant longer, and while individual questions and answer options are often longer, the new SAT is actually more economical with words in several ways. For one, placing all questions in the context of a passage allows the College Board to use overlapping portions of the text as sources for multiple questions. For another, each question now has only four answer options, rather than five, allowing the College Board to be slightly more verbose when writing their questions without increasing the overall length of questions. The reduction in the number of questions also helps to reduce the amount of material students must read.
As a result, although the word counts of individual questions are often higher, overall word count and reading time is roughly equal to that of the old Writing test, so students have roughly the same amount of “working time” on the new exam. Because the number of questions is somewhat lower, students will have slightly more time to think about each question.
Old SAT New SAT
Questions 49 44
Time allowed 35 minutes 35 minutes
Time per question 0.71 minutes (~42.6 seconds) 0.79 minutes (~47.4 seconds)
Reading Minutes ~11.25 ~11.5
Working Minutes ~23.75 ~23.5
Working Minutes per question ~0.48 minutes (~29 seconds) ~0.53 minutes (~32 seconds)
How has the complexity of passages changed?
For many of the questions on the old Writing test, the context of the question was a single sentence. For some, the context was a short passage. On the new Writing test, the questions are all asked in the context of significantly longer passages than were used on the old Writing test. Not only are these passages longer, but the sentences within the passages are often longer and more complex than those within the passages used for passage improvement questions on the old Writing test.
The overall passage complexity is distinctly greater. The table below compares an average grade-level rating (derived from several reading complexity measures based on sentence length, word length, and word familiarity; see appendix for detailed complexity data) for passages on the new Writing tests, as compared with passages on the old Writing tests and with individual sentences considered collectively as though they were passages.
12 Data-Driven Insights for the New SAT

Average Vocab Only (Dale-Chall)
Word and Sentence Complexity Only (average of several measures)
New SAT (passages) 12.6 11.5 12.9
Old SAT (sentence prompts, considered collectively) 12.1 10.9 12.5
Old SAT (passage) 9.1 8.6 9.3
Old SAT (overall) 10.7 9.8 10.9
On the old SAT Writing test, the sentences were more complex than the passages, both in terms of vocabulary and structure. However, the New SAT Writing passages were more complex by every measure than the old SAT passages, the old SAT prompt sentences, or the prompt sentences and passages considered together.
This means that students who struggle with fluent reading of complex passages may struggle more on the new Writing Test, regardless of their level of explicit knowledge of grammar rules and ability to apply such knowledge in limited contexts or with explicit prompting.
How much context will students need to comprehend in order to correctly answer questions?
On the old SAT, most of the writing questions prompted students to identify an error or recommend a change to a single sentence with no broader context. In real-world settings, editing almost always occurs within the context of a larger piece of writing, and even low-level issues of word-choice and agreement can rely on that larger context. The new format of the SAT better simulates the real-world challenges of editing by placing each sentence in the context of a larger passage.
Nevertheless, many of the errors of English conventions that will be tested on the new SAT require no more than sentence-level comprehension of the subject matter in order to correct. This is often a consequence of the nature of the question, as some of the conventions of English—given certain assumptions about style—are simply not sensitive to a context broader than a single sentence. A comma splice, for example, remains a comma splice without regard to the structure or meaning of surrounding sentences.
In general, English Conventions questions require less understanding of the broader context of the passages than Expression of Ideas questions.
Data-Driven Insights for the New SAT 13

The charts below summarize the definitions we provide for required context comprehension levels, and the distribution of required comprehension levels among the questions on the New SAT.
Comprehension Level Description
Word The question requires comprehension of a word group smaller than a complete sentence.
Sentence The question requires comprehension of a single complete sentence or the relationship between two sentences.
Paragraph The question requires comprehension of three or more sentences or an entire paragraph.
Passage The question requires comprehension of an aspect of the text spanning the entire passage, such as overall tone, style, or organization.
Graphic The question requires a student to correctly interpret a graphical element.
In contrast to the New SAT, the required context for the Old SAT is much more tightly constrained by the format of the exam. Because only 12% of questions are asked in the context of a passage, 88% are limited to sentence-level or word-level comprehension. Combining word-level and sentence-level comprehension, and also paragraph-level and passage-level comprehension, we can compare the distribution side-to-side.
Taken together with the increase in passage complexity, the new emphasis on editing in context means that students who struggle to fluently read and interpret longer texts will face an increased challenge on the New SAT Writing test.
Distribution by Required Comprehension Level (New SAT)
Word-level Sentence-level Paragraph-level
Passage-level Chart or Graphic
0
0.2
0.4
0.6
0.8
1
1.2
Old SAT New SAT
Comparison of Required Comprehension Levels: Old SAT vs. New SAT
Sentence-level Above Sentence-Level
Graphics
14 Data-Driven Insights for the New SAT

What’s different about the question types?
The College Board’s detailed test specifications list 31 distinct question types in two broad categories: Expression of Ideas and Standard English Conventions. While the College Board has not released detailed data on how they categorize each of the questions on the practice tests released so far, the majority of questions can be clearly assigned to a single question type.* Our expert readers have classified all of the questions on the four practice tests so far released by the College Board using a system of classification based on the Test Specifications released by the College Board.
Expression of Ideas
Proposition 5 3%
Support 8 5%
Focus 12 7%
Quantitative Information 6 3%
Logical Sequence 10 6%
Introductions, Conclusions, and Transitions 22 13%
Precision 9 5%
Concision 11 6%
Style and tone 7 4%
Syntax 6 3%
Standard English Conventions
Sentence Boundaries 3 2%
Subordination and Coordination 9 5%
Parallel Structure 5 3%
Modifier Placement 3 2%
Verb tense, mood, and voice 10 6%
Pronoun person and number 1 >1%
Pronouns 1 >1%
Pronoun clarity 3 2%
Possessive Determiners 2 1%
Pronoun-Antecedent Agreement 4 2%
Subject-Verb Agreement 7 4%
Noun Agreement 1 >1%
Frequently Confused Words 4 2%
Logical Comparison 1 >1%
Conventional Expression 4 2%
End-of-sentence punctuation 0 0%
Within-sentence punctuation 8 5%
Possessive nouns and pronouns 2 1%
Items in a series 1 >1%
Nonrestrictive and parenthetical elements
9 5%
Unnecessary punctuation 2 1%
Data-Driven Insights for the New SAT 15

*The “Frequently Confused Words” type is a notable exception: this question type tests the ability to distinguishbetween one of two forms of a commonly confused word, like “it’s” or “its,” and appears to always be paired with asecond error of English conventions in order to create the requisite number of answer options. For consistency, thesehave been classified only as “Frequently Confused Words” in our classifications, and not by both types or by thesecondary type.
16 Data-Driven Insights for the New SAT

Section 4
Math Tests What’s different about the Math Tests?
The College Board tests specific topics in math as well as the ability to use reasoning, reading comprehension, and critical thinking to solve real-world problems. The SAT groups these concepts into 4 subject domains: Heart of Algebra, Problem Solving and Data Analysis, Passport to Advanced Math, and Additional Topics in Math. Overall, some of the key changes we saw in these 4 tests include 2 math test sections versus 3 sections on the old test, a no-calculator and a calculator section, multiple choice and grid-in questions, problem set questions, increased word count per question, real-world questions with social science and science subscores, and increased real-world statistics in the Problem Solving and Data Analysis section.
Data-Driven Insights for the New SAT 17

What are the Subject Domains and Content Dimensions? Part 1
While the new test contains questions that are generally similar to those on the old test, they are grouped into specific domains. Each test will include the following four subject domains: Heart of Algebra, Problem Solving and Data Analysis, Passport to Advanced Math, and Additional Topics in Math. Here is a breakdown of the topics and number of questions in each content area:
Domain Topics Covered Number of Questions
Calculator Section
No-Calculator Section
Heart of Algebra Fundamental concepts in algebra involving linear equations and inequalities
11 8
Problem Solving and Data Analysis
Interpreting qualitative and quantitative data, analyzing relationships
17 0
Passport to Advanced Math
More advanced concepts in algebra, including quadratic and higher-order equations
7 9
Additional Topics in Math
Geometry, trigonometry, complex numbers 3 3
Total 38 20
Heart of Algebra - 19 Questions - 33% of the Math Test
In the Heart domain, there are 9 dimensions. They include creating, solving, and interpreting linear expressions which contain one or two variables. The following chart represents how often we see each content dimension appear on the 4 new tests released by the College Board. (Some questions fall into more than one category.)
Content Dimension by Description Frequency % Domain
Linear equations in one variable 29 35%
Linear equations in two variables 13 16%
Linear inequalities in one variable 9 11%
18 Data-Driven Insights for the New SAT
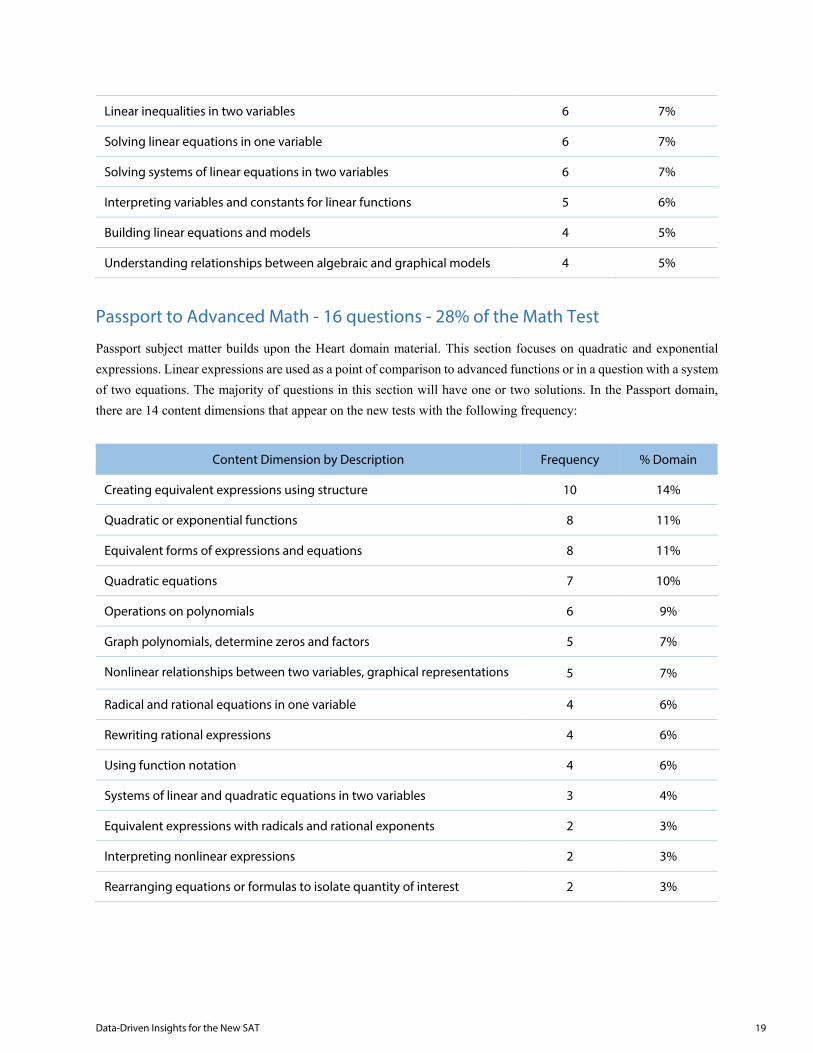
Linear inequalities in two variables 6 7%
Solving linear equations in one variable 6 7%
Solving systems of linear equations in two variables 6 7%
Interpreting variables and constants for linear functions 5 6%
Building linear equations and models 4 5%
Understanding relationships between algebraic and graphical models 4 5%
Passport to Advanced Math - 16 questions - 28% of the Math Test
Passport subject matter builds upon the Heart domain material. This section focuses on quadratic and exponential expressions. Linear expressions are used as a point of comparison to advanced functions or in a question with a system of two equations. The majority of questions in this section will have one or two solutions. In the Passport domain, there are 14 content dimensions that appear on the new tests with the following frequency:
Content Dimension by Description Frequency % Domain
Creating equivalent expressions using structure 10 14%
Quadratic or exponential functions 8 11%
Equivalent forms of expressions and equations 8 11%
Quadratic equations 7 10%
Operations on polynomials 6 9%
Graph polynomials, determine zeros and factors 5 7%
Nonlinear relationships between two variables, graphical representations 5 7%
Radical and rational equations in one variable 4 6%
Rewriting rational expressions 4 6%
Using function notation 4 6%
Systems of linear and quadratic equations in two variables 3 4%
Equivalent expressions with radicals and rational exponents 2 3%
Interpreting nonlinear expressions 2 3%
Rearranging equations or formulas to isolate quantity of interest 2 3%
Data-Driven Insights for the New SAT 19

Probability and Data Analysis - 17 Questions - 29% of the Math Test
In the Data Analysis domain, there are 10 content dimensions. This section focuses on relationships between information. There is an increased number of Data Analysis questions from the old SAT. Overall, the questions are more statistically oriented with less of a focus on probability. In particular, there is an increase in material covering statistical inference by sampling and its related mathematical tools such as error, standard deviation, sample size, as well as median, mean, and mode.
In this domain, the College Board assesses students’ ability to analyze data from charts and graphs and to make inferences. Students may also be asked to create and use a model to understand the difference between model predictions and real world data. In addition, students may be required to analyze the information given in a question in terms of an algebraic expression or a graphic (xy-plot, table, scatterplot, etc.). The Data Analysis subject domain covers a lot of territory. Due to the complex nature of the material covered in these problems, Data Analysis content is only found on the calculator section of the test.
The following summarizes our analysis of this section:
Content Dimension by Description Frequency % Domain
Measurement quantities, units, and unit conversion 15 21%
Percentages 11 15%
Relationship between two variables and a graph 9 13%
Ratios, rates, proportions, and scale drawings 8 11%
Using statistics to analyze shape, center, and spread of data 8 11%
Scatterplot, linear, quadratic, or exponential models 6 8%
Using two-way tables, categorical data, relative frequency, and conditional probability 6 8%
Evaluate reports and data collection methods 5 7%
Comparing linear and exponential growth 2 3%
20 Data-Driven Insights for the New SAT

Additional Topics in Math - 6 questions - 10% of the Math Test
Additional Topics in the new SAT has a greater focus on trigonometry and advanced math than before. One of the significant changes in this section is the elimination of simple geometry, instead focusing on volume and the properties of circles.
The Additional Topics domain is comprised of the following eight content dimensions:
Content Dimension by Description Frequency % Domain
Theorems of congruence and lines, angles, and triangles 8 30%
Complex numbers 4 15%
Trigonometric ratios, right triangles, sine and cosine 4 15%
Trigonometry and the Pythagorean Theorem 3 11%
Circle theorems, chord lengths, angle measures 3 11%
Volume formulas 2 7%
Equation in two variables for a circle in the coordinate plane 2 7%
Radians and arc lengths 1 4%
The new SAT is constructed based upon the CB’s new redesign document, which specifies individual content dimensions in each subject area. Our analysis of these content dimensions for the College Board 4 New SAT Math Tests is shown in the table below. Note that several content dimensions may apply to a single question in the math section.
Data-Driven Insights for the New SAT 21

Analysis Summary
The table below provides a summary of the content dimension analysis, ordered by the dimensions as defined by the College Board:
Frequency
Content Dimension
Number Passport Data Heart Additional More than One
Dimension
1 8 8 29 2 18
2 8 11 9 3
3 2 15 4 4
4 10 6 6 1
5 7 9 13 3
6 6 2 6 8
7 4 6 6 4
8 3 1 5 2
9 4 8 4
10 2 5
11 5
12 5
13 4
14 2
Total 70 71 82 27 250*
*More dimensions than questions as a result of questions with more than one content dimension.
While there are substantial differences between the new and the old SAT, our analysis has found that there are similarities as well. As in the old test, the new SAT math focuses intensely on algebra. The most common questions involve linear equations, systems of equations, and manipulating both linear and nonlinear algebraic expressions; three content dimensions, two from Heart of Algebra and one from Passport to Advanced Math were analyzed at 22% of the entire test.
22 Data-Driven Insights for the New SAT
Solving single- and multistep problems using percentages and involving quantities, units, and unit conversion, two of the content dimensions for Data Analysis, similarly resulted in 11% of all of the math test questions. Since we know that Data Analysis is contained only in the calculator section of the exam, we can extrapolate that 17% of these questions will contain one of these two content dimensions. This comes as no surprise, as we know that there are at least three problem set questions in the calculator section of each exam.
Finally, while a smaller number, the Additional Topics content dimension of choice is that which requires students to understand theorems and concepts relating to lines, angles, and especially triangles, to solve for angles and missing lengths. 30% of questions in this subject area related to this content dimension; fundamental geometry, while it has diminished in this exam as compared with the old SAT math exam, is still important especially as it relates to volume and the properties of circles.
Data-Driven Insights for the New SAT 23

What is different about the questions? Part 2
The Math Test has two types of questions: multiple choice questions and student-produced responses (grid-ins). The majority of multiple choice answers will be in integer form; we will discuss other answer choice options later in this document. Student-produced responses will always be positive integers or positive fractions, taking up no more than four spaces.
The calculator section will include two to three problem sets. Problem sets allow for multiple questions about a single stimulus, and make use of career-related contexts, including scale drawings, estimation, unit rates, percentages, and proportional relationships. Information for the problem set will be provided in text form and in a graphic (frequently a table). The student will then answer two questions (not necessarily related) on the material provided. Each test will have one grid-in problem set question, frequently placed at the end of the section because of difficulty.
Cross-test scores for Science and History/Social Studies
Students will see problems with applications in science, social science, career scenarios and other real world contexts; these questions test a student’s ability to apply analytical thinking using reading, writing, language, and math skills. The 8 questions for Analysis in Science and the 8 questions for Analysis in History/Social Studies on the SAT Math Test will count towards a cross-test score combined with questions from the Reading and Writing and Language Test. Each cross-test score will be reported on a 10 to 40 scale.
Analysis in Science 8 questions 14% of the Math Test
Analysis in History/Social Studies 8 questions 14% of the Math Test
Our analysis of the types of cross-test questions has revealed that a great number focus on problems dealing with money. In fact, 47% of all questions we found to be part of the Science or History/Social Studies cross-test appeared in the form of interest rates, everyday transactions, or large-scale budgets and finance. Question #7, Section 3, Test 1, provides an excellent example of interest rates, #19, Section 4, Test 1 provides an example of transactional/daily finance, and #22 in the same section provides an example of economics relating to a city budget.
The pure sciences also make up a large component of the Math sections; physics and biology are the most frequently used sciences in the new SAT math sections, together totaling over 53% of analysis in science real-world examples. Typical physics questions can be found at questions #3, #22, and #23 Section 4, Test 2. Typical biology examples include questions #10 and #11 of test 4, section 4.
24 Data-Driven Insights for the New SAT

Are the questions longer?
With the emphasis on reading comprehension and real world scenarios, we see an increase in the total word count per question. Question word count is calculated as the total word count of a question, not including the question’s answer choices (in the case of a multiple choice question). Analysis of the questions from the 4 tests in the College Board’s Official SAT Study Guide found the following:
New SAT
Range Number of Questions Percent
0 to 19 57 25%
20 to 39 82 35%
40 to 59 58 25%
60 to 79 15 6%
80 to 99 14 6%
99+ 6 3%
Old SAT
Range Percent
0 to 19 37%
20 to 39 44%
40 to 59 14%
60 to 79 4%
80 to 99 1%
99+ Percent
Data-Driven Insights for the New SAT 25

What is different about the graphics? Part 3
How the question looks on the page and is presented to the student plays a large role in a question’s difficulty. Our analysis of graphic difficulty is strictly related to the drawing or figure and is not related to actual difficulty of question content.
The old SAT Math test’s questions contained around 22% graphics, or around 12 questions for the entire test. The new SAT math section more than doubles the amount of graphics found, with broad categories defined in the table below. This is consistent with the College Board’s aim to have students analyze graphs, charts, and models from real-world examples. We see an increased number of graphics in the Data Analysis section where these math skills are tested.
Complexity
In our analysis of the 4 College Board New SAT tests, we saw a variety of graphic complexity. 28 questions were of low graphic complexity, 48 questions were of medium complexity, and 10 questions were of high complexity.
Graphic Complexity
Low Questions Medium Questions High Questions
28 48 10
Graphic Type
The primary areas of graphics are tables and graphs, and equations. Tables and graphs are attributed primarily to the increase in Data Analysis questions and in the real-life question information. In general, the new SAT also focuses on keeping the more complex equations outside of the question itself by writing them above the question. A summary of our findings is shown in the following table with a more detailed breakdown of the categories in Appendix A.
Scatterplots, Bar Graphs, Line Charts,
Other Non-xy Graphs
xy Graphs
ax²+bx = ?
Equations (written above
question)
20% 14% 7% 6%
Tables Drawn Figures Questions with Graphics
1% 4%
26 Data-Driven Insights for the New SAT

What is different about the answers? Part 4
The Order of the Answers to the Math Questions
As you can see from the charts below, the New SAT is moving away from having the majority of question answers ordered in the least to greatest fashion. Almost two times the number of questions are ordered randomly compared to the old SAT. Strategies of guesswork, as a result, may not work as well. Students will be required to eliminate questions more based on mathematical theory and knowledge.
Old SAT
Answer order Percent
Least Greatest 73%
Greatest Least 7%
Random 20%
New SAT
Answer order Number of questions Percent
Least Greatest 84 42%
Greatest Least 19 10%
Random 77 39%
Question Answer Type
As with the old SAT, answers to questions in the new Math section are predominantly integer based; when integers are combined with fractions or decimal answers, they account for 57% of the exam. Expression or equation answers make up the second place at 22%, which is an increase of about 8% from the old SAT answer choices. Similarly, answer choices in text have more than doubled in the new SAT. These results are in line with the College Board’s renewed focus on fluency between equations, text, and numbers; with more equations, expressions and text-based answers, the new SAT rewards those better able to interpret and present mathematical information across diverse contexts. The simple chart is found below, with a more detailed breakdown in Appendix A.
Data-Driven Insights for the New SAT 27
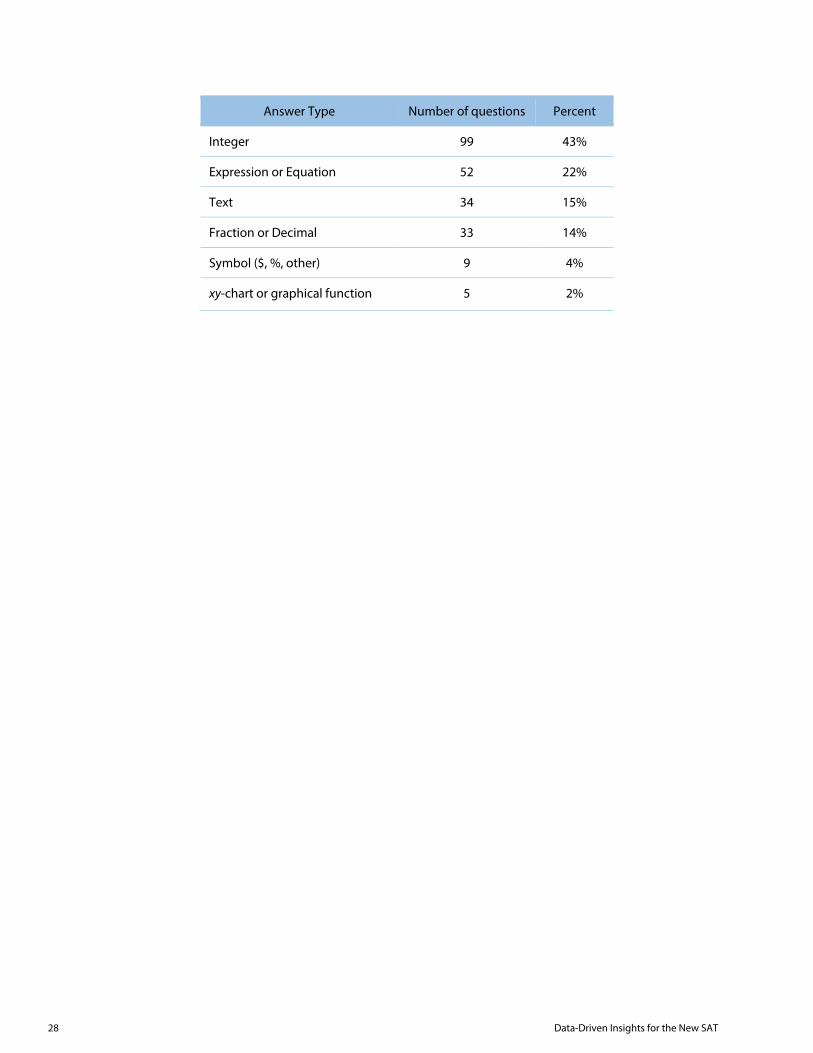
Answer Type Number of questions Percent
Integer 99 43%
Expression or Equation 52 22%
Text 34 15%
Fraction or Decimal 33 14%
Symbol ($, %, other) 9 4%
xy-chart or graphical function 5 2%
28 Data-Driven Insights for the New SAT
Are the questions more difficult? Part 5
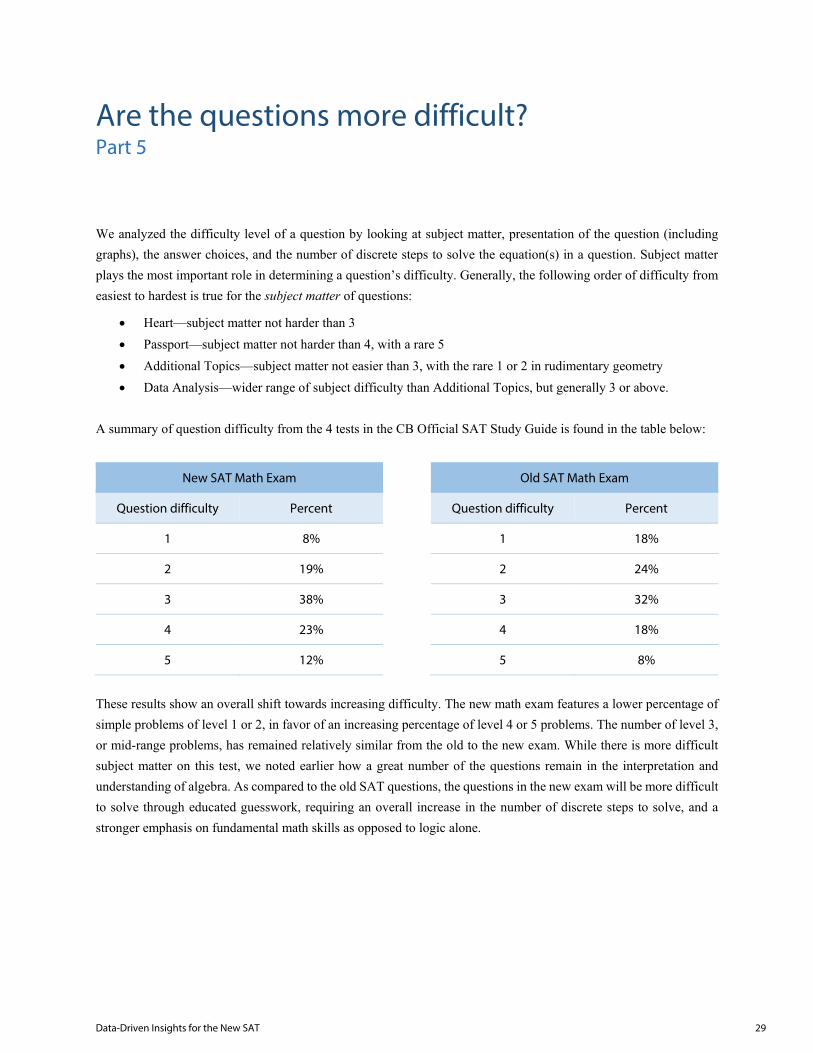
We analyzed the difficulty level of a question by looking at subject matter, presentation of the question (including graphs), the answer choices, and the number of discrete steps to solve the equation(s) in a question. Subject matter plays the most important role in determining a question’s difficulty. Generally, the following order of difficulty from easiest to hardest is true for the subject matter of questions:
• Heart—subject matter not harder than 3• Passport—subject matter not harder than 4, with a rare 5• Additional Topics—subject matter not easier than 3, with the rare 1 or 2 in rudimentary geometry• Data Analysis—wider range of subject difficulty than Additional Topics, but generally 3 or above.
A summary of question difficulty from the 4 tests in the CB Official SAT Study Guide is found in the table below:
New SAT Math Exam
Question difficulty Percent
1 8%
2 19%
3 38%
4 23%
5 12%
Old SAT Math Exam
Question difficulty Percent
1 18%
2 24%
3 32%
4 18%
5 8%
These results show an overall shift towards increasing difficulty. The new math exam features a lower percentage of simple problems of level 1 or 2, in favor of an increasing percentage of level 4 or 5 problems. The number of level 3, or mid-range problems, has remained relatively similar from the old to the new exam. While there is more difficult subject matter on this test, we noted earlier how a great number of the questions remain in the interpretation and understanding of algebra. As compared to the old SAT questions, the questions in the new exam will be more difficult to solve through educated guesswork, requiring an overall increase in the number of discrete steps to solve, and a stronger emphasis on fundamental math skills as opposed to logic alone.
Data-Driven Insights for the New SAT 29

Appendix A Detailed Charts
Question Graphics (detailed) Question Answer Choices (detailed)
E/combination fraction exponent 1 E/absolute value expression 1
E/exponent 1 E/absolute value or quadratic equation 1
E/function 3 E/combination fraction exponent expression 1
E/high order equation 2 E/complex expression 1
E/higher order expressions 1 E/complex number expression 1
E/linear equation 8 E/exponential expression 4
E/quadratic equation 9 E/exponential function 2
E/quadratic expression 3 E/higher order expression 1
E/quadratic function 1 E/inequality 4
E/quadratic polynomials 1 E/integer or exponent 1
E/square root equation 1 E/linear equation 9
E/system of equations 12 E/linear expression 8
E/system of inequalities 2 E/linear expressions 1
F/fraction 1 E/linear function 3
F/linear equation 1 E/linear or quadratic expression 3
F/quadratic equation 3 E/negative variable expression 1
G/acute angles 1 E/quadratic equation 6
G/bar graph 2 E/quadratic expression 2
G/circle 3 E/quadratic function 1
G/circle with tangent lines 1 E/system of inequalities 1
G/cones and cylinder 1 Fraction or decimal (Student-Produced Response Only) 13
G/cylindric figure 1 F/decimal 7
30 Data-Driven Insights for the New SAT

G/double bar graph 2 F/fraction 10
G/hexagon and square 1 F/integer and radical 1
G/intersecting lines 1 F/positive and decimal 1
G/isosceles triangles 1 F/positive decimal 1
G/line chart 3 Integer (Student-Produced Response Only) 39
G/parallel lines 1 I/coordinate 2
G/scatter plot 1 I/integer or fraction 1
G/similar triangles 3 I/negative 1
G/triangle 1 I/negative or zero 1
T/conversion chart 1 I/positive 46
T/table 23 I/positive or negative 8
XY/circle centered at origin 1 I/solutions set 1
XY/function graph 1 S/degree 1
XY/graph of a cubic 1 S/degrees Fahrenheit 1
XY/labeled quadrants 1 S/dollar value 5
XY/line graph 3 S/percentage 1
XY/parabola 1 S/time 1
XY/parallel lines on plane 1 T/category 3
XY/quadratic functions 1 T/explanation 9
XY/scatterplot 3 T/letter 1
XY/square on xy plane 1 T/math to text 2
T/numbers to text 1
T/roman numerals 4
T/statement 11
T/statistical measure 2
T/variable 1
XY/coordinate 1
XY/higher order function 1
Data-Driven Insights for the New SAT 31

XY/line graph 1
XY/scatterplot 2
Reading complexity ratings for passages on official practice test writing sections.
New SAT
Flesch-Kincaid
Coleman-Liau
Dale-Chall*
Dale-Chall Grade Level ARI SMOG Index Average Grade-
Level Rating
Test 1 Passage 1 12.4 13.7 9.3 13.6 13.6 10.9 12.84
Test 1 Passage 2 10.7 11.3 7.3 9.6 11 9.1 10.34
Test 1 Passage 3 12.2 12.9 7.8 10.6 12.2 11.6 11.9
Test 1 Passage 4
14.7 16.2 8.7 12.4 15.3 12.9 14.3
Test 1 Averages 12.5 13.53 8.28 11.55 13.03 11.13 12.35
Test 2 Passage 1 14.5 15.6 8.4 11.8 15.2 13.5 14.12
Test 2 Passage 2
8.7 10.7 7.2 9.4 8.8 8.9 9.3
Test 2 Passage 3 12.8 13.6 8.6 12.2 14 10.9 12.7
Test 2 Passage 4 12.6 13 8.4 11.8 13.5 10.8 12.34
Test 2 Averages
12.15 13.23 8.15 11.3 12.88 11.03 12.12
Test 3 Passage 1 13.6 15.1 8.7 12.4 14.7 12.3 13.62
Test 3 Passage 2 12 13.7 7.2 9.4 12.9 11.6 11.92
Test 3 Passage 3
13.8 11.2 8 11 14.8 11.4 12.44
Test 3 Passage 4 10.6 12.2 8 11 11.4 9.2 10.88
32 Data-Driven Insights for the New SAT

Test 3 Averages 12.5 13.05 7.98 10.95 13.45 11.13 12.22
Test 4 Passage 1 13 14.1 8.5 12 12.6 12.4 12.82
Test 4 Passage 2 16.5 16.5 9 13 17.7 15.9 15.92
Test 4 Passage 3 13.4 14.1 9 13 13.4 12.2 13.22
Test 4 Passage 4 14.6 13.4 8.2 11.4 15.2 13.1 13.54
Test 4 Averages 14.38 14.53 8.68 12.35 14.73 13.4 13.88
Average of all tests 12.88 13.58 8.27 11.54 13.52 11.67 12.64
12.64
Old SAT
Flesch-Kincaid
Coleman-Liau
Dale-Chall*
Dale-Chall Grade Level ARI SMOG Index Average grade-
level rating
OT 1 Questions
13.1 14.3 8.2 11.4 14.4 12 13.04
OT 1 Passages 10.1 14.6 7.8 10.6 10.5 9.9 11.14
OT 2 Questions 12.5 13.2 8.4 11.8 12.6 11.7 12.36
OT 2 Passages
9.9 11.6 7.3 9.6 9.9 9.1 10.02
OT 3 Questions 11.5 12.4 7.3 9.6 11.7 10.6 11.16
OT 3 Passages 6.1 8.4 5.4 5.8 5.7 6 6.4
10.69
questions 12.19
passages 9.19
*This figure is not expressed as a grade-level; it is converted into a grade level before being included in the average grade-level rating.
Data-Driven Insights for the New SAT 33

Analyzing Multiple Texts—Subtypes
Determining Implicit Meaning 4
Understanding Relationships 4
Analyzing Purpose 3
Analyzing Claims and Counterclaims 2
Determining Explicit Meaning 1
34 Data-Driven Insights for the New SAT