data collection and analysis using wearable … · data collection and analysis using wearable...
TRANSCRIPT
sensors
Article
Data Collection and Analysis Using WearableSensors for Monitoring Knee Range of Motionafter Total Knee Arthroplasty
Chih-Yen Chiang 1, Kun-Hui Chen 1,2, Kai-Chun Liu 1, Steen Jun-Ping Hsu 3 andChia-Tai Chan 1,*
1 Department of Biomedical Engineering, National Yang-Ming University, No. 155, Li-Nong St., Section 2,Peitou, Taipei 11221, Taiwan; [email protected] (C.-Y.C.); [email protected] (K.-H.C.);[email protected] (K.-C.L.)
2 Department of Orthopaedic Surgery, Taichung Veterans General Hospital, 1650 Taiwan Boulevard Section 4,Taichung 40705, Taiwan
3 Department of Information Management, Minghsin University of Science and Technology, No.1,Xinxing Road, Hsinchu 30401, Taiwan; [email protected]
* Correspondence: [email protected]; Tel.: +886-2-2826-7371; Fax: +886-2-2821-0847
Academic Editors: Edward Sazonov and Subhas Chandra MukhopadhyayReceived: 15 October 2016; Accepted: 13 February 2017; Published: 22 February 2017
Abstract: Total knee arthroplasty (TKA) is the most common treatment for degenerative osteoarthritisof that articulation. However, either in rehabilitation clinics or in hospital wards, the knee range ofmotion (ROM) can currently only be assessed using a goniometer. In order to provide continuousand objective measurements of knee ROM, we propose the use of wearable inertial sensors to recordthe knee ROM during the recovery progress. Digitalized and objective data can assist the surgeonsto control the recovery status and flexibly adjust rehabilitation programs during the early acuteinpatient stage. The more knee flexion ROM regained during the early inpatient period, the better thelong-term knee recovery will be and the sooner early discharge can be achieved. The results of thiswork show that the proposed wearable sensor approach can provide an alternative for continuousmonitoring and objective assessment of knee ROM recovery progress for TKA patients compared tothe traditional goniometer measurements.
Keywords: inertial sensor; wearable sensor; total knee arthroplasty; TKA; goniometer; range ofmotion; ROM
1. Introduction
Osteoarthritis of the knee is a degenerative disease that greatly impacts the activities of dailyliving (ADLs) and the quality of life of the elderly. The most common treatment method is Total KneeArthroplasty (TKA). By using artificial implants to replace the damaged knee joint, the knee functionscan be regained. In the United States, nearly 1.5% of Americans are living with a knee replacement,and for people aged over 50 years old the prevalence of TKA is up to 4.6% [1]. More than 700,000 TKAprocedures are performed annually in the US, and the number of TKA procedures is predicted toincrease greatly up to 3.48 million by 2030 due to the expected TKA revisions [2], although in general,patients requiring revision surgery in 10 years is less than 5% and it is very low overall [3].
The most important goal of TKA is to obtain postoperatively a maximized and function-regainedrange of motion (ROM) of the knee joint. However, during their recovery many TKA patients sufferfrom knee stiffness and reduced knee flexion of less than 90◦. Indeed, restricted postoperative kneeflexion is the most frequent complication after TKA procedures and it is also the main cause of patientdissatisfaction [4]. The recommended knee ROM recovery for performing ADLs is at least 100◦ of knee
Sensors 2017, 17, 418; doi:10.3390/s17020418 www.mdpi.com/journal/sensors
Sensors 2017, 17, 418 2 of 14
flexion. Tasks such as walking up stairs require at least 83◦ of knee flexion, 90◦ to 100◦ are needed forwalking down the stairs, 93◦ to 105◦ to arise from a chair, and more than 115◦ to squat or kneel [5,6].
Naylor et al. found that discharge knee ROM may be a useful clinical indicator to evaluatelong-term knee ROM restoration prognosis and it may be important for physiotherapists to maximizeknee ROM in the early and sub-acute stages after TKA procedures [7]. Restoration of postoperativeknee ROM affects both the patient’s health and medical service expenditures. Patients who havedifficulties in regaining the knee ROM must be discovered early and provided with more healthservices and direct assistance [8]. Of interest to these studies [5–8], active knee flexion recoverybefore hospital discharge has revealed a correlation with knee ROM at 12 months postoperation [7,8].This would suggest that if patients can improve their knee flexion during the early acute inpatientstage, long-term health outcomes and early discharge will be beneficial to the patients.
Aggressive knee rehabilitation programs enable patients to restore their functional capabilityto normal, so that they can obtain better recovery of long-term knee ROM and early discharge assoon as possible. To achieve this target, continuous monitoring of postoperative knee ROM, in-timecorrection during rehabilitation programs, and flexible adjustment of the rehabilitation force arerequired. The purpose on continuous monitoring is to collect as much data as possible so as to controlthe recovery conditions for postoperative TKA and do the necessary adjustments for the patients.In this study, we aimed to propose a method to conduct the data collection and data analysis formonitoring the recovery progress of knee ROM on TKA patients by using wearable sensors.
The rest of this paper is organized as follows: Section 2 briefly introduces related works andapproaches. Section 3 then details the proposed system architecture and the data handling methodsfor the collected data. Section 4 demonstrates the real data collected from patients and the analysisresults. Finally, Section 5 discusses the results, concludes the work, and addresses the future tasks ofthis study.
2. Related Works
The human skeleton is a highly articulated structure that moves based on the twists and rotationsbetween the bone and the joints. It requires a very high degree of freedom for motor activity [8]. Manymethods for analyzing the range of motion of the human skeleton have been proposed. This sectionreviews the literature on technologies and methods involved in motion tracking for rehabilitationand gait analysis. In the field of traditional biomechanical engineering, gait cycle analysis is the mostinteresting topic for researchers. Studies focused on the motions of specific segments of the humanskeleton, such as knees or shoulders, are relatively rare. This section introduces the related works intwo subsections.
2.1. Progress of Measurement-From Subjective to Objective
With the advancement of technology, it is obvious that motion tracking of human skeletons hasprogressed from subjective to objective. Among traditional ways of monitoring range of motion,visual-based tracking and goniometers are the most common methods. However, in these monitoringmethods it is difficult to avoid the individual offsets resulting from human judgement.
Lavernia et al. conducted a survey to evaluate the fairness and objectiveness by comparing ROMmeasurements using goniometers [9]. This study took radiographic measurements as the gold standardand compares the results of goniometer measurements performed by professionals with five differentroles. The results showed that higher ROM might be overestimated and measurement differencesexist between different individuals. Though radiographs are the gold standard for measuring kneejoint flexion/extension angles, goniometers are more convenient to use in the clinic and they cause noradiation exposure. On the negative side, measurement offsets caused by the human eye’s subjectivejudgement are inevitable.
Objective measurements and meaningful quantitative methods are two critical requirements formotion tracking. The most valuable approach is one able to distinguish tiny variations in knee ROM
Sensors 2017, 17, 418 3 of 14
and free from the interference of pain. Boonstra et al. proposed two quantitative approaches in 2008,one is patient-based questionnaires and another is performance-based tests [5,10]. This team proposedan indicator called WOMAC osteoarthritis index to evaluate the patient's physical performance inthe postoperative stage. Although this approach is objective and quantitative, it can only obtain theoutcomes of postoperative patients without the improvement of recovery records and the data ofknee/hip ROM.
Huosheng et al. classified human motion tracking systems into three types, which are visualtracking, non-visual tracking, and robot-aided tracking [8]. The visual-based motion tracking systemsmay include cameras, reflective tracking markers, feature extraction techniques and imaging processingtechniques. However, the visual tracking systems might be locally restricted and expensive. It isalso difficult to monitor different patients continuously. Non-visual motion tracking systems mostlyuse sensors for monitoring [8], such as inertial sensors, magnetic sensors, and sensor-integratedgloves [11–18]. The digital data collected by the sensors is considered to be a useful tool for monitoringpostoperative patients continuously. In the past five years, many sensor-based studies were proposedfor motion tracking and gait analysis. The related works will be discussed in the next section.Robot-aided tracking systems use robots to support and control limb motions by incorporating manysensors to achieve sense-measure-feedback mechanism. Although such a system may be helpful topostoperative patients, either on supporting the postoperative limbs or monitoring the recovery ofthe limbs, the incorporation of the rehabilitation robots and sensors makes this a big and often veryexpensive system, which is not suitable for minimally invasive surgeries, such as TKA because mostTKA patients will have early in-patient rehabilitation programs and the sensor measurements will beinterfered with by the robot supporting system.
From the above related works, the utility of using sensors for monitoring human motions is quiteapparent. Cost effective and easy deployment allow for multiple sensors to be mounted collectivelyon different body segments. Synchronized monitoring of multiple body segments had drawn manystudies falling into a similar infrastructure. We call this skeleton-based monitoring infrastructure.In Section 2.2, related studies on knee ROM and gait analysis are introduced.
2.2. Skeleton-Based Monitoring Infrastructure
Many studies have monitored motions and analyzed each body segment to assess the ROMand ambulatory performance. As listed in Table 1, these works have developed their own analysisapproaches by using different sensor combinations, but they were all based on the motion analysis ofeach skeleton segment.
Table 1. Related works on skeleton-based monitoring infrastructure.
Year Authors Sensors Wireless Analysis Reference
2008 Favre et al. 1 Gyro + 1 Acce. N Knee Joint [11]
2009 Liu et al. 2 Gyros + 1 Gyro+ Acce. N Gait [12]
2009 Takeda et al. 3 Gyros + 1 Acce. N Gait [13]
2011 Jovicic et al. 3 Acce. Units + 2 Flexible Goinometers Y Gait [14]
2013 Tadano et al. 7 Sensor units (1 Gyro+ 1 Acce.) Y Gait [15]
2014 Calliess et al. 3 Sensor units (1 Gyro+ 1 Acce. + 1 magnetometer) Y Knee Joint [16]
2015 Feldhege et al. 2 Sensor units (1 Gyro + 1 Acce.) N Knee Joint [17]
2015 Chen et al. 2 Sensor units (1 Gyro + 1 Acce.) Y Knee Joint [18]
* Acce. = accelerometer.
Basically, the principle is to wear at least two sensor units on two body segments and to calculatethe ROM by taking the joint as a fulcrum. As for the gait analysis, it undoubtedly requires more sensorunits. In general, such approaches are widely accepted and persuasive. Currently surgeons can onlyuse goniometers to obtain the postoperative knee ROM during routine ward inspections or during
Sensors 2017, 17, 418 4 of 14
clinic visits for outpatients. In recent years, many researchers had proposed many novel systems usingsensors [8–16] for monitoring recovery conditions for postoperative TKA patients.
Although motion sensors are highly sensitive and can be used in a wide range of fields, theyhave some disadvantages. For example, the recordings might have fluctuations induced by noises andpoor adhesion problems [19]. All these issues will lead to sensor drift problems. Several calibrationprotocols were proposed for knee joint rehabilitation, and the method proposed by Baker in 2006 [20] isso far still adopted as a gold standard [21]. In 2009, Takeda et al. used wearable gyro and accelerationsensors to estimate postures [22]. They used a mechanical turntable to initialize the zero offset ofaccelerations and angular data from the sensors. Caroselli et al. proposed a very simple architecture toestimate the angular kinematics of body segment movement [23]. Their results showed that single-axisaccelerometers can measure comparable angular data to the mechanical pendulum. From these studies,two alternatives can be suggested for solving the sensor drift problem. One is to apply externalcorrections before using these sensors, such as using the mechanical pendulum [23]. Another methodis to use other available sensors for compensation, cross validation and correction, such as by designinga mechanical turntable or a synchronized reset button [22].
From the above literatures, studies that focused on measuring the knee ROM is relatively rarecompared to gait cycle studies. Although the knee ROM seems to be part of gait analysis, thereare only a few works proposing effective approaches for knee ROM calculation. In this work, weadopted the skeleton-based infrastructure. The knee ROM estimation refers to the methods proposedby Takeda et al. [13]. However, the methods for long-term knee recovery monitoring require furtherdiscussion. In Section 2.3, we will present our research roadmap and explain the requirements for suchlong-term monitoring.
2.3. Motivations of This Study
According to the standard of care for TKA proposed by Brigham and Women’s Hospital(BWH) [24], the major objective is to aid the patients return to normal biomechanical status andimprove their knee ROM. Following the guidelines in the standard, caring acts can help the patients torecover their muscle balance ability, to alleviate their pain, and to improve the knee function and thequality of life. In this study, we are working on the same goals as this standard.
In our previous work [18], we proposed a rehabilitation monitoring mechanism for long-termoutpatient/home TKA recovery. This study used feature extraction to process the collected data andapplied different classifiers to identify the rehabilitation activities. In another study [25], we proposed asystem architecture for TKA patients at the acute inpatient stage. We conducted small scale experimentson four healthy subjects and five TKA patients to verify the proposed method. The results showed thatthe monitoring mechanism reveals that the knee ROM can be restored to the initial level before surgery.
In this study, we followed the same experimental design that we proposed in [25]. We attemptedto conduct a large scale clinical investigation on TKA patients for the purpose of improving wearablesensor use and further analysis including the patients’ personal factors, such as anesthesia status,hemostatic agents, and BMI value. In this work, we conducted the monitoring on 18 TKA patientsand also prepared a questionnaire to survey the improvements for comfortable sensor-worn methods.The experiments will be introduced in Section 3.
3. Materials and Methods
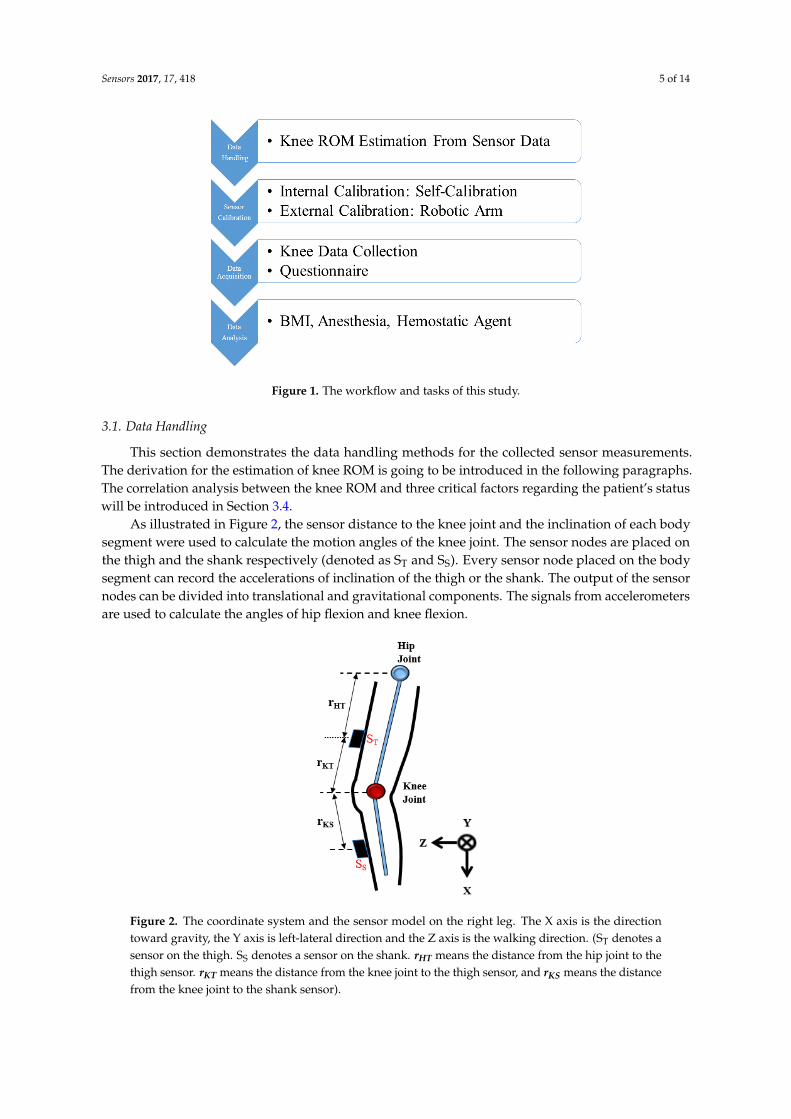
The workflow and tasks of this study are depicted in Figure 1. According to the workflow,we divided this section into four subsections. The first subsection will describe how we estimate theknee ROM from the sensor recording. Section 3.2 will introduce the sensor calibration proceduresbefore data collection. The third subsection will demonstrate the data collection experiments andthe questionnaires in collecting the patient opinions on sensor-worn methods. The final subsectionwill introduce the data analysis targets including patient’s BMI, post-TKA anesthesia status, and theconditions using hemostatic agents.
Sensors 2017, 17, 418 5 of 14Sensors 2017, 17, 418 5 of 14
Figure 1. The workflow and tasks of this study.
3.1. Data Handling
This section demonstrates the data handling methods for the collected sensor measurements.
The derivation for the estimation of knee ROM is going to be introduced in the following paragraphs.
The correlation analysis between the knee ROM and three critical factors regarding the patient’s
status will be introduced in Section 3.4.
As illustrated in Figure 2, the sensor distance to the knee joint and the inclination of each body
segment were used to calculate the motion angles of the knee joint. The sensor nodes are placed on
the thigh and the shank respectively (denoted as ST and SS). Every sensor node placed on the body
segment can record the accelerations of inclination of the thigh or the shank. The output of the sensor
nodes can be divided into translational and gravitational components. The signals from
accelerometers are used to calculate the angles of hip flexion and knee flexion.
Figure 2. The coordinate system and the sensor model on the right leg. The X axis is the direction
toward gravity, the Y axis is left-lateral direction and the Z axis is the walking direction. (ST denotes
a sensor on the thigh. SS denotes a sensor on the shank. 𝒓𝑯𝑻 means the distance from the hip joint to
the thigh sensor. 𝒓𝑲𝑻 means the distance from the knee joint to the thigh sensor, and 𝒓𝑲𝑺 means the
distance from the knee joint to the shank sensor).
Figure 1. The workflow and tasks of this study.
3.1. Data Handling
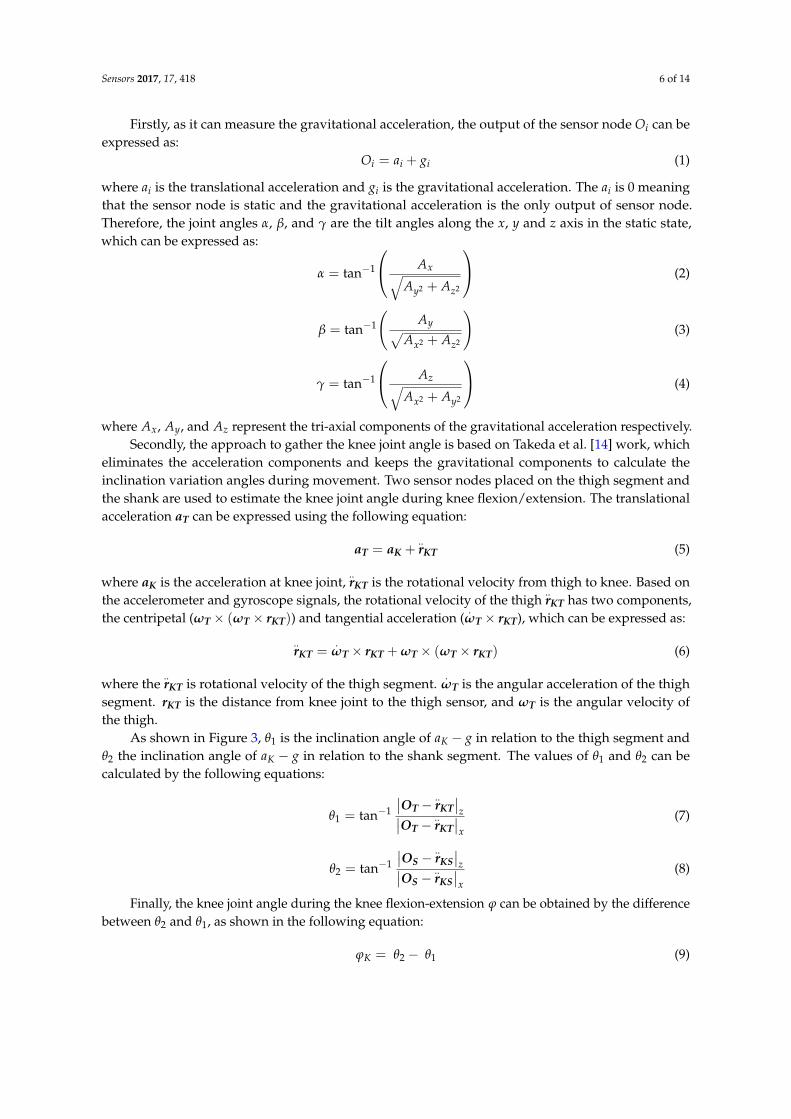
This section demonstrates the data handling methods for the collected sensor measurements.The derivation for the estimation of knee ROM is going to be introduced in the following paragraphs.The correlation analysis between the knee ROM and three critical factors regarding the patient’s statuswill be introduced in Section 3.4.
As illustrated in Figure 2, the sensor distance to the knee joint and the inclination of each bodysegment were used to calculate the motion angles of the knee joint. The sensor nodes are placed onthe thigh and the shank respectively (denoted as ST and SS). Every sensor node placed on the bodysegment can record the accelerations of inclination of the thigh or the shank. The output of the sensornodes can be divided into translational and gravitational components. The signals from accelerometersare used to calculate the angles of hip flexion and knee flexion.
Sensors 2017, 17, 418 5 of 14
Figure 1. The workflow and tasks of this study.
3.1. Data Handling
This section demonstrates the data handling methods for the collected sensor measurements.
The derivation for the estimation of knee ROM is going to be introduced in the following paragraphs.
The correlation analysis between the knee ROM and three critical factors regarding the patient’s
status will be introduced in Section 3.4.
As illustrated in Figure 2, the sensor distance to the knee joint and the inclination of each body
segment were used to calculate the motion angles of the knee joint. The sensor nodes are placed on
the thigh and the shank respectively (denoted as ST and SS). Every sensor node placed on the body
segment can record the accelerations of inclination of the thigh or the shank. The output of the sensor
nodes can be divided into translational and gravitational components. The signals from
accelerometers are used to calculate the angles of hip flexion and knee flexion.
Figure 2. The coordinate system and the sensor model on the right leg. The X axis is the direction
toward gravity, the Y axis is left-lateral direction and the Z axis is the walking direction. (ST denotes
a sensor on the thigh. SS denotes a sensor on the shank. 𝒓𝑯𝑻 means the distance from the hip joint to
the thigh sensor. 𝒓𝑲𝑻 means the distance from the knee joint to the thigh sensor, and 𝒓𝑲𝑺 means the
distance from the knee joint to the shank sensor).
Figure 2. The coordinate system and the sensor model on the right leg. The X axis is the directiontoward gravity, the Y axis is left-lateral direction and the Z axis is the walking direction. (ST denotes asensor on the thigh. SS denotes a sensor on the shank. rHT means the distance from the hip joint to thethigh sensor. rKT means the distance from the knee joint to the thigh sensor, and rKS means the distancefrom the knee joint to the shank sensor).
Sensors 2017, 17, 418 6 of 14
Firstly, as it can measure the gravitational acceleration, the output of the sensor node Oi can beexpressed as:
Oi = ai + gi (1)
where ai is the translational acceleration and gi is the gravitational acceleration. The ai is 0 meaningthat the sensor node is static and the gravitational acceleration is the only output of sensor node.Therefore, the joint angles α, β, and γ are the tilt angles along the x, y and z axis in the static state,which can be expressed as:
α = tan−1
Ax√Ay2 + Az2
(2)
β = tan−1
(Ay√
Ax2 + Az2
)(3)
γ = tan−1
Az√Ax2 + Ay2
(4)
where Ax, Ay, and Az represent the tri-axial components of the gravitational acceleration respectively.Secondly, the approach to gather the knee joint angle is based on Takeda et al. [14] work, which
eliminates the acceleration components and keeps the gravitational components to calculate theinclination variation angles during movement. Two sensor nodes placed on the thigh segment andthe shank are used to estimate the knee joint angle during knee flexion/extension. The translationalacceleration aT can be expressed using the following equation:
aT = aK +..rKT (5)
where aK is the acceleration at knee joint,..rKT is the rotational velocity from thigh to knee. Based on
the accelerometer and gyroscope signals, the rotational velocity of the thigh..rKT has two components,
the centripetal (ωT × (ωT × rKT)) and tangential acceleration (.
ωT × rKT), which can be expressed as:
..rKT =
.ωT × rKT + ωT × (ωT × rKT) (6)
where the..rKT is rotational velocity of the thigh segment.
.ωT is the angular acceleration of the thigh
segment. rKT is the distance from knee joint to the thigh sensor, and ωT is the angular velocity ofthe thigh.
As shown in Figure 3, θ1 is the inclination angle of aK − g in relation to the thigh segment andθ2 the inclination angle of aK − g in relation to the shank segment. The values of θ1 and θ2 can becalculated by the following equations:
θ1 = tan−1
∣∣OT − ..rKT∣∣z∣∣OT − ..
rKT∣∣x
(7)
θ2 = tan−1
∣∣OS −..rKS∣∣z∣∣OS −
..rKS∣∣x
(8)
Finally, the knee joint angle during the knee flexion-extension ϕ can be obtained by the differencebetween θ2 and θ1, as shown in the following equation:
ϕK = θ2 − θ1 (9)

Sensors 2017, 17, 418 7 of 14Sensors 2017, 17, 418 7 of 14
Figure 3. 𝜃1 is the inclined angle of 𝑎𝐾 − 𝑔 in relation to thigh segment and 𝜃2 the inclined angle
of 𝑎𝐾 − 𝑔 in relation to shank segment.
3.2. Sensor Calibration
Before real data collection in a clinical environment, the zero drift issues of the sensors and the
accuracy verification must be dealt with in advance. Therefore, the most important step is to calibrate
the sensors prior to their use on the patients. Inaccurate recordings will result in analysis bias and the
loss of clinical samples for which the clinical data is often rare and valuable. The sensors can
automatically perform self-calibration through the software user interface (UI) provided by the
sensor systems. Through the software UI, each sensor, gyroscope or accelerometer, can be calibrated
separately or just returned to its factory settings.
After the internal calibration was completed, we used a robotic arm as a standard tool to cross
check the sensor accuracy. The robotic arm (KR 5 sixx R650, KUKA, Singapur, Singapore) has 6-axis
degree of freedom in movements and a repeatability accuracy of up to ±0.02 mm [26]. The advantage
in using a robotic arm is the sensors can be placed on the two arms so as to simulate the real conditions
of sensors worn on the thigh and the shank. As shown in Figure 4, the two red circles indicate the
locations of two sensor nodes. The robotic arm can be configured to move and rotate along a specified
path or angle, therefore the sensor recordings can be compared with the designated movement path
of the robotic arm.
Figure 4. The robotic arm for sensor calibration.
Figure 3. θ1 is the inclined angle of aK − g in relation to thigh segment and θ2 the inclined angle ofaK − g in relation to shank segment.
3.2. Sensor Calibration
Before real data collection in a clinical environment, the zero drift issues of the sensors andthe accuracy verification must be dealt with in advance. Therefore, the most important step is tocalibrate the sensors prior to their use on the patients. Inaccurate recordings will result in analysisbias and the loss of clinical samples for which the clinical data is often rare and valuable. The sensorscan automatically perform self-calibration through the software user interface (UI) provided by thesensor systems. Through the software UI, each sensor, gyroscope or accelerometer, can be calibratedseparately or just returned to its factory settings.
After the internal calibration was completed, we used a robotic arm as a standard tool to crosscheck the sensor accuracy. The robotic arm (KR 5 sixx R650, KUKA, Singapur, Singapore) has 6-axisdegree of freedom in movements and a repeatability accuracy of up to ±0.02 mm [26]. The advantagein using a robotic arm is the sensors can be placed on the two arms so as to simulate the real conditionsof sensors worn on the thigh and the shank. As shown in Figure 4, the two red circles indicate thelocations of two sensor nodes. The robotic arm can be configured to move and rotate along a specifiedpath or angle, therefore the sensor recordings can be compared with the designated movement path ofthe robotic arm.
Sensors 2017, 17, 418 7 of 14
Figure 3. 𝜃1 is the inclined angle of 𝑎𝐾 − 𝑔 in relation to thigh segment and 𝜃2 the inclined angle
of 𝑎𝐾 − 𝑔 in relation to shank segment.
3.2. Sensor Calibration
Before real data collection in a clinical environment, the zero drift issues of the sensors and the
accuracy verification must be dealt with in advance. Therefore, the most important step is to calibrate
the sensors prior to their use on the patients. Inaccurate recordings will result in analysis bias and the
loss of clinical samples for which the clinical data is often rare and valuable. The sensors can
automatically perform self-calibration through the software user interface (UI) provided by the
sensor systems. Through the software UI, each sensor, gyroscope or accelerometer, can be calibrated
separately or just returned to its factory settings.
After the internal calibration was completed, we used a robotic arm as a standard tool to cross
check the sensor accuracy. The robotic arm (KR 5 sixx R650, KUKA, Singapur, Singapore) has 6-axis
degree of freedom in movements and a repeatability accuracy of up to ±0.02 mm [26]. The advantage
in using a robotic arm is the sensors can be placed on the two arms so as to simulate the real conditions
of sensors worn on the thigh and the shank. As shown in Figure 4, the two red circles indicate the
locations of two sensor nodes. The robotic arm can be configured to move and rotate along a specified
path or angle, therefore the sensor recordings can be compared with the designated movement path
of the robotic arm.
Figure 4. The robotic arm for sensor calibration. Figure 4. The robotic arm for sensor calibration.

Sensors 2017, 17, 418 8 of 14
As shown in the left picture in Figure 4, the upper arm of the robot is parallel to the horizontalplane in the initial state. The movement angle at the initial position is defined as zero. We configuredthe arm to move 90◦ clockwise and then move back to the initial position. This is defined as onemovement cycle. During an external calibration, the arm will perform the movement cycle ten timesso as to collect sufficient sensor data for calibration. Then the offsets can be eliminated as shown in theright picture in Figure 4.
3.3. Data Acquisition
After calibration, the sensors are ready to monitor the TKA patient’s knee ROM. In this work,we recruited 18 TKA patients and collected their knee data four times before and after TKA. The fourcollections were before the TKA procedure, two days after TKA, two weeks after TKA, and six weeksafter TKA. At the final data collection, a questionnaire was issued to collect the patients’ opinionsregarding their sensor wearing experience, with the purpose of identfying possible improvements forsensor-worn methods.
3.3.1. Knee Data Collection
The sensory system we used for data acquisition is called the APDM movement monitoringsystem. Each APDM sensor node includes an accelerometer, gyroscope, barometer, magnetometer,and temperature sensor. In this work, we enabled only the recordings of accelerometer andgyroscope for two reasons. One of the main purposes was to save power since continuousmeasurements are quite power-consuming. Another reason was to reduce the interferences fromthe environment to a minimum. For example, the magnetometer can easily suffer interferences frommany magnetic forces and ferrite-based equipment. Two APDM sensors were mounted on the anteriorsurface of the patient’s thigh and shank of the surgical limb, as shown in Figure 5. A sensor nodeis 48.5 × 36.5 × 13.5 mm3, weighs 22 g. The sampling rate is 40 Hz. The measurement range of theaccelerometer is ±58.5 m/s2 (6 g). The X and Y axis of the gyroscope have a range of ±34.9 rad/s,and the range of the Z-axis is ±26.8 rad/s.
Sensors 2017, 17, 418 8 of 14
As shown in the left picture in Figure 4, the upper arm of the robot is parallel to the horizontal
plane in the initial state. The movement angle at the initial position is defined as zero. We configured
the arm to move 90° clockwise and then move back to the initial position. This is defined as one
movement cycle. During an external calibration, the arm will perform the movement cycle ten times
so as to collect sufficient sensor data for calibration. Then the offsets can be eliminated as shown in
the right picture in Figure 4.
3.3. Data Acquisition
After calibration, the sensors are ready to monitor the TKA patient’s knee ROM. In this work,
we recruited 18 TKA patients and collected their knee data four times before and after TKA. The four
collections were before the TKA procedure, two days after TKA, two weeks after TKA, and six weeks
after TKA. At the final data collection, a questionnaire was issued to collect the patients’ opinions
regarding their sensor wearing experience, with the purpose of identfying possible improvements
for sensor-worn methods.
3.3.1. Knee Data Collection
The sensory system we used for data acquisition is called the APDM movement monitoring
system. Each APDM sensor node includes an accelerometer, gyroscope, barometer, magnetometer,
and temperature sensor. In this work, we enabled only the recordings of accelerometer and gyroscope
for two reasons. One of the main purposes was to save power since continuous measurements are
quite power-consuming. Another reason was to reduce the interferences from the environment to a
minimum. For example, the magnetometer can easily suffer interferences from many magnetic forces
and ferrite-based equipment. Two APDM sensors were mounted on the anterior surface of the
patient’s thigh and shank of the surgical limb, as shown in Figure 5. A sensor node is 48.5 × 36.5 ×
13.5 mm3, weighs 22 g. The sampling rate is 40 Hz. The measurement range of the accelerometer is
±58.5 m/s2 (6 g). The X and Y axis of the gyroscope have a range of ±34.9 rad/s, and the range of the
Z-axis is ±26.8 rad/s.
Figure 5. Two sensors were mounted on the anterior side of the thigh and shank.
We established a monitoring protocol to collect the data in the hospital ward and in the
outpatient clinic. Before using the wearable sensors, the medical professionals were trained and
tested. The monitoring protocols for the medical professional were as follows:
(1) Take two calibrated sensors and record their serial numbers on the data collection table. Unless
there are special requirements, the sensors can only monitor the surgical limb.
(2) After confirming that the green light of the sensor is on the upper left side, place two sensors on
the patient's anterior thigh and shank of the surgical limb. It is recommended to mount the
sensor 10 cm from the knee joint. The front side of the sensor should be kept parallel to the
coronal plane of the human body.
Figure 5. Two sensors were mounted on the anterior side of the thigh and shank.
We established a monitoring protocol to collect the data in the hospital ward and in theoutpatient clinic. Before using the wearable sensors, the medical professionals were trained andtested. The monitoring protocols for the medical professional were as follows:
(1) Take two calibrated sensors and record their serial numbers on the data collection table. Unlessthere are special requirements, the sensors can only monitor the surgical limb.
(2) After confirming that the green light of the sensor is on the upper left side, place two sensors onthe patient's anterior thigh and shank of the surgical limb. It is recommended to mount the sensor
Sensors 2017, 17, 418 9 of 14
10 cm from the knee joint. The front side of the sensor should be kept parallel to the coronal planeof the human body.
(3) Measure the distance rKT (from the knee joint to the thigh sensor) and the distance rKS (from theknee joint to the shank sensor). Write down these values on the data collection table.
(4) Let the patient lie down and ask the patient to stretch the surgical limb on the bed. Then, whilekeeping the foot on the bed slide the foot from the distal to proximal body position so as to letthe knee bend as much as possible (as shown in the left picture of Figure 5). Ask the patient toperform this task three times.
(5) Ask the patient to get off the bed and walk to the aisle. This task is to record the patient’s walkingstatus from the first marking to the second marking on the floor. The distance is about ten meters.The patient should try to walk as normal as possible.
(6) If any of above tasks were not well performed, ask the patient to repeat that task again,remembering to erase the previous data and write down the notes clearly on the datacollection table.
3.3.2. Questionnaire
The sensor wearing methods have long been a common issue for most wearable sensor systems.The issues include patient discomfort, sensor displacement induced noises, and so on. For the purposeof improving the sensor-worn methods, we used a questionnaire to collect the patients’ opinions.The contents of the questionnaire were as follows:
(1) Do you feel any discomfort while wearing the sensors?(2) Does the existence of the sensors influence your ambulatory and knee motions?(3) Please tell the professionals about the discomfort induced by the sensors and how the sensors
influence your normal gait and knee motion.
Example: something on my lower limb that makes me uncomfortable.
Example: the sensor belt is too tight that makes me unable to walk normally.(4) Would you like to wear the sensors after discharge? Please note that the sensors and your surgical
limb cannot touch any water during the monitoring period. The sensors will be taken off aftertwo weeks in the outpatient clinic.
(5) If the sensors were worn using a water-proof securement dressing, would you prefer to wear thesensors? Please note that the sensors and your surgical limb cannot touch any water during themonitoring period. The sensors will be taken off after two weeks in the outpatient clinic.
(6) Please write down any additional comments or suggestions.
3.4. Data Analysis
In this work, we conducted a correlation analysis between the collected knee ROM and the factorsregarding the patient's status. We selected three critical factors for this data analysis. The first one isthe body mass index (BMI). This is the most direct and common factor since the patient’s weight isdirectly applied on the post-TKA knee. Patients’ ambulatory condition is almost always positivelyrelated to their BMI values [27]. The second factor is the patient’s anesthesia status. One of the mostcommon pain relief methods is to use Epidural Patient Control Anesthesia (EPCA). Once the painis relieved, patients might be willing to get off the bed and walk. The third factor is the hemostaticagents applied on the patients perioperatively. The major agents used are transamin or tranexmic acid.The purpose of using a hemostatic agent is to reduce the blood loss during the surgery. The use ofhemostatic agents can be classified into two types. One is to provide the agents intravenously, andanother one is to deliver the agents intra-articularly. The hemostatic agents might further affect therecovery conditions of the wounds [28]. This is why we choose this factor for analysis.
Sensors 2017, 17, 418 10 of 14
4. Results
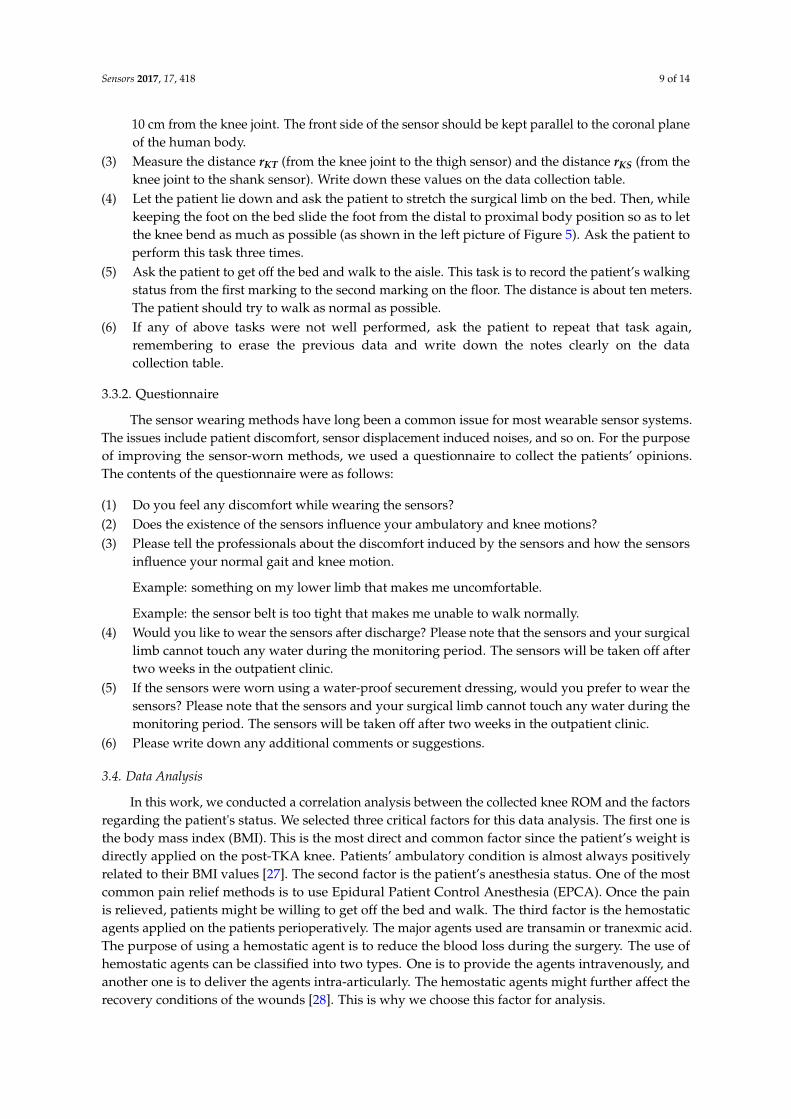
This section is divided into two subsections. Section 4.1 will present the data collection of 18 TKApatients. Four data collection sessions were conducted on each patient. The first data collection isperformed before TKA surgery, while the remaining data collections ocurred at two days, two weeks,and six weeks after the TKA surgery. Section 4.2 summarizes the conclusions from the questionnairewith respect to the comments about the sensor-worn methods.
4.1. Knee ROM of 18 TKA Patients
In this study, we conducted data collection and analysis on 18 TKA patients. Figure 6 illustratesthe knee ROM recovery status of the 18 patients. The results show that most of the patients hadrecovered in two weeks after TKA. By six weeks after TKA, the knee ROM almost returns to theconditions before surgery. Some patients had better knee ROM performance two days after TKA, butsome patients don’t have such symptoms. Some patients recovered with larger knee ROM at 6 weekspost-operation than before the TKA procedure. The results in Figure 6 indicate that there are certaincritical impact factors related to the recovery of knee ROM.
Sensors 2017, 17, 418 10 of 14
weeks, and six weeks after the TKA surgery. Section 4.2 summarizes the conclusions from the
questionnaire with respect to the comments about the sensor-worn methods.
4.1. Knee ROM of 18 TKA Patients
In this study, we conducted data collection and analysis on 18 TKA patients. Figure 6 illustrates
the knee ROM recovery status of the 18 patients. The results show that most of the patients had
recovered in two weeks after TKA. By six weeks after TKA, the knee ROM almost returns to the
conditions before surgery. Some patients had better knee ROM performance two days after TKA, but
some patients don’t have such symptoms. Some patients recovered with larger knee ROM at 6 weeks
post-operation than before the TKA procedure. The results in Figure 6 indicate that there are certain
critical impact factors related to the recovery of knee ROM.
Figure 6. The recovery knee ROM angles collected from 18 TKA patients at four stages.
Figure 7 illustrates the recovery status by dividing the 18 patients according to the use of EPCA.
Before the analysis, we assumed that the patients with EPCA might have better knee ROM
performance since their pains were alleviated.
Figure 7. The recovery knee ROM between patients with and without Epidural PCA (EPCA).
Figure 6. The recovery knee ROM angles collected from 18 TKA patients at four stages.
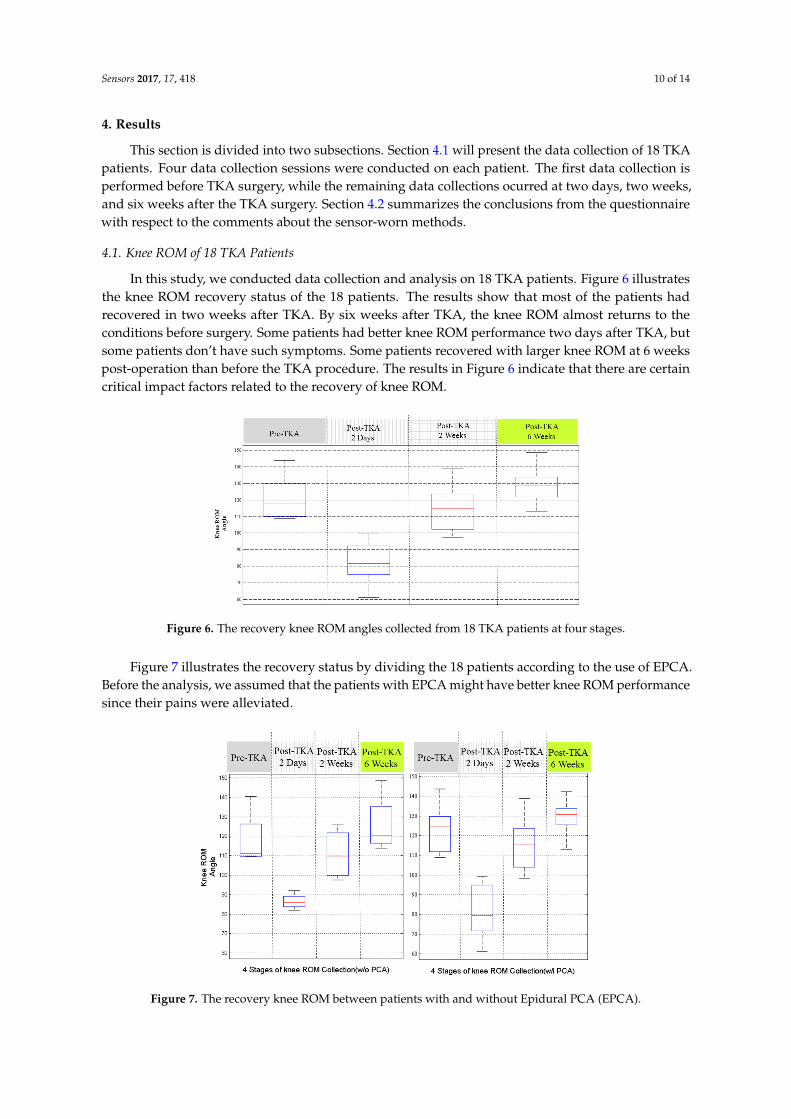
Figure 7 illustrates the recovery status by dividing the 18 patients according to the use of EPCA.Before the analysis, we assumed that the patients with EPCA might have better knee ROM performancesince their pains were alleviated.
Sensors 2017, 17, 418 10 of 14
weeks, and six weeks after the TKA surgery. Section 4.2 summarizes the conclusions from the
questionnaire with respect to the comments about the sensor-worn methods.
4.1. Knee ROM of 18 TKA Patients
In this study, we conducted data collection and analysis on 18 TKA patients. Figure 6 illustrates
the knee ROM recovery status of the 18 patients. The results show that most of the patients had
recovered in two weeks after TKA. By six weeks after TKA, the knee ROM almost returns to the
conditions before surgery. Some patients had better knee ROM performance two days after TKA, but
some patients don’t have such symptoms. Some patients recovered with larger knee ROM at 6 weeks
post-operation than before the TKA procedure. The results in Figure 6 indicate that there are certain
critical impact factors related to the recovery of knee ROM.
Figure 6. The recovery knee ROM angles collected from 18 TKA patients at four stages.
Figure 7 illustrates the recovery status by dividing the 18 patients according to the use of EPCA.
Before the analysis, we assumed that the patients with EPCA might have better knee ROM
performance since their pains were alleviated.
Figure 7. The recovery knee ROM between patients with and without Epidural PCA (EPCA). Figure 7. The recovery knee ROM between patients with and without Epidural PCA (EPCA).
Sensors 2017, 17, 418 11 of 14
Unexpectedly, the results were not as we predicted, although during the longer recovery period,the patients who used EPCA seemed to have better knee ROM recovery at 2 weeks after surgery.These results are however not solid because the patient group without using EPCA originally hadsmaller knee ROM before TKA. Therefore, these results require further discussion.
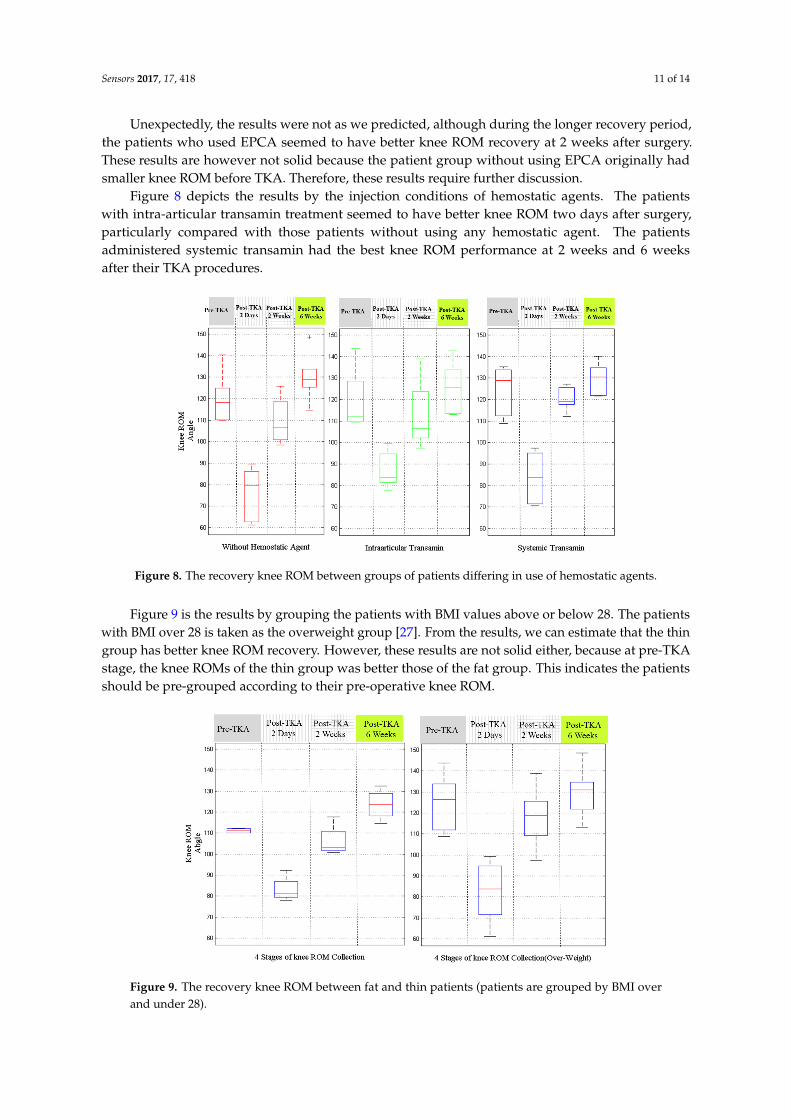
Figure 8 depicts the results by the injection conditions of hemostatic agents. The patientswith intra-articular transamin treatment seemed to have better knee ROM two days after surgery,particularly compared with those patients without using any hemostatic agent. The patientsadministered systemic transamin had the best knee ROM performance at 2 weeks and 6 weeksafter their TKA procedures.
Sensors 2017, 17, 418 11 of 14
Unexpectedly, the results were not as we predicted, although during the longer recovery period,
the patients who used EPCA seemed to have better knee ROM recovery at 2 weeks after surgery.
These results are however not solid because the patient group without using EPCA originally had
smaller knee ROM before TKA. Therefore, these results require further discussion.
Figure 8 depicts the results by the injection conditions of hemostatic agents. The patients with
intra-articular transamin treatment seemed to have better knee ROM two days after surgery,
particularly compared with those patients without using any hemostatic agent. The patients
administered systemic transamin had the best knee ROM performance at 2 weeks and 6 weeks after
their TKA procedures.
Figure 9 is the results by grouping the patients with BMI values above or below 28. The patients
with BMI over 28 is taken as the overweight group [27]. From the results, we can estimate that the
thin group has better knee ROM recovery. However, these results are not solid either, because at pre-
TKA stage, the knee ROMs of the thin group was better those of the fat group. This indicates the
patients should be pre-grouped according to their pre-operative knee ROM.
Figure 8. The recovery knee ROM between groups of patients differing in use of hemostatic agents.
Figure 9. The recovery knee ROM between fat and thin patients (patients are grouped by BMI over
and under 28).
Figure 8. The recovery knee ROM between groups of patients differing in use of hemostatic agents.
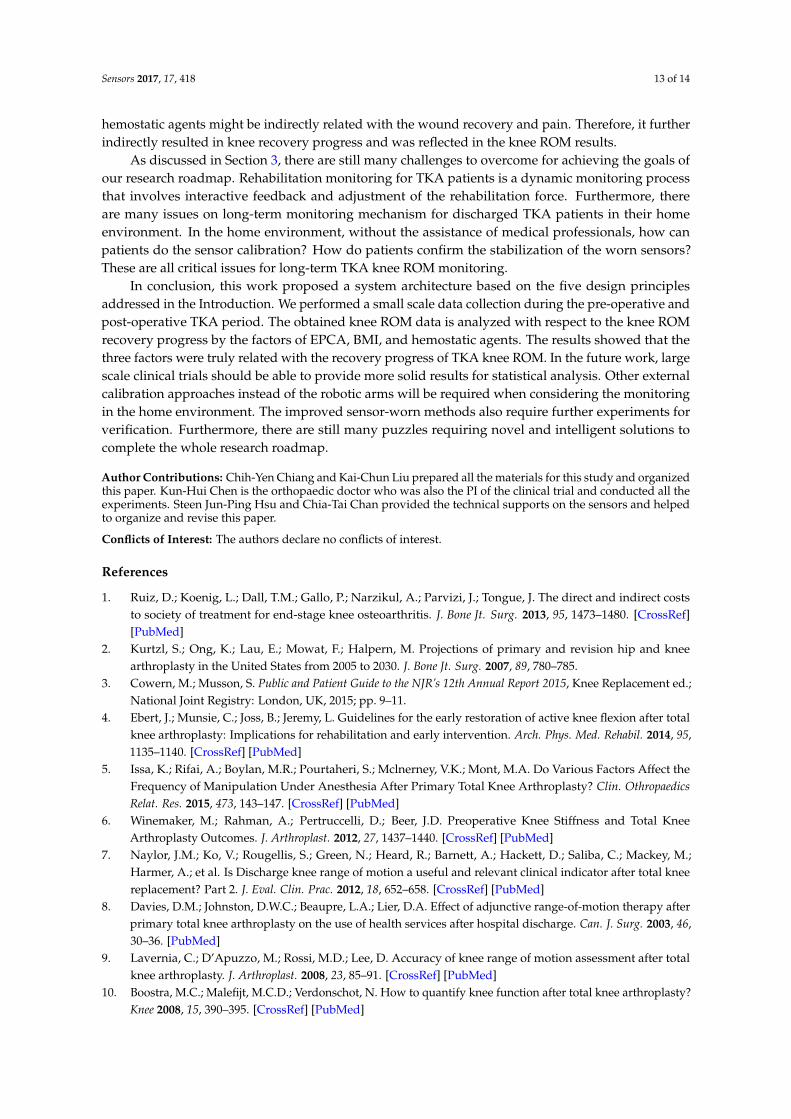
Figure 9 is the results by grouping the patients with BMI values above or below 28. The patientswith BMI over 28 is taken as the overweight group [27]. From the results, we can estimate that the thingroup has better knee ROM recovery. However, these results are not solid either, because at pre-TKAstage, the knee ROMs of the thin group was better those of the fat group. This indicates the patientsshould be pre-grouped according to their pre-operative knee ROM.
Sensors 2017, 17, 418 11 of 14
Unexpectedly, the results were not as we predicted, although during the longer recovery period,
the patients who used EPCA seemed to have better knee ROM recovery at 2 weeks after surgery.
These results are however not solid because the patient group without using EPCA originally had
smaller knee ROM before TKA. Therefore, these results require further discussion.
Figure 8 depicts the results by the injection conditions of hemostatic agents. The patients with
intra-articular transamin treatment seemed to have better knee ROM two days after surgery,
particularly compared with those patients without using any hemostatic agent. The patients
administered systemic transamin had the best knee ROM performance at 2 weeks and 6 weeks after
their TKA procedures.
Figure 9 is the results by grouping the patients with BMI values above or below 28. The patients
with BMI over 28 is taken as the overweight group [27]. From the results, we can estimate that the
thin group has better knee ROM recovery. However, these results are not solid either, because at pre-
TKA stage, the knee ROMs of the thin group was better those of the fat group. This indicates the
patients should be pre-grouped according to their pre-operative knee ROM.
Figure 8. The recovery knee ROM between groups of patients differing in use of hemostatic agents.
Figure 9. The recovery knee ROM between fat and thin patients (patients are grouped by BMI over
and under 28).
Figure 9. The recovery knee ROM between fat and thin patients (patients are grouped by BMI overand under 28).

Sensors 2017, 17, 418 12 of 14
4.2. Results of Questionnaires
Figure 10 shows the results of the questionnaire. The first result is about the feelings for sensorsworn by using a belt. Most of the patients felt OK, and only 17% patients felt uncomfortable.The second result is to understand the patient’s willingness if the belt were to be changed by using awaterproof dressing to stabilize the sensors. The results show that 58% patients would like to changethe sensor wearing scenario by using the waterproof dressing.
Sensors 2017, 17, 418 12 of 14
4.2. Results of Questionnaires
Figure 10 shows the results of the questionnaire. The first result is about the feelings for sensors
worn by using a belt. Most of the patients felt OK, and only 17% patients felt uncomfortable. The
second result is to understand the patient’s willingness if the belt were to be changed by using a
waterproof dressing to stabilize the sensors. The results show that 58% patients would like to change
the sensor wearing scenario by using the waterproof dressing.
Figure 10. The results of questionnaire for surveying the sensor-worn scenario.
5. Discussion and Conclusions
In this work, we have proposed a monitoring protocol and an approach for the purpose of aiding
the TKA patients and surgeons to control the recovery of knee ROM. The major contribution of this
study is to provide an effective monitoring approach, and the future goal will be able to positively
aid the TKA patients by adjusting the rehabilitation force based the monitoring feedback. The long-
term goal is to introduce the monitoring mechanism for outpatients at home.
In the proposed system architecture, the sensory system requires self-calibration and external
calibration to confirm the accuracy of the sensors before data collection. The external calibration
requires a robotic arm. This means the hospital might require dedicated personnel or a department
to perform the external calibration and maintain the robotic arm. This is not realistic or convenient.
In addition, it will greatly conflict with the long-term goal of monitoring outpatients at home. The
sensor calibration for long-term outpatient monitoring requires some other practical and convenient
alternative.
As for the results on 18 TKA patients, the EPCA and BMI data analysis seemed to have no
obvious correlation with the recovery progress. From the EPCA and BMI analysis results there are
two potential approaches to obtain better results. The first one is to collect more data to perform
statistical analysis on EPCA and BMI. The second approach is to conduct the clinical trial again and
root out the inappropriate patient data before performing the analysis. For example, before analyzing
the correlation with BMI, we should select the patients with comparable knee ROM before TKA. As
shown in Figure 6, it is noteworthy that the pre-TKA knee ROM of the 18 patients are all above 115
degrees. According to the studies in [5,6], the 18 patients are still able to perform normal ADLs and
walk, but with pain and loss of knee function. This also indicates that pre-filtering the patient’s pre-
TKA knee ROM on a consistent basis is essential for the purpose of obtaining distinguishable analysis
results.
The results on analysis of the recovery of knee ROM by using different hemostatic agents
showed that systemic transamin gave better results than intra-articular transamin. As we know the
hemostatic agents are to inhibit the function of plasmin so as to reduce the blood loss from the surgery.
The use of hemostatic agents might be indirectly related with the wound recovery and pain.
Figure 10. The results of questionnaire for surveying the sensor-worn scenario.
5. Discussion and Conclusions
In this work, we have proposed a monitoring protocol and an approach for the purpose of aidingthe TKA patients and surgeons to control the recovery of knee ROM. The major contribution of thisstudy is to provide an effective monitoring approach, and the future goal will be able to positively aidthe TKA patients by adjusting the rehabilitation force based the monitoring feedback. The long-termgoal is to introduce the monitoring mechanism for outpatients at home.
In the proposed system architecture, the sensory system requires self-calibration and externalcalibration to confirm the accuracy of the sensors before data collection. The external calibrationrequires a robotic arm. This means the hospital might require dedicated personnel or a department toperform the external calibration and maintain the robotic arm. This is not realistic or convenient.In addition, it will greatly conflict with the long-term goal of monitoring outpatients at home.The sensor calibration for long-term outpatient monitoring requires some other practical andconvenient alternative.
As for the results on 18 TKA patients, the EPCA and BMI data analysis seemed to have noobvious correlation with the recovery progress. From the EPCA and BMI analysis results there are twopotential approaches to obtain better results. The first one is to collect more data to perform statisticalanalysis on EPCA and BMI. The second approach is to conduct the clinical trial again and root outthe inappropriate patient data before performing the analysis. For example, before analyzing thecorrelation with BMI, we should select the patients with comparable knee ROM before TKA. As shownin Figure 6, it is noteworthy that the pre-TKA knee ROM of the 18 patients are all above 115 degrees.According to the studies in [5,6], the 18 patients are still able to perform normal ADLs and walk, butwith pain and loss of knee function. This also indicates that pre-filtering the patient’s pre-TKA kneeROM on a consistent basis is essential for the purpose of obtaining distinguishable analysis results.
The results on analysis of the recovery of knee ROM by using different hemostatic agents showedthat systemic transamin gave better results than intra-articular transamin. As we know the hemostaticagents are to inhibit the function of plasmin so as to reduce the blood loss from the surgery. The use of
Sensors 2017, 17, 418 13 of 14
hemostatic agents might be indirectly related with the wound recovery and pain. Therefore, it furtherindirectly resulted in knee recovery progress and was reflected in the knee ROM results.
As discussed in Section 3, there are still many challenges to overcome for achieving the goals ofour research roadmap. Rehabilitation monitoring for TKA patients is a dynamic monitoring processthat involves interactive feedback and adjustment of the rehabilitation force. Furthermore, thereare many issues on long-term monitoring mechanism for discharged TKA patients in their homeenvironment. In the home environment, without the assistance of medical professionals, how canpatients do the sensor calibration? How do patients confirm the stabilization of the worn sensors?These are all critical issues for long-term TKA knee ROM monitoring.
In conclusion, this work proposed a system architecture based on the five design principlesaddressed in the Introduction. We performed a small scale data collection during the pre-operative andpost-operative TKA period. The obtained knee ROM data is analyzed with respect to the knee ROMrecovery progress by the factors of EPCA, BMI, and hemostatic agents. The results showed that thethree factors were truly related with the recovery progress of TKA knee ROM. In the future work, largescale clinical trials should be able to provide more solid results for statistical analysis. Other externalcalibration approaches instead of the robotic arms will be required when considering the monitoringin the home environment. The improved sensor-worn methods also require further experiments forverification. Furthermore, there are still many puzzles requiring novel and intelligent solutions tocomplete the whole research roadmap.
Author Contributions: Chih-Yen Chiang and Kai-Chun Liu prepared all the materials for this study and organizedthis paper. Kun-Hui Chen is the orthopaedic doctor who was also the PI of the clinical trial and conducted all theexperiments. Steen Jun-Ping Hsu and Chia-Tai Chan provided the technical supports on the sensors and helpedto organize and revise this paper.
Conflicts of Interest: The authors declare no conflicts of interest.
References
1. Ruiz, D.; Koenig, L.; Dall, T.M.; Gallo, P.; Narzikul, A.; Parvizi, J.; Tongue, J. The direct and indirect coststo society of treatment for end-stage knee osteoarthritis. J. Bone Jt. Surg. 2013, 95, 1473–1480. [CrossRef][PubMed]
2. Kurtzl, S.; Ong, K.; Lau, E.; Mowat, F.; Halpern, M. Projections of primary and revision hip and kneearthroplasty in the United States from 2005 to 2030. J. Bone Jt. Surg. 2007, 89, 780–785.
3. Cowern, M.; Musson, S. Public and Patient Guide to the NJR’s 12th Annual Report 2015, Knee Replacement ed.;National Joint Registry: London, UK, 2015; pp. 9–11.
4. Ebert, J.; Munsie, C.; Joss, B.; Jeremy, L. Guidelines for the early restoration of active knee flexion after totalknee arthroplasty: Implications for rehabilitation and early intervention. Arch. Phys. Med. Rehabil. 2014, 95,1135–1140. [CrossRef] [PubMed]
5. Issa, K.; Rifai, A.; Boylan, M.R.; Pourtaheri, S.; Mclnerney, V.K.; Mont, M.A. Do Various Factors Affect theFrequency of Manipulation Under Anesthesia After Primary Total Knee Arthroplasty? Clin. OthropaedicsRelat. Res. 2015, 473, 143–147. [CrossRef] [PubMed]
6. Winemaker, M.; Rahman, A.; Pertruccelli, D.; Beer, J.D. Preoperative Knee Stiffness and Total KneeArthroplasty Outcomes. J. Arthroplast. 2012, 27, 1437–1440. [CrossRef] [PubMed]
7. Naylor, J.M.; Ko, V.; Rougellis, S.; Green, N.; Heard, R.; Barnett, A.; Hackett, D.; Saliba, C.; Mackey, M.;Harmer, A.; et al. Is Discharge knee range of motion a useful and relevant clinical indicator after total kneereplacement? Part 2. J. Eval. Clin. Prac. 2012, 18, 652–658. [CrossRef] [PubMed]
8. Davies, D.M.; Johnston, D.W.C.; Beaupre, L.A.; Lier, D.A. Effect of adjunctive range-of-motion therapy afterprimary total knee arthroplasty on the use of health services after hospital discharge. Can. J. Surg. 2003, 46,30–36. [PubMed]
9. Lavernia, C.; D’Apuzzo, M.; Rossi, M.D.; Lee, D. Accuracy of knee range of motion assessment after totalknee arthroplasty. J. Arthroplast. 2008, 23, 85–91. [CrossRef] [PubMed]
10. Boostra, M.C.; Malefijt, M.C.D.; Verdonschot, N. How to quantify knee function after total knee arthroplasty?Knee 2008, 15, 390–395. [CrossRef] [PubMed]
Sensors 2017, 17, 418 14 of 14
11. Favre, J.; Jolles, B.M.; Aissaoui, R.; Aminian, K. Ambulatory measurement of 3D knee joint angle. J. Biomech.2008, 42, 1029–1035. [CrossRef] [PubMed]
12. Liu, T.; Inoue, Y.; Shibata, K. Development of a wearable sensor system for quantitative gait analysis.Measurement 2009, 42, 978–988. [CrossRef]
13. Ryo, T.; Shigeru, T.; Akiko, N.; Masahiro, T.; Satoshi, Y. Gait posture estimation using wearable accelerationand gyro sensors. J. Biomech. 2009, 42, 2486–2494.
14. Jovicic, M.D.D.; Jovicic, N.S.; Popovic, D.B. Kinematics of gait: New method for angle estimation based onaccelerometers. Sensors 2011, 11, 10571–10585. [CrossRef] [PubMed]
15. Shigeru, T.; Ryo, T.; Hiroaki, M. Three dimensional gait analysis using wearable acceleration and gyrosensors based on quaternion calculations. Sensors 2013, 13, 9321–9343.
16. Calliess, T.; Bocklage, R.; Karkosch, R.; Marschollek, M.; Windhagen, H.; Schulze, M. Clinical Evaluation of amobile sensor-based gait analysis method for outcome measurement after knee arthroplasty. Sensors 2014,14, 15953–15964. [CrossRef] [PubMed]
17. Feldhege, F.; Moeller, A.M.; Lindner, T.; Hein, A.; Markschies, A.; Zettl, U.K.; Bader, R. Accuracy of a customphysical activity and knee angle measurement sensor system for patients with neuromuscular disorders andgait abnormalities. Sensors 2015, 15, 10734–10752. [CrossRef] [PubMed]
18. Chen, K.H.; Chen, P.C.; Liu, K.C.; Chan, C.T. Wearable sensor-based rehabilitation exercise assessment forknee osteoarthritis. Sensors 2015, 15, 4193–4211. [CrossRef] [PubMed]
19. Zhou, H.; Hu, H. Human motion tracking for rehabilitation-a survey. Biomed. Signal Proc. Control 2008, 3,1–18. [CrossRef]
20. Baker, R. Gait analysis methods in rehabilitation. J. NeuroEng. Rehabil. 2006, 3, 1–10. [CrossRef] [PubMed]21. Favre, J.; Aissaoui, R.; Jolles, B.M.; De Guise, J.A.; Aminian, K. Functional calibration procedure for 3D knee
joint angle description using inertial sensors. J. Biomech. 2009, 42, 2330–2335. [CrossRef] [PubMed]22. Ryo, T.; Shigeru, T.; Akiko, N.; Mashahiro, T.; Satoshi, Y. Gait Analysis using Gravitational Acceleration
measured by Wearable Sensors. J. Biomech. 2009, 42, 223–233.23. Caroselli, A.; Bagala, F.; Cappello, A. Quasi-real time estimation of angular kinematics using single-axis
accelerometers. Sensors 2013, 13, 918–937. [CrossRef] [PubMed]24. Physical Therapy, Department of Rehabilitation Services. Standard of Care: Total Knee Arthroplasty;
The Brigham and Women’s Hospital Inc.: Boston, MA, USA, 2008; pp. 1–17.25. Chen, K.H.; Tseng, W.C.; Liu, K.C.; Chan, C.T. Using Gyroscopes and Accelerometers as a Practical
Rehabilitation Monitor System after Total Knee Arthroplasty. In Proceedings of the IEEE InternationalMicrowave Workshop Series on RF and Wireless Technologies for Biomedical and Healthcare Applications(IMWS-BIO), Taipei, Taiwan, 21–23 September 2015; pp. 58–59.
26. KUKA Robotics Corp; KUKA Download Center. KR 5 sixx R650, R850 CR Specification Datasheet. Availableonline: http://www.kuka-robotics.com/usa/en/downloads/search/ (accessed on 15 October 2016).
27. Cai, L.; Han, X.; Qi, Z.; Li, Z.; Zhang, Y.; Wang, P.; Liu, A. Prevalence of overweight and obesity and weightloss practice among Beijing adults, 2011. PLoS ONE 2014, 9, e98744. [CrossRef] [PubMed]
28. Chen, J.Y.; Chia, S.L.; Lo, N.N.; Yeo, S.J. Intra-articular versus intravenous tranexamic acid in primary totalknee replacement. Annu. Transl. Med. 2015, 3, 33.
© 2017 by the authors. Licensee MDPI, Basel, Switzerland. This article is an open accessarticle distributed under the terms and conditions of the Creative Commons Attribution(CC BY) license (http://creativecommons.org/licenses/by/4.0/).