data centre pricing in europe 2015 to 2020 centre... · data centre pricing in europe 2015 to 2020...
TRANSCRIPT
Data Centre Pricing in Europe 2015 to 2020 Chapter 1
Data Centre Pricing in Europe
2015 to 2020
Published: July 2015
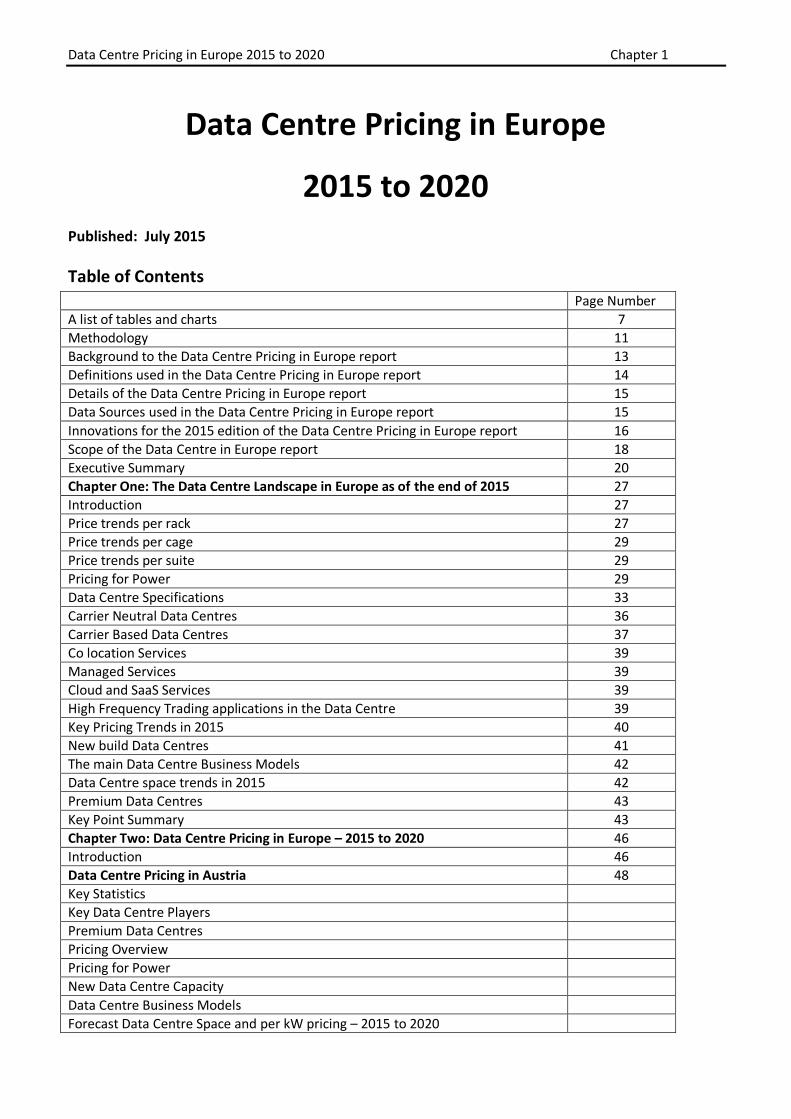
Table of Contents
Page Number
A list of tables and charts 7
Methodology 11
Background to the Data Centre Pricing in Europe report 13
Definitions used in the Data Centre Pricing in Europe report 14
Details of the Data Centre Pricing in Europe report 15
Data Sources used in the Data Centre Pricing in Europe report 15
Innovations for the 2015 edition of the Data Centre Pricing in Europe report 16
Scope of the Data Centre in Europe report 18
Executive Summary 20
Chapter One: The Data Centre Landscape in Europe as of the end of 2015 27
Introduction 27
Price trends per rack 27
Price trends per cage 29
Price trends per suite 29
Pricing for Power 29
Data Centre Specifications 33
Carrier Neutral Data Centres 36
Carrier Based Data Centres 37
Co location Services 39
Managed Services 39
Cloud and SaaS Services 39
High Frequency Trading applications in the Data Centre 39
Key Pricing Trends in 2015 40
New build Data Centres 41
The main Data Centre Business Models 42
Data Centre space trends in 2015 42
Premium Data Centres 43
Key Point Summary 43
Chapter Two: Data Centre Pricing in Europe – 2015 to 2020 46
Introduction 46
Data Centre Pricing in Austria 48
Key Statistics
Key Data Centre Players
Premium Data Centres
Pricing Overview
Pricing for Power
New Data Centre Capacity
Data Centre Business Models
Forecast Data Centre Space and per kW pricing – 2015 to 2020

Data Centre Pricing in Europe 2015 to 2020 Chapter 1
Forecast Assumptions
Key Features of the Data Centre Market in Austria
Data Centre Pricing in Belgium 53
Key Statistics
Key Data Centre Players
Premium Data Centres
Pricing Overview
Pricing for Power
New Data Centre Capacity
Data Centre Business Models
Forecast Data Centre Space and per kW pricing – 2015 to 2020
Forecast Assumptions
Key Features of the Data Centre Market in Belgium
Data Centre Pricing in the Czech Republic 58
Key Statistics
Key Data Centre Players
Premium Data Centres
Pricing Overview
Pricing for Power
New Data Centre Capacity
Data Centre Business Models
Forecast Data Centre Space and per kW pricing – 2015 to 2020
Forecast Assumptions
Key Features of the Data Centre Market in the Czech Republic
Data Centre Pricing in Denmark 65
Key Statistics
Key Data Centre Players
Premium Data Centres
Pricing Overview
Pricing for Power
New Data Centre Capacity
Data Centre Business Models
Forecast Data Centre Space and per kW pricing – 2015 to 2020
Forecast Assumptions
Key Features of the Data Centre Market in Denmark
Data Centre Pricing in Finland 71
Key Statistics
Key Data Centre Players
Premium Data Centres
Pricing Overview
Pricing for Power
New Data Centre Capacity
Data Centre Business Models
Forecast Data Centre Space and per kW pricing – 2015 to 2020
Forecast Assumptions
Key Features of the Data Centre Market in Finland
Data Centre Pricing in France 77
Key Statistics

Data Centre Pricing in Europe 2015 to 2020 Chapter 1
Key Data Centre Players
Premium Data Centres
Pricing Overview
Pricing for Power
New Data Centre Capacity
Data Centre Business Models
Forecast Data Centre Space and per kW pricing – 2015 to 2020
Forecast Assumptions
Key Features of the Data Centre Market in France
Data Centre Pricing in Germany 84
Key Statistics
Key Data Centre Players
Premium Data Centres
Pricing Overview
Pricing for Power
New Data Centre Capacity
Data Centre Business Models
Forecast Data Centre Space and per kW pricing – 2015 to 2020
Forecast Assumptions
Key Features of the Data Centre market in Germany
Data Centre Pricing in Greece 93
Key Statistics
Key Data Centre Players
Premium Data Centres
Pricing Overview
Pricing for Power
New Data Centre Capacity
Data Centre Business Models
Forecast Data Centre Space and per kW pricing – 2015 to 2020
Forecast Assumptions
Key Features of the Data Centre market in Greece
Data Centre Pricing in Hungary 97
Key Statistics
Key Data Centre Players
Premium Data Centres
Pricing Overview
Pricing for Power
New Data Centre Capacity
Data Centre Business Models
Forecast Data Centre Space and per kW pricing – 2015 to 2020
Key Features of the Data Centre market in Hungary
Data Centre Pricing in Iceland 104
Key Statistics
Key Data Centre Players
Premium Data Centres
Pricing Overview
Pricing for Power
New Data Centre Capacity
Data Centre Business Models
Forecast Data Centre Space and per kW pricing – 2015 to 2020

Data Centre Pricing in Europe 2015 to 2020 Chapter 1
Key Features of the Data Centre market in Iceland
Data Centre Pricing in Ireland 108
Key Statistics
Key Data Centre Players
Premium Data Centres
Pricing Overview
Pricing for Power
New Data Centre Capacity
Data Centre Business Models
Forecast Data Centre Space and per kW pricing – 2015 to 2020
Forecast Assumptions
Key Features of the Data Centre market in Ireland
Data Centre Pricing in Italy 115
Key Statistics
Key Data Centre Players
Premium Data Centres
Availability of High Density Data Centre space
Pricing Overview
Pricing for Power
New Data Centre Capacity
Data Centre Business Models
Forecast Data Centre Space and per kW pricing – 2015 to 2020
Forecast Assumptions
Key Features of the Data Centre market in Italy
Data Centre Pricing in Luxembourg 122
Key Statistics
Key Data Centre Players
Premium Data Centres
Pricing Overview
Pricing for Power
New Data Centre Capacity
Data Centre Business Models
Forecast Data Centre Space and per kW pricing – 2015 to 2020
Forecast Assumptions
Key Features of the Data Centre market in Luxembourg
Data Centre Pricing in the Netherlands 128
Key Statistics
Key Data Centre Players
Premium Data Centres
Pricing Overview
Pricing for Power
New Data Centre Capacity
Data Centre Business Models
Forecast Data Centre Space and per kW pricing – 2015 to 2020
Forecast Assumptions
Key Features of the Data Centre market in the Netherlands
Data Centre Pricing in Norway 135
Key Statistics
Data Centre Pricing in Europe 2015 to 2020 Chapter 1
Key Data Centre Players
Premium Data Centres
Pricing Overview
Pricing for Power
New Data Centre Capacity
Data Centre Business Models
Forecast Data Centre Space and per kW pricing – 2015 to 2020
Forecast Assumptions
Key Features of the Data Centre market in Norway
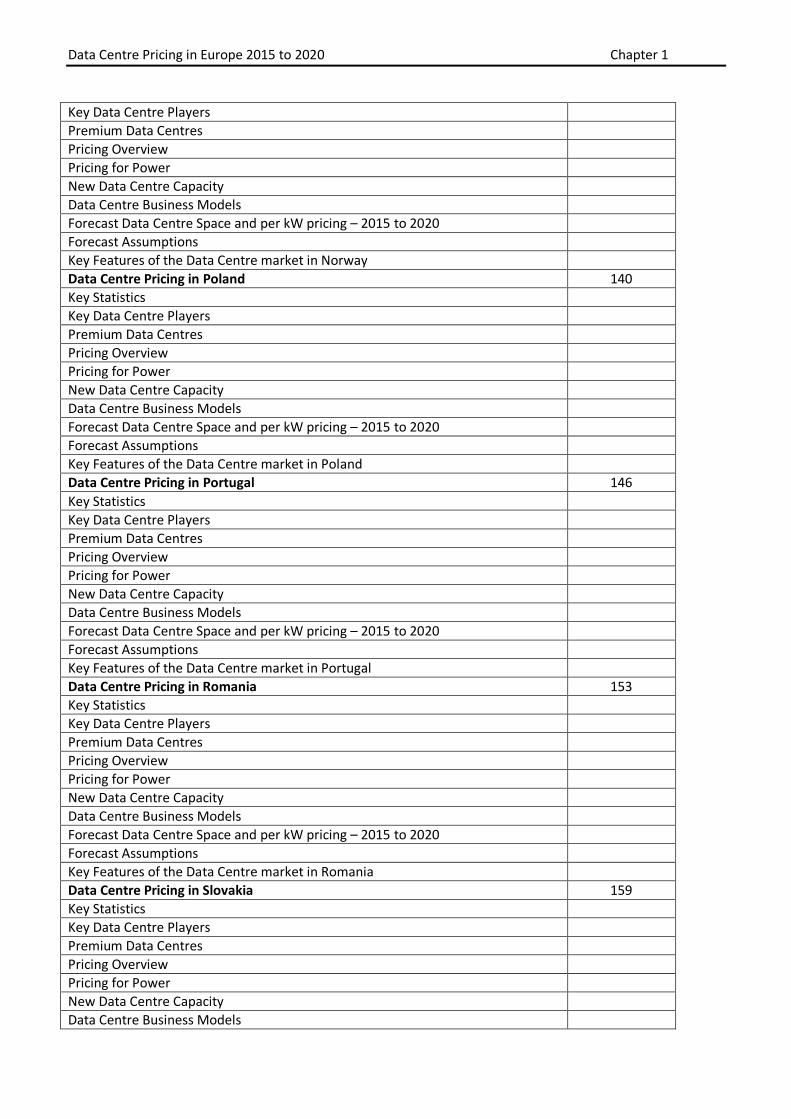
Data Centre Pricing in Poland 140
Key Statistics
Key Data Centre Players
Premium Data Centres
Pricing Overview
Pricing for Power
New Data Centre Capacity
Data Centre Business Models
Forecast Data Centre Space and per kW pricing – 2015 to 2020
Forecast Assumptions
Key Features of the Data Centre market in Poland
Data Centre Pricing in Portugal 146
Key Statistics
Key Data Centre Players
Premium Data Centres
Pricing Overview
Pricing for Power
New Data Centre Capacity
Data Centre Business Models
Forecast Data Centre Space and per kW pricing – 2015 to 2020
Forecast Assumptions
Key Features of the Data Centre market in Portugal
Data Centre Pricing in Romania 153
Key Statistics
Key Data Centre Players
Premium Data Centres
Pricing Overview
Pricing for Power
New Data Centre Capacity
Data Centre Business Models
Forecast Data Centre Space and per kW pricing – 2015 to 2020
Forecast Assumptions
Key Features of the Data Centre market in Romania
Data Centre Pricing in Slovakia 159
Key Statistics
Key Data Centre Players
Premium Data Centres
Pricing Overview
Pricing for Power
New Data Centre Capacity
Data Centre Business Models

Data Centre Pricing in Europe 2015 to 2020 Chapter 1
Forecast Data Centre Space and per kW pricing – 2015 to 2020
Forecast Assumptions
Key Features of the Data Centre market in Slovakia
Data Centre Pricing in Slovenia 164
Key Statistics
Key Data Centre Players
Premium Data Centres
Pricing Overview
Pricing for Power
New Data Centre Capacity
Data Centre Business Models
Forecast Data Centre Space and per kW pricing – 2015 to 2020
Forecast Assumptions
Key Features of the Data Centre market in Slovenia
Data Centre Pricing in Spain 168
Key Statistics
Key Data Centre Players
Premium Data Centres
Pricing Overview
Pricing for Power
New Data Centre Capacity
Data Centre Business Models
Forecast Data Centre Space and per kW pricing – 2015 to 2020
Forecast Assumptions
Key Features of the Data Centre market in Spain
Data Centre Pricing in Sweden 174
Key Statistics
Key Data Centre Players
Premium Data Centres
Pricing Overview
Pricing for Power
New Data Centre Capacity
Data Centre Business Models
Forecast Data Centre Space and per kW pricing – 2015 to 2020
Forecast Assumptions
Key Features of the Data Centre market in Sweden
Data Centre Pricing in Switzerland 181
Key Statistics
Key Data Centre Players
Premium Data Centres
Pricing Overview
Pricing for Power
New Data Centre Capacity
Data Centre Business Models
Forecast Data Centre Space and per kW pricing – 2015 to 2020
Forecast Assumptions
Key Features of the Data Centre market in Switzerland

Data Centre Pricing in Europe 2015 to 2020 Chapter 1
Data Centre Pricing in the UK 186
Key Statistics
Key Data Centre Players
Premium Data Centres
Pricing Overview
Pricing for Power
New Data Centre Capacity
Data Centre Business Models
Forecast Data Centre Space and per kW pricing – 2015 to 2020
Forecast Assumptions
Key Features of the Data Centre market in the UK
Key Point Summary
Conclusions to the Country survey of the Data Centre Pricing Europe 2015 - 2020 198
Chapter Three: Conclusions – Data Centre Pricing in Europe – 2015 to 2020 200
Introduction 200
The main findings from the survey 200
New Data Centre Capacity 208
New Data Centre specifications and costs 215
Data Centre Utilisation 216
Managed Service trends 216
Carrier Based Data Centre trends 217
Carrier Neutral Data Centre trends 217
Wholesale Data Centre trends 217
Key Point Summary 218
Appendix One: A list of Data Centres that are included in this report 219
A list of tables and charts – Data Centre Pricing in Europe – 2015 to 2020
Figure 1: A table showing the breakdown of the number of the number of Data Centre providers, facilities, raised floor space and total customer power by Country Market
Figure 2: A table showing the currency exchange rates that are used in this report
Figure 3: A table summarizing the Data Centre landscape in Europe Figure 4: A table showing the breakdown of Data Centre raised floor space and customer power
by Country Market Figure 5: A pie chart showing the percentage of Data Centre raised floor space by Country Market Figure 6: A table showing the amount of Data Centre space and power used by selected Pan
European Data Centre providers Figure 7: A table showing selected new build Data Centre costs in Euros Figure 8: A table showing the increase in raised floor space by Country from the end of 2012 to
mid-2015 in square metres
Figure 9: A pie chart showing the increase in Data Centre raised floor space by Country from 2012 to 2015 in square metres
Figure 10: A table showing Carrier Neutral Data Centre new space announcements since 2012
Figure 11: A table showing selected Carrier Based Data Centre new space announcements
Figure 12: A table showing the development cost in Euro per square metres for selected Data Centre facilities
Figure 13: A table showing the average industrial electricity costs per kWh in Euro per Country

Data Centre Pricing in Europe 2015 to 2020 Chapter 1
AUSTRIA Figure 14: A pie chart showing the breakdown of the 3 Data Centre types by floor space as a
percentage (2015) Figure 15: A table showing average price per kW bundles per rack Figure 16: A chart showing average pricing per kW bundle per rack Figure 17: A chart showing Austrian Data Centre raised floor space and customer power growth in
square metres – 2015 to 2020 Figure 18: A chart showing average Austrian per rack and square metre pricing in Euro per month –
2015 to 2020 Figure 19: A chart showing average Austrian pricing per kW Euro per month – 2015 to 2020
BELGIUM Figure 20: A pie chart showing the breakdown of the 3 Data Centre types by floor space as a
percentage (2015) Figure 21: A table showing average price per kW bundles per rack Figure 22: A chart showing average pricing per kW bundle per rack Figure 23: A chart showing Belgian Data Centre raised floor space and customer power growth in
square metres – 2015 to 2020 Figure 24: A chart showing average Belgian per rack and square metre pricing in Euro per month –
2015 to 2020 Figure 25: A chart showing average Belgian pricing per kW Euro per month – 2015 to 2020
CZECH REPUBLIC Figure 26: A pie chart showing the breakdown of the 3 Data Centre types by floor space as a
percentage (2015) Figure 27: A table showing average price per kW bundles per rack Figure 28: A chart showing average pricing per kW bundle per rack Figure 29: A chart showing Czech Republic Data Centre raised floor space and customer power
growth in square metres – 2015 to 2020 Figure 30: A chart showing average Czech Republic per rack and square metre pricing in Euro per
month – 2015 to 2020 Figure 31: A chart showing average Czech Republic pricing per kW Euro per month – 2015 to 2020
DENMARK Figure 32: A pie chart showing the breakdown of the 3 Data Centre types by floor space as a
percentage (2015) Figure 33: A table showing average price per kW bundles per rack Figure 34: A chart showing average pricing per kW bundle per rack Figure 35: A chart showing Danish Data Centre raised floor space and customer power growth in
square metres – 2015 to 2020 Figure 36: A chart showing average Danish per rack and square metre pricing in Euro per month –
2015 to 2020 Figure 37: A chart showing average Danish pricing per kW Euro per month – 2015 to 2020
FINLAND Figure 38: A pie chart showing the breakdown of the 3 Data Centre types by floor space as a
percentage (2015) Figure 39: A table showing average price per kW bundles per rack Figure 40: A chart showing average pricing per kW bundle per rack Figure 41: A chart showing Finnish Data Centre raised floor space and customer power growth in
square metres – 2015 to 2020 Figure 42: A chart showing average Finnish per rack and square metre pricing in Euro per month –
2015 to 2020 Figure 43: A chart showing average Finnish pricing per kW Euro per month – 2015 to 2020

Data Centre Pricing in Europe 2015 to 2020 Chapter 1
FRANCE Figure 44: A pie chart showing the breakdown of the 3 Data Centre types by floor space as a
percentage (2015) Figure 45: A chart showing the difference in average rack space pricing in the Paris area and outside
Paris in Euro per month Figure 46: A table showing average price per kW bundles per rack Figure 47: A chart showing average pricing per kW bundle per rack Figure 48: A chart showing the breakdown of customer power and raised floor space in the Paris
and non Paris areas Figure 49: A chart showing French Data Centre raised floor space and customer power growth in
square metres – 2015 to 2020 Figure 50: A chart showing average French per rack and square metre pricing in Euro per month –
2015 to 2020 Figure 51: A chart showing average French pricing per kW Euro per month – 2015 to 2020
GERMANY Figure 52: A pie chart showing the breakdown of the 3 Data Centre types by floor space as a
percentage (2015) Figure 53: A chart showing the average rack space pricing in Frankfurt versus the rest of Germany in
Euro per month Figure 54: A table showing average price per kW bundles per rack Figure 55: A chart showing average pricing per kW bundle per rack Figure 56: A chart showing the breakdown of total Data Centre customer power and raised floor
space between Frankfurt and the rest of Germany Figure 57: A chart showing German Data Centre raised floor space and customer power growth in
square metres – 2015 to 2020 Figure 58: A chart showing average German per rack and square metre pricing in Euro per month –
2015 to 2020 Figure 59: A chart showing average German pricing per kW Euro per month – 2015 to 2020
GREECE Figure 60: A pie chart showing the breakdown of the 3 Data Centre types by floor space as a
percentage (2015) Figure 61: A table showing average price per kW bundles per rack Figure 62: A chart showing average pricing per kW bundle per rack Figure 63: A chart showing Greek Data Centre raised floor space and customer power growth in
square metres – 2015 to 2020 Figure 64: A chart showing average Greek per rack and square metre pricing in Euro per month –
2015 to 2020 Figure 65: A chart showing average Greek pricing per kW Euro per month – 2015 to 2020
HUNGARY Figure 66: A pie chart showing the breakdown of the 3 Data Centre types by floor space as a
percentage (2015) Figure 67: A table showing average price per kW bundles per rack Figure 68: A chart showing average pricing per kW bundle per rack Figure 69: A chart showing Hungarian Data Centre raised floor space and customer power growth
in square metres – 2015 to 2020 Figure 70: A chart showing average Hungarian per rack and square metre pricing in Euro per month
– 2015 to 2020 Figure 71: A chart showing average Hungarian pricing per kW Euro per month – 2015 to 2020

Data Centre Pricing in Europe 2015 to 2020 Chapter 1
ICELAND Figure 72: A pie chart showing the breakdown of the 3 Data Centre types by floor space as a
percentage (2015) Figure 73: A table showing average price per kW bundles per rack Figure 74: A chart showing average pricing per kW bundle per rack Figure 75: A chart showing Icelandic Data Centre raised floor space and customer power growth in
square metres – 2015 to 2020 Figure 76: A chart showing average Icelandic per rack and square metre pricing in Euro per month –
2015 to 2020 Figure 77: A chart showing average Icelandic pricing per kW Euro per month – 2015 to 2020
IRELAND Figure 78: A pie chart showing the breakdown of the 3 Data Centre types by floor space as a
percentage (2015) Figure 79: A table showing average price per kW bundles per rack Figure 80: A chart showing average pricing per kW bundle per rack Figure 81: A chart showing Irish Data Centre raised floor space and customer power growth in
square metres – 2015 to 2020 Figure 82: A chart showing average Irish per rack and square metre pricing in Euro per month –
2015 to 2020 Figure 83: A chart showing average Irish pricing per kW Euro per month – 2015 to 2020
ITALY Figure 84: A pie chart showing the breakdown of the 3 Data Centre types by floor space as a
percentage (2015) Figure 85: A table showing average price per kW bundles per rack Figure 86: A chart showing average pricing per kW bundle per rack Figure 87: A chart showing Italian Data Centre raised floor space and customer power growth in
square metres – 2015 to 2020 Figure 88: A chart showing average Italian per rack and square metre pricing in Euro per month –
2015 to 2020 Figure 89: A chart showing average Italian pricing per kW Euro per month – 2015 to 2020
LUXEMBOURG Figure 90: A pie chart showing the breakdown of the 3 Data Centre types by floor space as a
percentage (2015) Figure 91: A table showing average price per kW bundles per rack Figure 92: A chart showing average pricing per kW bundle per rack Figure 93: A chart showing Luxembourg Data Centre raised floor space and customer power growth
in square metres – 2015 to 2020 Figure 94: A chart showing average Luxembourg per rack and square metre pricing in Euro per
month – 2015 to 2020 Figure 95: A chart showing average Luxembourg pricing per kW Euro per month – 2015 to 2020
NETHERLANDS Figure 96: A pie chart showing the breakdown of the 3 Data Centre types by floor space as a
percentage (2015) Figure 97: A table showing average price per kW bundles per rack Figure 98: A chart showing average pricing per kW bundle per rack Figure 99: A chart showing Dutch Data Centre raised floor space and customer power growth in
square metres – 2015 to 2020 Figure 100: A chart showing average Dutch per rack and square metre pricing in Euro per month –
2015 to 2020 Figure 101: A chart showing average Dutch pricing per kW Euro per month – 2015 to 2020

Data Centre Pricing in Europe 2015 to 2020 Chapter 1
NORWAY Figure 102: A pie chart showing the breakdown of the 3 Data Centre types by floor space as a
percentage (2015) Figure 103: A table showing average price per kW bundles per rack Figure 104: A chart showing average pricing per kW bundle per rack Figure 105: A chart showing Norwegian Data Centre raised floor space and customer power growth
in square metres – 2015 to 2020 Figure 106: A chart showing average Norwegian per rack and square metre pricing in Euro per month
– 2015 to 2020 Figure 107: A chart showing average Norwegian pricing per kW Euro per month – 2015 to 2020
POLAND Figure 108: A pie chart showing the breakdown of the 3 Data Centre types by floor space as a
percentage (2015) Figure 109: A table showing average price per kW bundles per rack Figure 110: A chart showing average pricing per kW bundle per rack Figure 111: A chart showing Polish Data Centre raised floor space and customer power growth in
square metres – 2015 to 2020 Figure 112: A chart showing average Polish per rack and square metre pricing in Euro per month –
2015 to 2020 Figure 113: A chart showing average Polish pricing per kW Euro per month – 2015 to 2020
PORTUGAL Figure 114: A pie chart showing the breakdown of the 3 Data Centre types by floor space as a
percentage (2015) Figure 115: A table showing average price per kW bundles per rack Figure 116: A chart showing average pricing per kW bundle per rack Figure 117: A chart showing Portuguese Data Centre raised floor space and customer power growth
in square metres – 2015 to 2020 Figure 118: A chart showing average Portuguese per rack and square metre pricing in Euro per
month – 2015 to 2020 Figure 119: A chart showing average Portuguese pricing per kW Euro per month – 2015 to 2020
ROMANIA Figure 120: A pie chart showing the breakdown of the 3 Data Centre types by floor space as a
percentage (2015) Figure 121: A table showing average price per kW bundles per rack Figure 122: A chart showing average pricing per kW bundle per rack Figure 123: A chart showing Romanian Data Centre raised floor space and customer power growth in
square metres – 2015 to 2020 Figure 124: A chart showing average Romanian per rack and square metre pricing in Euro per month
– 2015 to 2020 Figure 125: A chart showing average Romanian pricing per kW Euro per month – 2015 to 2020
SLOVAKIA Figure 126: A pie chart showing the breakdown of the 3 Data Centre types by floor space as a
percentage (2015) Figure 127: A table showing average price per kW bundles per rack Figure 128: A chart showing average pricing per kW bundle per rack Figure 129: A chart showing Slovakian Data Centre raised floor space and customer power growth in
square metres – 2015 to 2020 Figure 130: A chart showing average Slovakian per rack and square metre pricing in Euro per month
– 2015 to 2020 Figure 131: A chart showing average Slovakian pricing per kW Euro per month – 2015 to 2020
Data Centre Pricing in Europe 2015 to 2020 Chapter 1
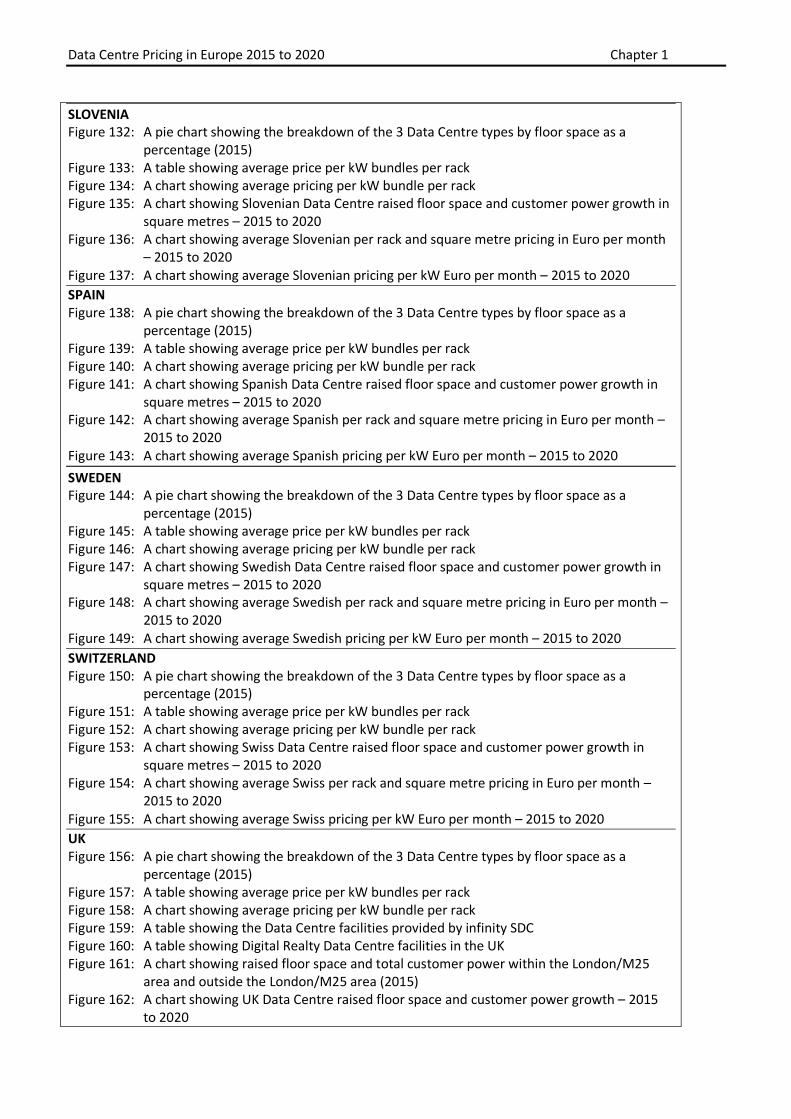
SLOVENIA Figure 132: A pie chart showing the breakdown of the 3 Data Centre types by floor space as a
percentage (2015) Figure 133: A table showing average price per kW bundles per rack Figure 134: A chart showing average pricing per kW bundle per rack Figure 135: A chart showing Slovenian Data Centre raised floor space and customer power growth in
square metres – 2015 to 2020 Figure 136: A chart showing average Slovenian per rack and square metre pricing in Euro per month
– 2015 to 2020 Figure 137: A chart showing average Slovenian pricing per kW Euro per month – 2015 to 2020
SPAIN Figure 138: A pie chart showing the breakdown of the 3 Data Centre types by floor space as a
percentage (2015) Figure 139: A table showing average price per kW bundles per rack Figure 140: A chart showing average pricing per kW bundle per rack Figure 141: A chart showing Spanish Data Centre raised floor space and customer power growth in
square metres – 2015 to 2020 Figure 142: A chart showing average Spanish per rack and square metre pricing in Euro per month –
2015 to 2020 Figure 143: A chart showing average Spanish pricing per kW Euro per month – 2015 to 2020
SWEDEN Figure 144: A pie chart showing the breakdown of the 3 Data Centre types by floor space as a
percentage (2015) Figure 145: A table showing average price per kW bundles per rack Figure 146: A chart showing average pricing per kW bundle per rack Figure 147: A chart showing Swedish Data Centre raised floor space and customer power growth in
square metres – 2015 to 2020 Figure 148: A chart showing average Swedish per rack and square metre pricing in Euro per month –
2015 to 2020 Figure 149: A chart showing average Swedish pricing per kW Euro per month – 2015 to 2020
SWITZERLAND Figure 150: A pie chart showing the breakdown of the 3 Data Centre types by floor space as a
percentage (2015) Figure 151: A table showing average price per kW bundles per rack Figure 152: A chart showing average pricing per kW bundle per rack Figure 153: A chart showing Swiss Data Centre raised floor space and customer power growth in
square metres – 2015 to 2020 Figure 154: A chart showing average Swiss per rack and square metre pricing in Euro per month –
2015 to 2020 Figure 155: A chart showing average Swiss pricing per kW Euro per month – 2015 to 2020
UK Figure 156: A pie chart showing the breakdown of the 3 Data Centre types by floor space as a
percentage (2015) Figure 157: A table showing average price per kW bundles per rack Figure 158: A chart showing average pricing per kW bundle per rack Figure 159: A table showing the Data Centre facilities provided by infinity SDC Figure 160: A table showing Digital Realty Data Centre facilities in the UK Figure 161: A chart showing raised floor space and total customer power within the London/M25
area and outside the London/M25 area (2015) Figure 162: A chart showing UK Data Centre raised floor space and customer power growth – 2015
to 2020
Data Centre Pricing in Europe 2015 to 2020 Chapter 1
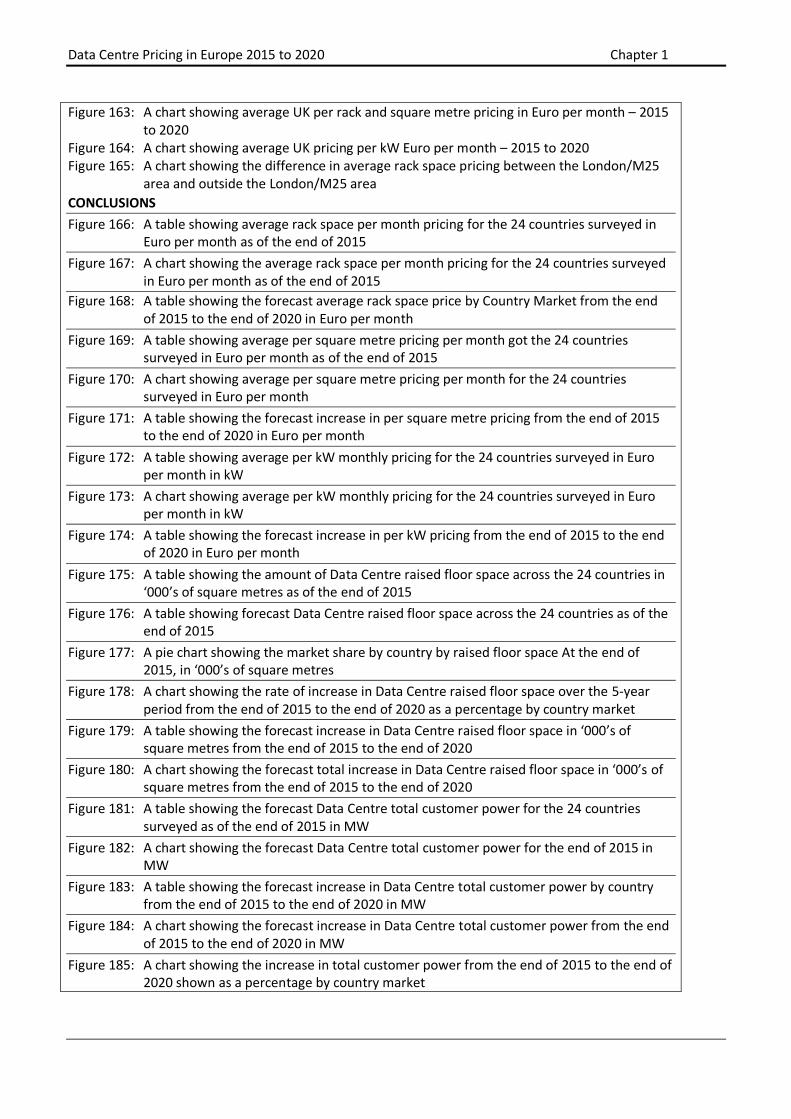
Figure 163: A chart showing average UK per rack and square metre pricing in Euro per month – 2015 to 2020
Figure 164: A chart showing average UK pricing per kW Euro per month – 2015 to 2020 Figure 165: A chart showing the difference in average rack space pricing between the London/M25
area and outside the London/M25 area
CONCLUSIONS
Figure 166: A table showing average rack space per month pricing for the 24 countries surveyed in Euro per month as of the end of 2015
Figure 167: A chart showing the average rack space per month pricing for the 24 countries surveyed in Euro per month as of the end of 2015
Figure 168: A table showing the forecast average rack space price by Country Market from the end of 2015 to the end of 2020 in Euro per month
Figure 169: A table showing average per square metre pricing per month got the 24 countries surveyed in Euro per month as of the end of 2015
Figure 170: A chart showing average per square metre pricing per month for the 24 countries surveyed in Euro per month
Figure 171: A table showing the forecast increase in per square metre pricing from the end of 2015 to the end of 2020 in Euro per month
Figure 172: A table showing average per kW monthly pricing for the 24 countries surveyed in Euro per month in kW
Figure 173: A chart showing average per kW monthly pricing for the 24 countries surveyed in Euro per month in kW
Figure 174: A table showing the forecast increase in per kW pricing from the end of 2015 to the end of 2020 in Euro per month
Figure 175: A table showing the amount of Data Centre raised floor space across the 24 countries in ‘000’s of square metres as of the end of 2015
Figure 176: A table showing forecast Data Centre raised floor space across the 24 countries as of the end of 2015
Figure 177: A pie chart showing the market share by country by raised floor space At the end of 2015, in ‘000’s of square metres
Figure 178: A chart showing the rate of increase in Data Centre raised floor space over the 5-year period from the end of 2015 to the end of 2020 as a percentage by country market
Figure 179: A table showing the forecast increase in Data Centre raised floor space in ‘000’s of square metres from the end of 2015 to the end of 2020
Figure 180: A chart showing the forecast total increase in Data Centre raised floor space in ‘000’s of square metres from the end of 2015 to the end of 2020
Figure 181: A table showing the forecast Data Centre total customer power for the 24 countries surveyed as of the end of 2015 in MW
Figure 182: A chart showing the forecast Data Centre total customer power for the end of 2015 in MW
Figure 183: A table showing the forecast increase in Data Centre total customer power by country from the end of 2015 to the end of 2020 in MW
Figure 184: A chart showing the forecast increase in Data Centre total customer power from the end of 2015 to the end of 2020 in MW
Figure 185: A chart showing the increase in total customer power from the end of 2015 to the end of 2020 shown as a percentage by country market
Data Centre Pricing in Europe 2015 to 2020 Chapter 1
Methodology
Background to the Data Centre Pricing in Europe report
The aim of the latest Data Centre Pricing in Europe – 2015 to 2020 - report is to provide a comprehensive overview of Data Centre pricing across Europe from more than 750 Data Centre Providers in 24 key European countries. Country Markets covered by the report include the following:
Austria, Belgium, Czech Republic, Denmark, Finland, France, Germany, Greece, Hungary, Iceland, Ireland, Italy, Luxembourg, Netherlands, Norway, Poland, Portugal, Romania, Slovakia, Slovenia, Spain, Sweden, Switzerland and the UK.
A full list of the Data Centre operators included in this report is provided in Appendix One.
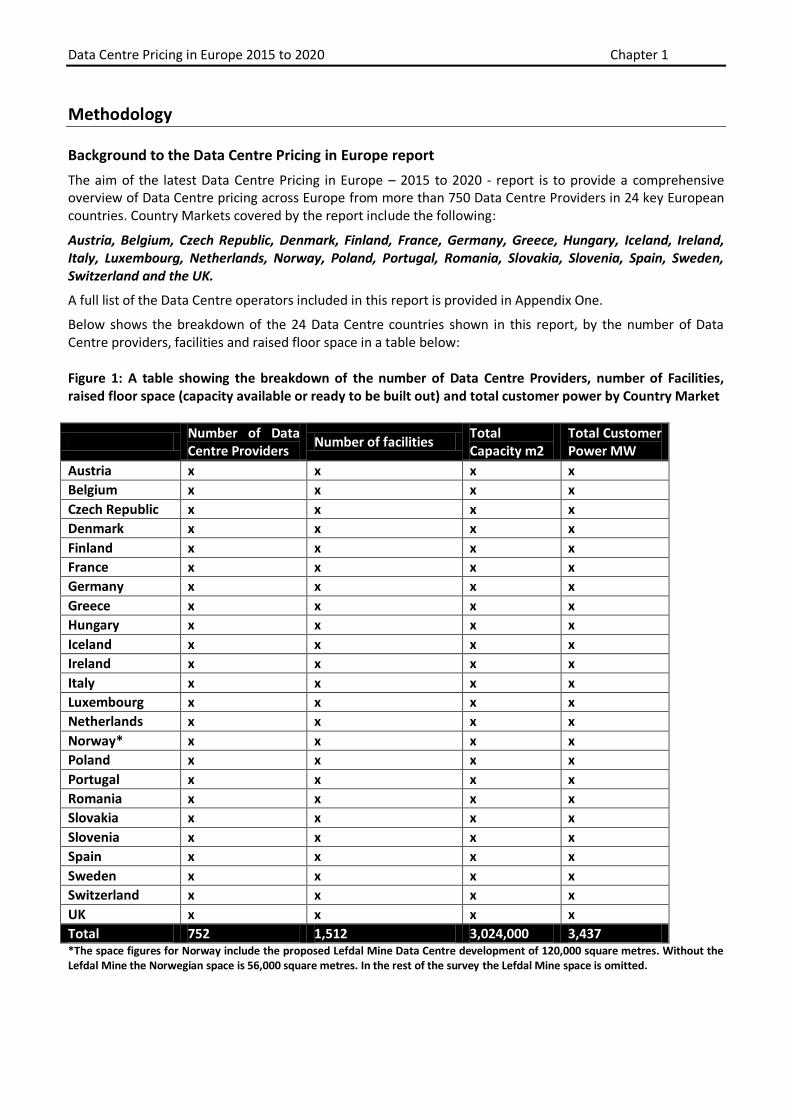
Below shows the breakdown of the 24 Data Centre countries shown in this report, by the number of Data Centre providers, facilities and raised floor space in a table below: Figure 1: A table showing the breakdown of the number of Data Centre Providers, number of Facilities, raised floor space (capacity available or ready to be built out) and total customer power by Country Market
Number of Data Centre Providers
Number of facilities Total Capacity m2
Total Customer Power MW
Austria x x x x
Belgium x x x x
Czech Republic x x x x
Denmark x x x x
Finland x x x x
France x x x x
Germany x x x x
Greece x x x x
Hungary x x x x
Iceland x x x x
Ireland x x x x
Italy x x x x
Luxembourg x x x x
Netherlands x x x x
Norway* x x x x
Poland x x x x
Portugal x x x x
Romania x x x x
Slovakia x x x x
Slovenia x x x x
Spain x x x x
Sweden x x x x
Switzerland x x x x
UK x x x x
Total 752 1,512 3,024,000 3,437 *The space figures for Norway include the proposed Lefdal Mine Data Centre development of 120,000 square metres. Without the Lefdal Mine the Norwegian space is 56,000 square metres. In the rest of the survey the Lefdal Mine space is omitted.
Data Centre Pricing in Europe 2015 to 2020 Chapter 1
This report is based on a survey of more than 750 Data Centre providers and over 1,500 Data Centre facilities across the 24 Country Markets. The largest Country Market remains the UK, followed by Germany, France and the Netherlands – these four markets dominate the 24 Country Markets in the survey, accounting for half of space and power. The report writer is able to use a wide range of information sources as well as via their own contacts in their extensive database. The 2015 to 2020 report differs from the previous 2013 report as it has been comprehensively updated with an extended 5-year forecast from the end of 2015 to the end of 2020. The new report includes Data Centres in Iceland for the first time and places more emphasis on Data Centre power (MW) as well as space, with a forecast for pricing per kW as well as standard rack space and per square metre pricing. The new report incorporates some of the findings from the recent individual Data Centre Country Market reports made by the report writer for France, Germany, Netherlands and the UK as well as their other European publications. The new report also includes the following updates –
The main identified customer sectors driving Data Centre demand
Existing revenue growth per occupied square metre of space
Data Centre gross profit margin trend over time Where possible the report seeks to identify the gross profit margin and the scope for Data Centre providers to continue to increase their pricing. It attempts to identify the amount of pricing power that is held by the Data Centre provider. It also considers Data Centre Capex expenditure measured by cash-flow – as a means of identifying the cost of investment in new facility upgrades. The main information on these financial trends is provided by publicly quoted Data Centre specialists (including Equinix, Interxion and TelecityGroup). By considering trends in the gross profit margin, the report writer attempts to assess whether Data Centre providers are able to extend their pricing power to increase profitability. It also provides more detailed analysis of trends that impact the Data Centre in Europe including the emergence of Cloud computing, SaaS (Software as a Service) and Managed Services. The report considers the main trends impacting both the Carrier Based Data Centre segment as well as the Carrier Neutral Data Centre segment.
Definitions used in the Data Centre Pricing in Europe report It should be noted that for the purposes of this report that the Carrier Neutral Data Centre can be defined as being an independent company with no shareholding by a telecoms operator and also have at least 3 separate network providers available for customer use. By contrast the Carrier Based Data Centre is normally owned by a telecoms operator and typically provides network services based on its own telecoms infrastructure with perhaps one other network supplier. The report does not include Data Centres used purely by the enterprise user as an “in-house” facility. Its focus is on the Carrier Neutral or Carrier Based Data Centre segment. However, the report does identify the range of business models that are being used by the various Data Centre operators in Europe – including Co Location, Hosting, Wholesale and Enterprise models.

Data Centre Pricing in Europe 2015 to 2020 Chapter 1
Details of the Data Centre Pricing in Europe report The report was written over the 5 month period from March 2015 to July 2015. In this report all currencies used are converted into Euro at the rate shown by Bloomberg as of the 20th of March 2015. The full exchange rate conversion is shown in the table in Figure 1 below: Figure 2: A table showing the currency exchange rates that are used in this report
Country Currency Abbreviation 1 Euro
conversion
Czech Republic Czech Koruna CZK 27.4
Denmark Danish Krone DKK 7.5
Hungary Hungarian Forint HUF 303
Iceland Iceland Krona ISK 149
Norway Norwegian Krone NOK 8.7
Poland Polish Zloty PLN 4.1
Romania Romanian Leu ROL 4.4
Sweden Swedish Krona SEK 9.3
Switzerland Swiss Franc CHF 1.06
UK British Pound GBP 0.72
USA US Dollar USD 1.08
Source: www.Bloomberg.com (as of March 20th 2015).
Throughout this report space is reported in square metres (metre 2). Where applicable space was converted from square feet into square metres using the formula of 10 square feet = 0.929 square metres.
Data Sources used in the Data Centre in Europe report It should be noted that the report was produced using a mixture of desk research and primary research. Most of the pricing contained in the report comes from over 750 separate Data Centre providers from the report writer’s updated database, with the remainder from public sources including company annual report and accounts. It should be noted that although there are over 750 Data Centre providers included in the research, the actual number of facilities is considerably higher as several providers have multiple facilities with pricing that is often facility-specific. The report writer estimates that there are over 1,500 Data Centre facilities identified across the 24 European markets. The primary research also included interviews with key Data Centre providers and users and the use of a questionnaire to provide feedback on pricing and space forecast and trends. The questionnaire was then followed up by a direct contact or telephone interview to elicit further information such as power pricing, utilisation and revenue trends. As the pricing information provided is frequently commercially sensitive – and can be subject to an NDA – the report writer is not able to disclose individual pricing per provider unless the information is already in the public domain. Where the price information given is already available in the public domain – in some cases for example it is published on the Data Centre provider’s website – then the report writer does disclose the pricing in the report.
Data Centre Pricing in Europe 2015 to 2020 Chapter 1
The report writer provides per rack pricing based on a standard 19” rack, in general with 42 U capacity typically with a 16 A single phase power supply included. Power usage is not included. The report writer provides per rack pricing bundled with a number of different per kW rates, which are provided by the Data Centre operators. To calculate the price market averages the report writer received pricing directly from the service provider which was then used to generate an average per rack or per square metre price (in Euro per square metre). In some cases the report writer had to convert the rack or cabinet metric to arrive at a per square metre revenue using a conversion rate of 1 rack = to 2.5 square metres. It should be noted that all of the Data Centre pricing – and pricing for power - included in the report does not include VAT (or any other tax). Also, installation costs are mentioned in the first chapter of the report and are not included in the country by country survey as there is no significant variance by country. Additionally the Data Centre pricing received for this report may not reflect the full commercial rate that may be payable following negotiation. Also, other discounts are available depending on payment options. To give an extreme example, a Romanian Data Centre provider currently offers a 15 per cent discount off the monthly rack space price if a user pays 6 months in advance and a 30 per cent discount if the user pays 12 months in advance. Other sources include Eurostat (the EC statistics service), which provides industrial electricity pricing across the EU-27 countries. For Switzerland, which is covered by Eurostat, the report writer received industrial electricity pricing from the Swiss Federal Statistical Office.
Innovations for the 2015 edition of the Data Centre Pricing in Europe report For the 2015 edition of this research, the report writer contains a number of new innovations which are listed below: First, the report writer provides a breakdown of pricing according to the different power that is consumed – with per rack averages per country calculated from 1 kW, 2 kW, 4 kW and 6 kW bundles as well as an overall average. In the report the kiloWatt (kW) metric is used as the standard metric to describe the power bundles that are available. Second, the report writer has attempted to provide more details of Data Centre pricing according to the specification of each facility using a common industry metric. The Uptime Institute has developed a metric, which has become the standard method for grading the Data Centre according to specification. Data Centres are classified from grades Tier 1 to Tier 3 under the scheme. This report seeks to use the Uptime Institute grading (Tier 3) as a means of differentiating between the different types of Data Centre available in each country. But although Data Centre providers generally claim a Tier 3 standard for most of their facilities - the standard has not been recognised by the Uptime Institute. For the purposes of this survey the Premium Data Centre is defined as being at least a Tier 3 grade facility. It should be noted that the Tier 3 grade Data Centre is stated by the operator itself and has not been verified independently. In practice, only a small minority of Data Centre facilities have been officially certified by the UpTime Institute, so the report writer defines a wider segment for the Premium Data Centre in this report as being:

Data Centre Pricing in Europe 2015 to 2020 Chapter 1
“A high specification Data Centre facility, which is capable of supporting power per rack of 20 kW as standard, or up to 8 kW per square metre”
In practice there are some facilities that are catering for large bundles of power, which are not Premium Data Centres. For example, a colocation provider with underutilized space, may offer a large bundle of power by spreading the cabinets across a wider area of space, or may use a cabinet with built in supplementary water cooling. The report writer does not include these facilities in the Premium Data Centre segment. The report writer tracks whether there is a correlation between the price in Euro per square metre of a facility and the specification that is available. In most cases the report writer would expect the high specification facilities to command a higher market price – but this is not always the case. Data Centre pricing is heavily influenced by local demand and supply factors which results in selected Data Centres in favourable geographical locations, even with low power, being able to charge premium pricing. In some countries, such as the Netherlands, Premium Data Centres do not have premium pricing, due to competition between similar high specification facilities. Increasingly Data Centres are being designed as “Flexible Data Centres”, with multiple Data halls that can cater for different tier grades, resilience and SLAs to accommodate different customers with different price points. One of the key trends is the blurring of the traditional distinction between standard Carrier Neutral and Premium Data Centre facilities, as new facilities are being built to cater for a range of different power and tier requirements. Some Carrier Based Data Centre facilities are also being positioned as Carrier Neutral facilities, with providers such as Colt Telecom and Level 3 claiming that they are carrier neutral, accepting connectivity from a range of telecoms providers, not just their own network service. The survey provides average pricing per facility type (Carrier Based, Carrier Neutral and Premium Data Centres) and a single overall market average price irrespective of facility type. Providers can gain an understanding of the average market price in each country as well as the average pricing that is available in each market for a given bundle of space and power.
Scope of the Data Centre Pricing in Europe report The report is based on a “bottom up” survey of each of the 24 Data Centre country markets in Europe. For each of the 24 countries surveyed, the country section of the report provides analysis of the following Data Centre issues -
- Key Data Centre statistics for each country which include the following statistics (as of the end of 2015) -
o The number of Data Centre providers and facilities o The estimated total raised floor space (technical space) in square metres o The average utilisation of space (per cent) o Average price per standard 19” rack (Euro per month) o Average price per square metre (Euro per month) o Average price per kW (Euro per month) o The range of pricing per kW and also the average bundle price – from 1 kW up to 6 kW per
country (Euro per month)

Data Centre Pricing in Europe 2015 to 2020 Chapter 1
Pricing for rack space, per square metre and per kW (in Euro per month) is also shown in the major Country Markets of the UK, Germany, France and the Netherlands as a weighted average, distinguishing between the largest Data Centre providers from the large number of small Data Centre providers. As part of each country survey, the following information is included-
- A list of the key Data Centre players for each country - The key Premium Data Centres available per country (based on a claimed Tier 3 standard) - The availability of high density or Premium Data Centre facilities for each country - Pricing for power for each country (including price per rack with kW bundles) - The Data Centre Business Models that are pursued for each country - A 5 year forecast for total Data Centre space for each country (from the end of 2015 to the end of
2020) - A 5 year forecast for total Data Centre Customer Power for each country (from the end of 2015 to the
end of 2020) - A 5 year forecast for standard rack space pricing per month for each country (from the end of 2015 to
the end of 2020) – without power - A 5 year forecast for pricing per square metre per month for each country (from the end of 2015 to
the end of 2020) - A 5 year forecast for pricing per kW per month for each country (from the end of 2015 to the end of
2020) - A list of assumptions behind the 5 year space and revenue forecast made for each country - The main trends identified per Country Market
For the capacity and customer power forecasts, the report writer includes capacity or power that is either already built out, or which can be activated to cater for customer use.
Finally, the conclusions section of the report also provides an overview of the main pricing trends taking place across the 24 European countries included in this report – with charts showing the main capacity and price increases or decreases by country – and a ranking of the highest to the lowest per rack and per square metre pricing.
.
Chapter One: The Data Centre Landscape in Europe as of the end of 2015
Introduction
Below the report writer evaluates the Data Centre Landscape in Europe as of the end of 2015, including the main price trends that are taking place in the European Data Centre market. The core products that are provided by the Carrier Neutral Data Centre in Europe include space – from racks to suites – and Co Location services. Selected specialised Data Centre operators (including Interxion and Equinix) are broadening their existing product range to offer proximity hosting services – and provide co location and low latency connectivity (via third parties) to content, trading and exchange providers. Although the largest Data Centre providers (such as Equinix, Interxion and TelecityGroup) are providing cloud connectivity services to broaden their product portfolio, at least 80 per cent of their revenues remain dependent on colocation and housing. Other Carrier Based Data Centres provide a range of managed services, network services and SaaS (Software as a Service) and Cloud services. The Carrier Based Data Centre is having a new lease of life as it becoming the centre for network-based services based on Cloud Computing.
Data Centre Pricing in Europe 2015 to 2020 Chapter 1
The report writer examines the main core products that are available in the European Data Centre in turn below and comments on the main pricing trends.
Price trends per rack
Pricing per rack is based on a monthly rental charge plus a once-off set up charge. The cost of the set up charge varies by provider, but the average set-up cost is typically around 1.5 times the monthly rental charge. In some cases Data Centre providers are abolishing once-off installation charges per rack, with Colt and Verizon waiving installation charges as part of a promotional campaign for rack space. Pricing per standard 19” rack is gradually increasing over time throughout Europe. This reflects the finite amount of capacity that is available and a steady increase in the demand for space. But although the trend is for price inflation in all markets over time – as providers gradually raise pricing – typically conducting a price review on an annual basis, the average price per facility is impacted by a number of factors which can reduce the overall market average. The average Data Centre price can decline in each country market due to the following factors:
1. The introduction of new facilities by local Data Centre providers - who can charge below the average market rate in each country with lower priced rates either for a promotion period or as a permanent feature as a new Data Centre cluster and ecosystem is established.
2. The introduction of large-scale “campus-style” facilities by providers - who then charge a discounted rate in order to fill space at a wholesale rate or offer promotional pricing. A new trend is for traditional wholesale Data Centres to offer smaller amounts of space, with Infinity SDC (UK) offering individual rack space (using a third party maintainer) as well as wholesale space.
3. The sale of existing Data Centre space at cost – typically by hosting or Co Location providers who
have spare space available, with pricing set at a marginal cost which also reduces the average market price (this trend is particularly evident in Italy for example). This can happen for older facilities which have had their original development cost written down, with the report writer finding older Data Centre stock that is being offered with high bundles of power as more space is available.
4. The introduction of new facilities which are based outside the main urban areas can also result in lower average pricing - this trend has been evident in France, where Data Centres based in Paris – of whatever standard – charge a price premium when compared with their regional counterparts in cities such as Nice, Brittany or Montpellier. It is also particularly a factor in the UK market, which is becoming less London-based, with space costing less outside the London area. New Data Centre facilities are being established in a range of UK cities including Croydon, Leicester, Birmingham, Leeds, Manchester and Norwich.
5.
6. The introduction of new campus-based facilities outside of the capital city - is also happening in the UK, where there has been rapid development of new Data Centre space since 2009 outside of the London M25 ring road area. The introduction of new regional Data Centre space has meant that new space is entering the market at a significant price discount to existing London-based Data Centre facilities, which has meant that the UK market average remains stable over time, with limited scope for price increases (when the currency fluctuations against the Euro are taken into account).

Data Centre Pricing in Europe 2015 to 2020 Appendix I
Below is an Appendix which lists the Data Centres that are included in the report by country:
Appendix I: A list of Data Centres that are included in this report by country The table below provides a list of Data Centres by country that are included in the report.
DATA CENTRE PROVIDER COUNTRY MARKET
A1 Data Centre Austria
Anexia Austria
Conova Austria
Datasix Austria
e-shelter Austria, Germany, Switzerland
EDIS Austria
HTCC Austria
Huemer Austria
Interoute Austria, Belgium, Czech Republic, France, Germany, Ireland, Italy, Netherlands, Spain, Sweden, Switzerland, UK
Interxion Austria, Belgium, Denmark, France, Germany, Ireland, Netherlands, Spain, Sweden, Switzerland, UK
IT and Tel Austria
Mediahaus Austria
NDC Nexus Austria
OBBtel Austria
RIZ IT Austria
Telia Austria, Denmark, Finland, Germany, Norway, Poland, Sweden
Verizon Austria, Belgium, France, Germany, Ireland, Netherlands, Norway, Poland, Spain, UK
VIX Austria
World4You Austria
Agility Cofey Belgium
Antwerp Data Centre Belgium
Belgacom Belgium
Brussels Data Centre Belgium
BT Belgium, France, Germany, Italy, Netherlands, Spain, UK
Cofely Belgium
COLT Telecom Belgium, Denmark, France, Germany, Italy, Spain, Sweden, Switzerland, UK
Datazone Belgium
DC Buroht Belgium
DC Ghent Belgium
DC Oostkamp Belgium
Foneco Datacenter Belgium
Hostbasket Belgium
Etc. ec

Data Centre Pricing in Europe 2015 to 2020 Appendix I
© All rights reserved. No part of this publication may be reproduced in any material form (including photocopying) or stored in any medium by electronic means and whether or not transiently or incidentally to some other use of this publication, without the written pr ior permission of Tariff Consultancy Ltd, the copyright owner. Application for the copyright owner’s permission to reproduce any part of this publication s hould be addressed to the report writer (details of the report writer will be supplied to all interested parties).
Every effort has been taken to ensure the accuracy and completeness of information presented in this report. However, the report writer cannot
accept liability for the consequences of action taken based on the information provided. Users of this report should confirm price, technical and other
details of any service facility with the supplier before entering into any contractual commitment. The report writer makes every effort to ensure that
the coverage included in this report is comprehensive, but it reserves the right to omit coverage of any item where the information is unobtainable for
any reason outside the report writer’s control.
REPORT PRICE:
GBP £1,995 for a single user licence
For all enquiries please contact Caroline Hitchins on +44 (0) 7544 121900 or [email protected]