data centre pricing netherlands 2014 to 2019 centre pricing... · data centre pricing netherlands...
TRANSCRIPT
DATA CENTRE PRICING
NETHERLANDS
2014 to 2019
Published: January 2014
To purchase this report please contact Caroline Hitchins on +44 (0) 7544 121900 or email [email protected]
No photocopying, recording or otherwise without prior written permission from Tariff Consultancy Ltd
Notice of Disclaimer
Every effort has been taken to ensure the accuracy and completeness of information presented in this newsfeed, and that they represent a true account of the events at
the time they were reported. However, Tariff Consultancy Ltd and its Associates cannot accept liability for the accuracy of any reports, nor for any consequences
whatsoever of action taken based on the information provided and nor should users of this newsfeed rely on materials contained herein as the sole basis for any
investment or any other commercial decision. Users of materials contained in this newsfeed should confirm price, technical and other details of any service facility with
the supplier before entering into any contractual commitment. This newsfeed does not constitute investment advice or guidance. Tariff Consultancy Ltd and its Associates
encourage users to cross-check news stories against other alternative sources and where appropriate to seek qualified professional advice. Tariff Consultancy Ltd and its
Associates make every effort to ensure that the coverage included in this report is comprehensive, but it reserves the right to omit coverage of any item where the
information is unobtainable for any reason outside Tariff Consultancy Ltd’s control.

Data Centre Pricing Netherlands – 2014 to 2019 Table of Contents
Section Heading Page No. A list of tables and charts used in the report 3 A list of Dutch Data Centre companies mentioned in the report 6 Executive Summary 7 The main highlights of the Data Centre Pricing Netherlands – 2014 to 2019 report 11 Introduction – Data Centre Pricing Netherlands – 2014 to 2019 report 14 Research Methodology 14 The main Data Centre segments identified in the report 14 The Data Centre tier certification used in the report 16 The Power Usage Effectiveness ratio used in the report 17 The Data Centre pricing used in the report 17 The other metrics used in the report 17 Chapter One – A market overview of the Data Centres in the Netherlands 18
Introduction 18
The landscape for Data Centres in the Netherlands 19
The key Dutch Data Centre players in the Netherlands 21
The Carrier Based Data Centres Segment in the Netherlands 27
The Carrier Neutral Data Centre Segment in the Netherlands 31
The Premium Data Centre Segment in the Netherlands 34
Key Point Summary 36
Chapter Two – Average pricing for Data Centres in the Netherlands 38 Introduction 38
Average rack space pricing for Dutch Data Centres 38
Installation charges 42
Administration charges 43
Netherlands Data Centre pricing per square metre 43
Selected Dutch Data Centre pricing for cage space 44
Selected Dutch Data Centre pricing for cross connect services 45
Typical Netherlands Data Centre pricing for power 45
Basic Dutch industrial power costs 46
Average customer power per Dutch Data Centre facility 47
Dutch Data Centre pricing per kW bundle per rack per month 48
Dutch Data Centre Watts per square metre pricing per month 49
Data Centre price trends in the Netherlands 50
Dutch Data Centre pricing for supplementary services 50
Average Data Centre pricing for the Netherlands – a forecast from end 2014 to end 2019 51
Key Point Summary 52
Chapter Three – The key future developments in the Dutch Data Centre market 54
Introduction 54
The key statistics in the Dutch Data Centre market 54
The key new Data Centre developments in the Netherlands 54
A forecast for Dutch Data Centre raised floor space from end of 2014 to the end of 2019 57
A forecast for average Dutch Data Centre revenues from the end of 2014 to end of 2019 58
A forecast for average Dutch Data Centre rack space pricing from end 2014 to end 2019 59
A forecast for average Dutch Data Centre pricing per kW from end of ‘14 to end of ‘19 61
The key price trends in the Dutch Data Centre market 62
Key Point Summary 62
Chapter Four – Conclusions to the Data Centre Pricing Netherlands – 2014 to 2019 62
Copyright Tariff Consultancy Ltd 2014 1

Data Centre Pricing Netherlands – 2014 to 2019 Table of Contents
A list of tables and charts used in the report
Figure 1: A chart showing the forecast raised floor space growth in the Dutch Data Centre segments
from the end of 2014 to the end of 2019 - in square metres
Figure 2: A table showing the forecast raised floor space growth in the Dutch Data Centre segments from the end of 2014 to the end of 2019 - in square metres
Figure 3: A chart showing the forecast average increase in Dutch raised floor space per Data Centre
facility from the end of 2014 to the end of 2019: in square metres
Figure 4: A chart showing the forecast average increase in customer power per Dutch Data Centre
facility from the end of 2014 to the end of 2019: in MW
Figure 5: A pie chart showing the number of Dutch Data Centres by segment type as of the end of
2014 - in per cent
Figure 6: A pie chart showing the proportion of Dutch Data Centre raised floor space available by
segment type as of 2014 - in per cent
Figure 7: A chart showing the total forecast Dutch Data Centre raised floor space in square metres
compared with the other European markets as of the end of 2014 - including the UK, Germany & France
Figure 8: A table showing the forecast breakdown of the number of Data Centre facilities and raised
floor space within and outside the Amsterdam area as of the end of 2014 - in per cent
Figure 9: A pie chart showing the forecast breakdown of Dutch Data Centre raised floor space by
Dutch city as of the end of 2014: as of the end of 2014: in per cent
Figure 10: A table showing Equinix’s Data Centre presence in the Netherlands (square metres) Figure
11: A table showing Interxion’s Data Centre presence in the Netherlands (square metres) Figure 12:
A table showing TelecityGroup’s Data Centre presence in the Netherlands (square metres) Figure 13:
A table showing DRT’s Data Centre presence in the Netherlands (square metres)
Figure 14: A chart showing the forecast increase in Dutch Data Centre raised floor space from the end of 2014 to the end of 2019 - in square metres
Figure 15: A pie chart showing the forecast increase in Dutch Carrier Based Data Centre raised floor
space as a proportion of total Dutch Data Centre space as of the end of 2014 - in per cent
Figure 16: A chart showing the forecast increase in Dutch Carrier Based Data Centre raised floor space from the end of 2014 to the end of 2019 - in square metres
Figure 17: A chart showing average standard retail rack space pricing for the Dutch Pan European,
Carrier Neutral & Premium Data Centre segments: as of January 2014 - in Euro per month
Copyright Tariff Consultancy Ltd 2014 2
Data Centre Pricing Netherlands – 2014 to 2019 Table of Contents
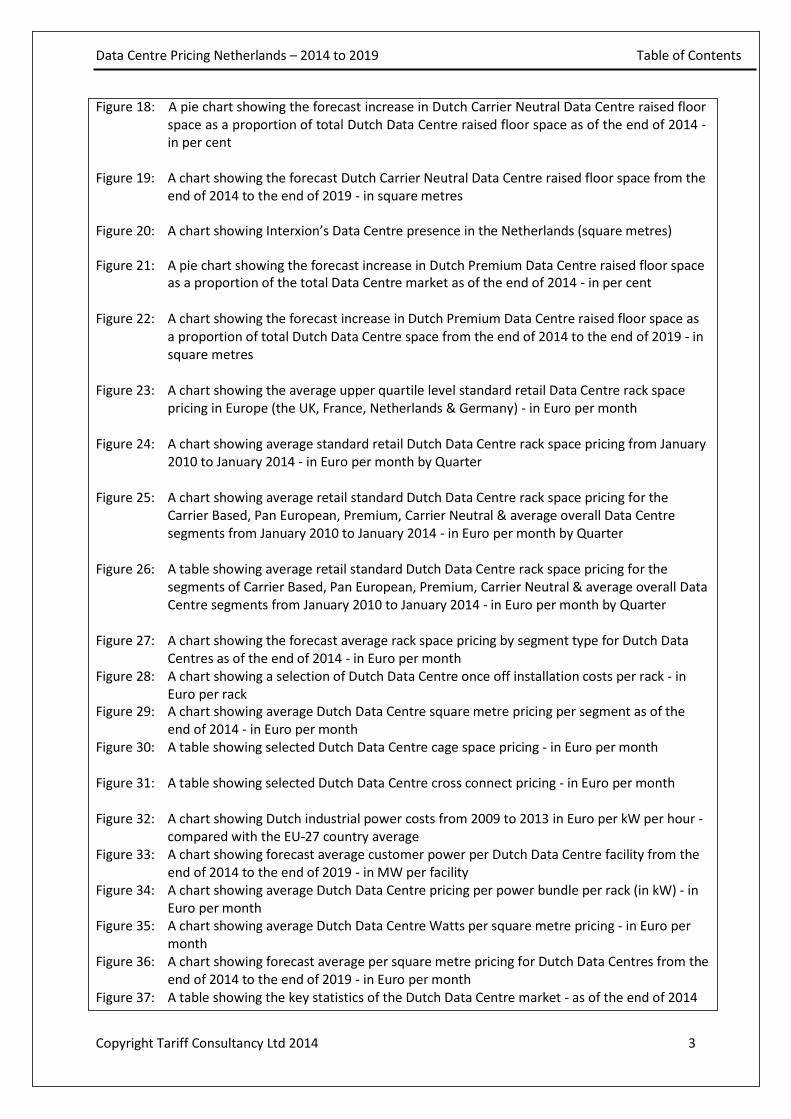
Figure 18: A pie chart showing the forecast increase in Dutch Carrier Neutral Data Centre raised floor space as a proportion of total Dutch Data Centre raised floor space as of the end of 2014 - in per cent
Figure 19: A chart showing the forecast Dutch Carrier Neutral Data Centre raised floor space from the
end of 2014 to the end of 2019 - in square metres
Figure 20: A chart showing Interxion’s Data Centre presence in the Netherlands (square metres)
Figure 21: A pie chart showing the forecast increase in Dutch Premium Data Centre raised floor space as a proportion of the total Data Centre market as of the end of 2014 - in per cent
Figure 22: A chart showing the forecast increase in Dutch Premium Data Centre raised floor space as
a proportion of total Dutch Data Centre space from the end of 2014 to the end of 2019 - in square metres
Figure 23: A chart showing the average upper quartile level standard retail Data Centre rack space
pricing in Europe (the UK, France, Netherlands & Germany) - in Euro per month
Figure 24: A chart showing average standard retail Dutch Data Centre rack space pricing from January
2010 to January 2014 - in Euro per month by Quarter
Figure 25: A chart showing average retail standard Dutch Data Centre rack space pricing for the
Carrier Based, Pan European, Premium, Carrier Neutral & average overall Data Centre segments from January 2010 to January 2014 - in Euro per month by Quarter
Figure 26: A table showing average retail standard Dutch Data Centre rack space pricing for the
segments of Carrier Based, Pan European, Premium, Carrier Neutral & average overall Data Centre segments from January 2010 to January 2014 - in Euro per month by Quarter
Figure 27: A chart showing the forecast average rack space pricing by segment type for Dutch Data
Centres as of the end of 2014 - in Euro per month Figure 28: A chart showing a selection of Dutch Data Centre once off installation costs per rack - in
Euro per rack Figure 29: A chart showing average Dutch Data Centre square metre pricing per segment as of the
end of 2014 - in Euro per month Figure 30: A table showing selected Dutch Data Centre cage space pricing - in Euro per month
Figure 31: A table showing selected Dutch Data Centre cross connect pricing - in Euro per month
Figure 32: A chart showing Dutch industrial power costs from 2009 to 2013 in Euro per kW per hour -
compared with the EU-27 country average Figure 33: A chart showing forecast average customer power per Dutch Data Centre facility from the
end of 2014 to the end of 2019 - in MW per facility Figure 34: A chart showing average Dutch Data Centre pricing per power bundle per rack (in kW) - in
Euro per month Figure 35: A chart showing average Dutch Data Centre Watts per square metre pricing - in Euro per
month Figure 36: A chart showing forecast average per square metre pricing for Dutch Data Centres from the
end of 2014 to the end of 2019 - in Euro per month Figure 37: A table showing the key statistics of the Dutch Data Centre market - as of the end of 2014
Copyright Tariff Consultancy Ltd 2014 3

Data Centre Pricing Netherlands – 2014 to 2019 Table of Contents
Figure 38: A table showing selected new Data Centre developments in the Netherlands
Figure 39: A table showing key selected new Data Centre developments from 2010 to the end of
2014: in square metres
Figure 40: A chart showing forecast Dutch Data Centre raised floor space growth from the end of
2014 to the end of 2019 - in square metres
Figure 41: A chart showing forecast average Dutch Data Centre utilisation rates from the end of 2014
to the end of 2019 - in square metres
Figure 42: A chart showing forecast average Dutch Data Centre revenue from the end of 2014 to the
end of 2019 - in millions of Euro per month
Figure 43: A chart showing forecast Dutch Data Centre average standard retail rack space pricing from the end of 2014 to the end of 2019 - in Euro per month
Figure 44: A chart showing forecast standard retail average Dutch Data Centre pricing per square
metre from the end of 2014 to the end of 2019 - in Euro per month
Figure 45: A chart showing standard retail average standard retail forecast Dutch Data Centre pricing
per kW from the end of 2014 to the end of 2019 - in Euro per month
Figure 46: A chart showing forecast standard retail average rack space and per square metre pricing
in the Netherlands compared with other European countries - in Euro per month
Figure 47: A chart showing the average standard retail Data Centre pricing in 14 European countries -
in Euro per month as of January 2014
Copyright Tariff Consultancy Ltd 2014 4

Data Centre Pricing Netherlands – 2014 to 2019 Table of Contents
A list of Dutch Data Centre companies mentioned in the report
Below TCL provides a list of the Dutch Data Centres that are mentioned in this report:
BIT BT Global Services Citadel 100 ColoCenter Zoetermeer
COLT Telecom
Data Place
Databarn Datacenter Den Holder Datahouse Data Center Freisland Easycolocate
Easynet Equinix Evoswitch
Eurofiber Global Switch Global-E Data Center Green House Data Centers Gyro Center I3D Data Centre Interconnect InterDC Interoute Interxion ISP Services ITB Datacenter
KPN CyberCenter
Level (3) NAP of Amsterdam NedZone Data Center NIKHEF Previder
SARA
Serverius Spaanse Kubus Switch DataCenter Group
TCN Data Hotels
TelecityGroup
The DataCenter Group
Verizon Business
Copyright Tariff Consultancy Ltd 2014 5

Data Centre Pricing Netherlands – 2014 to 2019 Main Highlights of the Report
Data Centre Pricing Netherlands – 2014 to 2019 Introduction
Introduction – Data Centre Pricing Netherlands – 2014 to 2019 report
The TCL Data Centre Pricing Netherlands – 2014 to 2019 report provides a unique overview of Data Centre pricing for the Dutch market. It is based on a survey of 54 Data Centre operators with 117 Data Centre facilities across the Netherlands - which consists of a total of almost 348,000 square metres of raised floor space forecast as of the end of 2014.
The Dutch Data Centre market has seen considerable growth in both the number and the size of Data Centre facilities being built, with existing Data Centre players continuing to add to their existing facilities and build new Data Centres in existing locations or cities.
Data Centre facilities in the Netherlands are clustered around the Amsterdam area, which remains the biggest single region for facilities. But more facilities are now being built in other cities of the country, particularly around Rotterdam.
Research Methodology
The Data Centre Pricing Netherlands – 2014 to 2019 report was written over the period from the end of November 2013 to the end of December 2013.
The report consists of information from both primary and secondary sources. It also includes information from other TCL reports (including the TCL Premium Data Centre report) as well as the TCL Data Centre Price Tracker subscription service.
The report is based on an analysis of some 54 Data Centre providers in the Netherlands consisting of some 117 Data Centre facilities in total, with raised floor space per facility averaging 2,974 square metres (as of the end of 2014).
The basis of the report is a unique model of the Dutch Data Centre market developed by TCL which includes the key metrics of power, raised floor capacity and rack space and per square metre pricing by both facility and by Data Centre provider.
The model can be segmented by location and by the 3 main types of Data Centre segment type (which are Carrier Based, Carrier Neutral & Premium Data Centres) used in the report. The information used in the model is obtained from the provider as part of a “bottom up” process.
The report also uses telephone and face to face interviews along with a TCL questionnaire, which is used to provide information on Data Centre capacity and demand factors for the forecast.
The TCL report also uses information which comes from a range of sources including independent experts, Data Centre company presentations, telecoms companies, IT companies and real estate companies. All taxes and VAT are excluded from the Data Centre pricing shown in this report.
Copyright Tariff Consultancy Ltd 2014 6

The main Data Centre segments identified in this report
The Data Centre types used in this report are Carrier Based, Carrier Neutral or a Premium Data Centre provider – and the types are defined as follows -
A Carrier Based Data Centre provider - for the purposes of this report is defined as being a
subsidiary of a telecoms provider and is able to provide a limited choice of telecoms networks from a facility.
Data Centre Pricing Netherlands – 2014 to 2019 Introduction
A Carrier Neutral Data Centre provider - for the purposes of this report is defined as being a company which is not owned by a domestic network provider and has multiple telecoms networks from a facility.
A Premium Data Centre provider - for the purposes of this report is defined as being able to
support high density power per rack space combinations of up to 20 kW or above.
The pricing used in the report is obtained in confidence from the Data Centre providers themselves. When received in confidence the individual pricing Data Centre pricing is not revealed, but is used with other pricing to make a market average price.
Below TCL provides a breakdown of the numbers of Dutch Data Centre facility by the 3 main segment types (Carrier Neutral, Carrier Based or Premium Data Centre segment types) in the pie chart below -
Figure: A pie chart showing the number of Dutch Data Centres by segment type - in per cent as of the end of 2014
Source – TCL (Sample: 117 Data Centre facilities)
Copyright Tariff Consultancy Ltd 2014 7

In the Dutch market the most common of the 3 main Data Centre types - surveyed by numbers of facility are the –
Carrier Neutral Data Centre type, which now accounts for almost 60 per cent of the market
(some 67 facilities), Carrier Based Data Centre, which now accounts for 22 per cent (some 26 facilities),
Premium Data Centre (which is capable of offering 20kW per rack as standard) taking up the remaining segment of 18 per cent (some 22 facilities).
The breakdown of the 3 main Data Centre type segments is also shown in the pie chart below according to the proportion of raised floor space available -
Data Centre Pricing Netherlands – 2014 to 2019 Introduction
Figure 6: A pie chart showing the proportion of Data Centre raised floor space available by segment type - in per cent as of the end of 2014
Source – TCL (Sample: 117 Data Centre facilities)
In the Dutch market it is also the Carrier Neutral Data Centre which has the largest proportion of raised floor space by segment type – the segment types (by raised floor space) as of the end of 2014 are –
Carrier Neutral Data Centres – accounts for 53 per cent of all Dutch Data Centre raised floor
space (with over 182,000 square metres)
Premium Data Centres - accounts for 26 per cent of all Dutch Data Centre raised floor space
(with over 91,000 square metres)
Carrier Based Data Centres – accounts for 21 per cent of all Dutch Data Centre raised floor
space (with 74,000 square metres)
The Carrier Neutral Data Centre is the largest segment in the Dutch Data Centre market followed by the Premium Data Centre market.
Copyright Tariff Consultancy Ltd 2014 8
The Data Centre Tier certification used in the report
Also TCL emphasises that it should be noted that the Data Centre Tier grade certification and the Data Centre PUE ratio where mentioned in the report has been obtained from each Data Centre provider and has not been independently verified by TCL in this report.
The Data Centre Tier grade certification used in this report is developed by the US-based Uptime Institute and is outlined in the Summary Box below:
Summary Box – The Uptime Institute Data Centre Tier Classification
The Uptime Institute Data Centre Tier Classification
The US-based Uptime Institute has created a standard classification of Data Centre resilience which is as follows:
Tier 1: Single path Power & Cooling distribution; no redundant components – 99.671% availability
Tier 2: Single path Power & Cooling distribution; redundant components – 99.749% availability
Tier 3: Multiple path Power & Cooling distribution but one path active; redundant components – 99.982% availability
Tier 4: Multiple path Power & Cooling distribution with active paths; redundant components – 99.995% availability
Data Centre Pricing Netherlands – 2014 to 2019 Introduction
The Power Usage Effectiveness (PUE) ratio used in this report
The Data Centre PUE ratio that is used in the report stands for “Power Usage Effectiveness” and measures the total amount of power used by the Data Centre against the amount that is used for IT hardware.
The higher the PUE ratio, the lower the proportion that is used by IT hardware, and the more that is used by the Data Centre facility itself.
As an example, if a Data Centre has a stated PUE ratio of 1.3 – than for every 1 watt of power consumed by the IT hardware, another 0.3 watts of power is consumed by the ancillary services of the Data Centre.
Again, it should be noted that the PUE ratio used by TCL is provided by the Data Centre itself, which has not been independently verified.
The Data Centre pricing used in this report
TCL also receives Data Centre pricing directly from providers and users, and from published sources.
Where the individual Data Centre pricing is published in this report it is because the pricing has already published in the public domain.
The individual pricing received is used to provide an average price for Carrier Based, Carrier Neutral and Premium Data Centres in the Netherlands and the individual Data Centre’s price is not disclosed.
It should be noted that the Data Centre pricing received by TCL is list pricing and does not take into account discounts that may be offered for large space or promotional discounts.
For comparison purposes the standard rack space pricing and per square metre pricing is shown with no or minimal power bundles (of 1 kW) or of access to power without the power charge being included.
Copyright Tariff Consultancy Ltd 2014 9
Rack space rental pricing is used - where appropriate - to derive pricing per square metre – by dividing the rack space rental by 2.5 square metres – which becomes a per square metre rental cost.
The other metrics used in this report
In the report for consistency all power per rack is shown in kilowatts (kW) per rack and in kilowatts per hour (kW per Hour). Total power into the Data Centre from the national grid is shown in MegaWatts (MW) or MVA.
The rack space used in the report is the standard size of 19” – with a single phase power supply. The pricing used is standard retail pricing for rack space and square metre pricing. Minimal power is included where power is bundles with rack space as standard by the Data Centre provider.
Data Centre Pricing Netherlands – 2014 to 2019 Appendix
Appendix
Appendix One – A brief glossary of terms used in the report
Appendix One - A Brief Glossary of terms used in the report
Amps: Ampere is a standard unit of electrical current, and is a measure of the amount of electric
charge. Many power in racks are shown in Amps and can be converted into kW as follows –
- 8 Amps = 1.92 kW
- 10 Amps = 2.4 kW
- 16 Amps = 3.5 kW
- 20 Amps = 4.8 kW
MW: Mega Watt: is 1,000,000 (one million) units of watts
kW: kilo Watt: is 1,000 (one thousand) units of watts
kW hour: (kWh) – kilo Watt per hour – is an amount of kilo watts consumed per hour
KVA: is Kilo Volt Ampere which corresponds to 1000 volt amperes. Volt-ampere (VA) is the voltage
multiplied by the current load.
PUE: is Power Usage Effectiveness, a measure of the Power used directly by IT hardware in the Data
Centre against the total power that is consumed, presented as a metric. The lower the metric the more
efficient the facility.
N+1: N+1 is the use of one active back up component which can be shared among a range of
components
N+N: N+N is the use of one active back up component for each component.
Watt: named after James Watt; a measure of electrical power. One watt = one ampere of current
flowing at one volt
Copyright Tariff Consultancy Ltd 2014 10

Free Air Cooling: is a method of cooling heated air in the Data Centre facility by using naturally cool
external air or water without the use of artificial chilling.
To purchase this report please contact Caroline Hitchins on +44 (0) 7544 121900 or email [email protected]
Copyright Tariff Consultancy Ltd 2014 11