data and modeling issues in population biology alan hastings (uc davis) and many colalborators ...
TRANSCRIPT

Data and modeling issues in Data and modeling issues in population biologypopulation biology
Alan Hastings (UC Davis) and many Alan Hastings (UC Davis) and many colalboratorscolalborators
Acknowledge support from NSFAcknowledge support from NSF

GoalsGoals
Understand ecological principles or determine Understand ecological principles or determine which processes are operatingwhich processes are operating– E.g., How important is competition?E.g., How important is competition?
Make predictionsMake predictions– What will the population of a species be in the future?What will the population of a species be in the future?
ManagementManagement– FisheriesFisheries– Infectious diseasesInfectious diseases– Invasive speciesInvasive species– Endangered speciesEndangered species
Time seriesTime series
Population biology typically follows Population biology typically follows populations through time (and sometimes populations through time (and sometimes space)space)
Data is of varying qualitiesData is of varying qualitiesLimited extentLimited extent
Measurement errorMeasurement error
Often cannot go back and get more dataOften cannot go back and get more data

Time series of total weekly measles notifications for 60 towns and cities in England and Wales, for the period 1944 to 1994; the vertical blue line represents the onset of mass vaccination around 1968. (Levin, Grenfell, Hastings, Perelson, Science 1997)

A small part of the Coachella valley A small part of the Coachella valley food web (Polis, 1991)food web (Polis, 1991)
Purposes of time series analysisPurposes of time series analysis
Parameter estimationParameter estimation– For a For a ‘‘known modelknown model’’, estimate the parameters, estimate the parameters– Determine importance of biological factors operatingDetermine importance of biological factors operating
Model identificationModel identification– TheThe?? model with the model with the ‘‘highest likelihoodhighest likelihood’’ is chosen as the is chosen as the
model that describes the systemmodel that describes the system
PredictionPrediction ManagementManagement

Underlying modeling issueUnderlying modeling issue
Mechanistic models versus using general Mechanistic models versus using general modelsmodels– Linear time series analysisLinear time series analysis
Less of an issueLess of an issue
– Nonlinear time seriesNonlinear time series Use general modelUse general model Use specific modelUse specific model Use ‘mixed’ modelUse ‘mixed’ model
Modelling approachesModelling approaches
General modelGeneral model– EE.g. cubic splines.g. cubic splines
Mechanistic modelMechanistic model– E.g., SIR modelE.g., SIR model
MixedMixed– TSIRTSIR
KKnow that a single infection removes a single now that a single infection removes a single susceptible, and know dynamics of I to R whereas S susceptible, and know dynamics of I to R whereas S to I is more problematicto I is more problematic

How How ‘‘noisenoise’’ enters enters
Process noiseProcess noise– Environmental variabilityEnvironmental variability– Role of species or factors not includedRole of species or factors not included
Demographic factorsDemographic factors– How mechanistic should this be?How mechanistic should this be?
Other species, or environmentOther species, or environment
Measurement errorMeasurement error– How good are population estimates?How good are population estimates?
How mechanistic should this be?How mechanistic should this be?
The time seriesThe time series
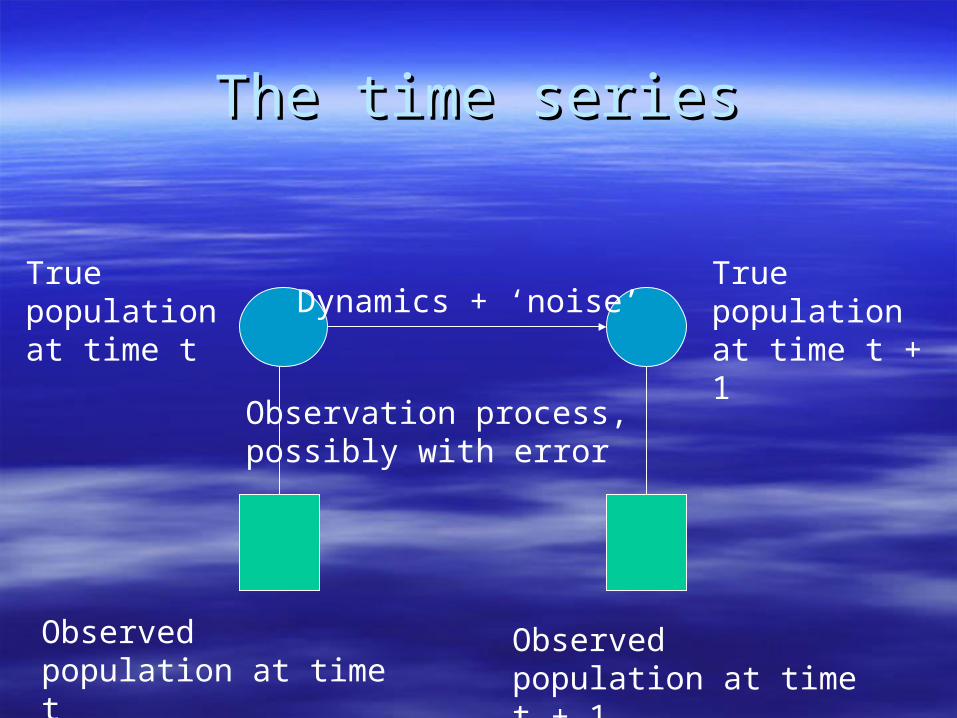
True population at time t
True population at time t + 1
Observed population at time t
Observed population at time t + 1
Dynamics + ‘noise’
Observation process,possibly with error

Use Kalman FilterUse Kalman Filter
True population at time t
True population at time t + 1
Observed population at time t
Observed population at time t + 1
Linear Dynamics + ‘noise’
Linear Observation process,possibly with error

Observation error onlyObservation error only
True population at time t
True population at time t + 1
Observed population at time t
Observed population at time t + 1
Dynamics + ‘noise’
Observation process,possibly with error
Use model to generate the whole time series, minimize difference between every observation and every prediction

Process error onlyProcess error only
True population at time t
True population at time t + 1
Observed population at time t
Observed population at time t + 1
Dynamics + ‘noise’
Observation process,possibly with error

Process error onlyProcess error only
True population at time t
Observed = true population at time t + 1
Predicted population at time t + 1
Dynamics + ‘noise’
Dynamics onlyNoise
Make one step ahead predictions onlyMinimize difference between one stepahead and observation

Laboratory populations of Tribolium

Graphical Graphical representation of representation of Dungeness crab Dungeness crab
modelmodel

Data and fits Data and fits at eight portsat eight ports

Data and fits Data and fits at eight portsat eight ports

Data and fits Data and fits at eight portsat eight ports

Resample from Resample from ‘noise’ to ‘noise’ to
demonstrate demonstrate that observed that observed
dynamics result dynamics result – essentially – essentially
continual continual transientstransients


ConclusionsConclusions
Much more work neededMuch more work needed Mechanistic models can be usedMechanistic models can be used Using mechanistic models can be important Using mechanistic models can be important
in highlighting ecological processesin highlighting ecological processes
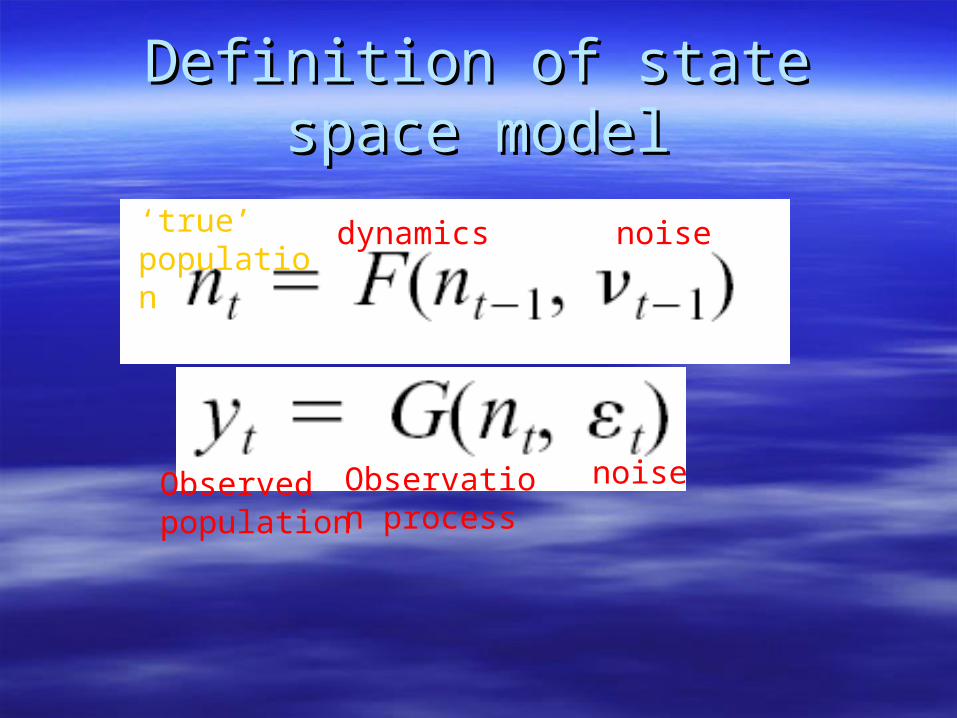
Definition of state space modelDefinition of state space model
‘true’ population
dynamics noise
Observed population
Observation process
noise

The time seriesThe time series
True population at time t
True population at time t + 1
Observed population at time t
Observed population at time t + 1
Dynamics + ‘noise’
Observation process,possibly with error

Likelihood is defined as Likelihood is defined as probability of observationprobability of observation
Likelihood Probability defined iteratively
Superscripts on y’s mean observations up to and including that time, subscripts denote observations only at that time
parameters
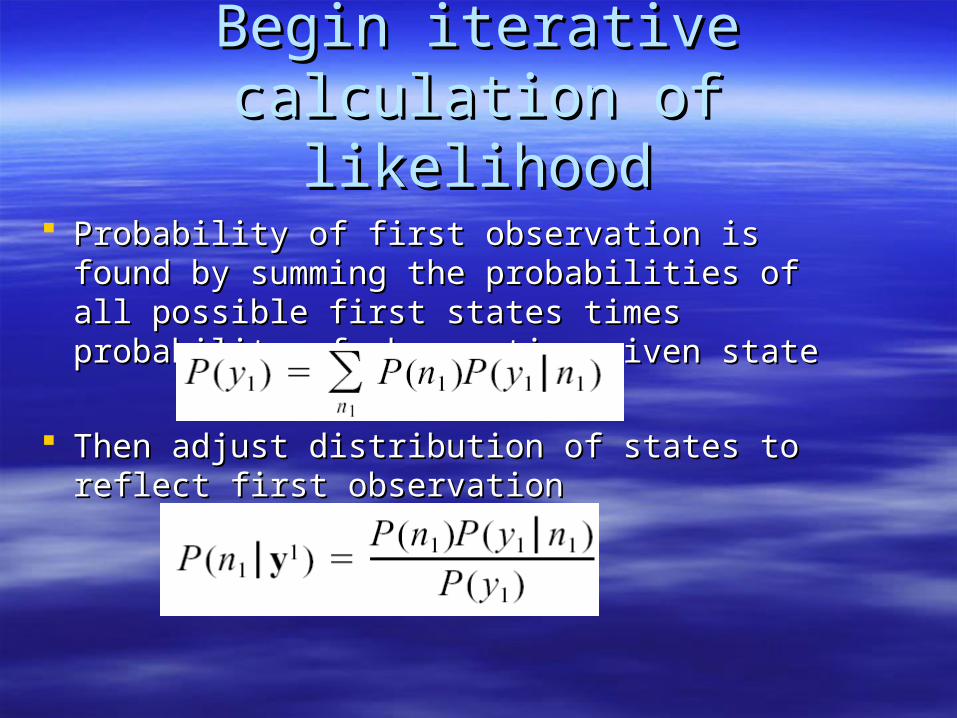
Begin iterative calculation of Begin iterative calculation of likelihoodlikelihood
Probability of first observation is found by summing Probability of first observation is found by summing the probabilities of all possible first states times the probabilities of all possible first states times probability of observation given stateprobability of observation given state
Then adjust distribution of states to reflect first Then adjust distribution of states to reflect first observationobservation

The time seriesThe time series
True population at time t
True population at time t + 1
Observed population at time t
Observed population at time t + 1
Dynamics + ‘noise’
Observation process,possibly with error

Second and remaining stepsSecond and remaining steps

Later stepsLater steps

Change to continuous stateChange to continuous state
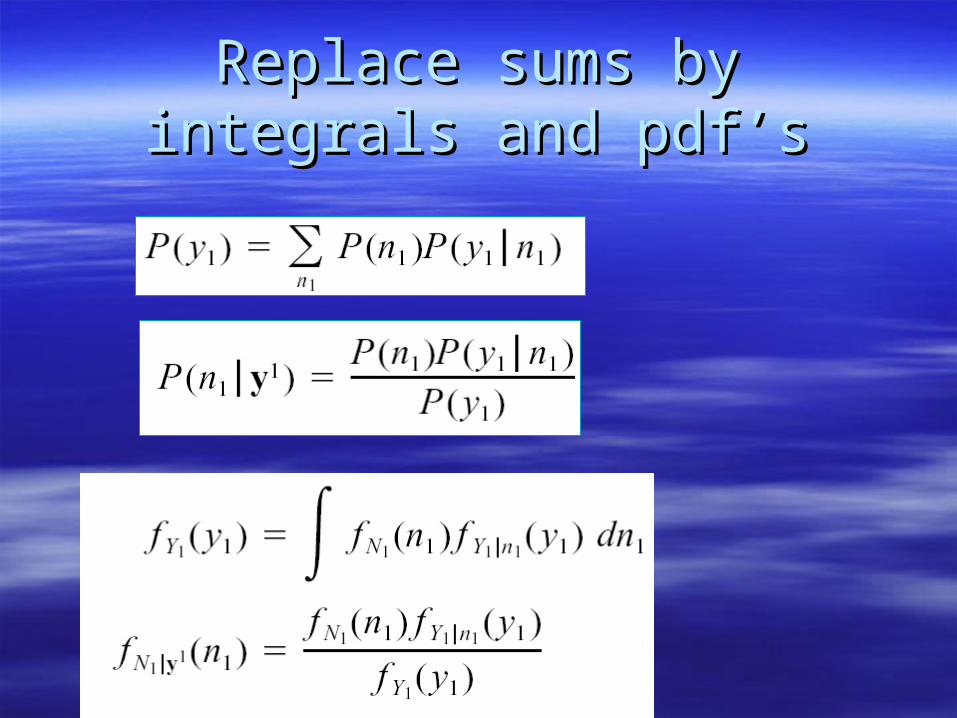
Replace sums by integrals and Replace sums by integrals and pdf’spdf’s

Compute first state as stationary Compute first state as stationary distributiondistribution

Change all computations to Change all computations to computations of pdf’scomputations of pdf’s
Omit detailsOmit details

Use Beverton-Holt and Ricker Use Beverton-Holt and Ricker models with process noise linear models with process noise linear
on log scaleon log scale
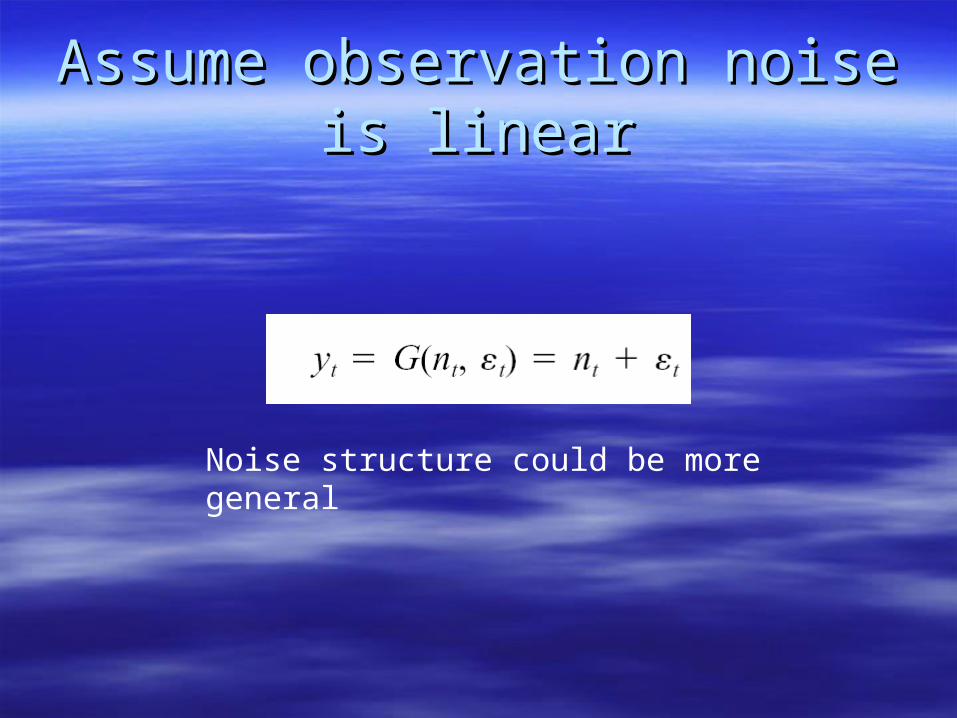
Assume observation noise is Assume observation noise is linearlinear
Noise structure could be more general

Dynamics and fittingDynamics and fitting
Beverton-HoltBeverton-Holt– Always stableAlways stable– Use one set of parameter valuesUse one set of parameter values
RickerRicker– Period doubles, etcPeriod doubles, etc– Stable equilibriumStable equilibrium– Two cycleTwo cycle– Four cycleFour cycle

Process noise and observation Process noise and observation error combinationserror combinations
Large process noise, small observation errorLarge process noise, small observation error Small process noise, large observation errorSmall process noise, large observation error Large process noise, large observation errorLarge process noise, large observation error Generate 300 time series of length 20 for Generate 300 time series of length 20 for
each of the 12 cases (3 error structures by 4 each of the 12 cases (3 error structures by 4 model structures)model structures)

Parameter estimationParameter estimation
For each case, use each methodFor each case, use each method NISS should handle large noiseNISS should handle large noise LSPN (least squares process noise)LSPN (least squares process noise) LSOE (least squares observation error)LSOE (least squares observation error)

Maximum Maximum likelihood likelihood
estimates of estimates of growth rate growth rate parametersparameters


Estimate of Estimate of growth rate growth rate when data when data generated by generated by one model, fit one model, fit by anotherby another
Top row, Top row, generated by generated by BH, fit by BH, fit by Ricker, Ricker, bottom row is bottom row is reversereverse

Now, model identificationNow, model identification
Generate data with either model, see which Generate data with either model, see which model has the highest likelihoodmodel has the highest likelihood
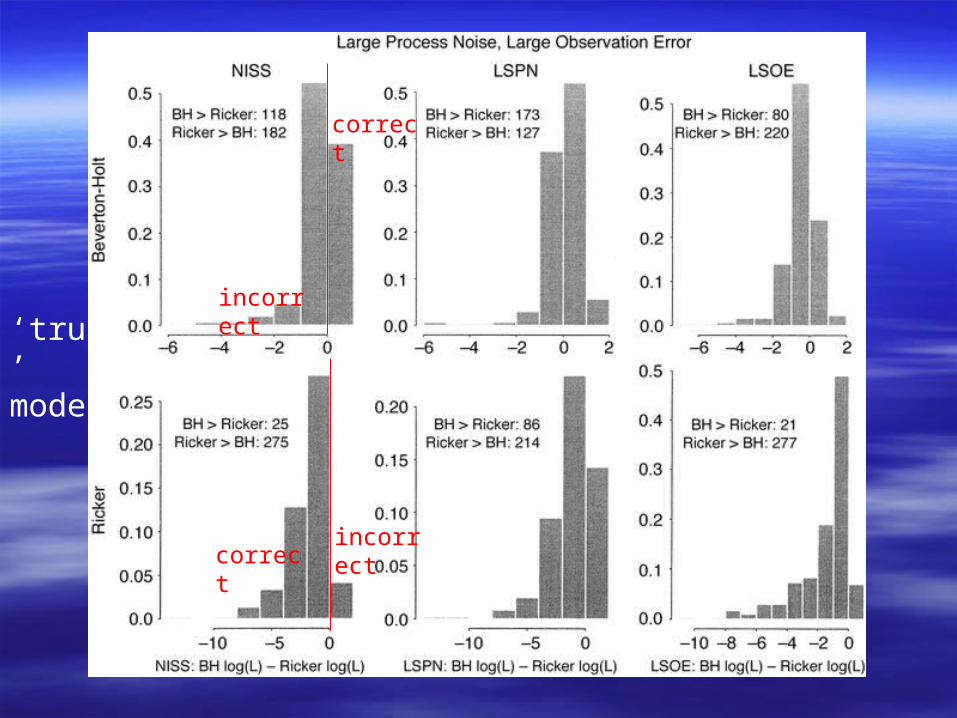
‘true’ model
incorrect
correct
correct
incorrect


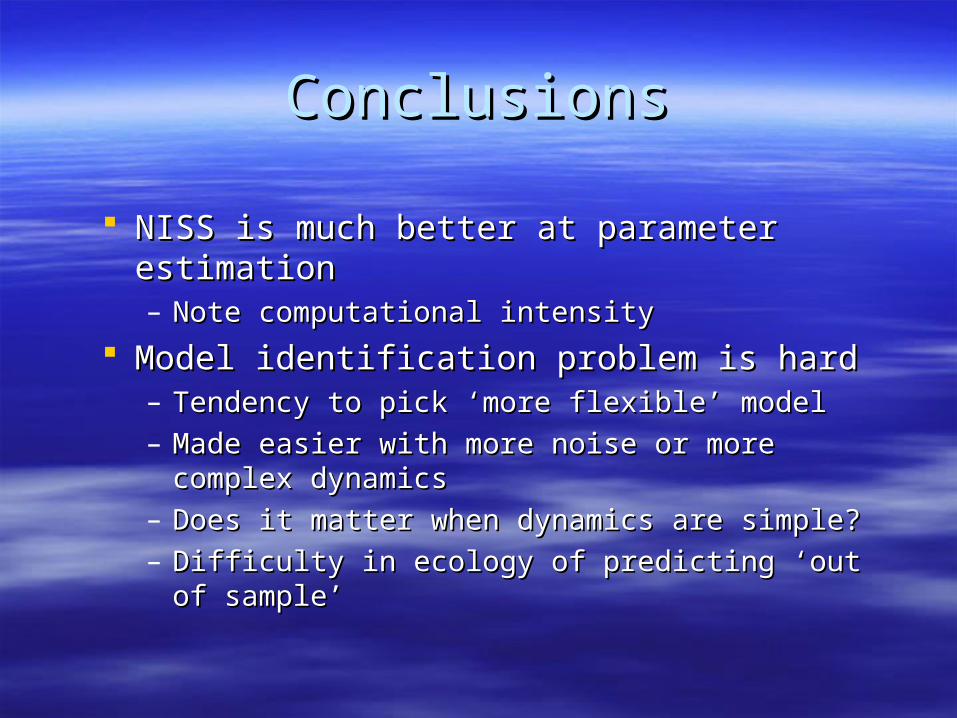
ConclusionsConclusions
NISS is much better at parameter estimationNISS is much better at parameter estimation– Note computational intensityNote computational intensity
Model identification problem is hardModel identification problem is hard– Tendency to pick ‘more flexible’ modelTendency to pick ‘more flexible’ model– Made easier with more noise or more complex Made easier with more noise or more complex
dynamicsdynamics– Does it matter when dynamics are simple?Does it matter when dynamics are simple?– Difficulty in ecology of predicting ‘out of sample’Difficulty in ecology of predicting ‘out of sample’


ReferencesReferences
Higgins, K., A. Hastings, J. N. Sarvela, and L. W. Higgins, K., A. Hastings, J. N. Sarvela, and L. W. Botsford. 1997. Stochastic dynamics and Botsford. 1997. Stochastic dynamics and deterministic skeletons:population behavior of deterministic skeletons:population behavior of Dungeness crab. Science 276:1431–1435.Dungeness crab. Science 276:1431–1435.
de Valpine, P. and A. Hastings. 2002. Fitting de Valpine, P. and A. Hastings. 2002. Fitting population models incorporating noise and population models incorporating noise and observation error. Ecological Monographs 72:57-observation error. Ecological Monographs 72:57-76.76.