data analytics in education domain - magic software ... analytics in education domain by rishi raj...
TRANSCRIPT

Data Analytics in Education Domain
by
Rishi Raj Sr. Manager, Magic Products
Magic Software, Noida (U.P.)

Table of Contents Chapter 1 ................................................................................................................. 1
Introduction .......................................................................................................... 1
Data ................................................................................................................. 1
Data Analytics .................................................................................................... 1
Educational Data Mining ...................................................................................... 3
Impact of Big Data analytics on eLearning ............................................................. 3
Chapter 2 ................................................................................................................. 5
Reports and Analytics ............................................................................................. 5
Analytics Dashboard ........................................................................................... 5
Reports and Charts ............................................................................................. 6
Data Analytics Lifecycle ....................................................................................... 6
Dimensions of Learning Analytics .......................................................................... 8
Types of Analytics ............................................................................................... 9
Chapter 3 ............................................................................................................... 11
Capturing Learning Data ....................................................................................... 11
Tin Can API ...................................................................................................... 12
Freedom with Tin Can API.................................................................................. 13
Chapter 4 ............................................................................................................... 14
eLearning Stakeholders ........................................................................................ 14
Publisher ......................................................................................................... 14
School Administrator ......................................................................................... 24
Teacher ........................................................................................................... 27
Student ........................................................................................................... 31
Chapter 5 ............................................................................................................... 34
Challenges, Obstacles and Opportunities ................................................................. 34
Challenges with eLearning ................................................................................. 34
Children’s Online Privacy Protection Act (COPPA) .................................................. 35
Family Educational Rights and Privacy Act (FERPA) ............................................... 36
Opportunities with eLearning ............................................................................. 37
Chapter 5 ............................................................................................................... 38
Digital Rights Management .................................................................................... 38
Restrictive Licensing ......................................................................................... 38
Encryption ....................................................................................................... 40
Summary ............................................................................................................... 41
Abbreviations ......................................................................................................... 42
References ............................................................................................................. 43

List of Figures
Figure 1: Analytics Dashboard .................................................................................... 5 Figure 2: Reports and Charts ...................................................................................... 6 Figure 3: Types of Analytics ...................................................................................... 10 Figure 4: Tin Can API Data Capture – the learner, tools and activities ............................ 11 Figure 5: Capturing different learning experiences – the activities ................................. 12 Figure 6: Publisher .................................................................................................. 14 Figure 7: Most Engaging Books Report ....................................................................... 15 Figure 8: Top Sellers Report ..................................................................................... 16 Figure 9: Sales Report ............................................................................................. 17 Figure 10: License Activation by School Report ........................................................... 18 Figure 11: Download Trends Report ........................................................................... 19 Figure 12: Titles Downloaded by Device Report ........................................................... 20 Figure 13: All Downloads Report ............................................................................... 21 Figure 14: Content Browsed Report ........................................................................... 22 Figure 15: Heat Map (average time spent across pages) Report .................................... 22 Figure 16: App First Time Launch Report .................................................................... 23 Figure 17: School Administrator ................................................................................ 24 Figure 18: Most Engaging Books Report ..................................................................... 24 Figure 19: Academic Performance Report ................................................................... 25 Figure 20: District Enrollment Report ......................................................................... 26 Figure 21: Teacher .................................................................................................. 27 Figure 22: Most Engaging Books Report ..................................................................... 28 Figure 23: Homework Progress Report ....................................................................... 29 Figure 24: Heat Map (average time spent across pages) Report .................................... 30 Figure 25: Student .................................................................................................. 31 Figure 26: Social Learning ........................................................................................ 32 Figure 27: Student Engagement ................................................................................ 32 Figure 28: License Expiration .................................................................................... 38 Figure 29: Types of license ....................................................................................... 39 Figure 30: Content Encryption .................................................................................. 40

List of Tables
Table 1: Most Engaging Books Report ........................................................................ 16 Table 2: Top Sellers Report ...................................................................................... 17 Table 3: Sales Report .............................................................................................. 18 Table 4: License Activation by School Report .............................................................. 19 Table 5: Download Trends Report .............................................................................. 20 Table 6: Titles Downloaded by Device Report .............................................................. 21 Table 7: All Downloads Report .................................................................................. 22 Table 8: Content Browsed Report .............................................................................. 22 Table 9: App First Time Launch Report ....................................................................... 23 Table 10: Most Engaging Books Report ...................................................................... 25 Table 11: Academic Performance Report .................................................................... 25 Table 12: District Enrollment Report .......................................................................... 26 Table 13: Most Engaging Books Report ...................................................................... 28 Table 14: Homework Progress Report ........................................................................ 29

1
Chapter 1
Introduction Data Analytics has incredible potential to impact education worldwide. There is
significant amount of data being collected related to schools and students (e.g. personal information, attendance, marks, reduced lunches and so on), but much of
it is administrative and/or siloed and/or unexamined. Let’s look at some of the terms before moving on to data analytics in education domain.
Data
Data is facts and statistics (such as numbers, words, measurements or observations) collected primarily for analysis. Data is collected, reported, analyzed and then visualized using graphs or images.
Data can be of the following types:
Qualitative data – descriptive information i.e. it describes something Quantitative data – numerical information and can be discrete (contains
only certain values such as whole numbers) or continuous (contains any value i.e. within a range)
Data collection can be done in various ways:
Direct observation Survey
o Census – collected for every member of the group o Sample – collected just for selected members of the group
Electronic tracking of activities performed - using computers, laptops,
mobile devices (tablets, phones) etc.
Big data in the eLearning domain is created by learners i.e. employee, parent, teacher, student etc. while they are taking an eLearning course or training module.
Data Analytics
Analytics is the ability to generate useful insights from collected data that assist in fact-based decision-making. It is a process that involves data assessment and
analysis enabling measurement and enhancing the performance of learners, programs and/or institutions. Analytics mines the data in possession by an organization and gives the opportunity to extract useful insights from the data,
thus helping increase efficiency and effectiveness. Analytics involves studying historical data to derive potential trends, analyze effects of certain decisions or
evaluate the performance of a given tool or specific scenario. Firms commonly apply analytics to business data for predicting and improving business outcomes and performance.

2
Data analytics is used to describe almost everything. Banks analyze credit cards withdrawal and spending patterns to identity theft or prevent fraud. eCommerce
companies’ review web traffic or navigation patterns to determine which customers are more or less likely to buy a product or service based upon prior purchase
trends. Modern data analytics uses information dashboards supported by live data streams involving dynamic analysis and reporting based on data entered into the application less than a minute before the actual usage.
The data captured can be analyzed to offer organizations or eLearning
professionals the opportunity to determine how the learner is acquiring information, at what pace and to pin-point any problems that may exist within the eLearning strategy itself.
Analytics can also provide insights into the behaviors of learners for institutions to
use the data they routinely collect to gain a better understanding to improve the learner experience and gain a strategic advantage. Learning analytics is a key trend for education and has real potential to improve the learner experience.
Data analytics focuses on deriving conclusions based entirely on what is already
known. It is a process of inspection, cleaning, transformation and modeling raw data with the objective of discovering meaningful information and suggesting
conclusions that help decision-making. Data on almost all aspect of our lives is being tracked and stored in databases and analytics allows turning this data into insights. Companies or scientists use data analytics to discover pregnancy based
on credit card receipts, recommend schools, movies and so on.
Learning Analytics are the foundation tool for informed change in education. It enables teachers and schools to tailor educational opportunities to each student’s level of need and ability.
In this complex world, there is huge demand for skilled and knowledgeable people,
yet institutions at every level struggle to graduate students that can meet these requirements. Analytics provides the tools to measure performance and ensure students acquire the necessary skills to succeed.
eLearning is constantly evolving and the emerging technologies and improved
instructional design models are factors that contribute to this evolution. Even the analytics and reporting are getting refined regularly depending on user’s needs.
Big data can revolutionize the eLearning industry by allowing Publishers to customize the eLearning experience and provide learners with more effective,
engaging and informative eLearning courses and modules. In order for learning analytics to have a major impact in education, the learning
content need to be adaptive and prior learning included in assessment. The profile of the learner, not pre-planned content should drive curriculum and learning
opportunities.

3
Educational Data Mining
Educational data mining (EDM) has emerged as an independent research area in
last few years. EDM involves developing methods for exploring unique data types that come from an educational context and using these methods to better
understand students and the settings in which they learn. The analysis domain, data, process and objectives in Learning Analytics (LA) and EDM are quite similar. Both fields focus on the education domain, work with educational environments
data, and convert this data into relevant information with the aim of improving the learning process. However, the techniques used in LA are slightly different from the
one used in EDM. EDM primarily focuses on the application of typical data mining techniques (i.e. clustering, classification and association rule mining) to support teachers and students in analyzing the learning process. In addition to data mining
techniques, LA further includes other methods, such as statistical and visualization tools and puts them into practice for studying their actual effectiveness on the
improvement of teaching and learning.
Impact of Big Data analytics on eLearning
Big Data analytics play a major and constructive role in driving improvements in
eLearning. Here are some of the benefits provided by Big Data analytics.
Offer invaluable feedback
Big data provides eLearning professionals with invaluable feedback that can
be used to identify where the learner and the eLearning course need improvement. E.g. If a learner is able to get insight of where (s)he fell short
while taking the eLearning module or course, (s)he can figure out how to rectify the issue moving forward. Moreover, if the teacher/instructor observes that the majority of the students struggle with a particular module
or course, (s)he can make adjustments to improve learners’ performance.
Allow Publishers to design more personalized eLearning courses If Publishers get to know how their learners are acquiring information and
what works best for them, in terms of content and delivery, it will result in more personalized and engaging eLearning courses. Based on this, modules
can be customized to meet the individual needs of the learner that will offer better quality and more meaningful learning experience.
Target effective eLearning strategies and goals
Big data in eLearning gives a view of which eLearning strategies are working and which ones aren't helpful in terms of eLearning goal achievement. For example, one can determine which eLearning courses/modules are
contributing to skill development and which eLearning courses/modules are irrelevant.

4
Track learner patterns
With big data, Publishers can track a learner from start to finish i.e. they can see how well leaners performed on a test or how quickly they finished a
challenging eLearning module. This helps to identify patterns that will not only enable one to learn more about the learning behaviors of the individual learner, but also learners’ group as a whole.
Expand the understanding of the eLearning process
As Publishers and Teachers, it's important for them to understand how learners acquire and digest knowledge. Big data provides opportunity to gain
an in-depth understanding of the eLearning process and how the learners respond to the eLearning courses being delivered to them. One can figure
out which time of day they learn most effectively or which delivery methods allow to retain information most efficiently. The information can then be used to take the eLearning strategies to the next level.

5
Chapter 2
Reports and Analytics
Different users have different analytic report needs. A teacher would be
interested in getting information that can allow them to teach better. A policy maker at an institution would probably want to know how successful the
teachers are with their students. Similarly, certain analytics are helpful to students. Reports and Analytics help different users (Publishers, District Administrators, School Administrators, Teachers and Students) involved in education domain in
the following ways:
Get insight into who is using what content and what time has been spent
across different content Which portions of the book are learners spending more time on and which
seem difficult and time consuming What are the preferable devices being used for learning Get insight on sales, downloads, licensing and eCommerce performance
Identify content enhancement based on real-time usage and analytics Reports providing insights into improvement areas
Adaptive learning - adapt the presentation of educational material according to students' learning needs
Analytics Dashboard
Analytics Dashboard helps users to see the most important reports at a glance. Dashboards provide users with a collection of widgets that gives an overview of the reports and metrics that one would prefer looking at in one place and use it to
make faster, better-informed decisions. Dashboards let users monitor multiple metrics at once, so one can quickly check the overall health or see correlations
between various reports. The default dashboards can then be further filtered based on need – date range, specific district / school etc.
Figure 1: Analytics Dashboard

6
Reports and Charts
Reports and Charts are derived as a drill-down from the Dashboard Analytics
Report. Users can click various dashboard reports title to get a detailed analytical view of the report with the option to view and compare the data at a lower level
categorized by date range, district, school, content, user etc. These can then be exported in various formats such as PDF, Excel and CSV for reference.
Figure 2: Reports and Charts
Data Analytics Lifecycle
Data Analytics primarily follows a six-step lifecycle as described below.
Discovery
The data analytics starts with the discovery phase that details the objectives, requirements and obstacles. The critical activities in the discovery phase are:
o Frame the business problem in a way that can be solved in phases
o Understand what has been done in the past o Assess the resources supporting the project (people, technology, time
and data) o Form an initial hypotheses and create an analytic plan o Determine readiness to move to the next phase
Data Preparation
The next step is the data preparation phase where data is collected that can
be used for deriving analytics. Data cleansing and conditioning are tedious and time-consuming activity. Many new tools have emerged that help
simplify analytics, reporting and handling data streaming. The data must be

7
in the desired format, structure and quality to enable the subsequent analysis.
The three key activities that conclude whether or not the data is "good
enough", are as follows:
o List all the data sources and determine whether important data is
available or additional data is needed. It can be done by referring to the analytic plan to determine if one has what's needed or if more
data must be loaded into the sandbox. o Perform data conditioning, clean and normalize the data. During this
process, decide what to keep and what to discard.
o Create overviews, filter, get details and begin to create descriptive statistics and evaluate data quality.
Model Planning
The model-planning phase starts once it is concluded that the data in the analytic sandbox is of sufficient volume and quality. Model planning is the
last step of preparation before executing the analytical models. In this phase, the analyst move closer to the algorithms that they will use to prove
or disprove the hypotheses generated as part of the Analytic Plan. Following conditions are to be considered while choosing the right methods to validate the hypotheses:
o The structure of the data determines what tools and techniques can
be used in the following phase. E.g. If analysis involves textual data, Sentiment Analysis using Hadoop is the right approach.
o The analytical technique that is chosen should map back to the
business objectives. The objectives are considered met when the working hypotheses are proved or disproved.
o Determine whether the situation warrants multiple tests or only one test.
Model Building
Once the model has been selected, next step is to build the model using a set of algorithms to predict the result. In this phase, the scientists begin running their models and trying to prove the hypotheses established in
Phase 1. This phase focuses on running analytic models against high quality data contained in an analytic sandbox.
Communicate Results
In this phase, the business value conceptualized before Phase 1 is quantified and presented back to the corporation.
Operationalize

8
This phase moves the analytic models out of the sandbox and into production. During the execution of the model in the production
environment, any anomalies or inputs should be detected before they are fed into the model. A mechanism needs to be in place to continually re-
evaluate the model once deployed.
Dimensions of Learning Analytics
The learning analytics is broadly categorized into six dimensions. The six dimensions of the Learning Analytics framework are Stakeholders, Objectives,
Data, Instruments, External Constraints and Internal Limitations.
Stakeholders
The stakeholder dimension combines data clients and data subjects. Data clients are the beneficiaries (e.g. institutions, teachers) of the learning
analytics who generally act upon the outcome. Data subjects are the suppliers (e.g. learners) of data, ideally captured through browsing and interaction. At times, the two types of stakeholder groups are the same if a
learning analytics feeds back information to learners about their own learning rather than informing the teacher. In the traditional (teacher +
learner) scenario, the teacher acts as the data client, who receives information gathered from the data subjects. The main stakeholder of learning analytics in formal learning situations is students, teachers and
educational institutions. Each of the groups/users has different needs and can be provided with tailored views on information using learning analytics.
Objectives
The objective of learning analytics is to unveil hidden information from educational data and prepare and present it to different stakeholders.
Tracking and comparing information flows and social interactions provides new insights to learners and helps improve organizational effectiveness and
efficiency.
Reflection: Reflection is self-evaluation in order to obtain self-knowledge. Reflection also involves self-evaluation based on other stakeholders’
datasets. E.g. A teacher reflecting upon their teaching as indicated by the datasets of their students.
Prediction: Learning Analytics can be used for predicting and modeling learner activities. This can lead to timely intervention (e.g. to prevent
student drop-out) or support adaptive curriculum.
Data
Institutions possess a large amount of student data and use it for different
purposes, the most common being administering student progress and reporting. Learning Analytics relies on data about students and one of the

9
major challenges is the availability of publicly available datasets to evaluate their learning analytics methods. Most of the data produced in institutions is
protected, and the protection of student data and learning artifacts is topmost priority for IT services departments. In the commercial world, the
default access to all user data becomes owned by the company on clicking the “Register” button, whereas educational institutions operate on the assumption that everything is protected from virtually everyone.
Instruments
Various technologies are used in the development of educational applications that support educational stakeholders in one way or the other. Information
retrieval technologies such as educational data mining (EDM), machine learning or statistical analysis techniques support learning analytics. Using
these technologies, learning analytics provide tailored information support to the stakeholders and report on demand. E.g. Learning analytics could be applied to develop a drop-out alert system to allow teachers of the course to
intervene in a timely manner.
External constraints
Many different types of constraints limit the advantages of learning analytics processes. Ethical and privacy concerns arise when applying learning
analytics in education. Policies and guidelines should be developed and followed that protect the data from abuse while dealing with educational
data. Legal data protection requires that data is anonymised before it can be used. To use learning analytics to its full capacity, integration of available
datasets needs to happen. The extent of a student’s data control with an institution and its individual staff representatives in different roles needs to be clearly defined and who has access to what data.
Internal limitations
The most prominent factors that pose obstacles under internal limitations are competencies and acceptance. The application of learning analytics
requires certain competencies to enable fruitful exploitation in learning and teaching. There are multiple ways of presenting and interpreting data and
base decisions and necessary actions on it. However, only few of them lead to benefits and improved learning. The optimal exploitation of learning analytics data requires some high level competencies in this direction for the
stakeholders, and at times it may remain unclear to them what to do as a consequence of a learning analytics outcome.
Types of Analytics
The raw data doesn't offer a lot of value or insight in its unprocessed state. By
applying the right set of tools, powerful insights can be derived from this huge

10
digital data set. With enough data, one can begin doing analytics and can start to see patterns.
Figure 3: Types of Analytics
Analytics is broadly classified into 3 types - Descriptive Analytics, Predictive
Analytics and Prescriptive Analytics.
Descriptive analytics
It is the simplest and basic analytics that allow condensing big data into smaller and useful chunks of information. Descriptive analytics simply
summarize what happened. More than 80-85% of business analytics are descriptive. E.g. number of blog posts, number of assignments, number of assessments, number of enrollments, page views, etc.
Predictive analytics
It is the next step up in data reduction and utilizes a variety of data mining, statistical and machine learning techniques to study recent and historical
data. It allows analysts to make predictions about the future. Predictive analytics can forecast what might happen in the future E.g. Student dropout
analysis is a common type, which can give a score, whether it's positive, negative or something between +1 or -1.
Prescriptive analytics
It is the most advanced of all analytics types and recommends one or more courses of action along with the likely outcome of each decision. Predictive analytics predict multiple futures based on the decision maker's actions. In
addition, prescriptive analytics requires a predictive model and additional components that includes actionable data and a feedback system that tracks
the outcome of the action taken.

11
Chapter 3
Capturing Learning Data
For any learning analytics, it is important to capture the user data based on which
analytics can be derived. By tracking the paths undertaken by learners, one can understand how they progress through experiences, what they enjoy and what
they discard, what challenges and what bores, what leads to a change in behavior and what makes no difference at all. Activities, games and simulations can all
benefit from tracking detailed user performance that is offered by the Tin Can API. Rarely would all learners use the LMS alone to do their online learning. Most of the time, a complete online learning experience is offered across many platforms,
apps, websites and LMSs. The Tin Can API allows these systems to become interoperable on a data level. Tin Can API allows different systems to interact,
share data and keep each other up-to-date in a learning eco-system.
Figure 4: Tin Can API Data Capture – the learner, tools and activities
12
Figure 5: Capturing different learning experiences – the activities
Tin Can API
Tin Can API (Experience API or xAPI) enables capturing of all the learning
events that are happening, and allows forming a complete picture of an individual’s learning experiences. It is a specification for learning technology
that makes it possible to collect data related to the wide range of experiences a person has (both in online and offline mode). This API captures data in a standard and consistent format about a learner or group’s
activities from many different technologies. Different systems are able to securely communicate by capturing and sharing these streams of
activities using Tin Can’s vocabulary. Simulations, games, activities, mobile learning, social/collaborative learning and offline learning are few examples that are recognized and communicated well with the Tin Can API. With the
help of big data and new technology such as Tin Can API, one can know more about their learners and their behavior patterns than ever before.
People learn from contents (books, games, simulations etc.), by interacting with other people and beyond. These actions can happen at anytime and
anywhere, signaling an event where learning could occur. All of these can be recorded using the Tin Can API. The application sends secure statements in
the form of “Noun, verb, object” to a Learning Record Store (LRS) whenever an activity is to be recorded. Learning Record Stores records all of the
statements made in a consistent manner. An LRS can share these statements with other LRSs. Moreover, an LRS can exist on its own or inside an LMS.

13
Freedom with Tin Can API
Statement freedom
The structure of “statements” using nouns, verbs and objects lets
one record almost any type of activity. E.g. “Rishi completed test”.
History freedom The Tin Can API allows LRSs to interact with each other and share
data and transcripts with one another. Learners can have their own “personal data lockers” with their personal learning information
inside them.
Device freedom
Any enabled device (mobile phones, activities, simulations, games,
etc.) can send Tin Can API statements. A constant network connection isn’t necessary — occasional connectivity is fine.
Workflow freedom
Tracking learning events doesn’t necessarily need to start and end with an LMS, it can start wherever the learner is and on any
preferred device. The content isn’t tied to an LMS.

14
Chapter 4
eLearning Stakeholders
Publisher
Figure 6: Publisher
Publishers use analytics for measuring the effectiveness of their online and digital strategies. Analyzing such data helps publishers determine the best method of delivering content to learners, while also providing them the
tools necessary to make decisions about which formats best support their content. This information also provides valuable insight into the
effectiveness of social networks, which delivery mechanisms serve certain products best and what types of apps should be developed to match those needs.
Analytics helps Publishers in the following ways:
Be aware and stay in control of the most widely visited content – time spent across various content – books, activities, audios, videos, games, simulations etc.
Allows understanding of how the learners are digesting the information and which learning needs appeal the most to them. E.g. it allows
determining if a reality-based scenario is more effective than a text-based problem solving activity.
Enables to pinpoint areas that may need to be fine-tuned within the
eLearning course or module. E.g. if multiple learners are taking an excessive amount of time to finish a particular learning module, this
means that the module needs to be improved to make it more manageable for the learners.
Analyze trends on sales, licenses usage (assigned vs. activated), content, download, preferred devices and content store performance.
Get analytics on social learning as to which eLearning modules or links
are shared with other learners. E.g. one can determine which link was shared via Facebook the most.

15
Use the knowledge to come up with eLearning courses that truly engage the learners
Data is received almost instantly, rather than having to wait for long periods of time to receive assessments. Publishers can begin
implementing changes or utilizing the data to fine-tune their eLearning strategy right away.
Based upon patterns, the publisher has the power to predict where
learners may struggle or excel. This allows them to develop their eLearning courses so that learners get the chance to achieve the best
possible results.
MagicBox (http://www.getmagicbox.com/), a cloud hosted content
distribution platform from Magic Software provides various analytic reports some of which are described below.
Figure 7: Most Engaging Books Report

16
Table 1: Most Engaging Books Report
The ‘Most Engaging Books Report’ displays the content that has been accessed for
maximum amount of time. Any time spent on assets such as audio, video and activity within the books can also be captured and included as part of the report. This report gives a view of the content most widely used across different users.
Figure 8: Top Sellers Report

17
Table 2: Top Sellers Report
The ‘Top Sellers Report’ is useful for publishers to view the content that generated
maximum revenue along with the number of units sold. Y-axis represents both the number of units (left of Y-axis) as well as the revenue (right of Y-axis).
Figure 9: Sales Report

18
Table 3: Sales Report
The ‘Sales Report’ helps publishers to view the sales made through purchase
orders (PO) to schools or through the eCommerce store on a daily basis. The sales through PO and eCom are clubbed and displayed for individual dates for publishers to get the sale amount per day.
Figure 10: License Activation by School Report

19
Table 4: License Activation by School Report
The ‘License Activation by School Report’ is useful for publishers to see the number
of licenses sold to a school vs. the number of license activation done. If there are schools that have purchased licenses and publishers see that activation count is
quite low, the publisher can contact the school to identify any potential issues.
Figure 11: Download Trends Report
20
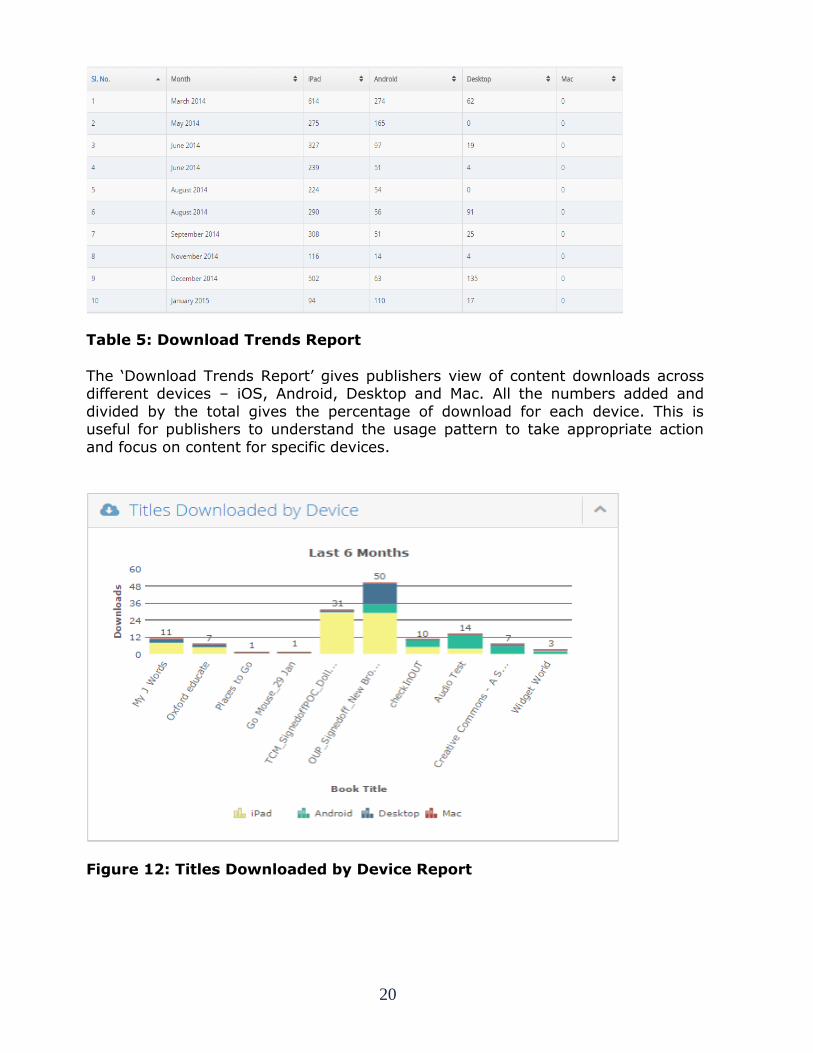
Table 5: Download Trends Report
The ‘Download Trends Report’ gives publishers view of content downloads across different devices – iOS, Android, Desktop and Mac. All the numbers added and
divided by the total gives the percentage of download for each device. This is useful for publishers to understand the usage pattern to take appropriate action
and focus on content for specific devices.
Figure 12: Titles Downloaded by Device Report

21
Table 6: Titles Downloaded by Device Report
The ‘Titles Downloaded by Device Report’ provides a view of downloads of
individual content across different devices – iOS, Android, Desktop and Mac.
Figure 13: All Downloads Report

22
Table 7: All Downloads Report
The ‘All Downloads Report’ shows download for all the content segregated as:
Folio Downloads: Displays the number of times the download was
completed.
Download Errors: Displays the number of times content had a failed
download attempt.
Cancelled Downloads: Displays the number of times a content download
was cancelled by the user.
Figure 14: Content Browsed Report
Table 8: Content Browsed Report
The ‘Content Browsed Report’ shows the number of times an end user has viewed resources, ads or articles. The default dashboard report can be further drilled down to generate a report for a custom date range and at school level.
Figure 15: Heat Map (average time spent across pages) Report
The ‘Heat Map Report’ shows the time spent by a user across different pages of the book. The areas with dark patches are the ones where maximum time has been
spent.
23
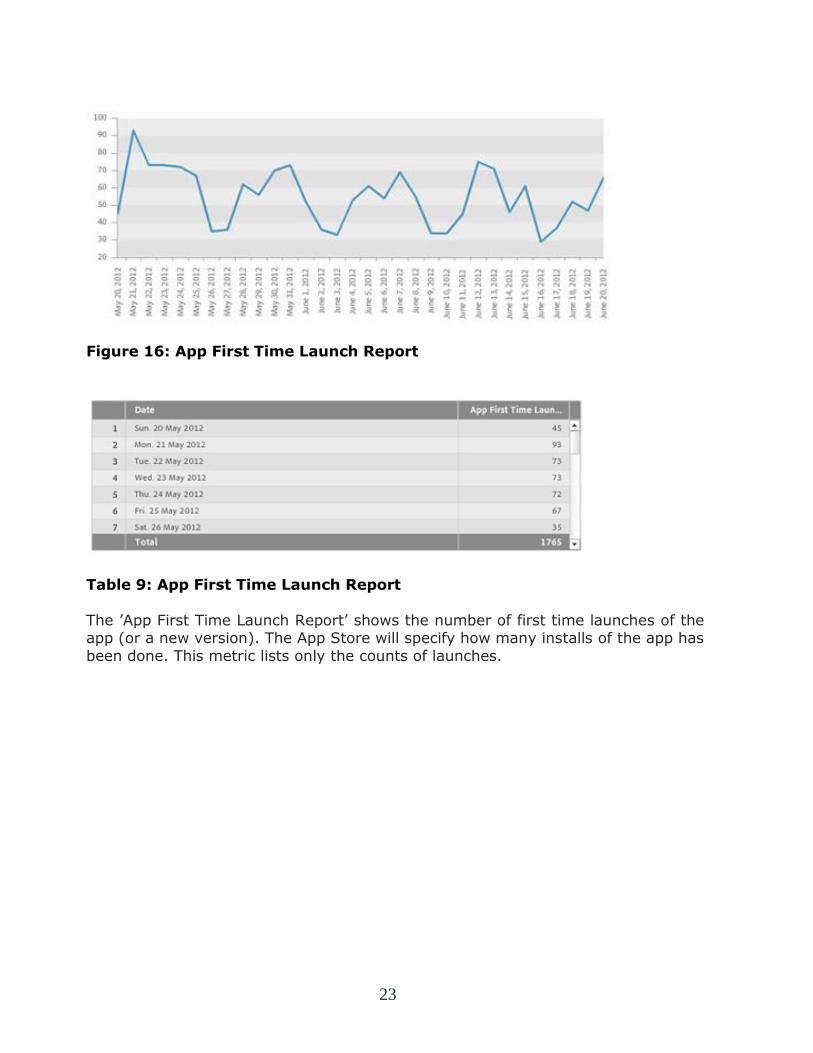
Figure 16: App First Time Launch Report
Table 9: App First Time Launch Report
The ’App First Time Launch Report’ shows the number of first time launches of the app (or a new version). The App Store will specify how many installs of the app has
been done. This metric lists only the counts of launches.

24
School Administrator
Figure 17: School Administrator
Using learning analytics, Schools can monitor the performance of teacher’s teaching methodology and students regarding drop-out and graduation rate
at a granular level. In this way, they can evaluate their courses and improve outcomes of their courses.
Analytics helps School Administrators in the following ways:
Get report on and analyze engagement trends for school content
Student retention - determine when students may be at risk of failing and in which courses this is more likely to happen and help send
resources to where they are needed most and plan resources for the future
Teacher success - determine where teacher interventions have encouraged students to achieve beyond their expected outcomes
See the usage of licenses - number of used, unused and expiring
licenses for schools
Who are the most active users
Figure 18: Most Engaging Books Report

25
Table 10: Most Engaging Books Report
The ‘Most Engaging Books Report’ displays the content that has been accessed for
maximum amount of time. Any time spent on assets such as audio, video and activity within the books is also captured and included as part of the report. This report gives a view of the content most widely used across different users.
Figure 19: Academic Performance Report
Table 11: Academic Performance Report

26
The ‘Academic Performance Report’ is primarily for District Administrators to view the overall performance across different schools within a district. They can in turn
filter the report by Year, Class and Subject.
Figure 20: District Enrollment Report
Table 12: District Enrollment Report
The ‘District Enrollment Report’ helps district administrators get an overall insight into enrollment across different subjects within a school and in a particular year. This is further classified into male and female students.

27
Teacher
Figure 21: Teacher
Teachers can use analytics reports for various different needs. They can be provided with course monitoring systems that inform them about knowledge gaps of particular students and thus enable them to focus their
attention on those students. They can also identify areas where students need more attention and areas that they need to change their way of
teaching. Analytics helps Teachers in the following ways:
Identify the most engaging content for the students
Keep track of the status of assignments and assessments Assignment submission patterns – get details on difficulty level of the
questions
Percentage of books read by students Analytics help identify the weak areas for students that teachers needs
to focus on Track and analyze the pages students revisit often Frequency of blog posts by students
Track the sections students recommend to peers Student participation - determination of the timing when a student
withdraws from or re-enrolls in a course Understand the learning styles they prefer Understand the time of day students learn the best

28
Figure 22: Most Engaging Books Report
Table 13: Most Engaging Books Report
The ‘Most Engaging Books Report’ displays the content that has been accessed for
maximum amount of time. Any time spent on assets such as audio, video and activity within the books is also captured and included as part of the report. This
report gives a view of the content most widely used across different users.
29
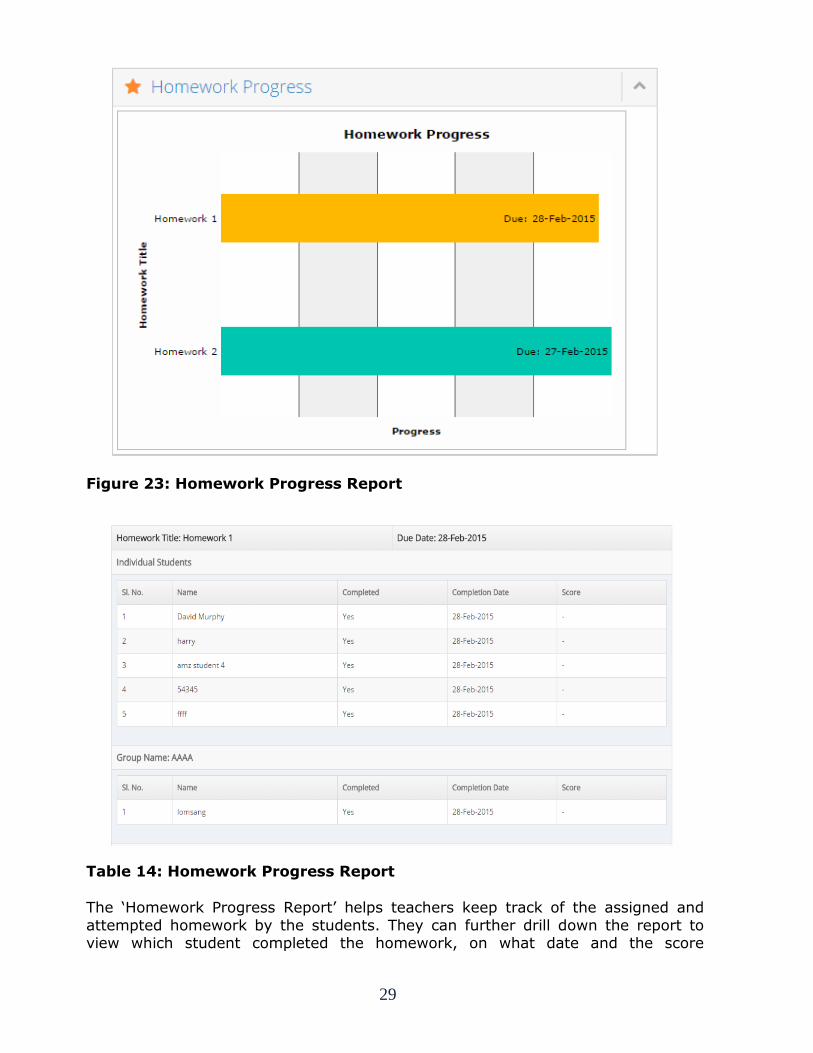
Figure 23: Homework Progress Report
Table 14: Homework Progress Report
The ‘Homework Progress Report’ helps teachers keep track of the assigned and
attempted homework by the students. They can further drill down the report to view which student completed the homework, on what date and the score

30
obtained. Teachers can then send reminders to students who have not completed the homework.
Figure 24: Heat Map (average time spent across pages) Report
The ‘Heat Map Report’ shows the time spent by a student across different pages of the book. The areas with dark patches are the ones where maximum time has
been spent. This helps teachers to understand where students are spending maximum time and if they need help to understand the topic.

31
Student
Figure 25: Student
The Student Analytics Report is meant to provide a profile of an individual’s performance over the entire duration of a course. When a learning course is
first initiated, the student report contains no data because there’s isn’t any activity; the report automatically expands as the student engages in the write-review-rewrite cycle.
The report is an aggregate of a student’s performance trending over time.
It is meant to give instructors insight into the individual and provide benchmarks for comparisons against class averages. Its companion report i.e. the course analytics report, provides similar type of information but at
course averages and not individuals.
Furthermore, students can be provided with personalized recommendations for suitable learning resources or learning paths.
Analytics helps students in the following ways:
Get insight into most engaging content so they can pick content that seems most interesting
Understand how one compares to others in their class to introduce a
competitive element Understand how one is doing against the progress goals set to
determine what to do next View details of assignments and assessments - assigned, attempted
and score obtained
Insight into percentage of book read Social learning - determining the level at which a student is
interacting, which can be used to direct them to opportunities for communication and collaboration
32
Figure 26: Social Learning
Learning from the initial days has been a social activity. Workplace Learning too has a strong social element. Across conference rooms, cubicles, coffee breaks, at the water cooler – social interactions occur continually that form the building
blocks of learning within the workplace. These informal instances of learning are not logged into a system or even structured in any way. With the help of
technology, it is now possible to facilitate social interactions and derive meaningful learning out of them. This makes social interactions possible between a larger group surpassing geographical boundaries. It is a medium that allows learners to
interact, share ideas, seek inputs and enhance their knowledge.
Figure 27: Student Engagement
A key analytic report is measuring student’s engagement level. In this report, the students are displayed as nodes and the number of interactions between them is
linked by lines. Most active students appear at the center along with multiple connections, while less active students appear as sparsely connected dots on the

33
outside of the cloud. As the number of connections increases, the relative size of the dot increases. The plot clearly specifies who is busy, but there is no indication
of the intellectual value of the postings.
The Analytics tool also tracks a student’s usage of content (eBooks, audios, videos,
games, simulations), including page views, time spent accessing the app, number of highlights made, notes taken, etc. and notifies the teacher of that student’s “engagement score".

34
Chapter 5
Challenges, Obstacles and Opportunities
Digital learning has its own set of benefits and drawbacks. In spite of the enormous potential digital learning holds to improve education, learning analytics
have their own share of concerns. Data ownership and privacy for learners and teachers is a critical issue. Analytics provides a means to improve learner success and to evaluate and critique the performance of teachers. Data access and
ownership are important issues with regard to who should be able to see the analysis that schools perform on learners.
According to the 2010 National Education Technology Plan - “Every parent of a student under 18, and every student 18 or over, should have the right to access
the student’s own assessment data in the form of an electronic learning record that the student can take with them throughout his/her educational career. At the same
time, appropriate safeguards, including stripping records of identifiable information and aggregating data across students, classrooms and schools, should be used to make it possible to supply education data derived from student records to other
legitimate users without compromising student privacy.”
Challenges with eLearning
Lack of human interaction eLearning is primarily delivered via computers and most recently
over mobile devices such as tablets and phones. There is almost no human interaction involved and this may demotivate the learners as they may find such kind of learning as alienating.
Low motivation
Most of the learners find the online learning as boring and lose motivation. This is one of the prime reasons there are so many
articles nowadays on how to keep learners engaged and motivated.
Lack of focus In a class environment there is very little distraction and can only
be through the peers. However, in case of eLearning there are many distractions as there are many items within the reach of learners – computers, laptops, tablets, mobiles, etc.
The biggest challenge facing the eLearning industry is the security and data privacy. eLearning systems have been in a growth trajectory but there has been very little focus on ensuring the security of eLearning data. Security is an
important challenge for eLearning considering that it is available over the network and accessed via different users. The design needs to allow only

35
authorized users to be able to access intended information. It is important to safeguard personal and confidential information of users.
MagicBox stores passwords as MD5 encrypted and within a secured database
that has restricted access. All the contents are AES 256 encrypted. Production systems are behind a secure firewall of Amazon and the communication with the system is done using a secure channel.
Most countries have come up with their own set of laws to deal with the
information collected from children and their privacy. Mostly the eLearning applications are used by children and it is important to comply with the law to ensure data protection.
We’ll have a look at two such federal laws that are applicable in the US and
concerns data collected from kids – COPPA and FERPA.
Children’s Online Privacy Protection Act (COPPA)
COPPA is a US federal law that applies to online collection of individually identifiable information from children below 13 years of age.
The law relates to information that must be included in a privacy policy, taking consent from parent or guardian and the responsibilities of the operator to
protect children’s privacy and restrictions on marketing, using this data. Since eLearning primarily concerns learners and most of this falls in the bracket of
students from K-12, this law applies to the data collected from children in eLearning and the way that data is used.
The personal information may include one or more of the following data collected online from children:
First and Last Name Email address
Phone number Social security number
Physical address Any other information that allows for identifying or contacting the child
All applications including eLearning that is targeted to children should comply with COPPA regulations as described below. The rules state what a website
operator must include in a privacy policy in their website, seek verifiable consent from a parent and ensure the operator responsibilities to protect children's privacy and safety online.
a) Privacy Policy
Post a link to privacy policy on home pages and all other pages where personally identifiable information is being collected
Privacy policy should contain:
o Contact details of the operator collecting the data
36
o Kinds of personal data being collected o How the personal information will be used
o Whether the personal information will be shared with third parties and how will it be protected
o Ability for parent/guardian to agree to the collection and use of data
b) Notice to parents
Parents should be notified of the information being collected for the child and this should not be ambiguous
c) Parental consent Parent has the ability to approve or reject the request for capturing information related to the child
d) Internal uses In case the personal information collected is used for internal purpose
only, an email, letter or phone approval should be sufficient e) Public disclosures
In case the personal information collected is to be disclosed to a third
party or made public, a more stringent approval process is required such as signed form from parent, email accompanied by digital
signature, etc. f) Disclosure to third parties
In case the personal information collected is to be disclosed to a third party, the parent must be provided an option to agree to the collection and use of the child's personal information without agreeing
to the disclosure of the information to third parties
Family Educational Rights and Privacy Act (FERPA)
FERPA is a US federal law to protect the privacy of student education records. It applies to all schools that receive funds under an applicable U.S. Department of
Education program. The law provides parents with certain rights related to children's educational
records. The rights get transferred to the student when they reach the age of 18, or attend school beyond the high school level.
Parents (or eligible students) have the right to inspect the educational
records of students maintained by the school.
Parents (or eligible students) have the right to request the school to
correct records of students that they believe to be inaccurate. If the
school still decides not to amend the record, the parent (or eligible
student) has the right to a formal hearing.
Schools must have written permission from the parent (or eligible
student) to release any student information from an educational record.
However, FERPA permits schools to disclose such records, without
consent, to the following parties or under the following conditions:

37
o School officials having legitimate educational interest
o School to which a student is getting transferred
o Specified officials for audit purpose
o Appropriate parties involved with financial aid to a student
o Organizations conducting studies on behalf of the school
o Accrediting organizations
o To comply with a judicial order
o Appropriate officials for cases related to health and safety
emergencies
o State and local authorities, within a juvenile justice system
Schools must notify parents and eligible students annually of their rights under FERPA. Schools may disclose, without consent, certain information such as a student's name, address, phone number, date of birth, place of birth, awards,
and dates of attendance.
With all such obstacles and restriction in place, the analytics in education domain needs to evolve and ensure none of the guidelines and restrictions is breached.
Opportunities with eLearning
Evolve and adapt
As the software and technology keeps evolving, it is quite easy to
adapt and create a new set of learning tools such as videos, games, simulations etc. that allow evolving over a period of time
and increase efficiency and efficacy of learning.
Anytime anywhere learning
With the availability of online learning materials and tools on mobile devices, learners can access and browse through learning
content almost from anywhere and at any time, such as during commute, at leisure, etc.
Analytical reports All data that is accessed by learners can be tracked to create
useful analytical reports that help in the learning and growth of the learners and to improve the content.
Data management Digitization eliminates the need to capture and record data in
paper form. The data can now be stored in databases, learning record stores and other means and can be secured and made available anytime to create analytical reports.

38
Chapter 5
Digital Rights Management
Digital Rights Management (DRM) plays an important role in the management of licensing and authorized content distribution and restricts the consumers from
duplicating or distributing purchased content. DRM was implemented to prevent rapid growth in online piracy of commercially marketed materials. DRM prevents
copying, defines a time period in which the content can be accessed, and restricts the number of devices on which the media can be installed.
Content creators are the owners of digital content and users/consumers have the license to use rather than own the content. Uses of DRM (such as restrictive license
agreements and encryption) reward the creators of digital media for their work. The Digital Millennium Copyright Act of 1998 empowered DRM by criminalizing the creation and dissemination of technologies that allow users to bypass copyright
protection methods. The intent of DRM is to control copying, viewing, printing and altering of works without the necessary permissions.
Figure 28: License Expiration
Digital Rights Management Techniques incorporates: Restrictive Licensing
The access to digital contents and copyright is controlled by imposing restrictive
licenses on users as a condition for entering a website or downloading software/content.
MagicBox uses its own set of DRM developed internally.
The number of activations restricts users from using the application and
accessing contents on more than the number of devices specified. E.g. The
‘No. of activation’ as ‘6’ means though the application can be installed on
multiple devices, however, the first 6 devices on which the user logs-in will
cause the license to be activated and cannot be further used/activated on
any other device.
39
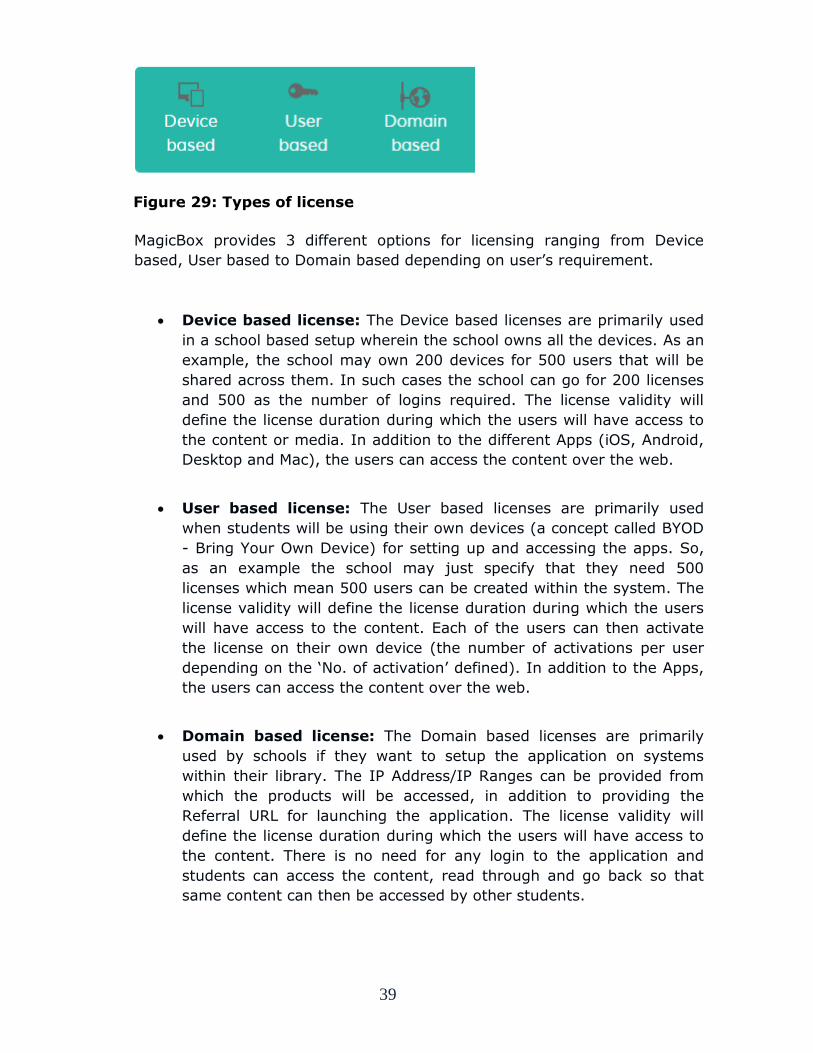
Figure 29: Types of license
MagicBox provides 3 different options for licensing ranging from Device
based, User based to Domain based depending on user’s requirement.
Device based license: The Device based licenses are primarily used
in a school based setup wherein the school owns all the devices. As an
example, the school may own 200 devices for 500 users that will be
shared across them. In such cases the school can go for 200 licenses
and 500 as the number of logins required. The license validity will
define the license duration during which the users will have access to
the content or media. In addition to the different Apps (iOS, Android,
Desktop and Mac), the users can access the content over the web.
User based license: The User based licenses are primarily used
when students will be using their own devices (a concept called BYOD
- Bring Your Own Device) for setting up and accessing the apps. So,
as an example the school may just specify that they need 500
licenses which mean 500 users can be created within the system. The
license validity will define the license duration during which the users
will have access to the content. Each of the users can then activate
the license on their own device (the number of activations per user
depending on the ‘No. of activation’ defined). In addition to the Apps,
the users can access the content over the web.
Domain based license: The Domain based licenses are primarily
used by schools if they want to setup the application on systems
within their library. The IP Address/IP Ranges can be provided from
which the products will be accessed, in addition to providing the
Referral URL for launching the application. The license validity will
define the license duration during which the users will have access to
the content. There is no need for any login to the application and
students can access the content, read through and go back so that
same content can then be accessed by other students.

40
Encryption
Encryption controls the access and reproduction of digital content including backup
copies for personal use. MagicBox uses Advanced Encryption Standard (AES) 256
encryption standards for the protection and copying of electronic data. AES has
been established by the U.S. National Institute of Standards and Technology
(NIST). The AES algorithm is a symmetric-key algorithm i.e. the same key is used
for both encrypting and decrypting the data. All MagicBox content available for
offline reading is AES-256 encrypted and security cannot be bypassed even if
someone gets access to the content.
Figure 30: Content Encryption

41
Summary
For many school districts, “data analytics” is still a manual process of individually extracting reports from multiple source systems and then patching together the
information into a format that will be useful in decision-making. The challenge lies in delivering the data and analytics tools so they can be used within the schools for making decisions about curriculum, learning resources, teaching methods and
student’s progress.
Data and analytics tools are fundamental to predictive and prescriptive instruction models. Most of the existing models focus on capturing data and information that can be applied in the classroom for predicting progress and deriving positive
outcomes for individual students. The models also use data to identify learning needs for students and help teachers address them. Following are couple of
examples of the predictive and prescriptive models: 1) An early warning indicator system (EWIS) to predict school/college readiness and prevent dropouts.
2) The Florida Assessment for Instruction in Reading (FAIR) to predict a student’s potential for future academic success.
The time is perfect for districts and K-12 schools to move beyond simply
generating statistics and reports that are viewed once and forgotten. Analytics methodology implementation would help educators put data to constructive use that will lead to better individual performance and learning outcomes.
As of now, there are pockets of good analytics practices and the challenge lies in spreading this good practice to benefit more institutions.
Delivering access to educational data and analytics to all requires a solid action plan with several elements as detailed below.
Evaluation and planning - Review the existing data sources and
information systems, and then develop a system integration plan at the district level that will help better information delivery at the school level.
Partnerships - Identify and begin work with partners for systems
integration. Look forward to district/state education departments and
analytics providers for their product offerings and consulting services to support the work.
School based data teams - Create teams within the schools to evaluate
the data received; identify the needs indicated by the data, and make
collective decisions related to school-level actions and changes.
Teacher training and support - Provide training and support to teachers in using data analytics to improve instruction for the class as a whole and for helping the students. Principals may at times need training
on how to give meaningful, data-based feedback to teachers.

42
Abbreviations
Term Description
AES Advanced Encryption Standard
BYOD Bring Your Own Device
COPPA Children’s Online Privacy Protection Act
DRM Digital Rights Management
EDM Educational data mining
EWIS Early warning indicator system
FAIR Florida Assessment for Instruction in Reading
FERPA Family Educational Rights and Privacy Act
LA Learning Analytics
LMS Learning Management Systems
LRS Learning Record Store
NIST National Institute of Standards and Technology
PO Purchase Order
xAPI Experience API

43
References
[1] Ackermann, F., Eden, C., and Cropper, S. (2004). Getting Started with Cognitive Mapping.
[2] Richards, G. & Devries, I. (2011). Revisiting formative evaluation: Dynamic
monitoring for the improvement of learning activity design and delivery. Proceedings Learning Analytics and Knowledge (LAK11). Banff.
[3] Richardson, J. C., Newby, T. (2006). The role of students’ cognitive
engagement in online learning. American Journal of Distance Education,
20(1) 23:37
[4] http://elearningindustry.com/ [5] http://radar.oreilly.com/2011/07/education-data-analytics-learning.html
[6] http://tech.ed.gov/wp-content/uploads/2014/03/edm-la-brief.pdf
[7] https://net.educause.edu/ir/library/pdf/ELI3026.pdf
[8] http://tincanapi.com/
[9] http://www.coppa.org/ [10] http://www2.ed.gov/policy/gen/guid/fpco/ferpa/index.html
[11]https://salvetore.wordpress.com/2012/07/26/analytics-getting-helpful-
information-out-of-an-lms/ [12]http://www.academia.edu/779650/Measuring_Engagement_Learning_Anal
ytics_in_Online_Learning
[13]https://salvetore.wordpress.com/2012/07/26/analytics-getting-helpful-information-out-of-an-lms/
[14]http://cmapspublic3.ihmc.us/rid=1KC16KK3Y-1DGTX1Y-H2/KG-%20OpenLearningAnalytics.pdf
[15]http://www.hmhco.com/~/media/sites/home/Teachers/Files/HMH-
CDE_Issue%20Brief_DataAnalytics.pdf