data analysis and research 2012 slds grant
DESCRIPTION
Data Analysis and Research 2012 SLDS Grant. Marilyn Peterson and Russ Masco Nebraska Department of Education Data Conference April 29-30, 2013. Goals of the 2012 Grant. Provide a dashboard for districts Provide professional development in data use and analysis to every district - PowerPoint PPT PresentationTRANSCRIPT
NE Data Analysis and Research 1
Data Analysis and Research2012 SLDS Grant
Marilyn Peterson and Russ MascoNebraska Department of EducationData Conference April 29-30, 2013
NE Data Analysis and Research 2
Goals of the 2012 Grant
1. Provide a dashboard for districts2. Provide professional development in data use
and analysis to every district3. Establish a research and evaluation section
within the Nebraska Department of Education4. Activities to support NSSRS– Documentation for the system – data governance,
data dictionary, metadata– eScholar Interstate Locator
NE Data Analysis and Research 3
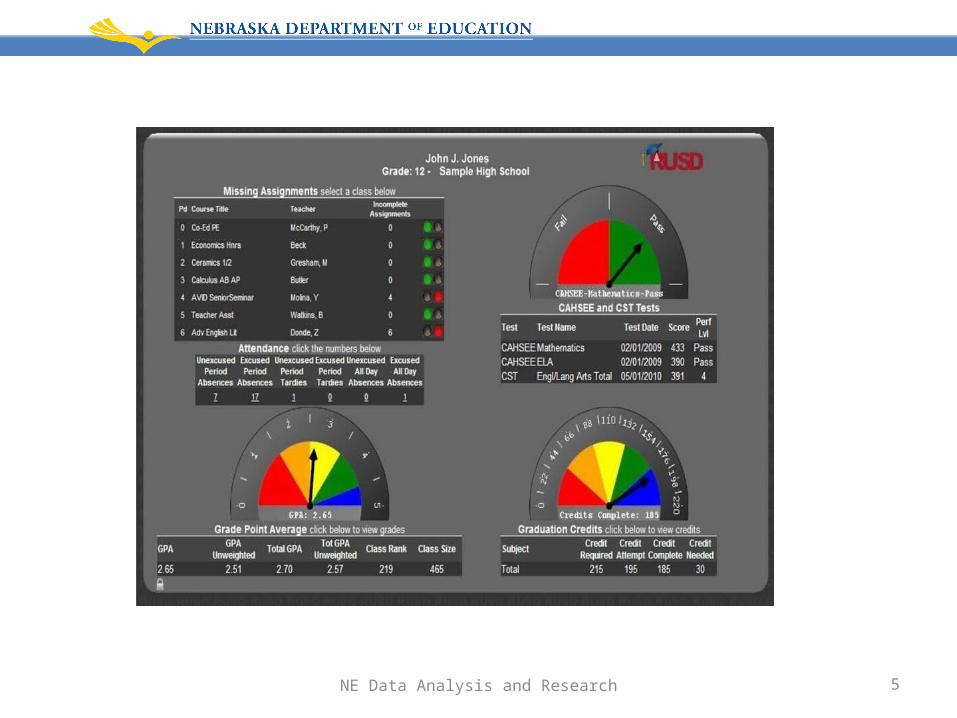
Dashboard
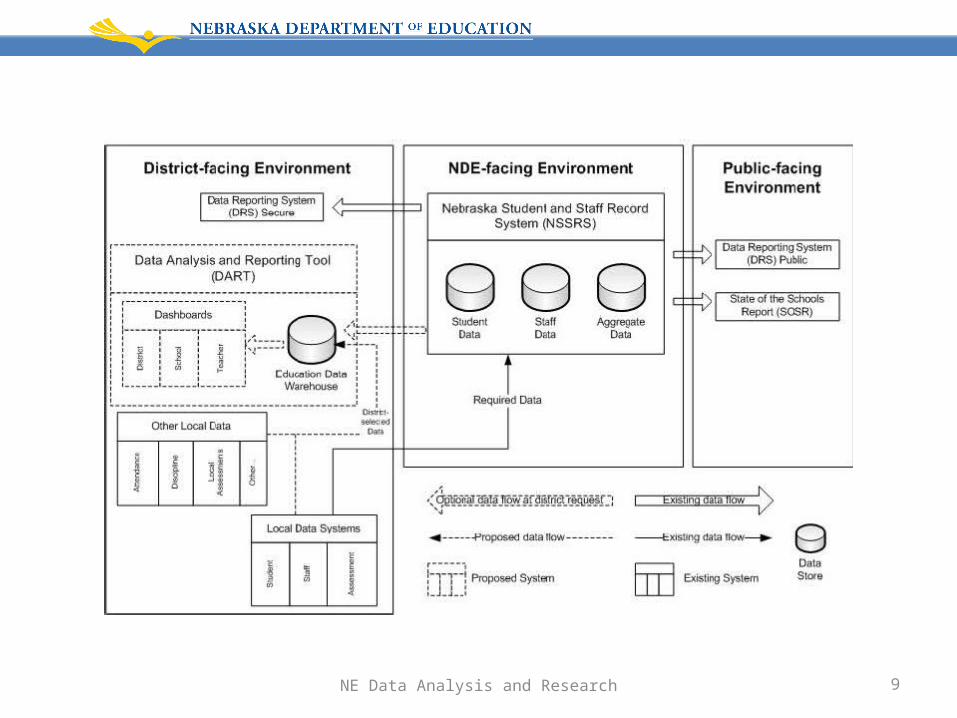
A data analysis tool for districts that uses multiple local and state data sources to produce reports for local decision makers.
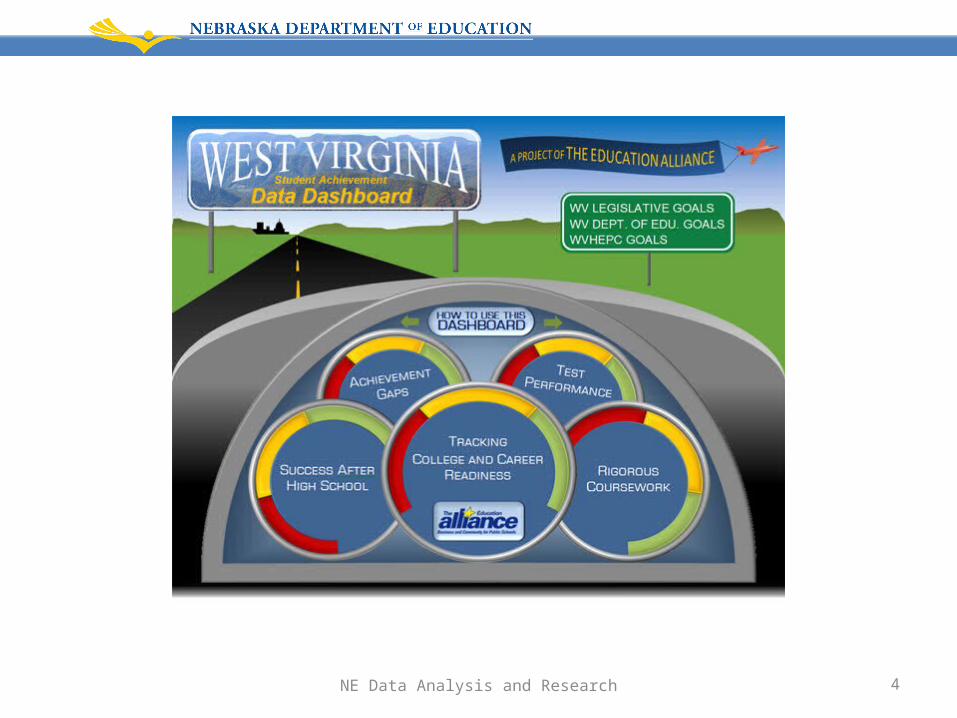
Data Analysis and Reporting Tool (DART) – Adopting the Ed-Fi Alliance dashboard tools– Using Nebraska data to answer Nebraska’s
questions– Optional for districts
NE Data Analysis and Research 4
NE Data Analysis and Research 5
NE Data Analysis and Research 6
Ed-Fi Alliance Information
• http://www.ed-fi.org/
Other Sites: • http://
www.doe.k12.de.us/EdInsight/files/Elem_Classroom_Set.pdf
NE Data Analysis and Research 7
Data Dashboards
• Compile key pieces of information in a simple and easy to interpret display
• Present data so one can quickly and visually see status or progress, etc.
• Combine data from various streams, including state and local, to present a clear and comprehensive picture
NE Data Analysis and Research 8
Nebraska’s dashboard
• Store the local and state data in a holding box at the NDE that is separated from all other NDE data
• Pull data from district systems to load and the holding box daily
• Provide secure access at teacher (classroom), building, and district levels
NE Data Analysis and Research 9
NE Data Analysis and Research 10
NSSRS and the Dashboard
• NSSRS is a warehouse – Data entered only at specified times, summary or end-
of-year data– All NSSRS collections continue
• Dashboard data must be real-time data– More and different data needed– Dashboard will “pull” the data from the district
systems– Only the district submitting the data can see their data
NE Data Analysis and Research 11
Design Team
• Districts or ESUs wanting to provide input into the data selected for the dashboard must– Commit to holding a meeting of classroom teachers
and administrators before the end of this school year– NDE will provide agenda, instructions and process– Brainstorm ideas and make recommendations– Design Team leader will take ideas, complete an
inventory on a file we provide and submit it– NDE will analyze all district input to identify the
highest priorities
NE Data Analysis and Research 12
Pilot Districts
• Will be asking for districts to volunteer to pilot the dashboard– Must contribute staff time to help adopt the Ed-Fi
dashboard (Assembly Team)• SLDS grant will pay for staff time• Estimated time – still uncertain• Starting this summer
– Work on standardizing data to be in dashboard– Use their data to develop prototype
NE Data Analysis and Research 13
Proposed Timelines
• Development– Design Team• Input submitted to NDE by end of June
– Pilot Districts• Selected by this summer, begin work in the Fall
– Pilot Prototype• By end of 2013-14 school year
– Available then for any district that wants to use it
NE Data Analysis and Research 14
Challenges --
• Data from districts is pulled daily– Districts may not update their data daily
• Standards are needed for data stored by the district– Other data not in NSSRS may not have standard
definitions• Districts have different information systems– At least a dozen different systems for student data
• Dashboards use data that may not be electronically stored– Classroom teacher and student pictures for example
NE Data Analysis and Research 15
Advantages --
• Problems with data are found early when data is updated to dashboards daily
• May be (big maybe) someday NDE will be able to pull NSSRS data that it needs from the dashboard warehouse and then districts would not need to submit
NE Data Analysis and Research 16
Other SLDS Activities
• Research and Evaluation Team– Establishing a team within NDE – Support and conduct research and evaluation
• Documentation– Data Governance Plan, Data Dictionary aligned with
Common Education Data Standards (CEDS), Metadata• Interstate Locator– An eScholar module that finds students who move to
other states in the project (Iowa, Kansas, Missouri)
Due Dates and Data Changes
• NEW processes – Every Due Date will be followed by an Auditing
Window• A period of time when data can be changed before it is
considered final• Announced on the Master Calendar and other calendars
• Requests– When Due Dates are missed and Data Changes are
needed after it is considered final– Requests found in the Consolidated Data Collections
• Statewide model of professional development centered around the use of data for continuous school improvement
• Collaborative model between NDE, ESUCC, and ESUs
• Focus on the analysis of data to inform professional development, instructional practices, evaluation processes and school improvement
SLDS Grant Goal 2Also known as “Data Cadre”
Centered Arounda Framework that assists in
• Understanding how to interpret a variety of data
• Determining the factors that may explain what the data show
• Arriving at appropriate research based responses to what the data show (PD, Interventions, programs, resources)
• Determining if the responses are or were effective
Four guiding questionsShould be a part of each action taken in education
• What do the data tell us
• Why might that be so
• How should we respond
• Was our response effective (evaluation)
Purposes of the Four guiding questions
• Feed a cycle of continuous school improvement
• Makes school improvement a continuous process and not an event centered around a certain accreditation event, audit, or other visit
• Justify the use of resources for certain programs
• Can be used to demonstrate need or to show results
• Validate strategies being used or illuminate the need to change
Building upon work/sources that have been started/used in the past
Examples but not an exhaustive list
• Data guidebook
• Data retreat protocols followed in the past
• “Data Analysis for Continuous School Improvement”Victoria Bernhardt
Task at hand is to organize various past and present work into a standard, consistent
process to be delivered statewide
• Will use a model similar to the Nebraska standards for grades K-12 (format and terms used may vary to avoid confusion with content standards)
• Standards based on the four guiding questions
• Concepts based on specific objectives
• Indicators of measureable outcomes
• Organized by levels (similar to grade levels)
Levels• Each level will go deeper and progressively expand the
skills and concepts learned
• Each level will involve work in each of the four questions
• Complete cycle of data analysis will be completed at each level
• Current work is on Level 1 future work will add levels
Advantages of standards modelallows
• Integration of the training curriculum with the dashboard and other available data tools
• Vertical and horizontal expansion of the scope as capacity and expertise are developed
• Additional indicators• Additional levels
• Distillation of existing formats, sources, and practices
Development modelDevelopment group composed of
• NDE representatives from various departments
• Group of eight professional developers from various ESUs around the state
Development group
• Meet to bring ideas representative of the practices around the state to the group
• Incorporate resources and methods from around the state into a unified presentation
• Train professional developers from all ESUs
Delivery ModelOnce the content is developed
• Professional developers from each ESU will be trained
• ESU professional developers will deliver training to key district personnel
• Key district personnel will deliver the training to the teacher level within the district
• Professional developers will follow up with districts and provide assistance with implementation after initial training
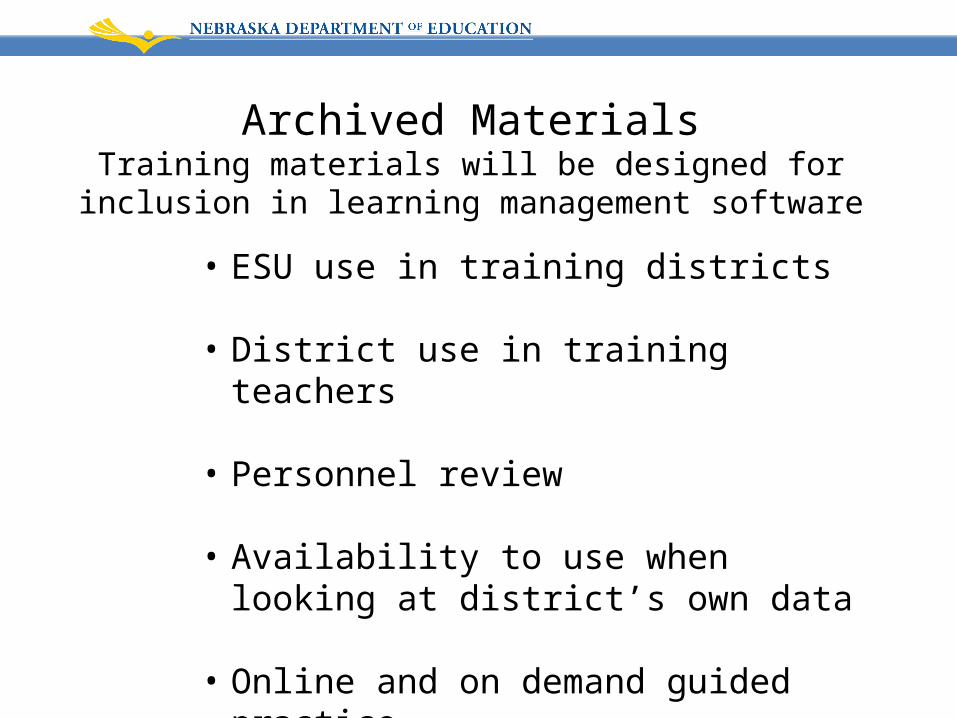
Archived MaterialsTraining materials will be designed for inclusion in learning
management software
• ESU use in training districts
• District use in training teachers
• Personnel review
• Availability to use when looking at district’s own data
• Online and on demand guided practice
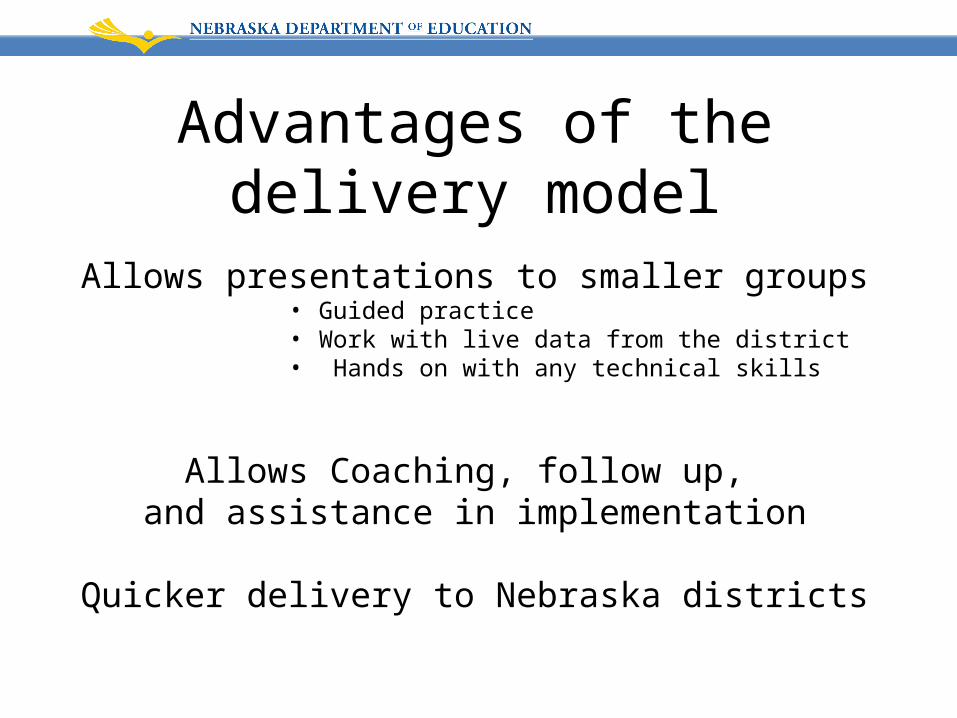
Advantages of the delivery modelAllows presentations to smaller groups
• Guided practice • Work with live data from the district• Hands on with any technical skills
Allows Coaching, follow up, and assistance in implementation
Quicker delivery to Nebraska districts
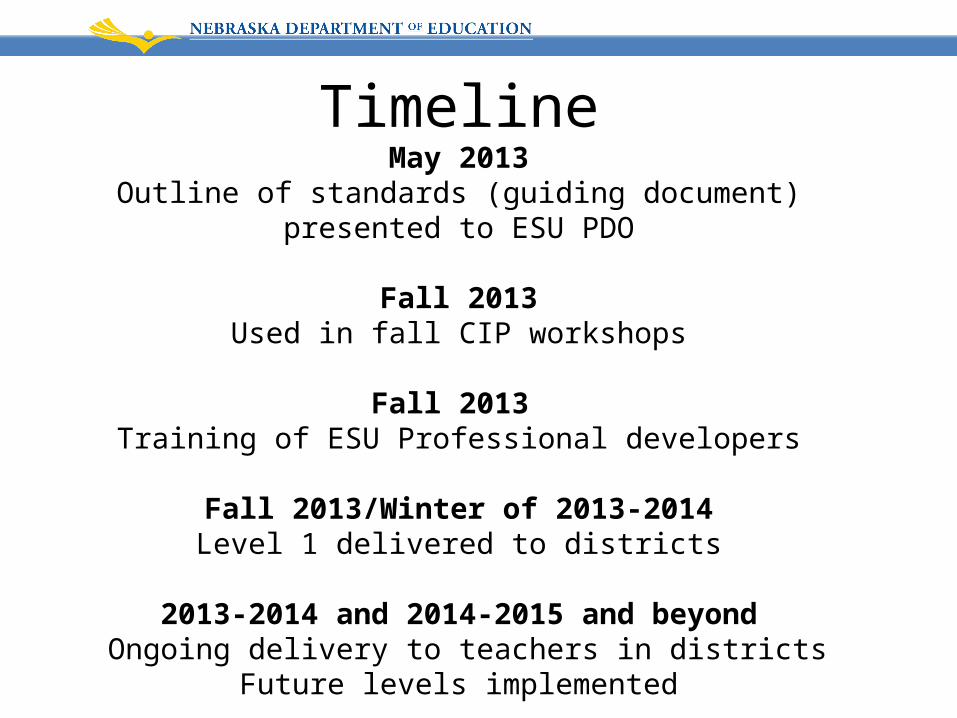
TimelineMay 2013
Outline of standards (guiding document) presented to ESU PDO
Fall 2013Used in fall CIP workshops
Fall 2013 Training of ESU Professional developers
Fall 2013/Winter of 2013-2014Level 1 delivered to districts
2013-2014 and 2014-2015 and beyond Ongoing delivery to teachers in districts
Future levels implemented
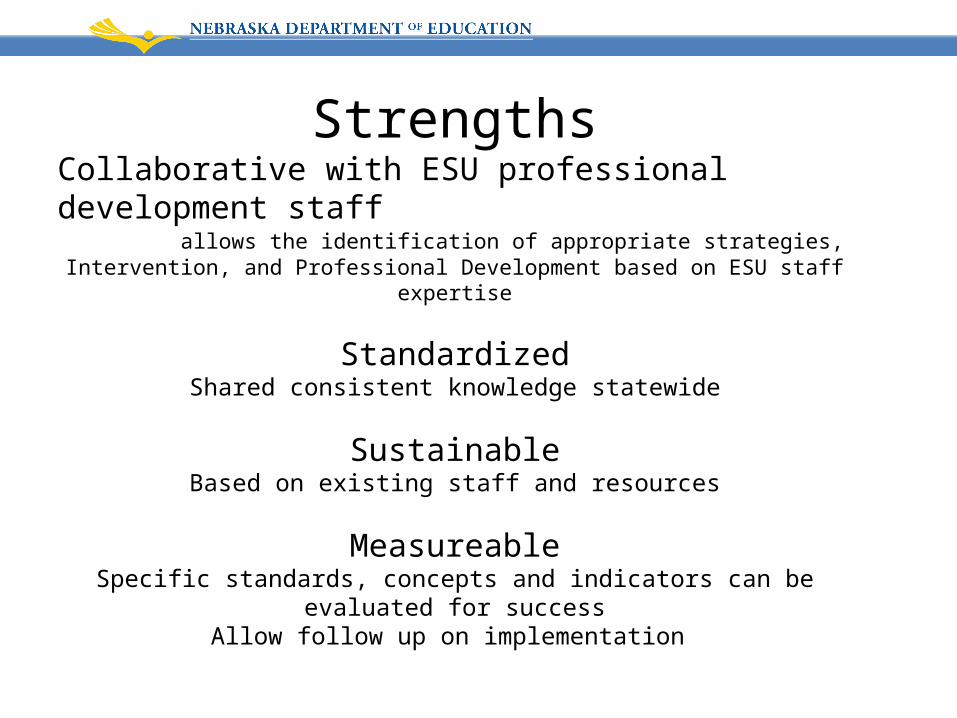
StrengthsCollaborative with ESU professional development staff
allows the identification of appropriate strategies,Intervention, and Professional Development based on ESU staff expertise
StandardizedShared consistent knowledge statewide
SustainableBased on existing staff and resources
MeasureableSpecific standards, concepts and indicators can be evaluated for success
Allow follow up on implementation
Questions?