data acquisition & processing report · 9 september 2013 data acquisition & processing...
TRANSCRIPT
9 September 2013 Data Acquisition & Processing Report
USCGC SPAR
DATA ACQUISITION & PROCESSING REPORT
Survey Year: 2013 Field Unit: USCGC SPAR (WLB-206)
Chief of Party: LCDR Michele L. Schallip
Lead Hydrographer: BM1 Michael B. Cobb
Date of most recent DAPR Completion: 26 August 2013

9 September 2013 Data Acquisition & Processing Report
2
I. INTRODUCTION ............................................................................................................................................ 3
II. EQUIPMENT .................................................................................................................................................... 4 A. VESSELS .......................................................................................................................................................................... 4 1. USCGC SPAR (WLB206) ............................................................................................................................................ 4 2. SPAR 1 (24228) ............................................................................................................................................................ 4 3. SPAR 2 (236607) .......................................................................................................................................................... 5
B. POSITIONING SYSTEMS ................................................................................................................................................ 6 1. USCGC SPAR (WLB206) ............................................................................................................................................ 6 2. SPAR 1 (24228).............................................................................................................................................................. 6 3. SPAR 2 (236607) ........................................................................................................................................................... 7
C. BATHYMETRIC MEASUREMENT ................................................................................................................................. 7 1. USCGC SPAR (WLB206) ............................................................................................................................................ 7 2. SPAR 1 (24228).............................................................................................................................................................. 8 3. SPAR 2 (236607) ........................................................................................................................................................... 9
D. SOUND SPEED MEASUREMENT ................................................................................................................................ 10 E. COMPUTERS AND SOFTWARE ................................................................................................................................... 10 1. Computers ..................................................................................................................................................................... 10 2. Wiring Diagrams ....................................................................................................................................................... 11
III. QUALITY CONTROL ................................................................................................................................... 12 A. DATA ACQUISITION .................................................................................................................................................... 12 B. DATA PROCESSING ..................................................................................................................................................... 12 C. STATIC DRAFT ............................................................................................................................................................. 12
IV. CORRECTIONS TO ECHO SOUNDINGS ................................................................................................. 13 A. DRAFT/WATERLINE MEASUREMENTS ................................................................................................................... 13 B. OFFSET MEASUREMENTS .......................................................................................................................................... 13 1. USCGC SPAR (WLB206) ......................................................................................................................................... 13 2. SPAR 1 (24228) ......................................................................................................................................................... 14 3. SPAR 2 (236607) ....................................................................................................................................................... 15
C. TIMING RESULTS ........................................................................................................................................................ 16 D. PHYSICAL DEPTH COMPARISON ............................................................................................................................... 18 1. USCGC SPAR (WLB206) ......................................................................................................................................... 18 2. SPAR 1 (24228) and SPAR 2 (236607) ............................................................................................................ 18

9 September 2013 Data Acquisition & Processing Report
3
I. Introduction
Figure 1: USCGC SPAR (WLB 206) underway.
The USCGC SPAR is a 225‐foot sea going buoy tender with a crew of 42 enlisted and 8 officers. The crew is divided into three departments who work together to form team SPAR (Deck, Operations/Support, and Engineering). The SPAR is a multi‐mission cutter whose duties include: maintenance of aids to navigation, search and rescue, maritime law enforcement, marine environmental protection and homeland security. The cutter’s primary missions are maintaining aids to navigation along the Aleutian Island Chain and Search and Rescue, but is able to meet any demands from District 17 Command to serve anyplace in Alaskan waters. SPAR uses a commercial single beam survey program to assist in marking best water for navigation. In 2012 SPAR began acquiring and processing bathymetric soundings for hydrography which meet specifications to support NOAA’s Office of Coast Survey with Alaskan charting needs.

9 September 2013 Data Acquisition & Processing Report
4
II. Equipment A. Vessels
1. USCGC SPAR (WLB-206)
Figure 2: USCGC SPAR (WLB 206)
The CGC SPAR, a Juniper-class cutter (WLB), was designed to replace the 180-foot Seagoing Buoy Tender. There are two classes of 225’ WLBs and SPAR is a B-Class vessel (hulls 206-216 built and commissioned between 2001 and 2004). The cutter is 225 feet long, 46 foot beam, and commands a 13 foot draft. Vessel endurance is 21 days un-replenished and 45 days replenished. The vessel displaces 2000 long tons at full load, runs two Caterpillar 3608 engines, and is rated to reach 6000 nautical miles at 12 knots.
2. SPAR 1 (24228)
SPAR 1 is a 24-foot Cutter Boat Large (Figure 3) used for survey, patrol, and general vessel operations. The small boat was made in 2010 by Aluminum Chambered Boats and is 24 foot in length, 9 foot beam, and draws a 14-inch draft. For survey operations, this vessel requires a crew of 2-3 personnel including a ship authorized coxswain and engineer at minimum. SPAR 1 carries 25 gallons of fuel and can survey for 4 hours at survey speeds (8-12 knots) un-replenished. The 230 HP Cummins Mercruiser engine powers SPAR 1 up to a maximum transit speed of 30.

9 September 2013 Data Acquisition & Processing Report
5
Figure 3: SPAR 1, a 24-foot multipurpose small boat carried aboard USCGC SPAR.
3. SPAR 2 (236607)
SPAR 2 is a 23-foot utility boat (Figure 4) utilized for survey and general vessel operations. The small boat was made in 2001 by Metal-shark Incorporated and is 23 feet in length, 9 foot beam, and draws a 20-inch draft. For survey operations, this vessel requires a crew of 2-3 personnel including a ship authorized coxswain and engineer at minimum. SPAR 2 carries 100 gallons of fuel and can survey for 12 hours at survey speeds (8-12 knots). A Volvo Penta engine powers SPAR II to a maximum transit speed of 30.
Figure 4: SPAR 2, a 23-foot utility boat carried aboard USCGC SPAR.

9 September 2013 Data Acquisition & Processing Report
6
B. Positioning Systems
1. USCGC SPAR (WLB-206)
SPAR uses a MX-Marine MX420 GPS receiver, coupled with a Raven Model # 063-0171-924 GPS antenna and a MX-Marine/Leica MX-525 DGPS beacon receiver to acquire positions with a rated accuracy of 2 meters or better 95% of the time when within range of a DGPS beacon. When not in range of DGPS beacon positions have a rated accuracy of 5 meters 95% of the time. SPAR technicians configure NMEA 0183 output sentences (GGA and VTG) which broadcast from the GPS Positioning System and are logged in the acquisition software HYPACK. Onboard, this equipment is utilized for positioning aids to navigation and the CAPN’s Program Navigation Software. The DGPS unit is configured in auto mode to pick up the closest DGPS beacons for correctors. SPAR GPS units undergo quality assurance testing ISO 9001 from the Electronics Repair Facility in Baltimore, MD. Unit technicians verify proper operation by performing a System Operation Verification Test (SOVT) that has been prepared by the Command, Control, and Communication Engineering Center (C3CEN) in Portsmouth, VA.
Figure 5: MX420 GPS receiver left (S/N 00805337) and MX-525 DGPS receiver right (S/N 0340-13002-0114)
2. SPAR 1 (24228) SPAR 1 uses a Furuno GP‐37 GPS/DGPS Chart Plotter (S/N 4429‐2485), coupled with a Furuno Model # GPA 019 GPS antenna (S/N 031835), to acquire positions with a rated accuracy of 5 meters or better 95% of the time when within range of a DGPS beacon. When not in range of a DGPS, GPS beacon positions have a rated accuracy of 10 meters 95% of the time. SPAR technicians configure NMEA 0183 output sentences (GGA and VTG) which broadcast from the Furuno RDP‐149 chart plotter (S/N 4323‐4026) and are logged in the acquisition software HYPACK. The DGPS unit is configured in auto mode to pick up the closest DGPS beacons for correctors. This GPS unit undergoes the same quality assurance testing as described above.

9 September 2013 Data Acquisition & Processing Report
7
Figure 6: Furuno GP37 GPS/ DGPS Chart Plotter w/ Furuno RD30 repeater mounted above plotter.
3. SPAR 2 (236607) SPAR 2 uses a Furuno GP‐1850WF GPS Chart Plotter (S/N 3480‐4426), coupled with a Furuno Model # GPA‐019 GPS/DGPS H‐Field antenna (S/N illegible) to acquire positions with a rated accuracy of 10 meters or better 95% of the time. Furuno GP‐1850WF GPS Chart Plotter is not DGPS ready. SPAR technicians configure NMEA 0183 output sentences (GGA and VTG) which broadcast from the Furuno chart plotter (S/N 3480‐4426) and are logged in the acquisition software HYPACK. This GPS unit undergoes the same quality assurance testing as described above.
Figure 7: Furuno GP1850WF GPS Chart Plotter
C. Bathymetric Measurement
1. USCGC SPAR (WLB-206)
For bathymetric measurements, the USCGC SPAR uses a hull mounted Furuno 520‐5MSD transducer controlled by a Furuno DFF1 Transceiver unit (S/N 8856‐4659) which collects raw datagrams and transmits NMEA DBT messages to the bridge Furuno RDP 149/1934C plotter (Figure 7, below) and the HYPACK acquisition machine through a Noland Engineering DX28 NMEA Expander.

9 September 2013 Data Acquisition & Processing Report
8
Figure 8: Furuno RDP 149/1934C plotter (S/N 4323-3869) left and
Furuno 520-5MSD transducer (S/N Unknown) right
The hull mounted vertical beam echo sounder (VBES) transducer operates at two frequencies, LF‐ 50kHz (46 degree beam angle) and HF‐200kHz (10 degree beam angle), and is rated to depths around 1200 feet. The VBES is located near centerline of the vessel one foot aft of frame 57. This unit is a repairable item through Surface Forces Logistics Center’s (SFLC) mandatory turn in process. The repairable item is quality assured (QA) to ISO 9001 standards. Upon installation, the system will undergo the SOVT by onboard technicians. SPAR used a lead line to compare with the hull mounted VBES to verify transducer measurements. See Section IV.D for latest comparison results.
2. SPAR 1 (24228)
For bathymetric survey, SPAR1 uses a Airmar Smart Sensor P/N: 44‐036‐1‐02, 235khz single‐frequency transducer (14 degree cone at ‐3dB, 19 degree cone at ‐6dB, 24 degree cone at ‐10dB) which supplies the RDP‐149 with depth data (see Airmar Technical Data Catalog 17‐278‐255 rev. 02) The Airmar Smart Sensor is broadcast through the same GPS Furuno chart plotter with the added NMEA 0183 output message DPT. The hull mounted vertical beam (VBES) transducer is rated to depths around 1200 feet. The transducer is located aft of the vessel and starboard of centerline. It is mounted at an approximate 20 degree angle to starboard. A lead line comparison has not yet been conducted. See Section IV.D for latest comparison results.

9 September 2013 Data Acquisition & Processing Report
9
Figure 9: Airmar Smart Sensor Transducer
3. SPAR 2 (236607)
For bathymetric survey, SPAR2 uses a Furuno (Airmar) plastic mount transducer Model # 525STID‐PWD (S/N none), which is broadcast through a Furuno GPS chart plotter with the added NMEA 0183 output message DPT. The hull mounted vertical beam (VBES) transducer operates at two frequencies, LF‐ 50kHz (45 degree cone at ‐3dB, 69 degree cone at ‐6dB, 94 degree cone at ‐10dB) and HF‐200kHz (11 degree cone at ‐3dB, 16 degree cone at ‐6dB, 21 degree cone at ‐10dB) , and is rated to depths around 1200 feet. The transducer is located aft of the vessel and starboard of centerline. A lead line comparison has not yet been conducted. See Section IV.D for latest comparison results.
Figure 10: Airmar plastic mount transducer

9 September 2013 Data Acquisition & Processing Report
10
D. Sound Speed Measurement Several sound speed casts were collected during the 2013 season with a Teledyne ODOM DIGIBAR on loan from NOAA Ship Fairweather (S/N 98013). The DIGIBAR unit was last calibrated at the manufacturer on 17 April 2009. Sound speed cast comparisons were conducted with a recently calibrated Seabird SBE 19plus on Fairweather 9 May 2013, prior to use on SPAR. The cast values agreed within 2 m/s to verify the DIGIBAR’s performance.
Figure 11: DIGIBAR setup image from manufacturer materials.
E. Computers and Software Positioning and bathymetric data logged as NMEA messages on all three vessels are recorded by Windows XP Service Pack 3 machines in HYPACK 2013 (Version 13.0.0.6) as HYPACK raw files. SPAR acquires data on the DellPC which also serves as the processing computer, while SPAR 1 and SPAR 2 acquire data on Panasonic ToughBook ruggedized computers. Due to hardware difficulties, one of SPAR’s two ToughBook CF‐18s was not in use for the Bechevin Bay project. A NOAA Ship Fairweather CF‐19 was utilized instead to supplement SPAR’s survey capabilities. Details of all seven computers listed below.
1. Computers
SPAR 1 Panasonic CF‐18 ToughBook (S/N: 6BKSB73972) SPAR 1 Backup (as of 28JUN13) Panasonic CF‐31 ToughBook (S/N 1DKYB65077) SPAR 2 (fixed as of 28JUN13) Panasonic CF‐18 ToughBook (S/N: 6BKSB72785) SPAR 2(temp for Bechevin trip) NOAA Panasonic CF‐19 ToughBook (S/N: 9AKSB42381) SPAR 2 Backup (as of 28JUN13) Panasonic CF‐31 ToughBook (S/N 1IKYB82660) SPAR (acq. and processing)‐ Dell Optiplex 960 (S/N: 28049100697) HYPACK BACKUP (as of 28JUN13) Panasonic CF ‐19 ToughBook (S/N 3CKSB12594)

9 September 2013 Data Acquisition & Processing Report
11
2. Wiring Diagrams
USCGC SPAR
SPAR 1 and SPAR 2 Wiring Diagram

9 September 2013 Data Acquisition & Processing Report
12
III. Quality Control A. Data Acquisition
For the majority of VBES data collection, manual adjustments of sonar properties are not needed. However, when crossing varying depth areas, changes in range and gain are made to ensure quality bathymetric data. SPAR 1 and SPAR 2 vessel speeds are restricted during data acquisition to 8‐12 kts. CGC SPAR is limited in speed by its max speed of 16 KTS. The Lead Hydrographer or electronics division complete pre‐survey checks of acquisition computers to verify HYPACK project setup for hardware settings (correct devices and messages logged), geodesy, and survey planning files (charts, line, border, and target files). During survey, either a member of the electronics department, or boat crew, verify that the appropriate NMEA sentences are coming through HYPACK Survey for GGA, VTG, and DBT. The crew member responsible for data acquisition must ensure appropriate logging of sounding data, speed, COG, and position or must otherwise contact the Lead Hydrographer for direction. Note – Data is collected, analyzed and submitted for review in US survey Foot units due to Buoy Tender operational requirement.
B. Data Processing
Data Processing conducted within HYPACK Max aboard CGC SPAR is strictly for use by CGC SPAR for waterway analysis. A systematic approach to tracking data has been developed by Lead Hydrographer BM1 Michael Cobb to maintain data quality and integrity. BM1 Cobb established Standard Operating Procedures (SOPs) and implemented a HYPACK data collection logbook to identify and track the flow of data as it is collected and processed. Before processing, a tide file (*.tdx) is created using the closest tide station available. Tides are applied for buoy tender operations, *.raw files will be sent to NOAA Pacific Hydrographic Branch (PHB) for final processing. After tides and offsets have been applied to the data, soundings are filtered out that have an HDOP higher than 4 or were collected at a speed greater than 12 kts for the small boats. Speed is limited to decrease the effect of cavitation across the transducer and to provide a consistent draft of the small boat to avoid rising up on plane. The sounding data is then cleaned of suspected erroneous depths or bad GPS positions. The final processed data is sorted by a 140 ft radius to create the .xyz overlays in HYPACK for CG navigation purposes.
C. Static Draft
Draft marks for SPAR are read by small boat and entered into the ship’s log whenever possible. When collecting VBES data with SPAR, those draft readings are also passed along to the Lead Hydrographer to update the vessel offsets for the project. Draft measurements for SPAR 1 and SPAR 2 are measured when the small boats are alongside in calm seas using either a plumb line or other weighted measuring device. See Section IV.A for latest vessel measurements.

9 September 2013 Data Acquisition & Processing Report
13
IV. Corrections to Echo Soundings A. Draft/Waterline Measurements Waterline measurements were taken for SPAR 1 and SPAR 2 on June 19, 2013 by BM1 Cobb.
B. Offset Measurements All offset measurements below are relative to HYPACK Coordinate System (Z‐Axis positive down, Y‐ Axis positive forward/bow, and X‐Axis positive starboard to the reference point.) As none of the 3 SPAR vessels has a motion‐measuring device, the origins (Reference Points) for the vessels listed below are at the static waterline, directly above the transducers per HYPACK direction. All offsets are measured from the sensor device to the origin (reference point).
1. USCGC SPAR (WLB-206)
Offsets for CGC Spar were measured on 25JUN13 by BM1 Cobb. Measurements were conducted utilizing ships drawings and a metal measuring tape with uncertainty estimated at 8-10 inches. The echo sounder transducer is located 10 inches to port of centerline, one foot aft of frame 57 and flush mounted with the hull. The GPS antenna is 4’8” starboard of centerline, 25’ 6” aft of frame 57 and 79’1.5” above the keel as measured to the base of the antenna.
The average waterline was 12’6” above the keel as calculated from draft readings from the first half of the arctic patrol including prior to and after fueling. Max average draft observed was 12’10.5” and minimum average draft observed was 12’1.5”. Average readings were calculated by averaging the fore and aft drafts observed which reasonably approximates the draft at the transducer. The transducer lies about amidships longitudinally on the vessel.
Figure 12: Vessel offsets to the reference point (RP) Z‐Axis positive down, Y‐ Axis positive forward/bow, and X‐Axis positive starboard.

9 September 2013 Data Acquisition & Processing Report
14
GPS Antenna to RP Offsets (feet)
X‐Axis ‐4.66’ Y‐Axis 24.5’ Z‐Axis 66.625’
Transducer to RP Offsets (feet)
X‐Axis 0’ Y‐Axis 0’ Z‐Axis ‐12.5’
2. SPAR 1 (24228)
Offsets for SPAR 1 were measured on 17 May 2013 by ET1 Berno Atalig and CST Tami Beduhn, NOAA. Measurements were conducted utilizing a plumb-line and fiberglass tape measure with uncertainty of measurements estimated at 2-4 inches.
Figure 13: SPAR1 measurements between the GPS antenna and depth sounder in feet.
Waterline measurements were combined with the offset measurements above to create the offsets for use in HYPACK below. At the time of this report the measurement from the waterline to the transducer is an estimate, measured in the cradle aboard CGC SPAR with an uncertainty of 2 inches.

9 September 2013 Data Acquisition & Processing Report
15
GPS Antenna to RP Offsets (feet) X‐Axis 1’ Y‐Axis ‐9.65’ Z‐Axis 8.02’
Transducer to RP Offsets (feet) X‐Axis 0’ Y‐Axis 0’ Z‐Axis ‐1.33’
3. SPAR 2 (236607)
Offsets for SPAR 2 were measured on 17 May 2013 by ET1 Berno Atalig, USCG and CST Tami Beduhn, NOAA. Measurements were conducted utilizing a plumb-line and fiberglass tape measure with uncertainty of measurements estimated at 2-4 inches.
Figure 14: SPAR1 measurements between the GPS antenna and depth sounder in feet.
Waterline measurements were combined with the offset measurements above to create the offsets for use in HYPACK below.
GPS Antenna to RP Offsets (feet)
X‐Axis 2.2’ Y‐Axis ‐11.25’ Z‐Axis 5.65’

9 September 2013 Data Acquisition & Processing Report
16
Transducer to RP Offsets (feet) X‐Axis 0’ Y‐Axis 0’ Z‐Axis ‐1.55’
C. Timing Results
Latency tests were conducted on CGC SPAR on 24 July 2013. Latency test was conducted in Unalaska Bay north of Hog Island at 6 kts and 12 kts. The time difference between the two data acquisition lines was 13 minutes for the 6 knot latency test and 34 minutes for the 12 knot latency test. Due to the difficulty of running exact tracklines over one another and the uneven/rocky bottom, the latency timing was evaluated where the two data acquisition lines crossed one another. The lines used to evaluate the latency are SPAR_2013SP2050638.raw and SPAR_2013SP2050712.raw at 12 knots and SPAR_2013SP2050648.raw and SPAR_2013SP2050701.raw at 6 knots. The latency was found to be -1.4 seconds at both speeds.
Figure 12: CGC SPAR latency data acquisition lines.
9 September 2013 Data Acquisition & Processing Report
17
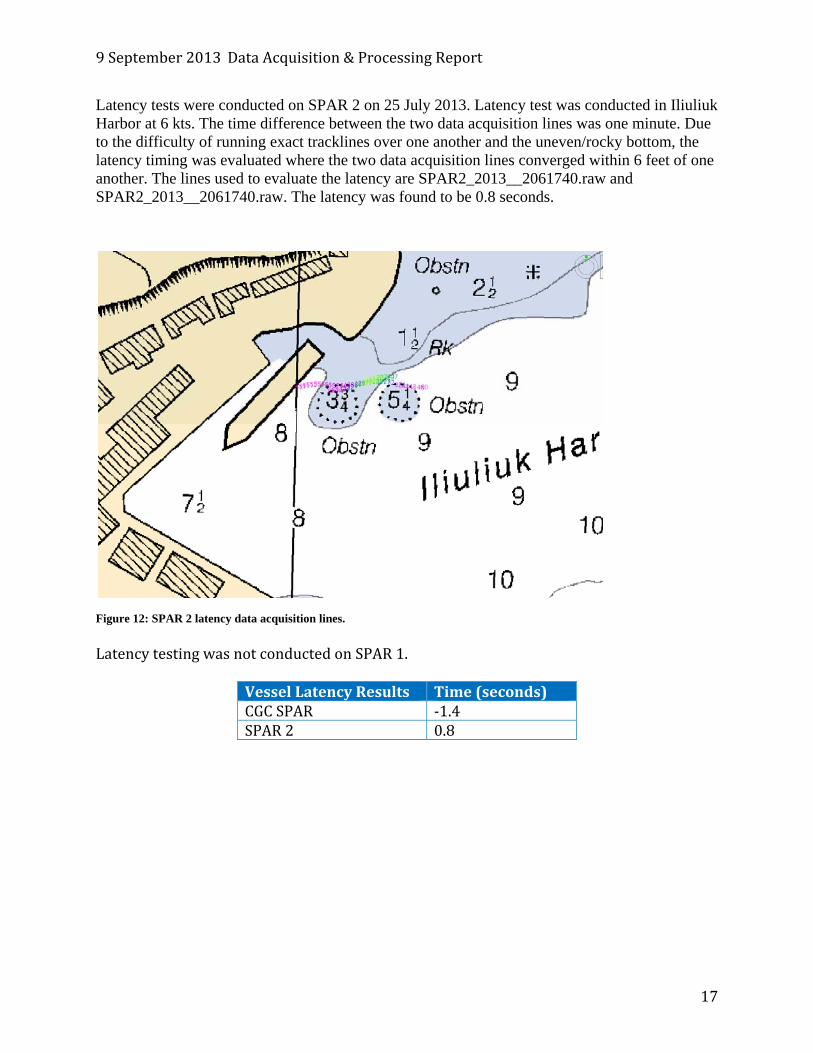
Latency tests were conducted on SPAR 2 on 25 July 2013. Latency test was conducted in Iliuliuk Harbor at 6 kts. The time difference between the two data acquisition lines was one minute. Due to the difficulty of running exact tracklines over one another and the uneven/rocky bottom, the latency timing was evaluated where the two data acquisition lines converged within 6 feet of one another. The lines used to evaluate the latency are SPAR2_2013__2061740.raw and SPAR2_2013__2061740.raw. The latency was found to be 0.8 seconds.
Figure 12: SPAR 2 latency data acquisition lines. Latency testing was not conducted on SPAR 1.
Vessel Latency Results Time (seconds) CGC SPAR ‐1.4 SPAR 2 0.8

9 September 2013 Data Acquisition & Processing Report
18
D. Physical Depth Comparison
1. USCGC SPAR (WLB-206)
A lead line comparison was done in Traders Cove of Bechevin Bay 14 May 2013 by ENS Paul Milliken, Cadet Anthony Monteforte, and CST Tami Beduhn, NOAA. The lead line measured depth from the waterline to the seafloor was 41.375 feet. The echo sounder reading (28.2 feet) plus ship’s designed draft (13.0 feet) provided a measured depth of 41.2 feet. Therefore the difference between the echo sounded depth and lead line value was within 2.1 inches.
2. SPAR 1 (24228) and SPAR 2 (236607)
Lead line comparisons not currently available.