dark side of incentives: evidence from a...
TRANSCRIPT

DARK SIDE OF INCENTIVES: EVIDENCE FROM A RANDOMIZED
CONTROL TRIAL IN UGANDA*
DAGMARA CELIK KATRENIAK§
(INCOMPLETE. COMMENTS ARE HIGHLY APPRECIATED)
Abstract
Throughout our lives, we are routinely offered different incentives as a way to motivate us, such as absolute and relative performance feedback, and symbolic, reputation or financial rewards. Many researchers have studied the effects of one or more of these incentives on how people change their performance. However, there can also be important psychological outcomes in terms of stress and happiness. The current paper contributes to the literature by explicitly accounting for this performance-versus-well-being tradeoff introduced by incentives. I implement two types of social comparative feedback regimes, within and across-class group comparisons, and two types of incentive regimes, financial and reputation rewards. The results show that rewards can lead to an increase in student performance up to 0.28 standard deviations (depending on whether students received feedback and what type), but at a cost of higher stress and lower happiness, whereas comparative feedback alone (without rewards) increases performance only mildly, by 0.09 to 0.13 standard deviations, but without hurting student well-being. More stressed students exert less effort, perform worse and attrite by 29 percent more compared to those who are stressed minimally. Furthermore, the results help to identify gender-specific responses to different incentive schemes. Boys strongly react to rewards with or without feedback. In contrast, girls react to rewards only if they are also provided with feedback. Finally, the paper contributes to the expanding literature on incentivized interventions in developing countries by using a rich dataset of more than 5000 primary and secondary school students in Uganda, who were repeatedly tested and interviewed over a full academic year.
Keywords: education, motivation, financial rewards, extrinsic and intrinsic motivation, reputational rewards, incentives, randomized control trial, competition, group outcomes, Uganda JEL Classification: C90, C93, D04, I21, I29, O55
* This research was supported by GA UK grant No. 338911, and by GDN grant No.60. All errors are mine. ¶ CERGE-EI (a joint workplace of the Center for Economic Research and Graduate Education of Charles University, and the Economic Institute of the Academy of Sciences of the Czech Republic, v.v.i.), Politickych veznu 7, 11121, Prague 1, Czech Republic. Email: [email protected].

1
1. Introduction
A trophy for the highest ranking student in the graduating class, a certificate for the most
improving learner of a course or a bonus payment for the employee of the month, etc. We are
routinely faced with incentives of different types (symbolic, reputation or financial rewards)
throughout our lives. Rewards are often believed to motivate subjects and subsequently lead to an
increase in their performance, and are therefore implemented in many different environments.
According to psychologists, it is a subject’s extrinsic motivation that causes a positive reaction to
different types of reward. In other words, rewarded subjects increase their immediate efforts,
which results in an increase in their performance (Deci et al., 1999, Ryan and Deci, 2000, etc.)1.
Psychologists also identify a dark side of rewards: they may actually decrease subject performance
by crowding out their intrinsic motivations2 and thus lowering their interest in the task (Deci,
1971; Deci, Koestner and Ryan, 1999; Benabour and Tirole, 2003; Frey and Jegen, 2000). Therefore,
whether subjects improve performance or not depends on which one of these effects dominates.
We are also routinely compared to classmates/colleagues/competitors by receiving
feedback about our performance. It has been shown that feedback may also motivate subjects to
improve their performance (Andrabi et al, 2009; Azmat and Iriberri, 2010) even though the
evidence on such positive effects is more scattered. According to psychologists, positive feedback is
believed to increase intrinsic motivation and foster long-term motivation, whereas negative
feedback decreases intrinsic motivation (Burgers et al., 2015; Arnold, 1976; Deci, 1972).
The focus of these (and related) studies is mainly subject performance. However, little is
known in education literature about the effects of incentives and feedback provision on the
1 The effects of rewards on performance have been studied in economic or education literature, too, e.g., Hastings et al., 2012; Bettinger et al.; 2012, Blimpo, 2014, etc.) 2 Definition of intrinsic and extrinsic motivation can be found in Ryan, and Deci, 2000.

2
outcomes other than performance (e.g., happiness and stress), and this paper constitutes a first
attempt to address these issues.
We should be concerned about stress and happiness outcomes, because they affect a
person’s overall well-being. An increase in happiness3 is associated with stronger health, sharper
awareness, higher activity as well as better social functioning (Veenhoven, 1988). Happiness is
negatively related to stress. Subjects under stress make suboptimal decisions, which, in the case of
students, could lead to incorrect answers during examinations, or suboptimal choices in their
careers (e.g., to be absent from school, to drop out of school or to exert low levels of effort). Both
stress and happiness influence subjects’ health (Juster et al., 2010; McEwen, 2008; Schneiderman et
al., 2005). Stress also influences learning and memory, and it creates learning problems (Lubin et
al., 2007; Wolf, 2009). In the extreme, stress hormones may even influence brain structure (Lupien
et al., 2009). Therefore consequences of interventions on the well-being of students should not be
underestimated.
This is the first study implemented in the field that analyzes the effects of all types of
motivation schemes on the performance and on the well-being of students. The novelty of the
experiment comes from the wide scope of outcome measures observed, rich design and its unique
data set. The sample size consists of more than 5000 primary and secondary school students from
146 classes located in Southern Uganda, who are repeatedly tested and interviewed during one full
academic year. In total, five testing rounds were administered. The design offers a direct
comparison of the effects of two feedback groups and two reward groups as well as their
interactions (each feedback interacted with each reward). Feedback differed across feedback-
treatment groups with respect to its content. Each student in the within-class feedback group
received information about how he scored in Math and in English, how his group-mates scored and
3 See Fordyce (1988) on review of happiness measures, MacKerron (2012) for review on the economics of happiness.

3
the position of the group within his class. Students in the across-class comparative feedback group
received information about how they scored in Math and in English personally (i.e., they were not
given information about their classmates) and the position of their class compared to other classes.
Students were not offered rewards until testing round 4 was finished. Students were orthogonally
randomized into financial, reputation and no-reward groups. Students in the financial reward
group could win 2000 UGX per person (which was approximately 0.80 US cents according to that
day’s exchange rate). Students in the reputational reward group were promised that if they
qualified for the reward, their names would be announced in the local newspaper Bukedde (the
most popular in the region) and they would receive a certificate. The general criterion I used was to
reward 15% of the top performing and 15% of the most improving students/groups/classes.
The results confirm that both feedback and rewards, if studied separately, motivate
students to improve their performance (by 0.08 to 0.13 standard deviations). The effects are
amplified if students face any of the treatment combinations (the effect size is between 0.19 and
0.28 standard deviations). However, the results on the outcomes other than learning, such as
happiness and stress put the benefit of reward provision into the shade. The students who were
offered only rewards (without any feedback) had their stress levels elevated and happiness levels
decreased, whereas the well-being of students who received only feedback remained unchanged.
Moreover, most of the treatment combinations lead to a decrease in student well-being. Thus, we
can speak of an important trade-off: the introduction of rewards increases performance more than
pure feedback, but at the same time they lower student well-being.
In some experiments, boys and girls responded very differently to certain incentives. The
second contribution of this paper is to shed light on the underlying reasons behind these gender
differences. I attribute this difference to the existence of two types of competitions – intrinsic, or
internally driven competition, developed by personal feelings based on comparison to others, and

4
extrinsic competition induced by rewards. According to the results, if girls are given rewards but no
feedback, they will significantly underperform boys. However, if girls are repeatedly informed
about their positions (no matter what type of feedback they receive), their performance will
improve and will become comparable to boys. In other words, comparative feedback in a
tournament environment plays a crucial role for girls motivating them to improve their
performance. Boys, in contrast, react only to rewards. The current design does not allow me to
distinguish whether gender differences are caused by the fact that students were evaluated in
groups (group identity effect), or that they were repeatedly informed about their standing. It was
beyond my budget constraints to include additional treatment groups. However, since both within-
and across-class feedback groups deliver similar effects, it seems more likely that the effect is
driven by social comparison rather than group identity.
The results of this experiment may be important especially for policy-makers in finding the
optimal strategy for improving performance and well-being of students in primary and secondary
schools. Despite numerous studies in the literature that are designed to improve student
performance and/or their attendance, concerns about student well-being have generally been left
aside. However, the results of many studies in psychology indicate that current well-being serves as
an important prerequisite for future performance. For example, stress causes students to exert less
effort and perform worse. Moreover, stressed students are absent and drop out from school more
often when compared to non-stressed students. In this study I pay explicit attention to student
happiness and stress and I focus on the tradeoff between performance and well-being. Rewards
(both financial and reputational) motivate students to perform significantly better but their well-
being is harmed. Pure informative feedback, on the contrary, motivates students to perform slightly
better without harming their well-being. Therefore, policy-makers should use a great amount of
caution in designing educational rewards and take into account the impacts on student well-being.

5
Further research should aim to study the long-term effects of changes in student well-being on
performance.
2. Literature Review
Social comparison theory is about “our quest to know ourselves, about the search for self-
relevant information and how people gain self-knowledge and discover reality about themselves”
(Mettee and Smith 1977, p. 69–70). According to social comparison theory, informing a child
about his/her performance without comparing it to other children causes unstable evaluations of
the child’s ability and can influence effort negatively (Festinger, 19544; the founder of the social
comparison theory). On the contrary, comparison enables a child to find his/her relative position
within a particular group which can lead, via enhanced competitiveness, to an increase in effort and
performance improvement. Feedback provision, as a way to inform subjects about their absolute
or relative standing, has been analyzed in different environments and has delivered opposing
results. Andrabi, Das and Ijaz-Khwaja (2009), for example, provided parents, teachers and
headmasters with report cards informing them how children are doing in a particular school. The
intervention resulted in 0.1 standard deviation improvement in student test scores. Azmat and
Iriberri (2010) informed high school students about their relative standing and in this way helped
to improve student grades by 5 per cent. Additionally, university students in the United Kingdom
responded positively when they improved their performance by 13% in response to feedback
regarding their own absolute performance (Bandiera et al., 2015)5. Not all studies, however, find
positive responses to feedback provision. Azmat et al. (2015) do not find any effect of relative
feedback on university student performance (on the contrary, in a short period right after the 4 Festinger in his original paper focused on the social comparison of abilities and opinions only. Since then, however, have many different dimensions of social comparison been studied (e.g., Buunk & Gibbons,1997, 2000; Suls & Wheeler, 2000). See e.g. Locke and Latham, 1990; Suls and Wheeler, 2000, for an overview of papers in psychology and management science. See Buunk and Gibbons (2007) for an overview of work in social comparison and the expansions of research on social comparison. 5 Other studies with positive effects of feedback provision: Tran and Zeckhauser (2012), Blanes-i-Vidal and Nossol (2010) or Fryer (2010)

6
feedback was provided they even find a slight downturn in student performance). More evidence
on the negative effects of incentives on performance can be found in experiments implemented at
the workplace. Bandiera et al. (2011a, 2011b) find negative effects. Workers in both experiments
lowered their performance after they received information about their rank position. Health
workers also decreased their performance during a training program in Zambia when exposed to
social comparison (Ashraf et al., 2014)6.
The effect of feedback depends on who the subjects are compared with, how they are compared
and whether they are rewarded for their performance. Are subjects compared individually or in
groups? Are groups constructed exogenously or endogenously? Privately or publicly7? Are subjects
compared to others within their ability limits or to much better performers? And are subjects
offered rewards of any type for their improvements?
Students face social comparison in their classrooms on a daily basis and it can strongly
influence their self-esteem and their performance (Dijskstra et al., 2008). It is therefore important
to understand with whom to optimally compare the students. If students are compared to the ones
slightly better, their effort and performance tend to increase. Performance and effort decrease if the
comparison target is too far from a student’s ability (Ray, 2002). Students can be compared
individually or in groups. A group’s outcome depends on each member’s contribution and may
foster mutual help (Slavin, 1984) in addition to positive peer effects (Hoxby, 2000; Sacerdote,
2001). Groups can be formed endogenously (e.g., by students themselves based on friendship) or
exogenously (Blimpo, 2014) and they can be exposed to competition. In some studies, the effects
6 There are also controlled lab environments studying the effects of feedback provision, e.g. Falk and Ichino (2006) and Mas and Moretti (2009) found that if one lets people observe the behavior of their peers, their performance would improve. Kuhnen and Tymula (2012) and Duffy and Kornienko (2010) find a positive effect to the provision of private feedback. Eriksson et al. (2009) on contrary find that rank feedback does not improve performance (even if pay schemes were used). Hannan et al. (2008) find a negative effect of feedback on relative performance under a tournament incentive scheme (if feedback is sufficiently precise). 7 Tran and Zeckhauser (2012) studied whether the publicity of the feedback delivery matters and found that students exposed to public feedback outperformed their mates who were informed privately.

7
of interventions are more pronounced if students are involved in tournaments (Eriksson et al.,
2009; Bigoni et al., 2010; VanDijk et al., 2001)8.
Subjects often improve their performance if they are rewarded financially. Bettinger
(2012), Angrist et al. (2002, 2006, 2009, 2010), Kremer (2004), Bandiera (2010), and others
studied the effects of the provision of cash payments, vouchers or merit scholarships to students
who successfully completed a pre-defined task. In such experiments knowing the relative position
is not crucial since success does not depend on the performance of other mates. In order to induce
stronger competitive pressure, subjects need to be put into a tournament with a limited number of
winners. VanDijk et al. (2001) conclude, based on the results of their experiment in which they
experimentally compared different payment schemes, that it is superior for a firm to introduce a
tournament-based scheme over a piece-rate or team payment scheme. In the case of Blimpo (2014),
groups involved in the tournament improved similarly compared to groups rewarded for reaching a
performance target. All treatments (with or without competition) resulted in positive improvement
in student performance, increased by 0.27 to 0.34 standard deviations. Not all evidence is in favor
of positive effects of financial rewards. Fryer (2010) aimed to study the impact of different financial
rewards on student performance and did not find any significant improvement (even though the
effect might have not been detected because of lack of power, the author claims). Similarly,
Eisenkopf (2011) did not find any significant effect of different financial treatments on student
performance.
Even if the financial rewards result in performance improvements, they may not be
necessarily cost-effective (e.g., Bandiera et al., 20129). Alternative rewards10 that would be
possibly more cost-effective drew researchers’ attention. For example, Kosfeld and Neckerman
8 See Hattie and Timperley (2007) for a review of the literature on the provision of feedback. 9 Bandiera et al. (2012) find the financial rewards cost-ineffective since only a fraction of the students from the second quartile of initial ability distribution react positively to financial rewards. 10 See theoretical models studying the effects of reputation and symbolic rewards on subjects’ performance in work of Weiss and Fershtman (1998), Ellingsen and Johannesson (2007), Besley and Ghatak (2008), Moldovanu et al (2007) or Auriol et al. (2008).

8
(2011) designed a field experiment where students in the treatment group were offered symbolic
rewards (a congratulatory card) for the best performance while students in a control group were
not offered anything. Their results provide strong evidence that status and social recognition
rewards have motivational power and lead to an increase in work performance on average by 12
percent. Subjects in the real-effort experiment conducted by Charness et al. (2010) increased their
effort in response to the relative performance and expressed their “taste for status”. Jalava et al.
(2015) offered sixth grade students in Swedish primary schools different types of non-financial
rewards (criterion-based grades from A to F, grade A if they scored among the top 3 students, a
certificate if they scored among the top 3 students or they received a prize (in the form of a pen) if
they scored among the top 3 students). The effects were heterogeneous with respect to original
ability (students from two middle quartiles respond the most to the incentives) and with respect to
gender (boys improved their performance in response to rank-based incentives only, girls also to
symbolic rewards). Rank-based grading and symbolic rewards, however, crowded out intrinsic
motivations of students. Markham, Scott and McKee (2002) show that rewards may motivate
subjects to improve their attendance, too.11 Even non-monetary rewards have the power to
motivate subject to improve their performance. Naturally, the questions arose. What can we learn
from direct comparison of monetary and non-monetary rewards? Would financial rewards prevail?
Levitt et al. (2012) present the results of a set of field experiments in primary and secondary
schools, in which they provided students with financial as well as non-financial rewards, with and
without delay and incentives framed as gains and losses. Non-monetary rewards were as effective
as monetary rewards (and therefore more cost-effective).
In this experiment with whom the student is compared to depends on the feedback-group
he belongs to. In the within-class comparative feedback group students were grouped exogenously,
11 In their study the authors used a combination of symbolic and materialistic rewards in their study implemented among workers in garment factories. Workers with perfect (or close to perfect) attendance were rewarded by a gold (silver) star and at the end of the year the winners received a gold (silver) neckless or penknife

9
which allows me to compare the treatment effects based on different group ability combinations.
Students were not able to compose their group in the across-class feedback group either since they
were evaluated as a class. Feedback was provided privately. To see the difference in the treatment
effects under a tournament environment, students were offered rewards if they qualified to win the
prize. In an attempt to attract the broader attention of the students, especially from the bottom
ability distribution, rewards were offered to 15% of the best improving students/groups of
students as well as 15% of the most improving students/groups of students.
But what are the effects of the incentives on the overall well-being of students? On one
hand, incentives improve student performance, although do they make students happier? Less
stressed? Do they influence student aspirations or their confidence? There is very limited evidence
of the impacts of feedback or rewards on these other than learning outcomes.
An increase in happiness12 is associated with stronger health, sharper awareness, higher
activity in addition to better social functioning (Veenhoven, 1998). Education is one determinant of
happiness (higher education is associated with higher well-being (Helliwell et al., 2012; Dolan et al.,
2008). Happiness is negatively related to stress. Subjects under stress make suboptimal decisions,
which, in the case of students, could lead to incorrect answers during examinations, or suboptimal
choices in their careers (e.g., to be absent from school, to drop out of school or to exert low levels of
effort). Both stress and happiness influence subjects’ health (Juster et al., 2010; McEwen, 2008;
Schneiderman et al., 2005). Stress influences learning and memory, and it creates learning
problems (Lubin et al., 2007; Wolf, 2009). In the extreme, stress hormones may even influence
brain structure (Lupien et al., 2009). Therefore, the consequences of interventions on the well-
being of students should not be underestimated.
12 See Fordyce (1988) on a review of happiness measures, MacKerron (2012) for a review of the economics of happiness, Dolan et al. (2008) review well-being.

10
The predictions of the effects of my interventions based on the existing literature are
controversial. Evaluation of students in groups should push via enhanced cooperation within
groups to group average improvements. If the group is, however, big enough, free-riding behavior
may prevail and result in heterogeneity within the group outcomes. Informing students about the
position of their group could lead to improvements in performances via enhanced competition or
demotivate students with a negative attitude toward competition. The effect potentially depends on
group composition (gender, friendship or ability composition) and group position in the group
ability distribution. Students included in both financial and reputational reward treatments are
expected to improve their scores, at least the ones in the second quartile of ability distribution.
3. Randomization and experimental design
In the first part of my intervention, I study whether the provision of comparative feedback
about group outcomes, a pure information incentive without any rewards, can increase student
effort and lead to performance improvement. To evaluate the effect of the intervention, I designed a
Randomized Control Trial (RCT) experiment. At the beginning of the academic year, the sample was
stratified and randomized into two feedback-treatment groups and one control group (as shown in
Figure 1). Students in within-class feedback group were randomly divided into groups of three to
four classmates within each class and were evaluated as groups within the class. In other words,
group averages were taken into account when comparing the student performance. The students in
the across-classes feedback group were evaluated as a whole class (using class average) and were
compared to other classes of the same grade in different schools. The relative standing of the group
was based on the average group score from Mathematics and English. Students were tested
repeatedly during an academic year and received pure information feedback three to four times
depending on the feedback group (across-class/within-class feedback, respectively).

11
Feedback differed across treatment groups with respect to its content. Each student in the
within-class feedback group received information about how he scored in Math and English, how
his group-mates scored and the position of the group within his class. Furthermore, starting from
testing round 3, the student received information about how he (and his group-mates) improved or
worsened in between two preceding testing rounds. Students in across-class feedback group
received information about how they scored in Math and in English personally (i.e., they were not
given information about their classmates) and the position of their class compared to other classes.
The positions in both treatments were emphasized on a rank-order graph. Students in the control
group did not receive any information, they only answered exam questions. Students were not
offered further rewards until testing round 4 was finished.
In order to see the value added of rewards additionally introduced and their interactions with
social comparison, I orthogonally re-randomized the sample at the school level13 before the final
school visit (three to four weeks in advance) and introduced financial and reputational rewards.
13 The randomization was done at school level in order to avoid spillover effects and possible confusion.
Figure 1: Stratification and randomization scheme

12
Figure 2: Orthogonal randomization of the sample into reward treatments
Therefore, compared to other studies students in this experiment had some time to adjust to
the treatment (e.g. to prepare for the test). The aim of such a cross-cutting design was to observe
whether the introduction of rewards could enhance student performance, especially if interacted
with treatments T1 and T2 (see also Figure 2) and whether student well-being would be affected.
Students in financial treatment could win 2000 UGX per person (which is approximately 0.80 US
cents according to that day’s exchange rate). Students in the reputational reward scheme were
promised that if they qualified for the reward, their names would be announced in the local
newspaper Bukedde (the most popular in the region). The qualification criteria differed based on
original randomization into treatments (see Table 1) but the general rule was to reward 15% of the
Table 1: Qualification criteria for winning the rewards
Financial rewards (2000 UGX)
Reputational Rewards (Winners’ names published
in a local newspaper)
No rewards
Within-class social comparison (Treatment 1)
15% of best performing and 15% of best
improving groups
15% of best performing and 15% of best improving
groups
Pure within-class social comparison group, no
rewards Across-class social comparison (Treatment 2)
15% of best performing and 15% of best
improving classes
15% of best performing and 15% of best improving
classes
Pure across-class comparison group, no
rewards Control group
15% of best performing and 15% of best
improving students
15% of best performing and 15% of best improving
students
Pure Control Group,
no rewards Note: In order to avoid confusion, students were given exact information regarding the number of winning groups (if in T1), the number of winning classes (if T2) and the number of winning students (if originally in control group). I used percentages in order to guarantee a comparable number of winners across all treatment groups.

13
top performing students/groups/classes as well as 15% of the most improving
students/groups/classes.
4. Timing, logistics and final sample
The experiment took two years. The evaluation team consisted of me and four local
enumerators. The baseline survey was conducted between September and December 2011. The
intervention implementation and the core data collection took place from January 2012 until
December 2012. The follow-up session was arranged between May and August 2013. Students
were tested twice per term, equating to approximately every one and half month. The agenda of
each visit was similar. After we entered the class, students in feedback-treatment groups received
their feedback, control students started immediately with questionnaires and doing the Math and
English exam14. Apart from Math and English scores, I also collected information about student
aspirations, immediate effort, strategic effort in a form of preparation for the exam, immediate
happiness on the spot, happiness based on the Subjective Happiness Scale (Lyubomirsky and
Lepper, 1997) and their stress level based on the Perceived Stress Scale (Cohen, Kamarck and
Mermelstein, 1983). The final sample consists of 52 schools, 31 primary and 21 secondary schools
out of which 19 are public, 23 are private and 10 are community schools. All schools describe their
location as rural. The sample comprises 146 classes accounting to more than 5000 students
repeatedly tested from six grades (P6 and P7 in primary schools, S1 up to S4 in secondary schools).
The dataset contains data on student performance in five testing rounds implemented during the
2012 academic year, student questionnaires collected before and after every Math and English
14 The order was as follows: “Before Math questionnaire”, followed by Math examination that lasted 30 minutes; “After Math Before English questionnaire”, English exam in the subsequent 20 minutes and finally “After English questionnaire”. The core questions of the questionnaires were student expectations regarding how many points they thought they would obtain from Math and English examinations, how much effort they planned to put/they put into answering the questions and the level of their current happiness. All of these questions we asked before as well as after each exam. No before-Math and before-English questionnaires were collected during the baseline survey since students saw the examinations for the first time.
14
examination and additional questionnaires collected during 2011 school visits15. Due to large
attrition between 2011 and 2012 and due to the admission of new students to schools throughout
the 2012 academic year, the detailed information collected in 2011 is available for only circa 52%
of students participating in the 2012 experiment. Besides student level data, the dataset contains
information regarding school (school type, school area, school fee structure and school equipment),
headmasters and teachers (demographic information, years of experience, salary and their
opinions). For detailed logistics, stratification and randomization see Appendix.
5. Baseline summary statistics and treatment/control group comparison
The average student scored 11.1 points out of 50 in the Mathematics exam and 11.7 points out
of 50 in English. The real scores are below the student expectations. The miscallibration of own
performance is approximately 100 per cent. The average student put “a lot of effort” into answering
the exam questions (intensity 4 in the 5-likert scale) and he seems to be “very happy” according to
the immediate happiness scale (intensity 2 in the 7-likert scale when 1 is the maximum). He finds
the Mathematics exam of comparable difficulty and the English exam easier compared to the
regular exams at school. Based on the Perceived Happiness Scale (Lyubomirsky and Lepper, 1997),
the average student is overall quite happy (score 2.75 in the 7-likert scale with 1 being maximum)
and he has a low level of stress (score 1.4 in 5-likert scale when 1 means no stress; Perceived Stress
Scale by Cohen, Kamarck and Mermelstein, 1983). If the average student had a chance to have one
hour of extra time every day, he would choose education over rest in 4.3 cases out of 5; in 3.9 cases
out of 5 he would choose education over work; and in 3.1 cases out of 5 he would choose work over
rest. The aspiration measures reveal the pro-educational preferences of students compared to work
and rest. Summary statistics can be found in Appendix.
15 The detailed extensive questionnaire contains basic demographic questions in addition to questions regarding family background and family composition, parental status, education and job, wealth of the family and additional questions regarding the students’ interests, opinions, self-esteem and aspirations.

15
Data on student performance, demographics and student responses to questions suggests that
randomization divided the sample into groups that are similar in expectations (see Tables 2, 3, and
4 and Appendix for the treatment-control group comparisons). Significant differences can be
observed between across-class feedback and the control group, indicating that students in the
across-class feedback group were slightly more stressed, slightly less happy and exerted slightly
more effort compared to the control group. If the covariates are correlated with student
performance, such an imbalance could bias the estimation of the treatment effect of the
intervention (Firpo et al., 2014). One can expect some imbalances between treatment and control
groups to occur purely by chance - as the number of balance tests rises, the probability to reject
Table 2: COMPARISON OF MEAN CHARACTERISTICS OF STUDENTS, BY TREATMENT/CONTROL GROUP
Means Mean Differences
Joint P-value Within-class
Feedback (T1) Across-class
Feedback (T2) No feedback
(C)
(T1 – C)
(T2 – C) Mathematics English Sum Mathematics + English
8.063
14.072
22.134
8.838
14.630
23.468
8.655
14.432
23.088
-0.564§
-0.359
-0.923
0.197
0.198
0.395
0.183
0.699
0.426
T1 stands for within-class comparative feedback group, T2 for across-class comparative feedback group and C represents control group with no feedback provided. Robust clustered standard errors at class level are in parentheses, adjusted for stratification. § significant at 15%, * at 10%; ** at 5%; *** at 1%.
Table 3: COMPARISON OF MEAN CHARACTERISTICS OF STUDENTS, BY TREATMENT/CONTROL
GROUP
Means Mean Differences
Joint P-value Financial
Reward (Fin) Reputation
Reward (Rep) No Rewards
(No)
(Fin – No)
(Rep – No) Mathematics English Sum Mathematics + English
10.026
10.833
20.859
11.188
10.990
22.179
11.469
11.958
23.426
-1.442 (0.922) -1.125 (1.506) -2.567 (2.199)
-0.280 (0.944) -0.968 (1.913) -1.248 (2.660)
0.289
0.751
0.503
Fin stands for financially rewarded group, Rep for reputationally rewarded group and No represents the control group with no rewards. Robust standard errors adjusted for clustering at class level are in parentheses. § significant at 15%, * at 10%; ** at 5%; *** at 1%.

16
Table 4: COMPARISON OF MEAN CHARACTERISTICS OF STUDENT IN TREATMENT AND CONTROL GROUPS
Means Mean Differences Joint P-value
Within-class Feedback
(T1)
Across-class Feedback
(T2)
Control (C)
(T1 – C)
(T2 – C)
Gender Age Average class size Expected number of points from Mathematics Expected number of points from English Perceived difficulty of Math exam Perceived difficulty of English exam Immediate happiness after Math exam Immediate happiness after English exam Effort put into Math exam Effort put into English exam Subjective stress Subjective happiness Education over work Education over relax Work over relax
0.539
17.058
43.912
4.331
5.715
3.341
3.644
3.287
2.909
3.447
3.547
1.504
2.869
3.538
3.834
2.766
0.516
17.049
47.245
4.536
5.757
3.495
3.644
3.226
2.869
3.535
3.627
1.588
2.913
3.496
3.756
2.701
0.517
16.999
43.337
4.552
5.796
3.423
3.677
3.132
2.782
3.504
3.553
1.439
2.806
3.477
3.778
2.803
0.022 (0.015) 0.059
(0.079) 0.575
(3.208) -0.221 (0.150) -0.081 (0.161) -0.082§ (0.053) -0.033 (0.052) 0.155* (0.092) 0.127§ (0.085) -0.057 (0.053) -0.006 (0.046) 0.065§ (0.041) 0.064
(0.058) 0.060
(0.057) 0.056
(0.049) -0.037 (0.094)
-0.001 (0.014) 0.049
(0.078) 3.908
(3.776) -0.015 (0.145) -0.039 (0.144) 0.072
(0.052) -0.033 (0.049) 0.094
(0.092) 0.087
(0.085) 0.021
(0.052) 0.074* (0.044)
0.149*** (0.036) 0.107
(0.055)* 0.019
(0.059) -0.021 (0.049) -0.102 (0.090)
0.239
0.737
0.546
0.299
0.879
0.030
0.752
0.230
0.303
0.298
0.141
0.001
0.155
0.526
0.269
0.524
T1 stands for within-class social comparison group, T2 for across-class comparison group and C represents control group with no feedback provided. Robust clustered standard errors at class level are in parentheses, adjusted for stratification. § significant at 15%, * significant at 10%; ** significant at 5%; *** significant at 1%.
zero hypothesis of no difference between treatment and control group also increases. In my case,
treatment and control groups differ significantly in less than 5% of all cases. See the appendix for
further a comparison of (im)balances across treatment and control groups.

17
6. Results and discussion
The core question of the experiment is how different incentive schemes (social comparison,
financial and non-financial rewards) influence student performance and well-being. Tables 5 and 6
provide summaries of the estimated effects of all treatment groups based on ordinary least squares
(OLS). The first columns refer to the effects pure treatment groups: pure within-class feedback,
pure across-class feedback group, pure financial or reputation reward group. Columns 2 and 3 to
treatment interactions (i.e., each feedback combined with each reward). Test scores (baseline as
well as endline scores) were normalized with respect to the control group in round 1 in respective
stratas in order to express the results in standard deviations. Other outcomes (except confidence
measures) are categorical variables, for which the table reports estimated mean differences in
response to the treatments under the assumption of constant differences between all categories
(ordered probit results are presented later). Due to time and strict financial constraints the dataset
consists of 52 schools (146 classes), which, according to power calculations, allow detecting the
average treatment effect of 0.15 standard deviations. Therefore, lower effect sizes may not be
significant because of a lack of power. For a graphical visualization of treatment effects, see
Appendix C1; for a summary of aggregated treatment effects16 of interventions on performance and
student well-being, see Appendix C2.
Conjecture 1: Incentives increase student performance.
Conjecture 2: Incentives affect student well-being measured by happiness and stress.
In Mathematics, all incentives lead to positive improvement in student performance. Pure
within/across-class feedback led to an improvement of 0.082/0.1 standard deviations. Such results 16 E.g., the treatment effect of within-class comparative feedback (T1) is a weighted average of pure within-class comparative feedback (T1_solo), within-class comparative feedback rewarded financially (T1_fin) and reputationally (T1_rep). If one assumes equal size in all treatment groups, weights are equal to 1/3. In the absence of the equal size assumption, the weights equal to the proportion of students in particular treatment group to the overall number of students in T1 (e.g. weight_1=T1_solo/T1, weight_2=T1_fin/T1, and weight_3=T1_fin/T1).
18
are very similar to the results of Jalava et al. (2015) who tested the effects of different non-
monetary rewards (0.077 standard deviations. for criterion based grading, 0.080 standard
deviations. for tournament grading, 0.083 standard deviations. for a certificate if among the first
three students and 0.125 for competition rewarded by prize). In Pakistan, parents and teachers
received report cards regarding the performance of their children/students, which led to a 0.1
standard deviation increase in student performance (Andrabi et al., 2009). Students in Benin
(Blimpo, 2014) were involved in a tournament throughout the year and were rewarded financially
(either individually or in groups). The students improved by 0.27 to 0.34 standard deviations,
which is more than double compared to the effects of pure financial treatment in this experiment
but comparable to the results of the treatment interactions. Students who were informed about
their relative standing throughout the year and who competed for the rewards at the end of the
year improved by 0.19 to 0.28 standard deviations. In percentages, these students outperformed
students who did not receive any feedback but who competed for the same rewards by 22 to 30%
depending on the comparative feedback they received (across-class comparative feedback
delivered slightly but insignificantly higher results). Comparative feedback seems to play a
significant role in competition.
In English, the effect sizes are lower compared to the Math results and differ according to the
incentive scheme. The effect of pure comparative feedback faded away. Students lowered their
effort and decreased their performance in English compared to the control group. Students in the
pure reward groups remained motivated and improved their score but the effect size is significantly
lower compared to Mathematics. One explanation is that Math is more elastic (Bettinger, 2012). It
may be easier to detect the areas of Mathematics in which the student is failing, while in English it
may be hard to prepare for the test. It may also be a case of overall motivation. Students may have

19
low motivation to study science, because science subjects are usually perceived as more difficult17
and students may not see their usefulness in real life; but once they are incentivized (students see
real rewards instead of abstract future benefits), they improve. Current data show that students in
the control group, whose performance is mimicking student evolution in absence of the treatments,
have stagnated in Mathematics during the whole academic year (their absolute performance
decreased by 0.33 per cent) but their absolute score in English increased by 50.25 per cent. Based
on such progress, it may be easier to improve in Mathematics compared to English. Alternatively,
the pattern may be the result of an order effect (the Math examination always preceded English
examination so students lost motivation to perform better). A significant improvement in
Mathematics, but not in English can be also found in other studies, e.g. Bettinger (2012) or Reardon,
Cheadle and Robinson (2009). At this moment I can only hypothesize what the reasons are behind
such an effect due to a lack of further supportive data.
To study student well-being, I collected data on their happiness based on the Subjective
Happiness Scale (Lyubomirsky and Lepper, 1997) and subjective stress based on the Perceived
Stress Scale (Cohen, Kamarck and Mermelstein, 1983). I also repeatedly inquired about student
expectations of their own score from Mathematics and English in the testing in order to measure
their confidence. Additionally, students answered questions checking their aspirations towards
educational/work/leisure activities. I asked students the question “What would you do if you were
given an hour of extra time every day after school?” and gave them 15 binary scenarios to choose
from. Out of 15 scenarios, five asked for a choice between educational activities (such as revise
material taught at school) and work for money (such as selling vegetables on the market), five
educational versus relaxing activities (such as talking to friends) and five work versus relaxing
activities. Three aggregated variables indicate their preferences.
17 Judging also by a consistently lower number of applicants for Science subjects as opposed to Arts subjects in the National examinations held by the Ugandan National Board Examination Committee.

20
Is student well-being influenced by different treatments and their interactions? Pure
comparative feedback motivated students to improve their performance in Mathematics but not in
English (students exposed to within-class comparison even decreased their performance compared
to the control group). Students enhanced their aspirations toward education and improved the
calibration of their own abilities and therefore lowered the level of their overconfidence. Their
happiness and stress level remained unchanged. Pure reward treatments also motivated students
to improve their performance in Math but not in English. Both rewards broaden student
overconfidence as the gap between their expectations and real outcomes increased. None of the
reward treatments influenced student aspirations. Financial rewards significantly increased the
student stress level and decreased their happiness. There is a trade-off between pure feedback and
reward treatments. Feedback treatments help students to calibrate their expectations, to increase
their educational aspirations and they do not change student happiness and stress levels. A
negative side of feedback provision is that they caused a decrease in performance in English
(especially within-class comparison). Rewards did not cause a decrease in English performance but
also did not boost student aspirations. Reward provision broadens student overconfidence and on
top of that financial rewards significantly increased student stress and lowered their happiness.
Pure reward groups lack proper information regarding group members and their relative
standing within their class or other classes from other schools in the district. The analysis of the
interaction treatments reveal the value added of repeated feedback. If students were perfectly
informed, there would be no space for miscalibration of one’s abilities. In this sample, more than 80
per cent of the students are overconfident. The analysis of the treatment interactions also reveals
the following: fighting for the reputation reward increases stress and decreases happiness for both
feedback treatment groups, i.e., no matter who the competitors are, reputation rewards decrease
student well-being. For financial rewards it matters to whom the students are compared. If the
competitors are known and students are evaluated in small groups within their class, the

21
Table 5: OLS ESTIMATES OF THE EFFECTS OF DIFFERENT MOTIVATION SCHEMES ON STUDENT PERFORMANCE AND WELL-BEING
(Pure within-class feedback and its interactions)
Pure within-class feedback
Within-class feedback rewarded financially
Within-class feedback rewarded reputationally
Mathematics (st.dev) English (st.dev.) Stress Happiness Confidence (Math) Confidence (English) Aspirations Education over work Education over rest Work over rest
0.100 (0.085)
-0.128** (0.056)
0.157 (0.281) 0.405
(0.348) -7.081***
(0.775) -5.559***
(0.809)
0.023 (0.054)
0.103*** (0.039)
0.026 (0.075)
0.231* (0.118)
0.103 (0.094) 0.534§
(0.331) 1.109***
(0.351) -6.169***
(1.215) -5.190***
(1.406)
0.154*** (0.059)
0.101** (0.042) -0.147* (0.086)
0.209** (0.103)
0.087 (0.080) 0.592§
(0.396) 0.601§
(0.370) -6.468***
(0.914) -6.681***
(1.096)
0.063 (0.078) 0.059
(0.059) -0.045 (0.088)
(Pure across-class feedback and its interactions)
Pure across-class feedback
Across-class feedback rewarded financially
Across-class feedback rewarded reputationally
Mathematics English Stress Happiness Confidence (Math) Confidence (English) Aspirations Education over work Education over rest Work over rest
0.082 (0.073) -0.049 (0.059) -0.125 (0.271) 0.244
(0.300) -6.920***
(0.782) -6.267***
(0.895)
0.129*** (0.050)
0.073** (0.037) -0.033 (0.068)
0.277** (0.139) 0.173* (0.094) -0.030 (0.339) 0.227
(0.366) -5.607***
(0.897) -4.618***
(1.038)
0.154** (0.064) -0.067 (0.059) 0.045
(0.079)
0.188** (0.080)
0.047 (0.080) 0.658** (0.329) 0.781* (0.462)
-6.098*** (1.008)
-5.782*** (1.186)
0.035
(0.089) 0.042
(0.044) 0.031
(0.082) Note: Robust standard errors adjusted for clustering at class level are in parentheses. Columns (2), (4) and (6) controlled for stratum fixed effects (areas by distance from the capital city, Kampala, school performance at national examination and grade level (P6,P7, S1 up to S4). N stands for the number of observations. § significant at 15%; * significant at 10%; ** significant at 5%; *** significant at 1%

22
Table 6: OLS ESTIMATES OF THE EFFECTS OF DIFFERENT MOTIVATION SCHEMES ON STUDENT PERFORMANCE AND WELL-BEING
(Pure financial rewards and interactions)
Pure financial rewards
Within-class feedback rewarded financially
Across-class feedback rewarded financially
Mathematics English Stress Happiness Confidence (Math) Confidence (English) Aspirations Education over work Education over rest Work over rest
0.106 (0.101) 0.045
(0.088) 1.168***
(0.412) 0.562§
(0.388) 0.794
(0.892) 1.662§
(1.021)
0.031 (0.077) 0.014
(0.068) 0.045
(0.083)
0.231* (0.118)
0.103 (0.094) 0.534§
(0.331) 1.109***
(0.351) -6.169***
(1.215) -5.190***
(1.406)
0.154*** (0.059)
0.101** (0.042) -0.147* (0.086)
0.277** (0.139) 0.173* (0.094) -0.030 (0.339) 0.227
(0.366) -5.607***
(0.897) -4.618***
(1.038)
0.154** (0.064) -0.067 (0.059) 0.045
(0.079) (Pure reputational rewards and interactions)
Pure reputational rewards
Within-class feedback rewarded reputationally
Across-class feedback rewarded reputationally
Mathematics English Stress Happiness Confidence (Math) Confidence (English) Aspirations Education over work Education over rest Work over rest
0.138 (0.141) 0.016
(0.082) 0.174
(0.481) 0.225
(0.371) 1.498* (0.782)
0.987 (0.967)
0.083
(0.076) 0.037
(0.047) 0.081
(0.087)
0.209** (0.103)
0.087 (0.080) 0.592§
(0.396) 0.601§
(0.370) -6.468***
(0.914) -6.681***
(1.096)
0.063 (0.078) 0.059
(0.059) -0.045 (0.088)
0.188** (0.080)
0.047 (0.080) 0.658** (0.329) 0.781* (0.462)
-6.098*** (1.008)
-5.782*** (1.186)
0.035
(0.089) 0.042
(0.044) 0.031
(0.082) Note: Robust standard errors adjusted for clustering at class level are in parentheses. Columns (2), (4) and (6) controlled for stratum fixed effects (areas by distance from the capital city, Kampala, school performance at national examination and grade level (P6,P7, S1 up to S4). N stands for the number of observations. § significant at 15%; * significant at 10%; ** significant at 5%; *** significant at 1%

23
competition decreases student well-being. If, however, students compete against an unknown class,
financial rewards do not change the average student well-being. Reputation rewards do not have an
impact on student aspirations; financial rewards shift aspirations towards education and free time
rather than working for money. Interaction treatments decrease the average student
overconfidence, the change is, however, slightly lower compared to pure treatments, which may be
caused by the opposing effect of feedback and rewards on overconfidence (pure feedback
decreased overconfidence, pure rewards increased it, so interacted treatments decrease the gap but
with a smaller magnitude). The gap between the expectations of student about performance and
their real performance is closing step-by-step, which means that students needed time to change
their behavior.
7. Gender differences and disentangling the channels of the average treatment effects
Responses to many interventions seem to be gender-sensitive18. Angrist and Lavy (2009)
studied the effects of cash incentives on matriculation rates among Israeli students. Girls, contrary
to boys, substantially increased their performance. A higher effect among girls was also found in the
analysis of voucher provision within the PACES program in Colombia (Angrist et al., 2002).
Stronger responsiveness to incentives among girls can be also found in studies of tuition provision
by Dynarski (2008), early childhood interventions by Anderson (2008), housing vouchers by Kling
et al. (2007) or public sector programs by Lalonde (1995) and others19.
Conjecture 3: Girls and boys’ motivation reacts differently to different incentive schemes.
Conjecture 4: Boys and girls’ well-being is influenced differently.
18 See literature on gender differences as in Croson and Gneezy (2009) 19 For a review of gender differences in risk preferences, other-regarding preferences and competitive preferences, see Croson and Gneezy (2009)

24
Table 7: OLS ESTIMATES OF THE EFFECTS OF DIFFERENT MOTIVATION SCHEMES ON STUDENT PERFORMANCE AND WELL-BEING
(Pure within-class feedback and interactions)
Pure within-class feedback
Within-class feedback rewarded financially
Within-class feedback rewarded reputationally
Girls Boys Girls Boys Girls Boys Mathematics (st.dev) English (st.dev.) Stress Happiness Confidence (Math) Confidence (English) Aspirations Education over work Education over rest Work over rest
0.121§ (0.081) -0.141** (0.059)
0.185 (0.317) 0.088
(0.332) -7.385*** (0.929)
-5.023*** (0.994)
-0.035 (0.079) 0.017
(0.047) 0.038
(0.069)
0.076 (0.107) -0.116§ (0.072)
0.109 (0.305) 0.812* (0.472) -4.13*** (0.954) -2.79*** (0.909)
0.098
(0.082) 0.219*** (0.068) -0.009 (0.113)
0.229* (0.118)
0.016 (0.092)
0.662** (0.298)
1.163*** (0.388)
-6.104*** (1.214)
-5.528*** (1.375)
0.163** (0.081) 0.109** (0.044) -0.043 (0.091)
0.228* (0.137) 0.199* (0.116)
0.368 (0.485)
1.077** (0.427) -4.07*** (1.249)
-4.604*** (1.363)
0.146* (0.086)
0.098 (0.074)
-0.267** (0.110)
0.201** (0.102)
0.069 (0.088) 0.459
(0.407) 0.277
(0.439) -5.324***
(1.144) -5.722***
(1.115)
0.052 (0.094) 0.061
(0.061) -0.027 (0.093)
0.204§ (0.129)
0.092 (0.094) 0.803* (0.461)
1.137*** (0.424)
-6.604*** (1.069)
-5.129*** (1.193)
0.042
(0.101) 0.046
(0.099) -0.057 (0.117)
(Pure across-class feedback and interactions)
Pure across-class feedback
Across-class feedback rewarded financially
Across-class feedback rewarded reputationally
Girls Boys Girls Boys Girls Boys Mathematics English Stress Happiness Confidence (Math) Confidence (English) Aspirations Education over work Education over rest Work over rest
0.135* (0.077) -0.076 (0.066) -0.256 (0.306) 0.076
(0.341) -8.148*** (0.841)
-6.013*** (0.980)
0.101
(0.072) 0.023
(0.044) 0.038
(0.069)
0.009 (0.088) -0.019 (0.072) 0.040
(0.308) 0.476
(0.374) -4.74*** (1.083) -4.49*** (1.058)
0.174* (0.089) 0.140** (0.067) -0.103 (0.100)
0.275* (0.159)
0.108 (0.101) -0.041 (0.376) -0.084 (0.417)
-6.948*** (1.170)
-6.528*** (1.154)
0.099
(0.093) -0.049 (0.069) -0.043 (0.091)
0.284§
(0.173) 0.249** (0.112) -0.057 (0.399) 0.736§
(0.497) -4.597*** (1.538)
-4..047*** (1.363)
0.219** (0.105) -0.091 (0.096) -0.011 (0.120)
0.189** (0.091)
0.041 (0.083)
0.559* (0.311)
0.583 (0.547)
-6.957*** (1.406)
-6.411*** (1.580)
0.101
(0.091) -0.006 (0.066) -0.027 (0.093)
0.175* (0.103)
0.042 (0.103) 0.735§
(0.447) 0.921* (0.467)
-6.125*** (1.675)
-5.327*** (1.579)
-0.026 (0.136) 0.109
(0.087) -0.069 (0.112)

25
Table 8: OLS ESTIMATES OF THE EFFECTS OF DIFFERENT MOTIVATION SCHEMES ON STUDENT PERFORMANCE AND THEIR WELL-BEING
(Pure financial rewards and interactions)
Pure financial rewards
Within-class feedback rewarded financially
Across-class feedback rewarded financially
Girls Boys Girls Boys Girls Boys Mathematics (st.dev) English (st.dev.) Stress Happiness Confidence (Math) Confidence (English) Aspirations Education over work Education over rest Work over rest
0.018 (0.102) -0.038 (0.097)
1 .106** (0.509)
0.056 (0.436) 1.869* (1.074) 2.239** (1.108)
0.046
(0.098) 0.009
(0.078) -0.017 (0.092)
0.207* (0.123)
0.139 (0.112)
1.239*** (0.415)
1.231** (0.507) -1.322 (1.429) -0.387 (1.099)
0.006
(0.111) 0.016
(0.083) 0.137
(0.112)
0.229* (0.118)
0.016 (0.092) 0.662** (0.298)
1.163*** (0.388)
-6.104*** (1.214)
-5.528*** (1.375)
0.163** (0.081) 0.109** (0.044) -0.043 (0.091)
0.228* (0.137) 0.199* (0.116)
0.368 (0.485)
1.077** (0.427) -4.07*** (1.249)
-4.604*** (1.363)
0.146* (0.086)
0.098 (0.074)
-0.267** (0.110)
0.275* (0.159)
0.108 (0.101) -0.041 (0.376) -0.084 (0.417)
-6.948*** (1.170)
-6.528*** (1.154)
0.099
(0.093) -0.049 (0.069) -0.043 (0.091)
0.284§
(0.173) 0.249** (0.112) -0.057 (0.399) 0.736§
(0.497) -4.597*** (1.538)
-4..047*** (1.363)
0.219** (0.105) -0.091 (0.096) -0.011 (0.120)
(Pure reputational rewards and interactions)
Pure reputation rewards
Within-class feedback rewarded reputationally
Across-class feedback rewarded reputationally
Girls Boys Girls Boys Girls Boys Mathematics English Stress Happiness Confidence (Math) Confidence (English) Aspirations Education over work Education over rest Work over rest
0.059 (0.147) -0.039 (0.087) -0.021 (0.521) -0.020 (0.443) 1.905* (0.972)
0.989 (1.096)
0.021
(0.096) -0.017 (0.061) 0.164* (0.088)
0.218 (0.154) 0.079
(0.106) 0.406
(0.502) 0.549
(0.393) -0.399 (1.224) -1.301 (1.008)
0.165§
(0.101) 0.109
(0.078) -0.004 (0.131)
0.201** (0.102)
0.069 (0.088) 0.459
(0.407) 0.277
(0.439) -5.324***
(1.144) -5.722***
(1.115)
0.052 (0.094) 0.061
(0.061) -0.027 (0.093)
0.204§ (0.129)
0.092 (0.094) 0.803* (0.461)
1.137*** (0.424)
-6.604*** (1.069)
-5.129*** (1.193)
0.042
(0.101) 0.046
(0.099) -0.057 (0.117)
0.189** (0.091)
0.041 (0.083)
0.559* (0.311)
0.583 (0.547)
-6.957*** (1.406)
-6.411*** (1.580)
0.101
(0.091) -0.006 (0.066) -0.027 (0.093)
0.175* (0.103)
0.042 (0.103) 0.735§
(0.447) 0.921* (0.467)
-6.125*** (1.675)
-5.327*** (1.579)
-0.026 (0.136) 0.109
(0.087) -0.069 (0.112)

26
The results of this experiment show that girls react positively to feedback provision (0.12 –
0.14 standard deviations) even if they are not offered rewards. Once included in a competitive
environment, girls improve by 0.2 to 0.28 standard deviations. Therefore, girls can perform the
same way as boys if they receive feedback about their performance, the performance of their group
and the group’s relative standing. In the absence of feedback, girls do not improve at all. Boys
improved if they were offered rewards (with or without feedback) by 0.18 to 0.28 standard
deviations but do not react to pure feedback provision. I attribute the gender difference in reaction
to different treatments to the existence of two types of competition: intrinsic, or internally driven,
competition developed by personal feelings based on comparison to others, and extrinsic
competition coming from offered rewards. These results are of special help to policy makers whose
aim is to influence the performance of both girls and boys.
8. Attrition
High drop-out and absence rates are common features of students in developing countries and
it is not an exception in my data. There are several reasons. Some students did not have the money
to pay the school fees and decided to change schools to avoid repaying their debt, others changed
their school because of family reasons (the family moved to a different area, they were sent to live
with other family members, etc.), some completely dropped out of school, some just registered as
new students and some of the students passed away. Due to the constraints of the experiment, all
participation data are based on our visits only (it means that no random visits were organized).
The main concern in most project evaluations is whether the attrition of subjects is random or
whether there is a systematic difference between the attrition from the treatment group compared
to the control group caused by the intervention itself. Only uninformed students, who did not
receive feedback during the academic year and who were chosen to participate in a tournament

27
rewarded with reputation rewards did not significantly change their attrition. All other treatment
groups lowered their absences compared to the control group ranging from 6.5 to 17 per cent.
Lower attrition means higher attendance.
Who are the attrited students? Random versus non-random attrition
The treatments influenced the probability of always being present during our visits and the
probability to attrite. So in absolute numbers there are less students who drop out from treated
classes compared to the control classes and more cases when students from the treatment group
attended all five testing rounds compared to students from the control group. Besides the
differences in the number of attrited students, students who dropped from the within-class
feedback group are worse in terms of their initial performance compared to students from the
across-class feedback group or the control group. That might re-introduce a bias if the treated
students who are present during the final testing round are systematically different compared to
the control-group students. As shown in Table 9, this is not the case in this project. The distribution
of students who stayed in either of the treatment groups (based on their initial performance) is not
statistically different from the distribution of the initial abilities of students from the treatment
group. In other words, before, as well as after the treatment the composition of students in terms of
their initial ability is on average the same. In such a case the OLS estimate should provide unbiased
Table 9: KSMIRNOV TEST ON EQUALITY OF DISTRIBUTIONS OF STUDENTS WHO ATTRITED AND STUDENTS WHO STAYED, BY T/C GROUP P-VALUES PRESENTED
Baseline differences Students who attrited
Students who stayed
Alwayspresent students
(T1 – C) (T2 – C) (T1 – C) (T2 – C) (T1 – C) (T2 – C) (T1 – C) (T2 – C)
Mathematics English
0.123 0.952
0.274 0.168
0.000 0.003
0.158 0.546
0.752 0.230
0.192 0.282
0.677 0.211
0.958 0.840
T1 stands for within-class social comparison group, T2 for across-class comparison group and C represents control group with no feedback provided. P-values are presented.

28
estimates of the treatment effects. Nevertheless, I used inverse probability weights and imputation
methods to check the stability of the results (for further details see the next section).
The effect of treatments on attrition
Estimates of treatment effects can be biased if the attrition from control versus treatment
groups systematically differs and the difference is caused by the presence of the treatment.
Students in treatment groups attrite less often in absolute values and are more often present in all
five testing rounds compared to their control-group counterparts. In order to see whether and to
what extent social comparison and reward treatments influence the probability of dropping out. I
run a probit model on attrition and full attendance on all treatment dummies controlling for strata
variables (Table 10).
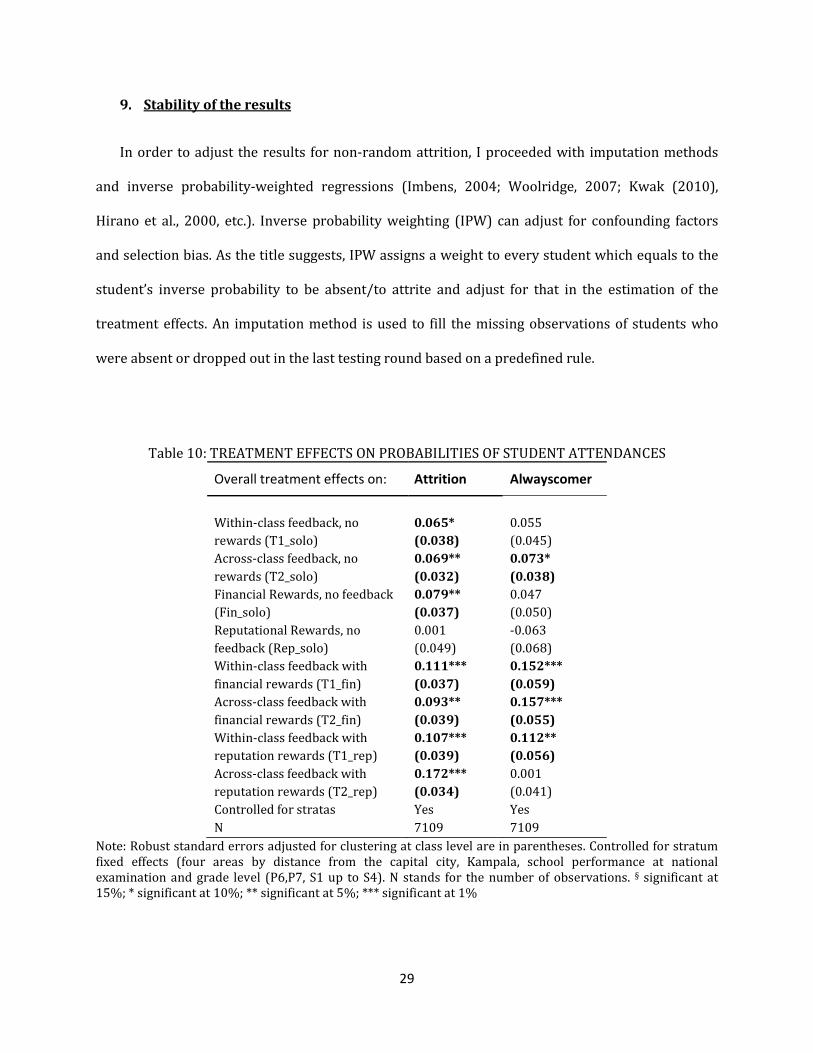
The attrition rate comprises of students who missed our last testing round but attended the
baseline testing at the beginning of the project. Non-rewarded students exposed to both within and
across-class social comparison feedback have from 6.5 to 6.9 per cent lower probability to miss the
final testing round. Among rewarded students who did not receive any feedback only students
rewarded financially lowered their attrition by 7.9 per cent. Reputation rewards without provided
feedback do not affect attrition rate. All treatment interactions lower the attrition rate (from 9.3 to
17.2 per cent).
As previously discussed, despite the different attrition across treatment and control groups,
students who remained at schools in the last testing round are on average the same in terms of
initial characteristics and therefore the OLS estimates should not be biased. In the following section
I run alternative specifications to compare OLS estimates with estimates that correct for possible
attrition bias.
29
9. Stability of the results
In order to adjust the results for non-random attrition, I proceeded with imputation methods
and inverse probability-weighted regressions (Imbens, 2004; Woolridge, 2007; Kwak (2010),
Hirano et al., 2000, etc.). Inverse probability weighting (IPW) can adjust for confounding factors
and selection bias. As the title suggests, IPW assigns a weight to every student which equals to the
student’s inverse probability to be absent/to attrite and adjust for that in the estimation of the
treatment effects. An imputation method is used to fill the missing observations of students who
were absent or dropped out in the last testing round based on a predefined rule.
Table 10: TREATMENT EFFECTS ON PROBABILITIES OF STUDENT ATTENDANCES
Overall treatment effects on: Attrition Alwayscomer
Within-class feedback, no rewards (T1_solo) Across-class feedback, no rewards (T2_solo) Financial Rewards, no feedback (Fin_solo) Reputational Rewards, no feedback (Rep_solo) Within-class feedback with financial rewards (T1_fin) Across-class feedback with financial rewards (T2_fin) Within-class feedback with reputation rewards (T1_rep) Across-class feedback with reputation rewards (T2_rep) Controlled for stratas N
0.065* (0.038) 0.069** (0.032) 0.079** (0.037) 0.001 (0.049) 0.111*** (0.037) 0.093** (0.039) 0.107*** (0.039) 0.172*** (0.034) Yes 7109
0.055 (0.045) 0.073* (0.038) 0.047 (0.050) -0.063 (0.068) 0.152*** (0.059) 0.157*** (0.055) 0.112** (0.056) 0.001 (0.041) Yes 7109
Note: Robust standard errors adjusted for clustering at class level are in parentheses. Controlled for stratum fixed effects (four areas by distance from the capital city, Kampala, school performance at national examination and grade level (P6,P7, S1 up to S4). N stands for the number of observations. § significant at 15%; * significant at 10%; ** significant at 5%; *** significant at 1%

30
Table 11: COMPARISON OF THE ESTIMATES OF THE EFFECTS OF DIFFERENT MOTIVATION SCHEMES ON STUDENT PERFORMANCE IN MATHEMATICS
Dependent variable: Math score OLS IPW Imputation
(median ratio) Imputation
(class percentiles)
PURE TREATMENTS Within-class feedback, no rewards (T1_solo) Across-class feedback, no rewards (T2_solo) Financial Rewards, no feedback (Fin_solo) Repurational Rewards, no feedback (Rep_solo) TREATMENT INTERACTIONS Within-class feedback, monetary reward (T1_fin) Across-class feedback, monetary reward (T2_fin) Within-class feedback, reputation reward (T1_rep) Across-class feedback, reputation reward (T2_rep) Controlled for stratas
0.100
(0.085) 0.082
(0.073) 0.106
(0.101) 0.138
(0.141)
0.231* (0.118) 0.277** (0.139) 0.209** (0.103) 0.188** (0.080)
Yes
0.035
(0.091) 0.061
(0.081) 0.112
(0.099) 0.135
(0.136)
0.267** (0.132)
0.388*** (0.136) 0.187§
(0.114) 0.173* (0.089)
Yes
0.133* (0.079) 0.129* (0.068) 0.169* (0.096) 0.206* (0.124)
0.281** (0.129) 0.331** (0.128) 0.266** (0.073) 0.186** (0.073)
Yes
0.123
(0.085) 0.087
(0.078) 0.143
(0.106) 0.177
(0.128)
0.273** (0.124) 0.305** (0.139) 0.258** (0.112)
0.250*** (0.090)
Yes
Note: Robust standard errors adjusted for clustering at class level are in parentheses. Controlled for stratum fixed effects (four areas by distance from the capital city, Kampala, school performance at national examination and grade level (P6,P7, S1 up to S4). N stands for the number of observations. § significant at 15%; * significant at 10%; ** significant at 5%; *** significant at 1%
Table 11 and Appendix provide the comparison of ordinary least squares estimations (column
1) of the treatment effects to the weighted least squares using inverse probability weights (column
2), separately for Math and English. Correcting for the probability of dropping out, treatment effects
are similar or slightly higher in absolute terms but not significantly different. The results of the
imputation methods (columns 3, 4 and 5) bring similar conclusions. I use two different measures to
impute missing observations – median ration and the class percentile ranks (inspired by Krueger,
1999). All of the measures take the advantage of repeated school visits and follow the same logic – if
the observation from the last school visit is missing, I look at the last score available and adjust for

31
the differences in test difficulty. The same procedure is done to impute Math and English scores
separately. The median ratio measure imputes the last available observation and the class
percentile ranks take into consideration the rank of the student in the last available distribution
and impute the score corresponding to the student of the same rank in the final visit distribution.
The imputation method artificially fills missing observations and the results serve only as bounds.
Both imputation measures deliver similar or stronger results compared to ordinary least squares.
Ordinary least squares results are also comparable to the weighted regression estimates.
10. Conclusion
A number of interventions has been conducted with the aim of lowering absenteeism and
increasing student performance. Authors usually focus on the main outcomes of their interventions,
such as absence or drop-out rates and changes in performance, leaving outcomes other than
learning aside. Evidence from psychology indicates that current well-being, measured in terms of
stress and happiness, serves as an important prerequisite of future performance. For instance,
stressed students are absent and drop out from school more often compared to non-stressed
students; stress make students exert less effort and perform worse. This paper contributes to the
current literature by studying the effects of different types of incentives on student performance
and their well-being (measured by happiness and stress). I offer a perspective based on
performance-versus-well-being tradeoff by implementing two types of social comparative feedback
regimes, within- and across-class group comparisons, and two types of incentive regimes, financial
and reputation rewards, and their interactions.
The results of my study show that stressed students exerted less effort, performed worse on
average and attrited by 29 percent more compared to relaxed students. Rewards (both financial
and reputational) motivate student to perform better. Students improved their performance by
between 0.09 and 0.27 standard deviations, depending on the type of treatment they were
32
randomized into. The well-being of the students who were only offered rewards (without any
feedback) increased their stress level and decreased their happiness, whereas the well-being of
students who received only feedback remained unchanged. If the students who received feedback
were offered rewards, performance increased by more than 100%, their well-being was, however,
harmed. Policy makers should therefore compare short-term medium-to-high performance
increases in response to reward provision which decrease well-being that can potentially harm
future performance, compared to a mild performance increase without harming well-being and
future performance. Furthermore, this paper sheds light on the reasons behind gender differences
in responsiveness to different incentive provisions. I attribute the difference to the existence of two
types of competition – intrinsic or internally driven competition developed by personal feelings
based on comparison to others and extrinsic competition coming from offered rewards. According
to the results, if you give rewards to girls and you do not provide them with any feedback, they will
significantly underperform boys. However, if you repeatedly inform girls regarding their position
(no matter what type of feedback they receive), they will perform comparably to boys. Comparative
feedback plays a crucial role for girls in inducing their performance in a tournament environment.
Boys react only to rewards. The gender difference in reaction to the treatment may help to explain,
why in some experiments, girls and boys reacted differently.
The results of this experiment may be important especially for policy makers trying to find the
optimal incentive scheme. Policy makers must exercise a great amount of caution in designing
educational rewards and consider the impact on student well-being. Further research should be
conducted with the aim to study the long-term effects of changes in student well-being on
performance.

33
References
Andrabi, T., Das J. and Ijaz-Khwaja, A. (2009): Report Cards: The Impact of Providing School and Child Test-scores on Educational Markets, BREAD Working Paper No. 226
Angrist, J., Bettinger, E., and Kremer, M. (2006): Long-term educational consequences of secondary school vouchers: Evidence from administrative records in Colombia, The American Economic Review, 847-862.
Angrist, J., and Lavy, V. (2009): The effects of high stakes high school achievement awards: Evidence from a randomized trial. The American Economic Review, 1384-1414.
Arnold, H. J. (1976): Effects of performance feedback and extrinsic reward upon high intrinsic motivation, Organizational Behavior and Human Performance, 17(2), 275-288.
Ashraf, N., Bandiera, O., and Lee, S. S. (2014): Awards unbundled: Evidence from a natural field experiment, Journal of Economic Behavior and Organization,100, 44-63.
Auriol, E., and Renault, R. (2008): Status and incentives, The RAND Journal of Economics, 39(1), 305-326.
Azmat, G., Bagues, M., Cabrales, A. and Iriberri, N. (2015): What you know can’t hurt you (for long): A field experiment on relative performance feedback, Working paper, Aalto University.
Azmat, G. and Iriberri, N. (2010): The importance of relative performance feedback information: Evidence from a natural experiment using high school students. Journal of Public Economics, 94(7), 435-452
Bandiera, O., Barankay, I., and Rasul, I. (2010): Social incentives in the workplace, The Review of Economic Studies, 77(2), 417-458.
Bandiera, O., Larcinese, V., and Rasul, I. (2015): Blissful ignorance? A natural experiment on the effect of feedback on students' performance, Labour Economics, 34, 13-25
Barankay, I. (2011). Rankings and social tournaments: Evidence from a crowd-sourcing experiment. In Wharton School of Business, University of Pennsylvania Working Paper.
Benabou, R., and Tirole, J. (2003): Intrinsic and extrinsic motivation, The Review of Economic Studies, 70(3), 489-520.
Besley, T., and Ghatak, M. (2008): Status incentives, The American Economic Review, 206-211.
Bettinger, E. P. (2012): Paying to learn: The effect of financial incentives on elementary school test scores. Review of Economics and Statistics, 94(3), 686-698.
Blanes i Vidal, J., and Nossol, M. (2011): Tournaments without prizes: Evidence from personnel records, Management Science, 57(10), 1721-1736.

34
Blimpo, M. P. (2014): Team incentives for education in developing countries: A randomized field experiment in Benin, American Economic Journal: Applied Economics, 6(4), 90-109.
Buunk, B. P., Gibbons, F. X., and Reis-Bergan, M. (1997): Social comparison in health and illness: A historical overview. Health, coping and well-being: Perspectives from social comparison theory, 1-23.
Buunk, B. P., and Gibbons, F. X. (2000): Toward an enlightenment in social comparison theory, In Handbook of Social Comparison (pp. 487-499), Springer US.
Burgers, C., Eden, A., van Engelenburg, M. D., and Buningh, S. (2015): How feedback boosts motivation and play in a brain-training game, Computers in Human Behavior, 48, 94-103.
Charness, G., Masclet, D., and Villeval, M. C. (2010): Competitive preferences and status as an incentive: Experimental evidence, Groupe d’Analyse et de Théorie Économique Working Paper, (1016).
Cohen, S., Kamarck, T., and Mermelstein, R. (1983): A global measure of perceived stress, Journal of health and social behavior, 385-396.
Croson, R., and Gneezy, U. (2009): Gender differences in preferences, Journal of Economic literature, 448-474.
Deci, E. L. (1971): Effects of externally mediated rewards on intrinsic motivation, Journal of personality and Social Psychology, 18(1), 105.
Deci, E. L., Koestner, R., and Ryan, R. M. (1999): A meta-analytic review of experiments examining the effects of extrinsic rewards on intrinsic motivation, Psychological bulletin, 125(6), 627.
Dijkstra, P., Kuyper, H., van der Werf, G., Buunk, A.P. and van der Zee, Y. (2008): Social comparison in the classroom: a review, Review of educational research, Vol. 78, No. 4, p.828-879
Dolan, P., Metcalfe, R., and Powdthavee, N. (2008): Electing happiness: Does happiness affect voting and do elections affect happiness, Discussion Papers in Economics, (30).
Duffy, J., and Kornienko, T. (2010): Does competition affect giving?, Journal of Economic Behavior and Organization, 74(1), 82-103.
Dynarski, S. (2008): Building the stock of college-educated labor, Journal of human resources, 43(3), 576-610.
Eisenkopf, G. (2011): Paying for better test scores, Education Economics,19(4), 329-339.
Ellingsen, T., and Johannesson, M. (2007): Paying respect, The Journal of Economic Perspectives, 135-150.

35
Eriksson, T., Poulsen, A., and Villeval, M. C. (2009): Feedback and incentives: Experimental evidence, Labour Economics, 16(6), 679-688.
Falk, A. and Ichino, A. (2006): Clean Evidence on Peer Pressure, Journal of Labor Economics, Vol. 24, Issue 1
Festinger, L. (1954): A theory of social comparison processes, Human relations, 7(2), 117-140.
Fordyce, M. W. (1988): A review of research on the happiness measures: A sixty second index of happiness and mental health, Social Indicators Research, 20(4), 355-381.
Frey, B. S., and Jegen, R. (2000): Motivation crowding theory: A survey of empirical evidence. Zurich IEER Working Paper No. 26; CESifo Working Paper Series No. 245
Fryer Jr, R. G. (2010): Financial incentives and student achievement: Evidence from randomized trials (No. w15898), National Bureau of Economic Research.
Hannan, R. L., Krishnan, R., and Newman, A. H. (2008): The effects of disseminating relative performance feedback in tournament and individual performance compensation plans, The Accounting Review, 83(4), 893-913.
Helliwell, J. F., and Wang, S. (2012): The state of world happiness, World happiness report, 10-57.
Hastings, J. S., Neilson, C. A., and Zimmerman, S. D. (2012): The effect of school choice on intrinsic motivation and academic outcomes (No. w18324), National Bureau of Economic Research.
Hattie, J., and Timperley, H. (2007): The power of feedback. Review of educational research, 77(1), 81-112.
Hirano, K., Imbens, G. and G. Ridder (2003): Efficient Estimation of Average Treatment Effects Using the Estimated Propensity Score, Econometrica, Vol. 71(4), 1161–1189
Hoxby, C. (2000): Peer effects in the classroom: Learning from gender and race variation (No. w7867), National Bureau of Economic Research.
Imbens, G.W. (2004): Nonparametric estimation of average treatment effects under exogeneity: A review, The Review of Economics and Statistics: Vol 86, No.1, pp 4-29.
Jalava, N., Joensen, J.S. and Pellas, E. (2015): Grades and rank: Impacts of non-financial incentiveson test performance, Journal of Economic Behavior and Organization 115 (2015) 161–196
Juster, R. P., McEwen, B. S., and Lupien, S. J. (2010): Allostatic load biomarkers of chronic stress and impact on health and cognition, Neuroscience and Biobehavioral Reviews, 35(1), 2-16.
Kling, J. R., Liebman, J. B., and Katz, L. F. (2007): Experimental analysis of neighborhood effects, Econometrica, 75(1), 83-119.
36
Kremer, M., Miguel, E. and Thornton, R. (2002): Incentives to Learn, NBER Working Papers 10971, National Bureau of Economic Research, Inc.
Krueger, A. B. (1999): Experimental estimates of education production functions, The Quarterly Journal of Economics, 114 (2): 497-532
Kosfeld, M. and Neckermann, S. (2011): Getting More Work for Nothing? Symbolic Awards and Worker Performance, American Economic Journal: Microeconomics, Vol. 3, Issue 3
Kremer, M., Miguel, E., and Thornton, R. (2004): Incentives to learn (No. w10971), National Bureau of Economic Research.
Kuhnen, C. M., and Tymula, A. (2012): Feedback, self-esteem, and performance in organizations, Management Science, 58(1), 94-113.
Kwak, D. (2010): Inverse probability weighted estimation for the effect of kindergarten enrollment age and peer quality on student academic achievement for grades K-12, working paper
LaLonde, R. J. (1995): The promise of public sector-sponsored training programs, The Journal of Economic Perspectives, 149-168.
Lavy, V. (2009): Performance Pay and Teachers’ Effort, Productivity and Grading Ethics, American Economic Review 99, 5
Levitt, S. D., List, J. A., Neckermann, S., and Sadoff, S. (2012): The behavioralist goes to school: Leveraging behavioral economics to improve educational performance (No. w18165), National Bureau of Economic Research.
Locke, E. A., and Latham, G. P. (1990): A theory of goal setting and task performance, Prentice-Hall, Inc.
Lupien, S. J., McEwen, B. S., Gunnar, M. R., and Heim, C. (2009): Effects of stress throughout the lifespan on the brain, behaviour and cognition, Nature Reviews Neuroscience, 10(6), 434-445.
Lyubomirsky, S., and Lepper, H. (1999): A measure of subjective happiness: Preliminary reliability and construct validation, Social Indicators Research, 46, 137-155. The original publication is available at www.springerlink.com.
McEwen, B. S. (2008): Central effects of stress hormones in health and disease: Understanding the protective and damaging effects of stress and stress mediators, European journal of pharmacology, 583(2), 174-185.
MacKerron, G. (2012): Happiness economics from 35 000 feet. Journal of Economic Surveys, 26(4), 705-735.
Markham, S. E., Scott, K., and McKEE, G. A. I. L. (2002): Recognizing good attendance: a longitudinal, quasi-experimental field study. Personnel Psychology, 55(3), 639-660.

37
Mas, A. and Moretti, E. (2009): Peers at Work, American Economic Review, Vol. 99, Issue 1 31
Mettee, D. R., and Smith, G. (1977): Social comparison and interpersonal attraction: The case for dissimilarity. Social comparison processes: Theoretical and empirical perspectives, 69, 101.
Moldovanu, B., Sela, A., and Shi, X. (2007): Contests for status, Journal of Political Economy, 115(2), 338-363.
Ray, D. (2002): Aspirations, poverty and economic change, Understanding Poverty, 2006, p. 409-443(35)
Reardon, S. F., Cheadle, J. E., and Robinson, J. P. (2009): The effect of Catholic schooling on math and reading development in kindergarten through fifth grade, Journal of Research on Educational Effectiveness, 2(1), 45-87.
Ryan, R. M., and Deci, E. L. (2000): Intrinsic and extrinsic motivations: Classic definitions and new directions, Contemporary educational psychology, 25(1), 54-67.
Sacerdote, B. (2011): Peer effects in education: How might they work, how big are they and how much do we know thus far?, Handbook of the Economics of Education, 3, 249-277.
Slavin, R. (1984). Meta-analysis in education: How has it been used? Educational Researcher. 13(8), 6-15, 24-27
Schneiderman, N., Ironson, G., and Siegel, S. D. (2005): Stress and health: psychological, behavioral, and biological determinants, Annual Review of Clinical Psychology, 1, 607.
Suls, J., and Wheeler, L. (2000): A selective history of classic and neo-social comparison theory, In Handbook of social comparison (pp. 3-19). Springer US.
Bigoni, M., Fort, M., Nardotto, M., and Reggiani, T. (2011): Teams or tournaments? A field experiment on cooperation and competition among university students.
Tran, A., and Zeckhauser, R. (2012): Rank as an inherent incentive: Evidence from a field experiment, Journal of Public Economics, 96(9), 645-650.
Van Dijk, F., Sonnemans, J., and Van Winden, F. (2001): Incentive systems in a real effort experiment, European Economic Review, 45(2), 187-214.
Veenhoven, R. (1988): The utility of happiness, Social indicators research,20(4), 333-354.
Weiss, Y., and Fershtman, C. (1998): Social status and economic performance:: A survey,European Economic Review, 42(3), 801-820.
Wolf, T. M. (1994): Stress, coping and health: enhancing well-being during medical school, Medical Education, 28(1), 8-17.
Wooldridge, J. (2007): Inverse Probability Weighted M-Estimation for General Missing Data Problems, Journal of Econometrics 141:1281-1301

38
Appendix
A: Summary statistics and randomization balance
A1. BALANCE BETWEEN CONTROL AND TREATMENT GROUPS
Variable Control Within-class feedback
Across-class feedback
School Level: The number of primary schools The number of secondary schools School Type: Public Schools Private Schools Community Schools By Population By PLE/UCE results By testing results
10 7
8 7 2
2345 (48 groups)
3.175
21.140
11 7
5 9 4
2415 (51 groups)
3.039
21.363
10 8
6 8 4
2371 (51 groups)
3.102
21.648 Note: min(PLE/UCE)= 1.7397, max(PLE/UCE)= 4.2857, mean(PLE/UCE)=3.1040 Note: min(TR)=8.3125, max(TR)=39.7765, mean(TR)=21.3192, where TR=Testing Results
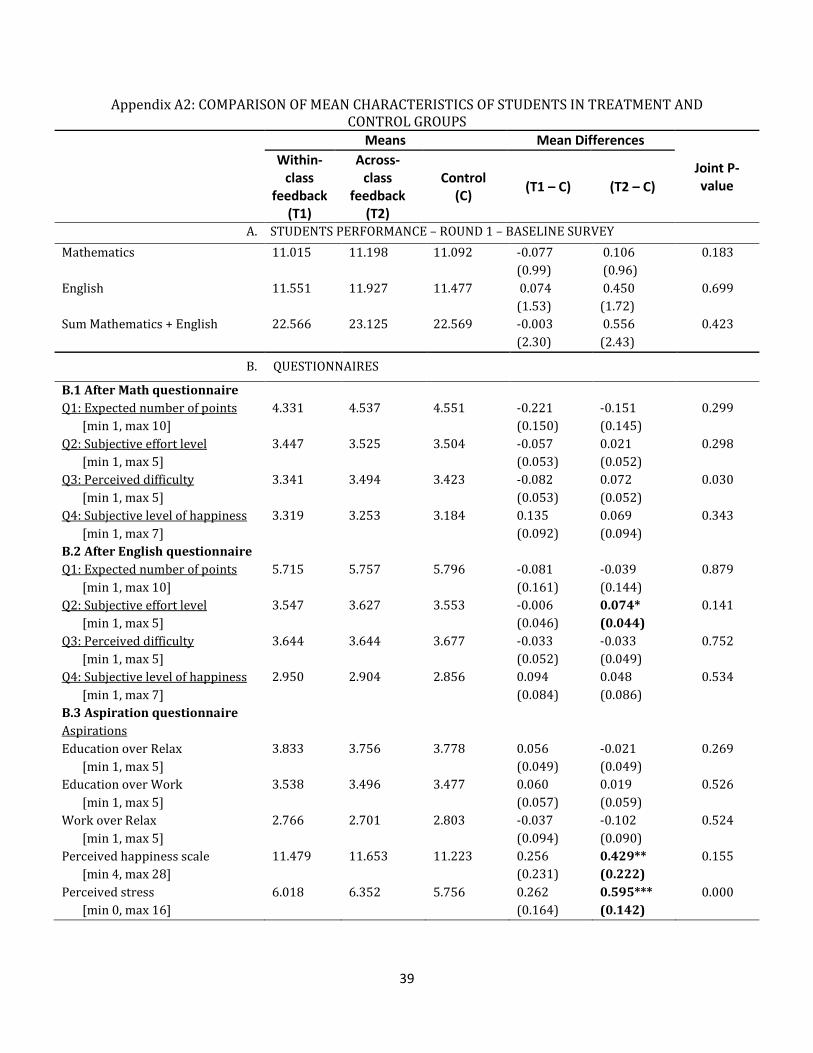
39
Appendix A2: COMPARISON OF MEAN CHARACTERISTICS OF STUDENTS IN TREATMENT AND CONTROL GROUPS
Means Mean Differences
Joint P-value
Within-class
feedback (T1)
Across-class
feedback (T2)
Control (C) (T1 – C) (T2 – C)
A. STUDENTS PERFORMANCE – ROUND 1 – BASELINE SURVEY Mathematics English Sum Mathematics + English
11.015 11.551 22.566
11.198 11.927 23.125
11.092 11.477 22.569
-0.077 (0.99) 0.074 (1.53) -0.003 (2.30)
0.106 (0.96) 0.450 (1.72) 0.556 (2.43)
0.183
0.699
0.423
B. QUESTIONNAIRES
B.1 After Math questionnaire Q1: Expected number of points [min 1, max 10] Q2: Subjective effort level [min 1, max 5] Q3: Perceived difficulty [min 1, max 5] Q4: Subjective level of happiness [min 1, max 7] B.2 After English questionnaire Q1: Expected number of points [min 1, max 10] Q2: Subjective effort level [min 1, max 5] Q3: Perceived difficulty [min 1, max 5] Q4: Subjective level of happiness [min 1, max 7] B.3 Aspiration questionnaire Aspirations Education over Relax [min 1, max 5] Education over Work [min 1, max 5] Work over Relax [min 1, max 5] Perceived happiness scale [min 4, max 28] Perceived stress [min 0, max 16]
4.331 3.447 3.341 3.319 5.715 3.547 3.644 2.950 3.833 3.538 2.766 11.479 6.018
4.537 3.525 3.494 3.253 5.757 3.627 3.644 2.904 3.756 3.496 2.701 11.653 6.352
4.551 3.504 3.423 3.184 5.796 3.553 3.677 2.856 3.778 3.477 2.803 11.223 5.756
-0.221 (0.150) -0.057 (0.053) -0.082 (0.053) 0.135 (0.092) -0.081 (0.161) -0.006 (0.046) -0.033 (0.052) 0.094 (0.084) 0.056 (0.049) 0.060 (0.057) -0.037 (0.094) 0.256 (0.231) 0.262 (0.164)
-0.151 (0.145) 0.021 (0.052) 0.072 (0.052) 0.069 (0.094) -0.039 (0.144) 0.074* (0.044) -0.033 (0.049) 0.048 (0.086) -0.021 (0.049) 0.019 (0.059) -0.102 (0.090) 0.429** (0.222) 0.595*** (0.142)
0.299
0.298
0.030
0.343
0.879
0.141
0.752
0.534
0.269
0.526
0.524
0.155
0.000

40
Appendix A3: COMPARISON OF MEAN CHARACTERISTICS OF STUDENTS IN TREATMENT AND CONTROL GROUPS (Continued)
Means Mean Differences
Joint P-value
Within-class
feedback (T1)
Across-class
feedback (T2)
Control (C) (T1 – C) (T2 – C)
C. OTHER (continued)
C.1 Attrition rates All schools Restricted sample#
C.2 Alwayscomers All schools Restricted sample#
C.3 Age C.6 Gender All schools Restricted sample# C.4 Class size All schools Restricted sample#
0.359 0.358 0.202 0.207 17.058 0.534 0.548 52.26 52.15
0.346 0.348 0.186 0.188 17.048 0.512 0.524 56.42 56.56
0.454 0.417 0.082 0.110 16.999 0.508 0.533 60.00 55.14
-0.095*** (0.034) -0.059* (0.030) 0.121*** (0.033) 0.097*** (0.033) 0.059 (0.079) 0.025* (0.015) 0.015 (0.015) -7.741* (4.045) -2.985 (3.988)
-0.108*** (0.033) -0.069** (0.029) 0.104*** (0.104) 0.077** (0.031) 0.049 (0.078) 0.004 (0.015) -0.009 (0.015) -3.581 (4.672) 1.428 (4.651)
0.002
0.041
0.000
0.008
0.737
0.192
0.277
0.146
0.489
Attrition rate is defined as the rate of students missing in the last testing round conditional on student participation in the baseline testing. T1 stands for within-class comparison, T2 for across-class comparison and C for control group. Robust standard errors adjusted for clustering at school level are in parentheses. * significant at 10%; ** significant at 5%; *** significant at 1%

41
A4: COMPARISON OF MEAN CHARACTERISTICS OF STUDENTS IN TREATMENT AND CONTROL GROUPS
Mathematics Diff w.r.t.
pure control
English
Diff w.r.t. pure
control Sum
Diff w.r.t. pure
control SOLO TREATMENT EFFECTS Within-class competition with NO rewards (T1_solo) Across-class competition with NO rewards (T2_solo) Financial rewards with NO feedback (Fin_solo) Reputation rewards with NO feedback (Rep_solo) INTERACTION EFFECTS Within-class competition with Financial rewards (T1_FIN) Across-class competition with Financial rewards (T2_FIN) Within-class competition with reputation rewards (T1_REP) Across-class competition with reputation rewards (T2_REP) Pure control Joint p-value
7.126
8.068
7.719
9.366
8.485
9.002
8.834
9.974
8.583
0.069
-1.439* (0.771) -0.559 (0.706) -0.751 (1.035) 0.976
(0.815)
0.029 (0.934) 0.651
(0.719) 0.418
(0.719) 1.606** (0.767)
0 -
12.425
13.507
12.809
14.922
15.625
14.324
13.899
15.479
14.115
0.039
-1.698§ (1.096) -0.725 (1.178) -1.139 (1.163) 1.095
(1.191)
1.698 (1.458) 0.563
(1.117) 0.035
(1.052) 1.698** (0.808)
0 -
19.551
21.575
20.528
24.288
24.111
23.326
22.734
25.454
22.697
0.028
-3.136* (1.792) -1.284 (1.814) -1.891 (2.127) 2.071
(1.898)
1.728 (2.339) 1.215
(1.700) 0.453
(1.685) 3.304** (1.491)
0 -
Rows represent treatment groups (either pure treatments or treatment interactions). Columns (1), (3) and (4) represent average scores from Math, English and their sum. Columns (2), (4), (6) represent differences between particular treatment and pure control group (group without any feedback and any reward). Robust standard errors adjusted for clustering at school level are in parentheses. § significant at 15%, * significant at 10%; ** significant at 5%; *** significant at 1%.

42
Appendix B: Randomization and logistics in the field
In order to increase the balance between control and treatment groups, the sample was stratified
along three dimensions – school location (the sample was divided into four areas differing in the
level of remoteness), average school performance in national examination (above average or below
average) and student level (grade 6 and 7 of primary education and grades 1 up to 4 of secondary
education) 20,21. Within each strata, I randomized the sample into treatment and control groups. The
randomization was done in two stages (as shown in Figure 1). First, after the stratification of the
sample by school performance and area, I randomized the whole sample of 53 schools into
treatment and control group in a ratio 2:1. The randomization was done at the school level and
resulted in 36 treatment schools and 17 control schools. School-level randomization in the first
stage was chosen in order to minimize control group contamination due to information spillovers.
In the second stage, I divided classes of the treatment schools randomly into within-class feedback
(T1) and across-class feedback group (T2) in a ratio 1:1 (class-level randomization). In this
scenario, no student in a control-group school received any of the treatments and students in the
treatment-group schools might have received either within- or across-class feedback depending on
the type of intervention their class was randomized into. Overall, 1/3 of the sample is the control
group, 1/3 is treatment group 1 and 1/3 is treatment group 2. Exposure to the treatment is the only
difference in the outcomes between the control and treatment groups.
20 Every year students of P7 in primary schools and S4 in secondary schools take the national leaving examinations that are compulsory in order to complete their study and to proceed to a higher level. Using the data on PLE and UCE, I was able to divide schools into better and worse performing schools. 21 Uganda introduced Universal Primary Education (UPE) for all in 1997, allowing up to four students to go to school for free. Later it was extended to all children. Primary education is a seven-year program and for successful completion students need to pass the national Primary Leaving Exam (PLE) at the end of grade 7. Without passing PLE they cannot be admitted to a secondary school. Secondary school consists of two levels - “O-level”, which is four year program from S1 up to S4 completed by passing Ugandan Certificate of Education (UCE); and “A-level”, which is a two year extension to the O-level and is completed by passing the Ugandan Advanced Certificate of Education (UACE). In 2007 Uganda introduced Universal Secondary Education (USE) as the first African country. The school year consists of 3 trimesters and lasts from January until December. Students are supposed to be examined by midterm and final. However, students do not necessarily have access to their evaluations and have limited information about their improvements.

43
All schools in the sample were connected to local non-governmental organization called
Uganda Czech Development Trust (UCDT). UCDT is a local affiliation of the non-governmental
organization Archdiocese Caritas Prague, Czech Republic, which has been running a sponsorship
program “Adopce na dalku” in Uganda since 1993. According to UCDT representatives, students
were located into primary and secondary schools based on their own choice, therefore supported
students should not differ from not supported students in terms of their school choice.
During the academic year students in the feedback groups received feedback. The feedback
was provided to students in the form of a report card, which was stuck into a small progress report
book that each child in the treatment group received from us. My team members explained the
content of the report card repeatedly until students understood the message fully. The books were
stored at schools and headmasters promised to let children check their books at any point. The
books contained all necessary information to keep a child’s attention and motivation active. After
the experiment, students could keep their books. After students learned their feedback, they were
asked to start to work on questionnaires and to solve the Math and English exam22. Students in the
control group immediately started to answer the questionnaires. In order to ensure transparency, I
used my own constructed tests. In order to announce the competition, I organized additional
meetings with students to explain the conditions in detail. Moreover, I left fliers in their classrooms
so that their absent classmates could also learn about the competition. Students were reminded of
the conditions of the competition before they sat for the final exams. It took me and my four local
enumerators on average 3 to 4 weeks to evaluate the examinations. Knowing the winners, we
visited schools again to disseminate the rewards.
22 The order was as follows: “Before Math questionnaire”, followed by Math examination that lasted 30 minutes; “After Math Before English questionnaire”, English exam in the subsequent 20 minutes and finally “After English questionnaire”. The core questions of the questionnaires were student expectations regarding how many points they thought they would obtain from the Math and English examinations, how much effort they planned to put/they put into answering the questions and the level of their current happiness. All of these questions we asked before as well as after each exam. No before-Math and before-English questionnaires were collected during the baseline survey since students saw the examinations for the first time.

44
Project timeline
BREA
K
Reward scheme introduced
2011 Baseline Survey
2012
BREA
K
2013 Follow-up
Session Testing 1
Testing 2
Testing 3
Testing 4
Testing 5
Students, teachers and headmasters interviewed
Baseline testing from Math and English and question-naires; No treatment
Within-class feedback group (T1) received first treatment; Across-class feedback group (T2) no treatment
Within-class feedback group (T1) received treatment including improvement status Across-class feedback group (T2) received first treatment
Within-class feedback group (T1) received treatment including improvement status Across-class feedback group (T2) received treatment including improvement status
Within-class feedback group (T1) received treatment including improvement status Across-class feedback group (T2) received treatment including improvement status Chosen students competed to win prizes
No treatment provided, students examined from Math and English;
Rewards disseminated
Note: T1 (treatment 1) stands for within-class social comparison treatment; T2 (treatment 2) represents across-class social comparison group; Qualification criteria differed based on initial randomization (T1,T2,C).
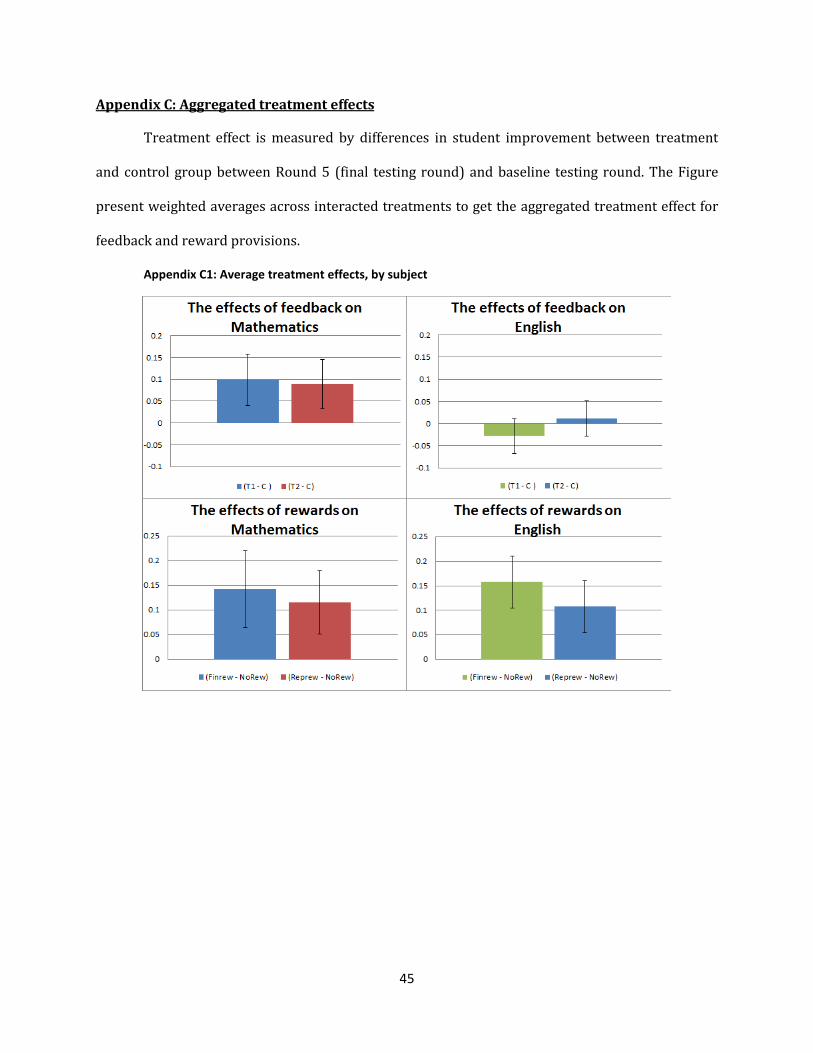
45
Appendix C: Aggregated treatment effects
Treatment effect is measured by differences in student improvement between treatment
and control group between Round 5 (final testing round) and baseline testing round. The Figure
present weighted averages across interacted treatments to get the aggregated treatment effect for
feedback and reward provisions.
Appendix C1: Average treatment effects, by subject

46
APPENDIX C2: COMPARISON OF THE ESTIMATES OF THE OVERALL TREATMENT EFFECTS OF DIFFERENT MOTIVATION SCHEMES ON STUDENT PERFORMANCE AND WELL-BEING
Within-class comparison
(T1)
Across-class comparison
(T2)
Financial rewards
Reputational rewards
A) WELL-BEING Happiness level NOTE Stress level
B) EFFORT Effort level in Math Effort level in English
C) MATHEMATICS Score Confidence
D) ENGLISH Score Confidence Controlled for stratas
Negative** Positive Positive Negative* 0.099* (0.059) -7.291*** (0.524) -0.018 (0.039) -6.446*** (0.527) Yes
Negative Negative Negative Negative*** 0.089§ (0.056) -7.008*** (0.539) 0.012 (0.040) -6.463*** (0.574) Yes
Negative* Positive** Positive* Positive 0.142* (0.078) 1.024 (0.742) 0.158** (0.053) 1.285§ (0.849) Yes
Negative Positive Positive** Positive 0.115* (0.064) 0.954 (0.666) 0.108** (0.053) 0.124 (0.739) Yes
Note: Robust standard errors adjusted for clustering at class level are in parentheses. Controlled for stratum fixed effects (four areas (by distance from the capital city, Kampala), school performance at national examination and grade level (P6,P7, S1 up to S4). N stands for the number of observations. § significant at 15%; * significant at 10%; ** significant at 5%; *** significant at 1% NOTE: For the marginal effects see Figures 5, 6 and 7. Happiness level has reverse scale, i.e. happiness decreases as the scale increases.

47
Appendix C3: OLS ESTIMATES OF THE EFFECTS OF DIFFERENT MOTIVATION SCHEMES ON STUDENT PERFORMANCE IN MATHEMATICS
Dependent variable: Math score
MATHEMATICS
Pure FB (round 4)
Pure FB (round 4)
Pure FB (round 5)
Pure FB (round 5)
Pure Rewards
Pure Rewards
Mix FB and Rewards
Mix FB and
Rewards Within-class social comparison (Treatment 1) Across-class social comparison (Treatment 2) Financial Rewards Repurational Rewards Controlled for stratas Interactions N
0.024
(0.062) 0.005
(0.058)
No No
5245
0.037
(0.048) 0.043
(0.043)
Yes No
5245
0.084 (0.081) 0.024 (0.084) No No 5102
0.112* (0.059) 0.093* (0.055) Yes No 5102
0.231** (0.092) 0.185** (0.079) No No 5102
0.151* (0.082) 0.127* (0.066) Yes No 5102
0.086 (0.079) 0.046 (0.081) 0.233** (0.093) 0.184** (0.078) No No 5102
0.099* (0.059) 0.089§ (0.056) 0.142* (0.078) 0.115* (0.064) Yes No 5102
Note: Robust standard errors adjusted for clustering at class level are in parentheses. Columns (2), (4) and (6) controlled for stratum fixed effects (areas (by distance from the capital city, Kampala), school performance at national examination and grade level (P6,P7, S1 up to S4). N stands for the number of observations. § significant at 15%; * significant at 10%; ** significant at 5%; *** significant at 1%

48
Appendix C4: OLS ESTIMATES OF THE EFFECTS OF DIFFERENT MOTIVATION SCHEMES ON STUDENT PERFORMANCE IN ENGLISH
Dependent variable: English score
ENGLISH
Pure FB (round 4)
Pure FB (round 4)
Pure FB (round 5)
Pure FB (round 5)
Pure Rewards
Pure Rewards
Mix FB and Rewards
Mix FB and Rewards
OVERALL TREATMENT EFFECTS
Within-class social comparison (Treatment 1) Across-class social comparison (Treatment 2) Financial Rewards Repurational Rewards Controlled for stratas Interactions N
-0.040 (0.074) 0.027
(0.073)
No No
5246
0.023
(0.043) 0.062§
(0.042)
Yes No
5246
-0.102§ (0.067) -0.039 (0.071) No No 5093
-0.015 (0.042) 0.014 (0.042) Yes No 5093
0.336*** (0.055) 0.250** (0.066) No No 5093
0.153** (0.066) 0.103* (0.054) Yes No 5093
-0.099* (0.058) -0.007 (0.064) 0.340*** (0.052) 0.254*** (0.067) No No 5093
-0.028 (0.039) 0.012 (0.040) 0.158** (0.053) 0.108** (0.053) Yes No 5093
Note: Robust standard errors adjusted for clustering at class level are in parentheses. Columns (2), (4) and (6) controlled for stratum fixed effects (four areas (by distance from the capital city, Kampala), school performance at national examination and grade level (P6,P7, S1 up to S4). N stands for the number of observations. § significant at 15%; * significant at 10%; ** significant at 5%; *** significant at 1%

49
Appendix D: Aggregated treatment effects, by subject and by gender
APPENDIX D1: AVERAGE TREATMENT EFFECTS, BY GENDER AND BY SUBJECT

50
APPENDIX D2: THE EVOLUTION OF THE TREATMENT EFFECTS OVER TIME, BY GENDER AND BY SUBJECT
T1 stands for within-class social comparison group, T2 for across-class comparison group and C represents control group with no feedback provided.

51
APPENDIX D3: OLS ESTIMATES OF THE EFFECTS OF DIFFERENT MOTIVATION SCHEMES ON STUDENT PERFORMANCE IN MATHEMATICS – BY GENDER
Dependent variable: Math score
MATHEMATICS
GIRLS BOYS
(1) (2) (3) (4) (5) (6)
A. OVERALL EFFECTS OF TREATMENTS
Within-class social comparison (Treatment 1) Across-class social comparison (Treatment 2) Financial Rewards Repurational Rewards Controlled for stratas N
0.157*** (0.058) 0.163*** (0.060) Yes 2858
0.103 (0.096) 0.087 (0.076) Yes 2858
0.149** (0.058) 0.159*** (0.061) 0.088 (0.088) 0.062 (0.071) Yes 2858
0.059 (0.079) 0.005 (0.070) Yes 2207
0.214** (0.089) 0.173** (0.077) Yes 2207
0.038 (0.071) 0.003 (0.065) 0.207** (0.089) 0.170** (0.073) Yes 2207

52
APPENDIX D4: OLS ESTIMATES OF THE EFFECTS OF DIFFERENT MOTIVATION SCHEMES ON STUDENT PERFORMANCE IN ENGLISH – BY
GENDER
Dependent variable: English score
ENGLISH
GIRLS BOYS
(1) (2) (3) (4) (5) (6)
A. OVERALL EFFECTS OF TREATMENTS
Within-class social comparison (Treatment 1) Across-class social comparison (Treatment 2) Financial Rewards Repurational Rewards Controlled for stratas N
-0.016 (0.045) 0.019 (0.048) Yes 2858
0.089 (0.069) 0.096§ (0.058) Yes 2858
-0.027 (0.042) 0.014 (0.045) 0.094 (0.068) 0.099* (0.056) Yes 2858
-0.022 (0.057) 0.001 (0.056) Yes 2207
0.226*** (0.078) 0.106§ (0.066) Yes 2207
-0.038 (0.051) 0.005 (0.051) 0.234*** (0.078) 0.111* (0.067) Yes 2207
Note: Robust standard errors adjusted for clustering at class level are in parentheses. Controlled for stratum fixed effects (four areas (by distance from the capital city, Kampala), school performance at national examination and grade level (P6,P7, S1 up to S4).. N stands for the number of observations. § significant at 15%; * significant at 10%; ** significant at 5%; *** significant at 1%

53
Appendix E: Other heterogeneities
T1 stands for within-class social comparison group, T2 for across-class comparison group and C represents control group with no feedback provided.

54
Appendix F: Comparison of the treatment effects with respect to different specifications APPENDIX F1: COMPARISON OF THE ESTIMATES OF THE EFFECTS OF DIFFERENT MOTIVATION SCHEMES ON STUDENT PERFORMANCE IN MATHEMATICS
OLS IPW Imputation
(median ratio) Imputation
(class percentiles)
Within-class social comparison (T1) Across-class social comparison (T2) Financial Rewards Repurational Rewards Controlled for stratas
0.099* (0.059) 0.089§ (0.056) 0.142* (0.078) 0.115* (0.064) Yes
0.080 (0.066) 0.125* (0.066) 0.224** (0.087) 0.133* (0.079) Yes
0.124* (0.063) 0.116* (0.054) 0.198** (0.081) 0.164** (0.073) Yes
0.112** (0.055) 0.096* (0.053) 0.169** (0.079) 0.157** (0.067) Yes
Within-class social comparison (T1) Across-class social comparison (T2) Financial Rewards Repurational Rewards Controlled for stratas
-0.028 (0.039) 0.012 (0.040) 0.158** (0.053) 0.108** (0.053) Yes
-0.004 (0.044) 0.069§ (0.044) 0.190*** (0.063) 0.109* (0.057) Yes
0.019 (0.052) 0.056 (0.051) 0.159** (0.075) 0.103 (0.073) Yes
-0.012 (0.042) 0.025 (0.043) 0.211*** (0.066) 0.158*** (0.056) Yes
Note: Robust standard errors adjusted for clustering at class level are in parentheses. Controlled for stratum fixed effects (four areas by distance from the capital city, Kampala, school performance at national examination and grade level (P6,P7, S1 up to S4). N stands for the number of observations. One school is eliminated from imputation method due to high turnover of students caused by frequent change of headmasters. In that case imputation would not work properly. § significant at 15%; * significant at 10%; ** significant at 5%; *** significant at 1%