dangerous goods transportation practical risk … goods transportation practical risk analysis...
TRANSCRIPT

ILLINOIS - RAILTEC Slide 1
© 2014 ERA’s 2nd Workshop on Risk Evaluation and Assessment - Transport of Dangerous Goods
DANGEROUS GOODS TRANSPORTATION
PRACTICAL RISK ANALYSIS APPROACH
Dr. Rapik Saat, Ph.D., PMP
Rail Transportation and Engineering Center (RailTEC)
University of Illinois at Urbana-Champaign, U.S.A.

ILLINOIS - RAILTEC Slide 2
© 2014 ERA’s 2nd Workshop on Risk Evaluation and Assessment - Transport of Dangerous Goods
Outline
• Transportation Risk Management Framework
• Dangerous Goods Transportation Practical Risk
Analysis Approach
• Example Dangerous Goods Railway
Transportation Risk
• Appendix

ILLINOIS - RAILTEC Slide 3
© 2014 ERA’s 2nd Workshop on Risk Evaluation and Assessment - Transport of Dangerous Goods
Transportation Risk Management Framework
• A collection of processes and
methodologies for identifying,
assessing and reducing
transportation risks
• Fundamental questions:
– What can go wrong?
– How likely it is?
– What are the
consequences?
– How to effectively use
resources to reduce risks?
Note: Transportation Risk Management (TRM) framework shown on the
right is modified from CCPS (2008) – Guidelines for Chemical
Transportation Safety, Security and Risk Management
Identification &
Prioritization
Primary
Management Systems
Current?
Risk
Reduction
Required?
Review &
Update
Risk Reduction
Strategies
Risk Analysis
Freight
Transportation
Activities
Program
Sustainability Y
Y
N
N
Risk
Assessment
ILLINOIS - RAILTEC Slide 4
© 2014 ERA’s 2nd Workshop on Risk Evaluation and Assessment - Transport of Dangerous Goods
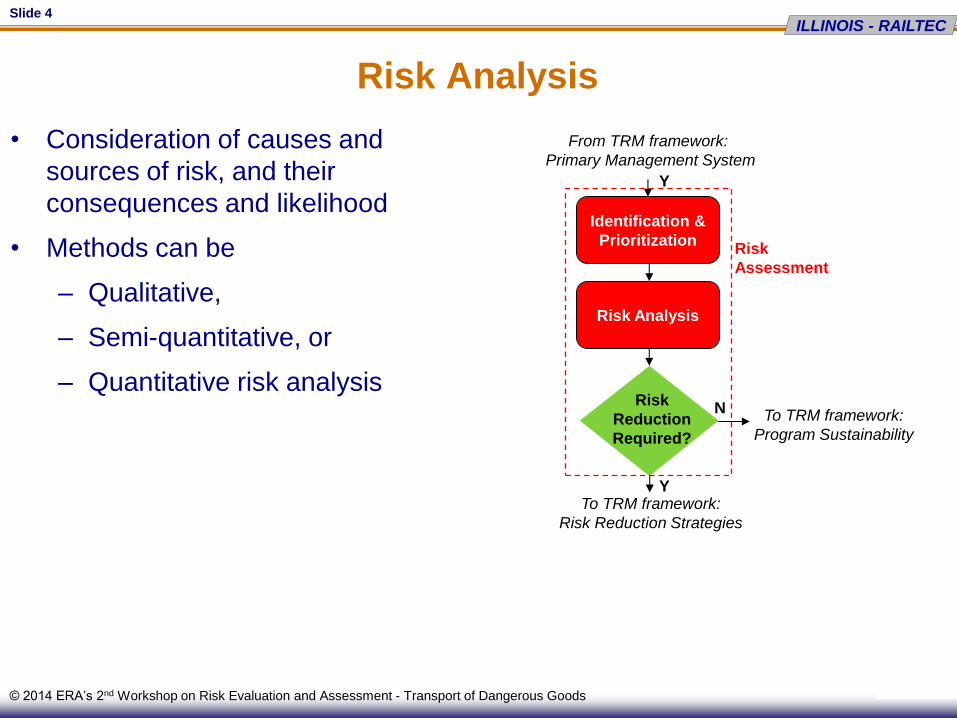
Risk Analysis
• Consideration of causes and
sources of risk, and their
consequences and likelihood
• Methods can be
– Qualitative,
– Semi-quantitative, or
– Quantitative risk analysis
Identification &
Prioritization
Risk
Reduction
Required?
Risk Analysis
Y
Y
N
Risk
Assessment
From TRM framework:
Primary Management System
To TRM framework:
Program Sustainability
To TRM framework:
Risk Reduction Strategies

ILLINOIS - RAILTEC Slide 5
© 2014 ERA’s 2nd Workshop on Risk Evaluation and Assessment - Transport of Dangerous Goods
Dangerous Goods Transportation
Practical Risk Analysis Approach
INITIATING EVENT
Accident or
Non-Accident
RELEASE EVENT
CONSEQUENCE
ILLINOIS - RAILTEC Slide 6
© 2014 ERA’s 2nd Workshop on Risk Evaluation and Assessment - Transport of Dangerous Goods
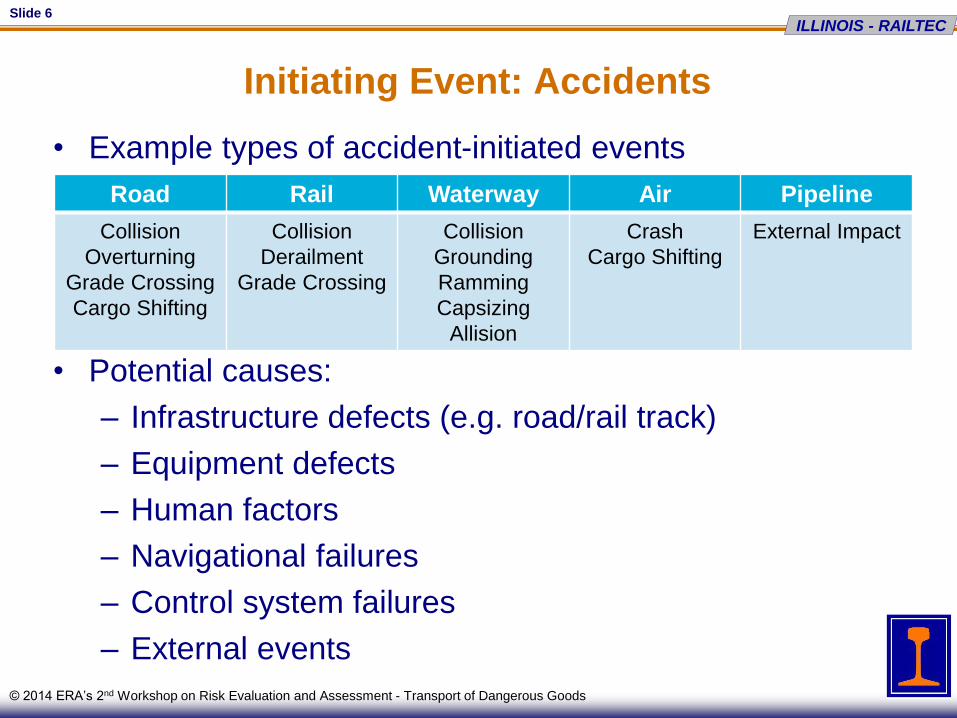
Initiating Event: Accidents
• Example types of accident-initiated events
• Potential causes:
– Infrastructure defects (e.g. road/rail track)
– Equipment defects
– Human factors
– Navigational failures
– Control system failures
– External events
Road Rail Waterway Air Pipeline
Collision
Overturning
Grade Crossing
Cargo Shifting
Collision
Derailment
Grade Crossing
Collision
Grounding
Ramming
Capsizing
Allision
Crash
Cargo Shifting
External Impact

ILLINOIS - RAILTEC Slide 7
© 2014 ERA’s 2nd Workshop on Risk Evaluation and Assessment - Transport of Dangerous Goods
Initiating Event: Non-Accidents
• Potential causes:
– Improper securement
– Corrosion
– Metallurgical failure
– Overpressure
– Equipment component failures (e.g. valves, rupture
disks, fittings)
– Overfilling or underfilling
– Relief device activation due to surges
– Contamination
– Temperature changes
– Control system failures
ILLINOIS - RAILTEC Slide 8
© 2014 ERA’s 2nd Workshop on Risk Evaluation and Assessment - Transport of Dangerous Goods
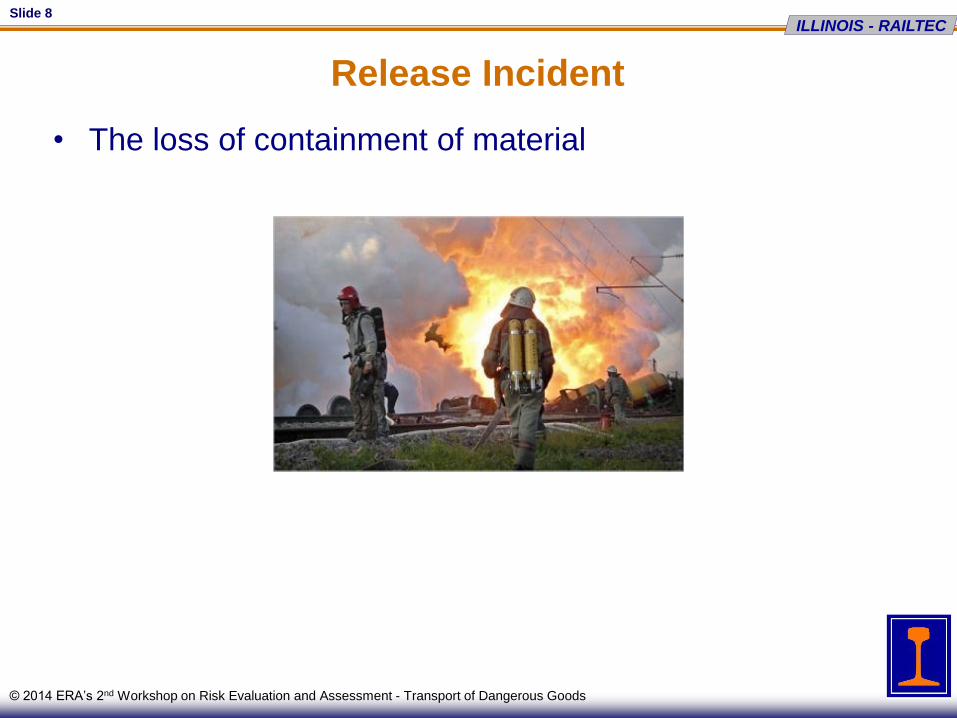
Release Incident
• The loss of containment of material
ILLINOIS - RAILTEC Slide 9
© 2014 ERA’s 2nd Workshop on Risk Evaluation and Assessment - Transport of Dangerous Goods
Consequence
• The direct results or impacts of an event
• Outcome of an event affecting objectives
• Examples:
– Fatalities
– Injuries
– Property damage
– Environmental impacts
– Business interruption
– Evacuation
– Distribution system disruption
– Negative publicity
– Excess regulations

ILLINOIS - RAILTEC Slide 10
© 2014 ERA’s 2nd Workshop on Risk Evaluation and Assessment - Transport of Dangerous Goods
Example Dangerous Goods Railway Transportation Risk
• Basic risk equation = probability of an event multiplied by the
consequence of that event
R = PA x PR|A x Q x C
• Probability of a hazardous materials(HM) release event is typically the
product of a series of other probabilities
• Probability of a derailment occurring (PA)
• Probability that the HM car releases product (PR|A)
• Probability distribution of quantity lost (Q)
(can also be expressed as average quantity lost)
• Consequences to people, property, or the environment is determined by
what, where and when the material is spilled (C)
Tank Car
Train Accident

ILLINOIS - RAILTEC Slide 11
© 2014 ERA’s 2nd Workshop on Risk Evaluation and Assessment - Transport of Dangerous Goods
Environmental Risk Analysis of Railway Transportation
of Dangerous Goods
Tank Car
Derailment
Release from
Tank Car
Release Quantity
as Percentage
of Tank Car Capacity
Yes
No
0-5%
5-20%
20-50%
50-80%
80-100%
Clay
Silt
Sand
Soil Type
10
20
50
100
200
Depth to
Groundwater,
(ft)
Remote
Rural
Suburban
Urban
High
Extremely
High
Population
Class
0.1-4.9
5-9.9
10-19.9
20-39.9
40-59.9
60-99.9
≥ 100
Traffic Density
Category (MGTM)
Accident-Caused Release Rate Consequences
Environmental Cleanup Cost
Evacuation Cost
Train Delay Cost
Yes
No
Reference: Saat, M.R., Werth, C.J., Schaeffer, D., Yoon, H. and C.P.L. Barkan (2014). Environmental Risk Analysis of Hazardous Material Rail Transportation.
Journal of Hazardous Materials 264, 560–569.

ILLINOIS - RAILTEC Slide 12
© 2014 ERA’s 2nd Workshop on Risk Evaluation and Assessment - Transport of Dangerous Goods
Probability Analysis
• Accident-caused release rate metric was used to estimate the annual rate of a
release event:
PR = PA x PR|A x M
where:
PA = tank car derailment annual rate per car-mile (Anderson & Barkan 2004)
PR|A = tank car conditional probability of release (Treichel et al. 2006)
M = total number of car miles
References:
Anderson, R. T., and Barkan, C. P. L. (2004). "Railroad accident rates for use in transportation risk analysis." Transportation Research Record: Journal
of the Transportation Research Board, (1863), 88-98.
Treichel, T. T., Hughes, J. P., Barkan, C. P. L., Sims, R. D., Philips, E. A., and Saat, M. R. (2006). Safety Performance of Tank Cars in Accidents:
Probability of Lading Loss. RSI-AAR Railroad Tank Car Safety Research and Test Project, Association of American Railroads, Washington, DC.

ILLINOIS - RAILTEC Slide 13
© 2014 ERA’s 2nd Workshop on Risk Evaluation and Assessment - Transport of Dangerous Goods
Chemicals of Interest’s Routes & Annual Car Miles
Commodity Name
Annual Car
Miles
Acrylonitrile 1,406,133
Benzene 1,541,225
Butyl Acrylates 2,910,782
Cyclohexane 2,036,186
Ethanol 3,013,480
Ethyl Acetate 881,173
Ethyl Acrylate 649,216
Methanol 16,361,224
Methyl Methacrylate 3,944,250
Styrene 6,167,904
Toluene 2,604,849
Vinyl Acetate 5,033,087
Xylenes 9,234,437

ILLINOIS - RAILTEC Slide 14
© 2014 ERA’s 2nd Workshop on Risk Evaluation and Assessment - Transport of Dangerous Goods
Accident-caused Release Rate Summary
0,026
0,035
0,038
0,050
0,072
0,081
0,103
0,119
0,152
0,156
0,199
0,365
0,647
0,0 0,1 0,2 0,3 0,4 0,5 0,6 0,7
Ethyl Acrylate
Ethyl Acetate
Benzene
Acrylonitrile
Butyl Acrylates
Cyclohexane
Toluene
Ethanol
Styrene
Methyl Methacrylate
Vinyl Acetate
Xylenes
Methanol
Accident-Caused Release Rate per Year
(The “probability” or frequency term in the risk definition)

ILLINOIS - RAILTEC Slide 15
© 2014 ERA’s 2nd Workshop on Risk Evaluation and Assessment - Transport of Dangerous Goods
Consequence Analysis • Impacts to Soil and Groundwater
• Hazardous Materials Transportation Environmental
Consequence Model (HMTECM) was used to estimate
soil and groundwater cleanup cost
• Accounts for physicochemical properties, soil type and
depth to groundwater
• Population Exposure
• US Emergency Response Guidebook (ERG) was used to
determine hazard area
• Impact in terms of evacuation cost was estimated
• Train Delay
• Estimate impact due to additional costs related to
locomotives, railcars, fuel and labor
• Accounts for traffic density to estimate total number of
trains delayed
Soil Type
Depth to Groundwater
Population Density
References:
Yoon, H., Werth, C.J., Barkan, C.P.L., Schaeffer, D.J. & Anand, P. 2009, "An environmental screening model
to assess the consequences to soil and groundwater from railroad-tank-car spills of light non-aqueous
phase liquids", Journal of hazardous materials, vol. 165, no. 1-3, pp. 332-344.
Schafer, D.H. & Barkan, C.P.L. 2008, "A prediction model for broken rails and an analysis of their economic
impact", Proceedings of the AREMA Annual Conference, Salt Lake City, UT.

ILLINOIS - RAILTEC Slide 16
© 2014 ERA’s 2nd Workshop on Risk Evaluation and Assessment - Transport of Dangerous Goods
Total Expected Consequence Cost
(The consequence term in the risk definition)
• Expected Cleanup Cost + Evacuation Cost + Train Delay Cost
559 041
627 185
643 117
775 925
795 799
815 172
844 454
882 007
859 578
898 507
907 833
1 069 583
1 239 038
0 500 000 1 000 000 1 500 000
Ethanol
Vinyl Acetate
Butyl Acrylates
Styrene
Methanol
Benzene
Methyl Methacrylate
Ethyl Acetate
Ethyl Acrylate
Acrylonitrile
Toluene
Xylenes
Cyclohexane
Total Consequence Cost ($)

ILLINOIS - RAILTEC Slide 17
© 2014 ERA’s 2nd Workshop on Risk Evaluation and Assessment - Transport of Dangerous Goods
Risk Estimation
Annual Risk
• Accident-Caused Release Rate x Total Expected Consequence Cost
Risk per Ton-Mile
22 075
30 744
30 998
45 168
46 187
66 641
93 545
99 801
118 081
124 871
131 756
390 711
515 051
0 200 000 400 000 600 000
Ethyl Acrylate
Ethyl Acetate
Benzene
Acrylonitrile
Butyl Acrylates
Ethanol
Toluene
Cyclohexane
Styrene
Vinyl Acetate
Methyl Methacrylate
Xylenes
Methanol
Annual Release Risk ($)
0,016
0,020
0,020
0,022
0,024
0,031
0,032
0,032
0,033
0,034
0,035
0,042
0,048
0,00 0,01 0,02 0,03 0,04 0,05 0,06
Butyl Acrylates
Styrene
Benzene
Ethanol
Vinyl Acetate
Methanol
Acrylonitrile
Methyl Methacrylate
Ethyl Acrylate
Ethyl Acetate
Toluene
Xylenes
Cyclohexane
Risk per Ton-Mile (¢)

ILLINOIS - RAILTEC Slide 18
© 2014 ERA’s 2nd Workshop on Risk Evaluation and Assessment - Transport of Dangerous Goods
Risk Profile
0,0
0,1
0,2
0,3
0,4
0,5
0,6
0,7
0,8
0 1 000 000 2 000 000 3 000 000 4 000 000
An
nu
al
Rate
of
Incid
en
t w
ith
To
tal
Co
nseq
uen
ce C
ost
Gre
ate
r th
an
X
Total Consequence Cost ($)
Example risk profile for rail transportation of methanol

ILLINOIS - RAILTEC Slide 19
© 2014 ERA’s 2nd Workshop on Risk Evaluation and Assessment - Transport of Dangerous Goods
Acknowledgements

ILLINOIS - RAILTEC Slide 20
© 2014 ERA’s 2nd Workshop on Risk Evaluation and Assessment - Transport of Dangerous Goods
Thank You for Your Attention!
Dr. Rapik Saat, Ph.D., PMP
Rail Transportation and Engineering Center (RailTEC)
Department of Civil and Environmental Engineering
University of Illinois at Urbana-Champaign
Office: +1(217) 333-6974
Email: [email protected]
Rail Transportation and Engineering Center (RailTEC)
http://ict.illinois.edu/railroad