dairy research foundation - university of sydney · dairy research foundation 2012 symposium...
TRANSCRIPT
DAIRY RESEARCH FOUNDATION
CURRENT TOPICS IN DAIRY PRODUCTION
VOLUME 17
2012
Compiled by Michelle Heward Edited by Yani Garcia, Sherry Catt, Michelle Heward

2
TABLE OF CONTENTS
WELCOME TO THE DAIRY RESEARCH FOUNDATION 2012 SYMPOSIUM ............................................................ 4
DAIRY RESEARCH FOUNDATION 2012 SYMPOSIUM ORGANISING COMMITTEE ................................................ 5
DAIRY RESEARCH FOUNDATION 2012 SYMPOSIUM SPONSORS ......................................................................... 5
THE EMERGING DAIRY SCIENTISTS’ PROGRAM ................................................................................................... 6
KEYNOTE SPEAKERS ............................................................................................................................................. 6
REDUCING LOSSES THROUGHOUT DAIRY PRODUCTION .................................................................................... 7
Jude Capper
GROWING MORE PASTURE AND YOUR PROFITS .............................................................................................. 21
Cameron Clark
A FARMING PHILOSOPHY TO AVOID WASTED ENERGY ON A NEW ZEALAND DAIRY FARM ............................. 27
Hayden Lawrence
PASTURE MASTER – CASE STUDY 1, GLENCRAIG JERSEYS - FROM COBARGO TO BEMBOKA ........................... 35
Steve Salway
ACCEPTING TECHNOLOGIES ON OUR DAIRY FARMS......................................................................................... 37
Nicolas Lyons and Rene Kolbach
LEAKY COWS, LEAKY SOILS, LEAKY WALLETS: CAN WE USE NUTRIENTS MORE EFFICIENTLY ON
AUSTRALIAN DAIRY FARMS? ............................................................................................................................. 41
Cameron Gourley
HOW COMPLEMENTARY FORAGE SYSTEMS CAN HELP FARMERS TO REDUCE ‘WASTAGE’ AND
INCREASE PRODUCTIVITY .................................................................................................................................. 52
Yani Garcia and Rafiq Islam
GREEN CLEANING™ SYSTEMS – 12 MONTHS ON .............................................................................................. 59
Annette Zurrer
REDUCING THE DIVIDE - CONVERSATIONS FOR CHANGE ................................................................................. 65
Stephanie Tarlinton
DORNAUF DAIRIES ............................................................................................................................................. 67
Nick and Chris Dornauf
BUSINESS TRANSITION AND SUCCESSION PLANNING ....................................................................................... 69
Mark Scanlon
HANNAM VALE .................................................................................................................................................. 89
Ken Atkins

3
ENERGY EFFICIENCY IN THE DAIRY .................................................................................................................... 90
Nick Bullock
BROMBIN, VIA WAUCHOPE ............................................................................................................................... 95
Leo and Luke Cleary
THE EPREG - A NON-INVASIVE PREGNANCY DETECTION SYSTEM FOR CATTLE ................................................ 96
Richard Shephard
USING ULTRASONOGRAPHY ON DAIRY FARMS TO IMPROVE HERD REPRODUCTIVE PERFORMANCE
AND IN FOETAL SEXING ................................................................................................................................... 100
Luke Ingenhoff
INVESTIGATION INTO THE CHALLENGES ASSOCIATED WITH REPRODUCTIVE MANAGEMENT ON
COMMERCIAL DAIRY FARMS UTILIZING AUTOMATIC MILKING SYSTEMS ...................................................... 104
Derek Keeper
SUPPLEMENTATION OF HAND-REARED NEONATAL CALVES WITH NUCLEOTIDES AND EFFECTS ON
GROWTH, HEALTH AND IMMUNITY ................................................................................................................ 107
Claire Kentler
A RETROSPECTIVE STUDY INTO THE ASSOCIATION OF MATERNAL PERICONCEPTIONAL METABOLIC
STRESS ON PROGENY PERFORMANCE: THE DAIRY COW PARADIGM
EPIGENETICS AND FOETAL PROGRAMMING – THE CAUSE OF FAILING FERTILITY? ........................................ 113
Hardy Manser
VALIDATION OF AN ACIDOSIS MODEL............................................................................................................. 118
Helen Golder
CHARACTERISTICS OF EXTENDED LACTATION AND PERSISTENCY IN AUSTRALIAN DAIRY COWS .................. 123
Mary Abdelsayed
CAN PRE – FEEDING REDUCE MILKING INTERVALS OF COWS MILKED IN A PASTURE-BASED AUTOMATIC
MILKING SYSTEM? ........................................................................................................................................... 127
Nicolas Lyons
INVESTIGATING THE EFFECT OF A FORAGE CROP ON VOLUNTARY COW TRAFFIC IN A PASTURE-BASED
SYSTEM ............................................................................................................................................................ 132
Victoria Scott
COMMERCIAL REALITY OF INTEGRATING FORAGE CROPS ON A PASTURE BASED DAIRY .............................. 137
Michael Campbell

4
WELCOME TO THE DAIRY RESEARCH FOUNDATION 2012 SYMPOSIUM
It is with pleasure that we present to the Australian dairy industry, our 2012 Dairy Research Foundation
Symposium. The Symposium is designed to integrate with the annual meetings of the Dairy NSW Regional
Development Program and NSW Farmers’ Association Dairy Section – which means having NSW dairy
industry’s entire major groups meeting at a single point.
The 2012 Symposium has adopted the theme “Energising Dairy” – and looks at energy in all its shapes and
forms. This theme embraces dairies, feeding systems, reproductive systems as well as people systems and
by doing this we offer a very diverse program that is spearheaded by a combination of scientists and
farmers.
The program framework begins on Wednesday July 4 with the Dairy NSW and NSW Farmers’ Association
Dairy Section industry meetings, followed by Day 1 of the symposium (July 5) at the Liz Kernohan Conference
Centre on the University Campus. The second day (July 6) is much less formal, with a focus on participation,
interaction and absolutely no powerpoint presentations – and staged at the Robotic Milking Research Farm.
While Automated Milking Systems – or robots – feature in only a small way this year – we are conscious that
a visit to the Robotic Milking Research Farm for anyone who is yet to see this technology – is a well
worthwhile activity. And, so while the program content of Day 2 is largely ‘non robotic’ – there is always the
opportunity to view the robotic rotary whilst there.
A key philosophy of the Dairy Research Foundation is to nurture and promote young and emerging
professionals in the dairy industry: Young scientists, young farmers and young service providers. Our
approach to program design has been to integrate youth with experience and to do this in a manner that
creates a really inter-personal experience for the delegates. We know from experience that delegates get
very involved in the new work that our students are putting forward and it is simply good for the soul to see
and hear youthful enthusiasm and a commitment to working in dairy science via this program.
Meanwhile, the Annual Symposium Dinner (sponsored by Dairy Australia) and the announcement of the
Dairy Science Award will once again take place at Gledswood Winery – on the evening of July 5. This is sure
to be a great night of fellowship.
Assoc Professor Yani Garcia
Chair, Dairy Research Foundation 2012 Symposium

5
DAIRY RESEARCH FOUNDATION 2012 SYMPOSIUM ORGANISING COMMITTEE
Associate Professor Yani Garcia, University of
Sydney
Dr Kendra Kerrisk, University of Sydney
Dr Pietro Celi, University of Sydney
Dr Cameron Clark, University of Sydney
Ms Sherry Catt, University of Sydney
Ms Michelle Heward, University of Sydney
Mr Michael Perich, Dairy Research Foundation
Mr Bill Inglis, Dairy Research Foundation
Ms Kerry Kempton, NSW Department of Primary
Industries
Ms Vicki Timbs, NSW Department of Primary
Industries
DAIRY RESEARCH FOUNDATION 2012 SYMPOSIUM SPONSORS
The Dairy Research Foundation would like to acknowledge and thank the following companies for their
support
PLATINUM
GOLD
SILVER
BRONZE
THE DAIRY RESEARCH FOUNDATION WOULD ALSO LIKE TO ACKNOWLEDGE AND THANK THE FOLLOWING EXHIBITORS FOR THEIR SUPPORT
LELY • NFL • NSW FARMERS’ ASSOCIATION • SBS CIBUS
DAVIESWAY • ADF MILKING • MILK MARKETING NSW

6
THE EMERGING DAIRY SCIENTISTS’ PROGRAM
SPONSORED BY THE GARDNER FOUNDATION
The DRF is pleased to showcase the talents of 10 emerging dairy scientists at the 2012 event. These
presentations have been integrated into our Day 2 program and all have been paired with a senior
consultant or scientist to create a highly interactive series of discussions.
The objective of this process is to offer a quality professional development opportunity for these emerging
scientists and to introduce them to and integrate them with our industry. The program is in the form of a
competition, where we ask you, the audience, to assess the quality, relevance and interest of each
presentation – with the audience scores combined to determine a winner – announced at the conclusion of
Day 2.
The program clearly identifies those competing in the Emerging Scientists’ Program – and we encourage
your full participation which will do much towards encouraging our next generation of dairy science.
KEYNOTE SPEAKERS
JULIAN CRIBB
Julian Cribb is the principal of Julian Cribb & Associates and specialises in science
communication.
A journalist since 1969, he was editor of the “National Farmer” and “Sunday
Independent” newspapers, editor-in-chief of the “Australian Rural Times”, and chief
of the Australian Agricultural News Bureau. For ten years he was agriculture
correspondent, science and technology correspondent and scientific editor for the
national daily “The Australian”.
He has received 32 awards for journalism including the Order of Australia Association Media Prize, the
inaugural Eureka Prize for environmental journalism, the inaugural AUSTRADE award for international
business journalism, the Dalgety Award for rural journalism, two MBF Awards for medical journalism and five
Michael Daley Awards for science journalism.
His personal published work includes more than 8,000 print articles, 1000 broadcasts, 1000 media releases
and 300 speeches as well as “The Forgotten Country”, six editions of “Australian Agriculture”, “The White
Death”, “Sharing Knowledge” and “Dry Times” (with Mark Stafford-Smith). His book on the global food crisis,
“The Coming Famine” was published in August 2010.
DR JUDE CAPPER
JUDE L. CAPPER, Ph.D. is an Assistant Professor of Dairy Science in the Department
of Animal Sciences at Washington State University (WSU). Born in the UK, she
undertook her undergraduate and graduate degrees at Harper Adams University
College (UK) before doing post-doctoral research at Cornell University. Her current
position is split between teaching, extension and research, with her research
focusing on modelling the environmental impact of livestock production systems.
Current research includes comparisons of historical and modern production
practices in dairy and beef industries; and the effect of technology use and management practices upon
environmental impact.

7
REDUCING LOSSES THROUGHOUT DAIRY PRODUCTION
DR. JUDE L. CAPPER
Adjunct Professor, Department of Animal Sciences, Washington State University,
116 Clark Hall, PO Box 646310, Pullman, WA, 99164-6310, USA.
Email: [email protected]
The importance of improving productivity in order to reduce the environmental impact of dairy production is
without question. Advances in management, nutrition, genetics and animal welfare have improved milk
yields over time, leading to reductions in resource use and greenhouse gas emissions per unit of dairy
product. Continuous improvement will be of crucial importance in future food production systems to meet the
dual challenge of producing sufficient dairy to supply the growing population while reducing environmental
impact. Current research has focused on milk yields, yet a considerable knowledge gap exists as to the
contribution made by other on-farm practices and herd dynamics, e.g. the effects of improved health,
reproduction or animal bodyweight upon environmental impact. It is crucial that these knowledge gaps are
filled in order for producers to make future management decisions based on environmental sustainability as
well as economic viability. All stakeholders within food production need to gain a greater awareness of the
multifaceted nature of sustainability in order to make informed dietary choices in future. This will offer
conventional livestock producers the opportunity to reclaim the concept of sustainable food production,
which is often perceived as only applying to niche production systems.
INTRODUCTION
The U.S. Environmental Protection Agency defines sustainability as “meeting society’s present needs without
compromising the ability of future generations to meet their own needs” (US EPA, 2010b). In this context,
food production comes under considerable scrutiny. Global food security and environmental issues are
significant issues for governments and policy-makers who are conscious not only of the proportion of their
population that is currently food-insecure, but also of the prediction that the global population will increase
to over 9 billion people in the year 2050 (U.S. Census Bureau, 2008). The extent of population growth varies
amongst regions with the greatest increases predicted to occur in developing nations such as Africa, China
and India (Tilman, Cassman, Matson, Naylor, & Polasky, 2002). This is complicated by the suggestion that
developing nations will enjoy a per capita income similar to that currently seen within North America. As
incomes increase, so does the demand for high-quality animal proteins such as meat, milk and eggs, thus the
Food and Agriculture Organization of the United Nations (FAO) suggests that total food requirements will
increase by 70% by 2050 (Food and Agriculture Organization of the United Nations, 2009b).
In the event of considerable population growth, future competition for water, land and energy between
livestock production and human activities will be augmented and the global dairy industry will face a
significant challenge in producing sufficient milk to meet consumer demand, using a finite resource base.
This issue is not confined to a future scenario – current concern over dwindling natural resources and
climate change leads to debate as to whether the dairy industry should continue to intensify and improve
productivity to feed the increasing population, or return to less-productive traditional methods? This paper
will discuss the role of productivity in mitigating climate change with reference to some of the most
commonly heard misconceptions relating to the environmental impact of dairy production

8
Myth: Livestock production is principally responsible for climate change
The environmental impact of livestock production is one of the most commonly discussed issues relating to
global dairying. As a result of the recent influx of media articles, television shows and restaurant menus
showcasing food choices that are perceived to be environmentally-friendly, a lexicon of previously-
unfamiliar terms including “carbon footprint”, “sustainability” and “local food” have entered everyday
conversation. The rise of “ethical consumerism”, defined by Singer and Mason (2006) as “an interest in the
way in which food is produced, the practices employed and a concern for low environmental impact, high
animal welfare and optimal worker conditions”, has the potential to significantly influence the management
practices and systems within dairy production. This may be considered to be a positive development,
however it may only have positive long-terms effects if the views expressed and decisions made by
consumers are based upon scientific evidence rather than philosophical ideology and misconceptions.
In 2006, the FAO released the oft-quoted report “Livestock’s Long Shadow”, which concluded that livestock
production is responsible for 18% of global anthropogenic greenhouse gas (GHG) emissions (Food and
Agriculture Organization of the United Nations, 2006). As a damning indictment of the global livestock
industry’s effect on the environment, this could hardly have been more suitable fodder for those groups
opposed to animal agriculture. Indeed activist groups have quoted the aforementioned 18% statistic as
evidence that abolishing animal agriculture would have a beneficial environmental impact (Koneswaran &
Nierenberg, 2008; McMichael, Powles, Butler, & Uauy, 2007; The Humane Society of the United States,
2008). Despite its adoption by the majority of media and activist groups as scientific evidence for the
principal role of livestock in causing climate change, the FAO report was not without its detractors and
Pitesky et al. (2009) produced a detailed paper outlining the flaws within the report. The most notable issue
related to the notorious 18% statistic, which was based upon a comparison between carbon emissions
derived from a highly detailed and inclusive life cycle assessment of global livestock production, to the
carbon emissions from the fuel combustion phase of global transport. As the FAO later admitted, differences
in the methodology between predicted carbon emissions from livestock production and transport rendered
the comparison invalid. The exact proportion of global carbon emissions produced by livestock production
has yet to be quantified although it is suggested to be somewhat less than the original 18% estimate.
Nonetheless, although the FAO report was seen as damaging by many within the livestock industry, it
fulfilled two vital roles with respect to climate change – the magnitude and shock-value of the 18% figure
ensured that climate change became a priority for industry groups, and carbon emissions from all livestock
sectors came under scrutiny.
Regardless of potential flaws in the FAO report’s methodology, which were been extensively discussed by
Piteskey et al. (2009), the major issue with the results is not how they were derived, but how they were
used. Global averages have a significant and over-arching flaw in that they cannot be applied to a regional
production system with any degree of confidence, yet the 18% figure was widely quoted as being
representative of individual regions regardless of inherent variation in system, management or productivity.
For example, the U.S. EPA (2010a) quantified primary anthropogenic GHG sources within the U.S.,
concluding that total agriculture (livestock and crops) contributed 6.32% of total national GHG emissions in
2009. This 6.32% can be further partitioned into 3.12% from animal agriculture, with the remaining 3.20%
allocated to human food crops. To reconcile the considerable difference between the global (18%) and
national (3.4%) estimates of livestock’s contribution to GHG emissions, it is therefore necessary to explore
the data in more detail.
The global FAO figure attributes almost half (48%) of total carbon emissions to carbon released by clearing
forestland to grow animal feed. This is exacerbated by competition for cropland between animal feed and
biofuels, with a considerable amount of formerly feed-producing land being diverted into non-feed crops
(Sawyer, 2008). Carbon emissions from deforestation are a major component of agricultural systems where
a considerable portion of animal feed is derived from land that has recently been converted from forest or
woodland, regardless of whether the feed is used domestically or imported, e.g. imports of soyabean meal
from South America into Europe. By contrast, the majority of U.S. feedstuffs are produced domestically:
cropland area has remained relatively stable (USDA, 2002) with increased crop yields compensating for
9
increased demand for feed and food crop production. Indeed, the U.S. is actively reforesting, with an
average increase in forestland area of 0.2%/year over the past 30 years (Smith, Miles, Vissage, & Pugh,
2005). Reforestation increases carbon sequestered from the atmosphere into plant tissue, with an average
of 6.4 kg carbon sequestered annually per (mature) tree (Sampson & Hair, 1996), yet the mitigating effect of
carbon sequestered by new forest growth is not accounted for in the U.S. EPA (2010a) calculations.
Disregarding the contribution of deforestation to the global estimate of livestock’s contribution to GHG
emissions leaves a figure that still remains approximately 3x higher than the U.S. national estimate – a direct
result of regional productivity variation.
Myth: Dairy systems are equally productive across the globe
Livestock’s environmental impact is directly affected by system productivity (Capper, 2010, 2011a; Capper,
Castañeda-Gutiérrez, Cady, & Bauman, 2008), yet by its very nature, the FAO’s global average includes a
wide range of regional system efficiencies. If we examine international trends in productivity, increased milk
yield (expressed as energy-corrected milk per cow) has a mitigating effect upon carbon emissions on a global
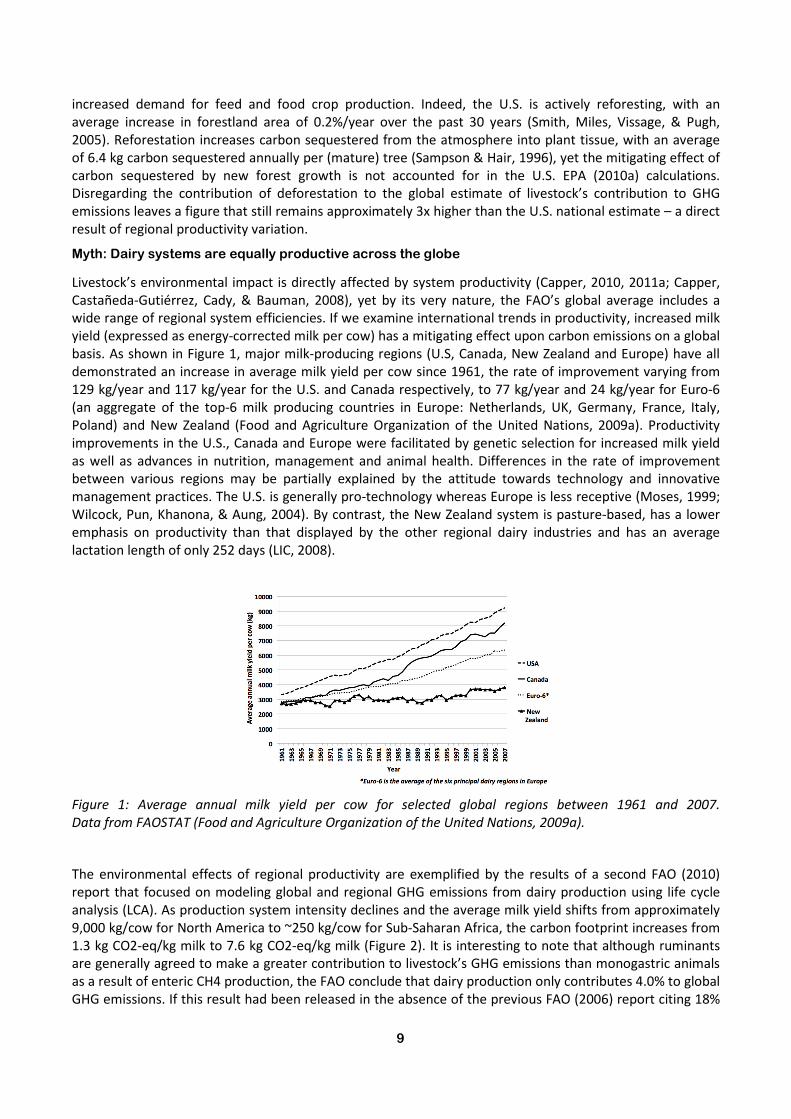
basis. As shown in Figure 1, major milk-producing regions (U.S, Canada, New Zealand and Europe) have all
demonstrated an increase in average milk yield per cow since 1961, the rate of improvement varying from
129 kg/year and 117 kg/year for the U.S. and Canada respectively, to 77 kg/year and 24 kg/year for Euro-6
(an aggregate of the top-6 milk producing countries in Europe: Netherlands, UK, Germany, France, Italy,
Poland) and New Zealand (Food and Agriculture Organization of the United Nations, 2009a). Productivity
improvements in the U.S., Canada and Europe were facilitated by genetic selection for increased milk yield
as well as advances in nutrition, management and animal health. Differences in the rate of improvement
between various regions may be partially explained by the attitude towards technology and innovative
management practices. The U.S. is generally pro-technology whereas Europe is less receptive (Moses, 1999;
Wilcock, Pun, Khanona, & Aung, 2004). By contrast, the New Zealand system is pasture-based, has a lower
emphasis on productivity than that displayed by the other regional dairy industries and has an average
lactation length of only 252 days (LIC, 2008).
Figure 1: Average annual milk yield per cow for selected global regions between 1961 and 2007.
Data from FAOSTAT (Food and Agriculture Organization of the United Nations, 2009a).
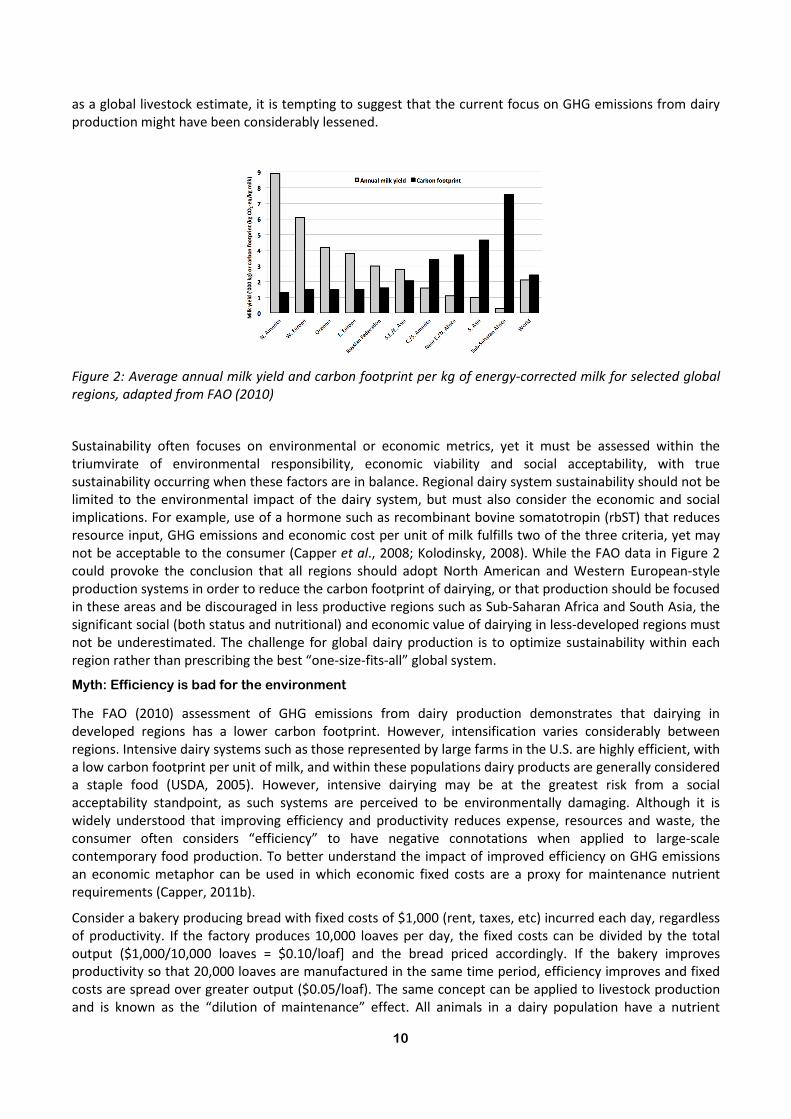
The environmental effects of regional productivity are exemplified by the results of a second FAO (2010)
report that focused on modeling global and regional GHG emissions from dairy production using life cycle
analysis (LCA). As production system intensity declines and the average milk yield shifts from approximately
9,000 kg/cow for North America to ~250 kg/cow for Sub-Saharan Africa, the carbon footprint increases from
1.3 kg CO2-eq/kg milk to 7.6 kg CO2-eq/kg milk (Figure 2). It is interesting to note that although ruminants
are generally agreed to make a greater contribution to livestock’s GHG emissions than monogastric animals
as a result of enteric CH4 production, the FAO conclude that dairy production only contributes 4.0% to global
GHG emissions. If this result had been released in the absence of the previous FAO (2006) report citing 18%
10
as a global livestock estimate, it is tempting to suggest that the current focus on GHG emissions from dairy
production might have been considerably lessened.
Figure 2: Average annual milk yield and carbon footprint per kg of energy-corrected milk for selected global
regions, adapted from FAO (2010)
Sustainability often focuses on environmental or economic metrics, yet it must be assessed within the
triumvirate of environmental responsibility, economic viability and social acceptability, with true
sustainability occurring when these factors are in balance. Regional dairy system sustainability should not be
limited to the environmental impact of the dairy system, but must also consider the economic and social
implications. For example, use of a hormone such as recombinant bovine somatotropin (rbST) that reduces
resource input, GHG emissions and economic cost per unit of milk fulfills two of the three criteria, yet may
not be acceptable to the consumer (Capper et al., 2008; Kolodinsky, 2008). While the FAO data in Figure 2
could provoke the conclusion that all regions should adopt North American and Western European-style
production systems in order to reduce the carbon footprint of dairying, or that production should be focused
in these areas and be discouraged in less productive regions such as Sub-Saharan Africa and South Asia, the
significant social (both status and nutritional) and economic value of dairying in less-developed regions must
not be underestimated. The challenge for global dairy production is to optimize sustainability within each
region rather than prescribing the best “one-size-fits-all” global system.
Myth: Efficiency is bad for the environment
The FAO (2010) assessment of GHG emissions from dairy production demonstrates that dairying in
developed regions has a lower carbon footprint. However, intensification varies considerably between
regions. Intensive dairy systems such as those represented by large farms in the U.S. are highly efficient, with
a low carbon footprint per unit of milk, and within these populations dairy products are generally considered
a staple food (USDA, 2005). However, intensive dairying may be at the greatest risk from a social
acceptability standpoint, as such systems are perceived to be environmentally damaging. Although it is
widely understood that improving efficiency and productivity reduces expense, resources and waste, the
consumer often considers “efficiency” to have negative connotations when applied to large-scale
contemporary food production. To better understand the impact of improved efficiency on GHG emissions
an economic metaphor can be used in which economic fixed costs are a proxy for maintenance nutrient
requirements (Capper, 2011b).
Consider a bakery producing bread with fixed costs of $1,000 (rent, taxes, etc) incurred each day, regardless
of productivity. If the factory produces 10,000 loaves per day, the fixed costs can be divided by the total
output ($1,000/10,000 loaves = $0.10/loaf] and the bread priced accordingly. If the bakery improves
productivity so that 20,000 loaves are manufactured in the same time period, efficiency improves and fixed
costs are spread over greater output ($0.05/loaf). The same concept can be applied to livestock production
and is known as the “dilution of maintenance” effect. All animals in a dairy population have a nutrient

11
requirement that must be fulfilled each day to support vital functions, minimum activities and non-lactation-
related productivity (i.e. pregnancy, growth) – these may be considered as the “fixed costs” of dairy
production. Improving productivity such that a greater amount of dairy product is produced in a set period
of time thus reduces the total energy cost per unit of food produced. Figure 3 illustrates this concept: as milk
yield increases from 22 kg/day to 31 kg/day in a lactating cow, maintenance requirements do not change,
but are diluted out over more units of production and are thus reduced from 42% to 34% of the total energy
requirement. Concomitantly, the daily metabolizable energy required per kg of milk is reduced from 8.1
MJ/kg to 7.2 MJ/kg. Daily energy requirements may be considered a proxy for resource use (feed, land,
water, fossil fuels) and waste output (manure, GHG). Improving productivity therefore reduces
environmental impact per unit of food. In this example, as milk yield increases, fewer lactating cows are
required to produce a set amount of milk and the number of associated support animals (dry cows,
replacement heifers, bulls) that serve to maintain dairy herd infrastructure is concurrently reduced. The
environmental impact per unit of milk is therefore reduced through dilution of maintenance at both the
individual cow and the dairy population level (Capper, Cady, & Bauman, 2009; Capper et al., 2008).
Figure 3: The impact of increasing daily milk yield on the proportion of daily energy used for maintenance
vs. lactation – the “dilution of maintenance” effect.
Myth: Historical production systems had a lower carbon footprint
To quantify the effects of system intensification on GHG emissions from dairy production, we can compare
and contrast a U.S. system characteristic of the “good old days” with modern dairy farming. The popular
agrarian vision of dairy farming in the 1940’s includes a small family farm with a red barn, green pastures
and a herd of cows, each of which are known by name. This rural utopia appears to have been an untroubled
life where milk could be drunk straight from the cow, neither cows nor manure produced GHG and the small
tractor used to plow the fields used small quantities of fuel from an infinite supply. By contrast, the modern
dairy farm with streamlined milking equipment, pasteurization processes, anaerobic digesters and
specialized labor appears to some as a futuristic aberration. Indeed, modern dairy production is considered
by anti-animal agriculture activists to be synonymous with “industrialized warehouse-like facilities that
significantly increase greenhouse gas emissions per animal” (Koneswaran & Nierenberg, 2008). Production
of CH4 from enteric fermentation is not a new phenomenon within the scientific community, yet the link
between climate change and livestock production is a relatively recent notion. Consumers therefore often
perceive that modern livestock production causes climate change, whereas extensive systems akin to
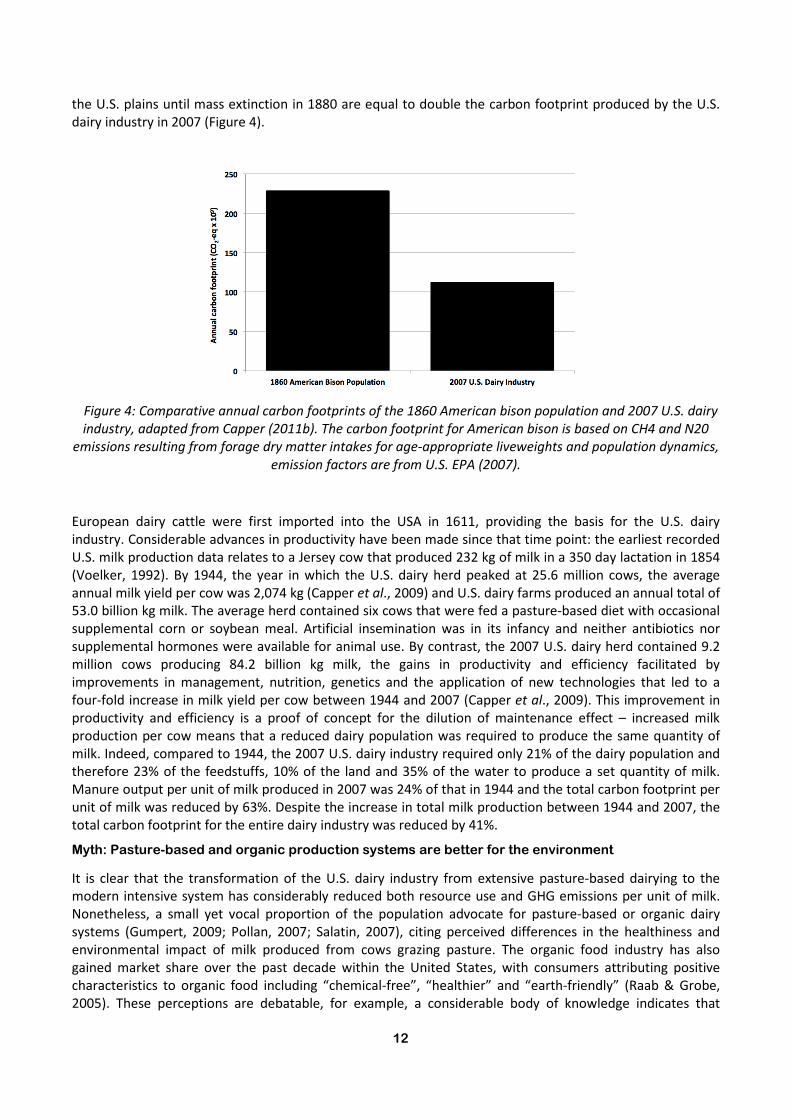
historical management are far more environmentally-friendly. To put this historical supposition into context,
the GHG emissions from enteric fermentation and manure produced by the 60 million buffalo that roamed
12
the U.S. plains until mass extinction in 1880 are equal to double the carbon footprint produced by the U.S.
dairy industry in 2007 (Figure 4).
Figure 4: Comparative annual carbon footprints of the 1860 American bison population and 2007 U.S. dairy
industry, adapted from Capper (2011b). The carbon footprint for American bison is based on CH4 and N20
emissions resulting from forage dry matter intakes for age-appropriate liveweights and population dynamics,
emission factors are from U.S. EPA (2007).
European dairy cattle were first imported into the USA in 1611, providing the basis for the U.S. dairy
industry. Considerable advances in productivity have been made since that time point: the earliest recorded
U.S. milk production data relates to a Jersey cow that produced 232 kg of milk in a 350 day lactation in 1854
(Voelker, 1992). By 1944, the year in which the U.S. dairy herd peaked at 25.6 million cows, the average
annual milk yield per cow was 2,074 kg (Capper et al., 2009) and U.S. dairy farms produced an annual total of
53.0 billion kg milk. The average herd contained six cows that were fed a pasture-based diet with occasional
supplemental corn or soybean meal. Artificial insemination was in its infancy and neither antibiotics nor
supplemental hormones were available for animal use. By contrast, the 2007 U.S. dairy herd contained 9.2
million cows producing 84.2 billion kg milk, the gains in productivity and efficiency facilitated by
improvements in management, nutrition, genetics and the application of new technologies that led to a
four-fold increase in milk yield per cow between 1944 and 2007 (Capper et al., 2009). This improvement in
productivity and efficiency is a proof of concept for the dilution of maintenance effect – increased milk
production per cow means that a reduced dairy population was required to produce the same quantity of
milk. Indeed, compared to 1944, the 2007 U.S. dairy industry required only 21% of the dairy population and
therefore 23% of the feedstuffs, 10% of the land and 35% of the water to produce a set quantity of milk.
Manure output per unit of milk produced in 2007 was 24% of that in 1944 and the total carbon footprint per
unit of milk was reduced by 63%. Despite the increase in total milk production between 1944 and 2007, the
total carbon footprint for the entire dairy industry was reduced by 41%.
Myth: Pasture-based and organic production systems are better for the environment
It is clear that the transformation of the U.S. dairy industry from extensive pasture-based dairying to the
modern intensive system has considerably reduced both resource use and GHG emissions per unit of milk.
Nonetheless, a small yet vocal proportion of the population advocate for pasture-based or organic dairy
systems (Gumpert, 2009; Pollan, 2007; Salatin, 2007), citing perceived differences in the healthiness and
environmental impact of milk produced from cows grazing pasture. The organic food industry has also
gained market share over the past decade within the United States, with consumers attributing positive
characteristics to organic food including “chemical-free”, “healthier” and “earth-friendly” (Raab & Grobe,
2005). These perceptions are debatable, for example, a considerable body of knowledge indicates that

13
organic dairy products may have minor increases in specific fatty acids, but these are a consequence of the
increase in pasture-feeding in organic systems vs. total mixed rations in conventional systems, and are
present in such small quantities that they have no measurable human health effects (Brown, Trenkle, &
Beitz, 2011).
Pasture-based systems can only gain an environmental advantage over conventional dairying when they
support milk production without negatively impacting yield or increasing resource use per unit of dairy. A
recent analysis from the Organic Center intended to demonstrate the environmental advantages of organic
dairy production was based on a flawed premise, namely that milk yield per cow does not differ between
conventional and organic systems (Benbrook, 2009). By contrast, USDA data relating to milk yields in
pasture-based vs. conventional dairy systems reveals a 26% decrease in milk yield per cow (Figure 5) and
peer-reviewed papers comparing organic and conventional production cite decreases in milk yield ranging
from 14% to 40% (Rotz, Kamphuis, Karsten, & Weaver, 2007; Sato, Bartlett, Erskine, & Kaneene, 2005; Zwald
et al., 2004). As previously discussed, a reduction in milk yield means that the dairy population size must
increase in order to maintain total fluid milk production. If we project out to the year 2040 when the U.S.
population is predicted to plateau at 340 million people, to supply the entire population with their daily
USDA-recommended 0.71 L of low-fat milk (or its equivalent) through organic production practices would
require 3.5 million additional animals to be added to the national herd and land use to increase by 7.7
million acres (a 30% increase). When the reduction in productivity is combined with the propensity for high-
forage and pasture-based diets to increase ruminal methanogenesis and thus enteric GHG emissions
(Johnson & Johnson, 1995; Pinares-Patiño, Waghorn, Hegarty, & Hoskin, 2009), the carbon footprint of
organic dairy production in 2040 would have a carbon footprint 13% greater than that of conventional
production.
Figure 5: Average annual milk yield per cow in conventional, organic and pasture-based U.S. dairy
production systems, adapted from USDA (2007).
Sequestration of carbon from the atmosphere into plant or soil biomass is often quoted as a major
environmental advantage of pasture-based systems. However, pasture does not sequester carbon
indefinitely, nor does it occur at a constant rate. Over time, soil carbon concentrations reach an equilibrium
point, beyond which no further sequestration occurs unless land is subjected to significant management
change (Post & Kwon, 2000; Schlesinger, 2000). The present body of knowledge indicates that the degree to
which carbon may be sequestered by crop or pastureland is infinitely variable between systems and is highly
dependant on a myriad of factors including land use change, tillage, organic matter input, soil type and
crop/pasture species (Lal, 2004; West & Marland, 2002). Furthermore, CH4 has a global warming potential

14
25X than of CO2, thus soil sequestration potential is unlikely to overcome the effects of low productivity and
increased enteric CH4 emissions from pasture-based systems.
Myth: Milk yield is the most important factor when assessing carbon footprint
One criticism often leveled at intensive dairy production systems is that high-producing cows tend to have
an increased bodyweight, thus consume more feed and emit greater quantities of GHG on a daily basis. Data
from the previously-discussed historical comparison validates this claim in that the shift from a population
containing 54% smaller breeds (Jersey and Guernsey) in 1944 to 90% Holstein cows in 2007 increased milk
yield, but also increased individual cow bodyweight and maintenance nutrient cost. If daily GHG emissions
per animal are the correct metric by which to evaluate environmental impact, the 1944 system appears to
show merit as the daily GHG output per animal was 13.5 kg CO2-eq compared to 27.8 kg CO2-eq in 2007
(Capper et al., 2009). Nonetheless, expressing results on a ‘per head’ basis fails to consider milk yield and
other productivity indices that may have a significant effect upon population size and thus environmental
impact, including milk composition, calving interval, age at first calving and longevity. Furthermore, as the
population maintenance requirement is a function of both population size and mass, an increased dairy
population size may not definitively lead to an increase in GHG emissions per unit of product. Capper and
Cady (2012) therefore investigated the effect of breed-specific characteristics upon resource use and GHG
emissions from dairy production, through production of sufficient milk to manufacture 500,000 MT of
Cheddar cheese from a Jersey or Holstein population.
Jersey cattle confer two potential breed-specific advantages over the Holstein in terms of environmental
impact. Firstly, despite their reduced milk yield (20.9 kg/day compared to 29.1 kg/day) they have an
increased milk solids concentration (480 g/kg fat and 370 g/kg protein compared to 380 kg milkfat/kg and
310 g protein/kg for the Holstein) and thus a predicted Cheddar cheese yield of 125 g/kg compared to 101
g/kg milk. Secondly, mature U.S. Jersey cattle have an average bodyweight of 454 kg compared to 680 kg for
the Holstein, thus individual animals have a smaller maintenance requirement. Within this comparison,
Capper and Cady (2012) demonstrated that, in contrast to their previous work, dairy population size does
not predict environmental impact per unit of dairy production as although an interaction between milk yield
and milk solids concentration meant that the Jersey population required to produce 500,000 MT of cheese
yield was 9% greater than the Holstein population required to yield the same quantity of cheese, the body
mass of the Jersey population was reduced by 26%. Consequently, water use was reduced by 32%, land use
by 12% and GHG emissions by 20% per unit of cheese yield. Within this comparison, the major productivity
factors affecting environmental impact were milk yield, milk solids content and animal bodyweight, with
lesser effects of age at first calving, calving interval and cow longevity. Nonetheless, it is important to note
that this was a comparison based on two data points per factor (one average for each breed) thus further
research involving a range of values for each factor is currently being undertaken.
Myth: Greenhouse gas emissions are more important than nutritional content
The need to assess environmental impact based upon nutrient density is of increasing importance to
processors and retailers as well as producers, as greater product differentiation occurs between dairy
products and other beverages. Some European retail grocery chains employ labels showing the ‘carbon
footprint’ per unit of milk and such schemes may be adopted in the U.S. in future. This is a particular concern
when comparing, for example, fluid milk to cheese. Given that it takes between 8-10 kg of milk to make one
kg of cheese, a unit weight of cheese would be labelled with a carbon footprint approximately 10x that of
the same unit weight of milk. This might lead the consumer to discriminate against products that have a
larger carbon footprint, regardless of nutritional value.
Smedman et al. (2010) demonstrated that milk had the most favourable ratio of nutrient content to GHG
emissions when compared to orange juice, soy and oat beverages and alcoholic drinks. The challenge is to
communicate these results to consumers to whom milk is often regarded as either nutritionally
unfavourable or environmentally unsustainable. This is of particular concern in the wake of recent reports
claiming that consumers could considerably reduce their carbon footprint by forgoing animal protein.
Initially popularised as “Meatless Mondays”, this campaign garnered increased attention when the

15
Environmental Working Group (2011) published a report recommending that consumers should replace red
meat and dairy products with chicken or vegetable protein products for one day per week. The original
“Meatless Mondays” concept appears to originate from a paper published by Weber and Matthews (2008) in
which the authors state that ““Shifting less than one day per week’s worth of calories from red meat and
dairy products to chicken, fish, eggs, or a vegetable-based diet achieves more GHG reduction than buying all
locally sourced food.” The lack of a “control” treatment against which to compare the removal of red meat
and dairy products from the diet renders this comparison practically meaningless, nonetheless, it has been
adopted by various vegetarian and vegan groups as proof that meat consumption is environmentally
unfriendly. Citizens of most developed nations could arguably consume less red meat and dairy products
without negatively impacting their health status, nonetheless, it is somewhat reckless to suggest that a small
dietary change would have a major impact on national or global GHG emissions. For example, the U.S.
population is generally considered to have the greatest annual red meat consumption per capita at 49.4 kg
(CME Group, 2011) yet GHG emissions attributable to red meat and dairy production are equal to 3.05% of
the national total (US EPA, 2010a). If every U.S. inhabitant removed red meat and dairy products from their
diet (with a concurrent reduction in the by-products such as leather, adhesives and pharmaceuticals that are
associated with these animal products), the reduction in U.S. GHG emissions would be equal to 0.44%. Any
attempt to reduce GHG may be considered laudable, nonetheless, a 0.44% reduction (assuming that this
concept was adopted by the entire population) would make very little difference to total emissions,
especially since it is not expressed in the context of other human activities, for which we have at best a
tenuous grasp of the potential environmental impact.
The Environmental Working Group (2011) should be commended in that the results are presented on the
basis of maintaining dietary protein supply from animal vs. plant sources, although the authors demonstrate
a limited understanding of livestock production systems which in some cases lead to underlying assumptions
for their model that are entirely unfeasible. Nutritionally however, it is a fallacy to suggest that protein
quality does not differ between various sources, especially when specific amino acids are required for
human growth and development (Bauman & Capper, 2011). The oft-heard argument that livestock
production competes for food resources with humans and that sufficient land exists to feed the entire
population on a vegan diet suffers from the same assumption, albeit from the animal viewpoint. Grazing
livestock systems provide for the conversion of human-indigestible plant material into high-quality animal
protein for human consumption. The majority of land used for grazing ruminants is not suitable for growing
crops for human consumption, indeed data from the USDA’s Economic Research Service (Lubowski,
Vesterby, Bucholtz, Baez, & Roberts, 2006) indicates that only 8% of U.S. grazed land is sufficiently
productive to be classified as cropland pasture, therefore pasture-based dairy production provides an
opportunity to feed the human population without competing for grain-based food resources. Beyond the
use of pasture and grassland however, livestock production systems utilise a significant proportion of by-
products from the human food and fibre industries that are inedible by humans. In a recent analysis of the
quantity of human-edible protein input fed to livestock in the United Kingdom, Wilkinson (2011)
demonstrated that both dairy and upland suckler beef systems generated a favourable ratio of human-
edible protein input compared to output (0.71 for dairy and 0.92 for beef). The use of by-product feeds thus
allows for production of high-quality animal protein from otherwise inedible material, which reduces
competition for cropland and also reduces the environmental impact of production by utilising feed stocks
for which the majority of carbon emissions can be attributed to human food or fibre.
Myth: Magic bullets exist to reduce dairy’s environmental impact
Dairy production is a complex entity with interaction between a myriad of sub-systems, thus no “magic
bullet” currently exists that can be applied to a single component or process within the dairy system to
reduce environmental impact, without incurring potential negative trade-offs. A considerable body of
research is currently devoted to reducing enteric CH4 emissions by feeding fish oil or other feed additives
that inhibit rumen methanogenesis. Although laudable in intent, a shift in ruminal population away from
methanogenic bacteria is often associated with a decrease in milk fat yield (Ahnadi, Beswick, Delbecchi,
Kennelly, & Lacasse, 2002). In a market where the majority of milk production is directed into manufacture

16
of dairy products such as cheese, butter and yogurt such as is seen in the U.S., a reduction in component
yield becomes of critical importance as a greater quantity of milk is required to maintain milk solids
production, thus potentially increasing resource input and GHG emissions per unit of dairy product.
Within the farm technology arena, anaerobic digesters are often cited as a providing a major opportunity to
reduce GHG emissions, yet they have only been installed on a small number of livestock operations in the
U.S. (The AgSTAR Program, 2009). The primary reason for low adoption rates is that digesters are not size-
neutral technologies. Installation and maintenance requires significant capital investment and is not an
economically feasible solution on small farms – at present it is suggested that digesters may only generate
sufficient income to be financially viable investments on farms with >500 cows (The AgSTAR Program, 2007).
According to USDA (2007), 76% of U.S. dairy farms have herds containing <100 cows and 95% have <500
cows, indicating that digester technology will have to become significantly more affordable before
widespread adoption occurs. Manure CH4 emissions are reduced through digester use, however a negative
trade-off may be observed as emissions of other air pollutants (e.g. NOx) may increase to unacceptable
levels (Chianese, Harrison, & Lester, 2009). It is essential to remember that manure CH4 is only one
component of total dairy GHG emissions – even if digesters were installed on every single U.S. dairy farm
and worked at optimal efficiency, this would still fall short of meeting the U.S. dairy industry’s pledge to
reduce total GHG emissions by 25% by the year 2020 (Innovation Center for U.S. Dairy, 2010).
CONCLUSIONS
The global dairy industry faces a clear challenge in supplying the needs of the increasing global population,
while reducing environmental impact. Advances in genetics, nutrition, management and welfare over the
past century have conferred improvements in productivity that have allowed modern production systems to
reduce both resource use and GHG emissions per unit of dairy. Assuming that productivity trends continue
into the future, the dairy industry is well-placed to continue its tradition of environmental stewardship, yet
the industry faces considerable opposition in terms of consumer misconceptions that may affect social
sustainability. Demonization of specific sectors in favor of niche markets that intuitively appear to have a
smaller carbon footprint further propagate the idea that conventional production systems are undesirable.
In developed regions where food is readily available, consumers are afforded the luxury of making choices
according to production system or technology use and that choice should continue to be available, yet many
developing regions exist where the simple need for food negates such concerns. All dairy systems have the
potential to improve productivity and reduce environmental impact regardless of region, management or
breed - the industry needs to find ways to communicate the rationale behind differences in production
systems using language and concepts that the majority of consumers understand, without denigrating other
segments of the industry.
REFERENCES
Ahnadi, C E, Beswick, N, Delbecchi, L, Kennelly, J J, & Lacasse, P. (2002). Addition of fish oil to diets for dairy
cows. II. Effects on milk fat and gene expression of mammary lipogenic enzymes. Journal of Dairy Research,
69, 521-531.
Bauman, D E, & Capper, J L. (2011). Future Challenges and Opportunities in Animal Nutrition. Paper
presented at the 26th Southwest Nutrition & Management Conference, Tempe, AZ.
Benbrook, C. (2009). Shades of Green: Quantifying the Benefits of Organic Dairy Production. Boulder, CO:
The Organic Center.
Brown, A W, Trenkle, A H, & Beitz, D C. (2011). Diets high in conjugated linoleic acid from pasture-fed cattle
did not alter markers of health in young women. Nutrition Research, 31, 33-41.
Capper, J L. (2010). The environmental impact of conventional, natural and grass-fed beef production
systems. Paper presented at the Proceedings of the Greenhouse Gases and Animal Agriculture Conference,
Banff, Canada.

17
Capper, J L. (2011a). The environmental impact of United States beef production: 1977 compared with 2007.
Journal of Animal Science, 89, 4249-4261.
Capper, J L. (2011b). Replacing rose-tinted spectacles with a high-powered microscope: The historical vs.
modern carbon footprint of animal agriculture. Animal Frontiers, 1, 26-32.
Capper, J L, & Cady, R A. (2012). A comparison of the environmental impact of Jersey vs. Holstein milk for
cheese production. Journal of Dairy Science, 95, 165-176.
Capper, J L, Cady, R A, & Bauman, D E. (2009). The environmental impact of dairy production: 1944
compared with 2007. Journal of Animal Science, 87, 2160-2167.
Capper, J L, Castañeda-Gutiérrez, E, Cady, R A, & Bauman, D E. (2008). The environmental impact of
recombinant bovine somatotropin (rbST) use in dairy production. Proceedings of the National Academy of
Sciences of the United States of America, 105, 9668-9673.
Chianese, D S, Harrison, J O, & Lester, J C. (2009). Anaerobic digesters: Benefits, barriers, and policy
implications. Paper presented at the 2009 ASABE Annual International Meeting, Reno, NV.
CME Group. (2011). Daily Livestock Report (Vol. 9). Chicago, IL: CME Group.
Environmental Working Group. (2011). Meat Eater's Guide to Climate Change and Health. Washington, DC:
Environmental Working Group.
Food and Agriculture Organization of the United Nations. (2006). Livestock's Long Shadow - Environmental
Issues and Options. Rome, Italy: FAO.
Food and Agriculture Organization of the United Nations. (2009a). FAOSTAT Retrieved September 2009,
from http://faostat.fao.org/
Food and Agriculture Organization of the United Nations. (2009b). How to Feed the World in 2050. Rome,
Italy: FAO.
Food and Agriculture Organization of the United Nations. (2010). Greenhouse Gas Emissions from the Dairy
Sector: A Life Cycle Assessment. In FAO (Ed.). Rome, Italy: FAO.
Gumpert, D. (2009). The raw milk revolution: Behind America's emerging battle over food rights. White River
Junction, VT: Chelsea Green Publishing.
Innovation Center for U.S. Dairy. (2010). U.S. Dairy Sustainability Commitment Progress Report. Rosemont,
IL: Innovation Center for US Dairy.
Johnson, K A, & Johnson, D E. (1995). Methane emissions from cattle. Journal of Animal Science, 73, 2483-
2492.
Kolodinsky, J. (2008). Affect or information? Labeling policy and consumer valuation of rBST free and organic
characteristics of milk. Food Policy, 33, 616-623.
Koneswaran, G, & Nierenberg, D. (2008). Global farm animal production and global warming: impacting and
mitigating climate change. Environmental Health Perspectives, 116, 578-582.
Lal, R. (2004). Soil carbon sequestration to mitigate climate change. Geoderma, 123, 1-22.
LIC. (2008). New Zealand Dairy Statistics 2007-08. In LIC (Ed.). Hamilton, New Zealand: LIC.
Lubowski, R N, Vesterby, M, Bucholtz, S, Baez, A, & Roberts, M J. (2006). Major Uses of Land in The United
States, 2002. Economic Information Bulletin Number 14. In USDA/ERS (Ed.). Washington, DC: USDA/ERS.
McMichael, A J, Powles, J D, Butler, C D, & Uauy, R. (2007). Food, livestock production, energy, climate
change, and health. Lancet, 370, 1253-1263.
Moses, V. (1999). Biotechnology products and European consumers. Biotechnology Advances, 17, 647-678.

18
Pinares-Patiño, C S, Waghorn, G C, Hegarty, R S, & Hoskin, S O. (2009). Effects of intensification of pastoral
farming on greenhouse gas emissions in New Zealand. New Zealand Veterinary Journal, 57, 252-261.
Pitesky, M E, Stackhouse, K R, & Mitloehner, F M. (2009). Clearing the air: Livestock's contribution to climate
change. Advances in Agronomy, 103, 3-40.
Pollan, M. (2007). The Omnivore's Dilemma. New York, NY: The Penguin Group.
Post, W M, & Kwon, K C. (2000). Soil carbon sequestration and land-use change: Processes and potential.
Global Change Biology, 6, 317–328.
Raab, C, & Grobe, D. (2005). Consumer knowledge and perceptions about organic food. Journal of Extension,
43, Available at: http://www.joe.org/joe/2005august/index.shtml.
Rotz, C A, Kamphuis, G H, Karsten, H D, & Weaver, R D. (2007). Organic dairy production systems in
Pennsylvania: a case study evaluation. Journal of Dairy Science, 90, 3961–3979.
Salatin, J. (2007). Everything I Want To Do Is Illegal. Swoope, VA: Polyface Farm Inc.
Sampson, R N, & Hair, D. (1996). Forests and Global Change (Vol. II). Washington, DC: American Forests.
Sato, K, Bartlett, P C, Erskine, R J, & Kaneene, J B. (2005). A comparison of production and management
between Wisconsin organic and conventional dairy herds. Livestock Production Science, 93, 105–115.
Sawyer, D. (2008). Climate change, biofuels and eco-social impacts in the Brazilian Amazon and Cerrado.
Philosophical Transactions of the Royal Society of London. Series B, Biological Sciences, 363, 1747-1752.
Schlesinger, W H. (2000). Carbon sequestration in soils: some cautions amidst optimism. Agriculture,
Ecosystems & Environment, 82, 121-127.
Singer, P, & Mason, J. (2006). The Way We Eat: Why Our Food Choices Matter (1st ed.). Emmaus, PA: Rodale
Books.
Smedman, A, Lindmark-Mansson, H, Drewnowski, A, & Modin Edman, A-K. (2010). Nutrient density of
beverages in relation to climate impact. Food & Nutrition Research, 54, 1-8.
Smith, W B, Miles, P D, Vissage, J S, & Pugh, S A. (2005). Forest Resources of the United States, 2002.
Washington, DC: USDA Forest Service.
The AgSTAR Program. (2007). AgSTAR Handbook. Washington, DC: EPA.
The AgSTAR Program. (2009). Guide to Anaerobic Digesters Retrieved March 2010, from
http://www.epa.gov/agstar/operational.html
The Humane Society of the United States. (2008). An HSUS Report: The Impact of Animal Agriculture on
Global Warming and Climate Change. Washington, DC: HSUS.
Tilman, D, Cassman, K G, Matson, P A, Naylor, R, & Polasky, S. (2002). Agricultural sustainability and intensive
production practices. Nature, 418, 671-677.
U.S. Census Bureau. (2008). Total Midyear Population for the World: 1950-2050. Retrieved July 2009, from
http://www.census.gov/ipc/www/idb/worldpop.html
US EPA. (2007). Inventory of U.S. Greenhouse Gas Emissions and Sinks 1990-2005. Annex 3: Methodological
Descriptions for Additional Source or Sink Categories. Washington, DC.: US EPA.
US EPA. (2010a). Inventory of U.S. Greenhouse Gas Emissions and Sinks: 1990-2008. Washington, DC: US
EPA.
US EPA. (2010b). What is Sustainability? Retrieved 15 March 2010, 2010, from
http://www.epa.gov/Sustainability/basicinfo.htm
USDA. (2002). Major Land Uses in the United States, 2002 (EIB-14). In Economic Research Service USDA (Ed.).
Washington, DC: USDA, Economic Research Service.

19
USDA. (2005). Dietary Guidelines for Americans 2005. In USDA (Ed.). Washington, DC: USDA.
USDA. (2007). Dairy 2007, Part I: Reference of Dairy Cattle Health and Management Practices in the United
States, 2007. Fort Collins, CO: USDA-APHIS-VS.
Voelker, DE. (1992). History of Dairy Recordkeeping. Ames, IA: The National Dairy Database.
Weber, C L, & Matthews, H S. (2008). Food-miles and the relative climate impacts of food choices in the
United States. Environmental Science & Technology, 42, 3508-3515.
West, T O, & Marland, G. (2002). A synthesis of carbon sequestration, carbon emissions, and net carbon flux
in agriculture: comparing tillage practices in the United States. Agriculture, Ecosystems & Environment, 91,
217–232.
Wilcock, A, Pun, M, Khanona, J, & Aung, M. (2004). Consumer attitudes, knowledge and behaviour: a review
of food safety issues. Trends in Food Science & Technology, 15, 56-66.
Wilkinson, J M. (2011). Re-defining efficiency of feed use by livestock. Animal, 5, 1014-1022.
Zwald, A G, Ruegg, P L, Kanenne, J B, Warnick, L D, Wells, S J, Fossler, C, & Halbert, L W. (2004). Management
practices and reported antimicrobial usage on conventional and organic dairy farms. Journal of Dairy
Science, 87, 191–201.
20

21
GROWING MORE PASTURE AND YOUR PROFITS
CAMERON CLARK
FutureDairy, University of Sydney
Email: [email protected]
Farm profit will almost always increase alongside the amount of pasture grown and converted to milk. There
is opportunity to grow and utilise more pasture on all Australian dairy farms according to the variability in
pasture growth between paddocks. Pasture growth data from some of the most productive and profitable
farms in the Waikato region of New Zealand highlighted this variability. Paddocks with similar management
yielded from 10 to 26t DM/ha/year. This data highlights the value of monitoring pasture cover on an
individual paddock basis and the opportunity to use this data to guide management decisions and increase
the yield of poor performing paddocks. Management decisions to improve the productivity of these paddocks
could be guided in the future by programs such as PGSUS (Pasture Growth Simulation Using Smalltalk) which
learns from pasture cover data, fills in the gaps between pasture cover measurements, and highlights
opportunities to increase pasture growth.
INTRODUCTION
With recent advances in technology and automation, there is great opportunity to reduce the costs of milk
production, or alternatively increase milk production whilst maintaining costs. Technological advances have
enabled individual cow and paddock data to be captured and as a result, farming according to averages is
becoming a thing of the past.
Milk metering systems are now available that can monitor milk from each quarter of a cow’s udder (see
www.herdnavigator.com). These systems can monitor indicators such as:
i) Ketone bodies (a product of fat breakdown) to convey the energy status of dairy cow and guide
appropriate feeding management to minimise metabolic disorders.
ii) Lactate dehydrogenase (LDH) and conductivity to minimise the incidence of sub-clinical and clinical
mastistis and the associated loss of milk production.
iii) Progesterone to guide the timing of artificial insemination to improve conception rates and overall
reproductive performance.
Looking to the future, exciting work being conducted at the University of Sydney uses thermal imaging to
detect estrous in dairy cows (see current proceedings Talukder et al.). This same technology may also have
application for detecting sites of infection associated with mastitis and lameness.
In parallel with the development of technology to monitor the health and reproductive status of individual
dairy cows, the impact of varying feed inputs for individual cows to improve the efficiency of milk production
has been investigated. As an example, research conducted within Future Dairy (Garcia et al., 2007) has
shown the milk yield of cows offered a variable rate of concentrate, based on individual cow requirements,
to be 9% higher than cows offered the same total amount of concentrate at a fixed rate. Although the
quantity of pasture fed to the individual cows is fixed, there are systems available that enable pasture to be
automatically offered at differing times of the day to the herd such as battery operated latches

22
(www.grazetech.com.au) to allow cows to move to and from pasture, and robots that can offer varying
amounts of pasture through the day by automatically moving a fence line across a paddock (www.lely.com).
The aforementioned research highlights the considerable amount of work and investment that has been,
and continues to be, allocated to optimise the health and production of individual cows. What has been
somewhat left behind is the development of technology to optimise the health and production of individual
paddocks. This is a concern given that pasture is still one of the cheapest and highest quality feeds for dairy
cows.
This manuscript highlights the considerable opportunity to increase the amount of pasture grown on all
Australian dairy farms. The variability in pasture growth between paddocks from research conducted in New
Zealand at DairyNZ by Alvaro Romera, Kevin Macdonald, Dave Clark and myself will be given. Suggested
methods to capatilise on this data and improve pasture growth will also be provided.
1. The variability in pasture growth
A. Between Paddocks
Research was undertaken to characterise paddock to paddock annual dry matter yield variability for
commercial and research dairy farms in the Waikato region of New Zealand (Clark et al., 2010), as a first step
towards improving the amount of pasture grown and eaten by dairy cows. Pasture yield was monitored on
two commercial farms and one research farm for two years, and another research farm for seven years in
the Waikato region of New Zealand.
Pasture yield for individual paddocks across farms ranged from 9.5 to 26.1t DM/ha/year. Within farms the
highest yielding paddock produced between 30 and 120% more pasture than the lowest yielding paddock.
Three examples of this variability are provided in Figure 1. For research farm 1, individual paddock pasture
yield ranging from 12t DM/ha/yr (2% of paddocks) to 22tDM/ha/yr (10% of paddocks) with 50% of paddocks
yielding 18t DM/ha/yr. Commercial farms had a similar range between the lowest and highest yielding
paddocks paddocks, however, the average yield of commercial farms was between 3 and 5t DM/ha/yr lower
(a 25% decrease) than the research farm.
Acknowledging that there were minor differences in soil type and topography between research and
commercial farms in this study, these findings show the ability of management on the research farm to
increase the average level of pasture grown by creating high yielding paddocks from low yielding ones. The
benefit to implementing such management across dairy farms would be large. For an average Australian
dairy farm of 120ha (Australian Agricultural Assessment Report, 2001), increasing the average pasture yield
of 13t DM/ha (Cullen et al., 2008) by 25% would result in an additional 3t DM/ha, or 360t DM across the
farm. This equates to an additional 360,000L for the average farm at a feed conversion efficiency of 1L/kg
DM.

23
B. Within paddocks
New pasture monitoring technology has reduced the time taken to determine pasture cover across a farm.
The C-Dax rapid pasture meter (Lawrence et al., 2007; www.pasturemeter.co.nz) and automatic pasture
reader (www.pasturereader.com.au) determine pasture height and with calibration equations convert these
measurements to pasture cover. This technology significantly increases the number of pasture cover
measurements that can be taken in a paddock. For example, the C-Dax rapid pasture meter can determine
height/cover 200 times per second and relate each of these measurements to location via GPS, enabling the
variability in pasture yield within paddocks to be determined (see Figure 2). Similar to the findings between
paddocks, this technology indicates that the variability in pasture yield within paddocks (range from <1,400
to 3,400kg DM/ha) is large.
These advances in technology have greatly increased the amount of data presented to dairy farmers.
However, dairy farm management will only be able to capitalise on this data if the causes of pasture yield
variability are known.
Figure 1. Paddock pasture yield (t DM/ha/yr) for research farm 1 ( ), commercial farm 1 ( ) and
commercial farm 2 ( ).

24
Figure 2. Pre-grazing pasture cover of a paddock from Massey No. 4 Dairy Farm measured using the Rapid
Pasture Metre®(reproduced with permission by Lawrence et al., 2007).
2. Capitalising on pasture growth variability
To increase the pasture yield of poor performing areas, the cause of the poor performance must firstly be
determined. However, pasture yields for the majority (≈90%) of paddocks in the work of Clark et al. (2010)
were variable between years. These data suggest that the interaction between soil and climate should be
considered when classifying paddocks according to yield. As an example, a water logged area in a wet year
with low pasture yield may be one of the areas with high pasture yield in a dry year. Programs that learn
from pasture yield across a farm as a response to climate can help to determine the cause of low pasture
yields and to define areas for similar management. One such potential program is PGSUS (Romera et al.,
2010).
PGSUS (Pasture Growth Simulation Using Smalltalk)
PGSUS is a climate driven model with the primary purpose of predicting herbage mass between herbage
measurements. For instance, if weekly pasture cover estimates are required and a current estimate of cover
was not available then PGSUS would predict the week’s pasture growth rate for that particular paddock and
add this on to the last observed measurement. The ability of this technology to accurately predict out
pasture cover for individual paddocks is highlighted in Romera et al. (2010). PGSUS predicted pasture cover
for individual paddocks out to a month from the last measurement with acceptable levels of accuracy
(correlation between observed and estimated pasture mass r > 0.8). These data show the potential of this
technology to forecast pasture growth levels for individual paddocks given the input of accurate forecasted
climate data.
The accuracy of PGSUS relies on the pasture growth model (McCall and Bishop-Hurley (2003) as modified by
Romera et al., 2009) learning from the response of pasture to climate. Parameters such as available water
holding capacity and radiation use efficiency are fitted within the model using all available historic data for
each paddock. In this process, areas of the farm are given their own parameters defining how pasture
responds to the climate. It is parameters such as these that will form the future basis for improving pasture
performance and could be used to create an Australian paddock performance database.

25
Within the paddock performance database, areas assigned very high WHC would be the first areas to be
checked for poor drainage. Conversely, areas of low water holding capacity would be areas to check for
compaction. If there was no compaction, plant species adapted to low soil moisture environments such as
chicory or lucerne, or annual species with high levels of growth during seasons when rainfall is typically high,
could be established. Areas assigned low radiation use efficiency would be checked for low fertility and/or
low plant densities. Conversely, such a database would also provide the opportunity for management to
learn from the high performance areas and potentially replicate the success of these areas across the farm.
Current application of these findings to increase pasture growth
This manuscript has highlighted future advances in the way that data is collected, analysed and presented
back to the dairy farmer to increase pasture yields. Below are a few areas to be considered now.
• Renewed focus on soil
- given the similar management of pasture across paddocks for commercial farms in the research given
above, these findings suggest that what is going on below the pasture is having a large influence on
pasture performance.
- obtaining advice from a soil scientist may be one of the best investments currently available on farm.
• Fertiliser
- some dairy farmers are now soil testing each individual paddock and applying fertilizer according to
each result. The reduction in fertiliser costs have more than offset increased soil test costs.
• Grazing days
- a record of grazing days for each paddock on the farm would highlight the performance of paddocks,
particularly those at either end of the yield spectrum.
- digging a few holes in low yielding paddocks may reveal the underlying cause of poor performance,
particularly if the cause is compaction.
• Cropping
- careful consideration should be given as to where to establish a crop. Replacing a paddock yielding
25t DM/ha of pasture with a crop of similar yield would most often result in reduced profit. Converting
a poor performing paddock to one of the high yielding paddocks through cropping can only help the
bottom line.
SUMMARY
• In an NZ study, paddocks with similar management yielded from 10 to 26t DM/ha/year. This data highlights
the value of monitoring pasture cover on an individual paddock basis on Australian farms.
• There is significant opportunity to use this data to guide management decisions and increase the yield of poor
performing paddocks.
• Management decisions to improve the productivity of poor performing paddocks could be guided in the future
by programs such as PGSUS. Outputs from programs such as PGSUS will likely form the basis of an Australian
Paddock Performance Database.
• If pasture cover is not currently monitored, recording grazing days for each paddock on the farm could identify
poor performing paddocks.
• What is happening below the pasture is driving pasture growth. Getting advice from a soil scientist to improve
the yield of poor performing paddocks would be a great investment.

26
• Carefully consider which paddocks are allocated to a crop as using an area for a crop, currently yielding high
amounts of pasture, may result in a lot of effort for very little gain (or loss).
ACKNOWLEDGMENTS
The author would like to acknowledge the modeling team and technicians at DairyNZ for their contribution
to the work detailed in this manuscript, in particular Dr Alvaro Romera.
REFERENCES
Clark, C.E.F., Romera, A.J., Macdonald, K.A., and Clark, D.A. (2010). Inter-paddock annual dry matter yield
variability for dairy farms in the Waikato region of New Zealand. New Zealand Journal of Agricultural
Research, 53:2, 187-191.
Cullen, B.R., Eckard, R.J., Callow, M.N., Johnson, I.R., Chapman, D.F., Rawnsley, R.P., Garcia, S.C., White, T.,
and Snow, V.O. (2008). Simulating pasture growth rates in Australian and New Zealand grazing systems.
Australian Journal of Agricultural Research, 59, 761–768.
García, S.C., Pedernera, M., Fulkerson, W.J., Horadagoda, A., and Nandra, K.S. (2007). Feeding concentrates based on
individual cow requirements improves the yield of milk solids in dairy cows grazing restricted pasture. Australian
Journal of Experimental Agriculture, 47, 502-508.
Lawrence, H., Yule, I., and Murray, R. (2007). Pasture Monitoring Technologies. Proceedings of the South
Island Dairy Event Conference, 8, 126-131.
McCall, D.G., and Bishop-Hurley, G.J. (2003). A pasture growth model for use in a wholefarm dairy
production model. Agricultural Systems, 76, 1183–1205.
Romera, A.J., Beukes, P., Clark, C., Clark, D., Levy, H., and Tait, A. (2010). Use of a pasture growth model to
estimate herbage mass at a paddock scale and assist management on dairy farms Computers and Electronics
in Agriculture, 74, 66–72.
27
A FARMING PHILOSOPHY TO AVOID WASTED ENERGY ON A NEW ZEALAND DAIRY FARM
DR. HAYDEN LAWRENCE
Dairy Farmer, 871 Fraser Road, RD 13, Hawera, Taranaki, NZ.
Email: [email protected].
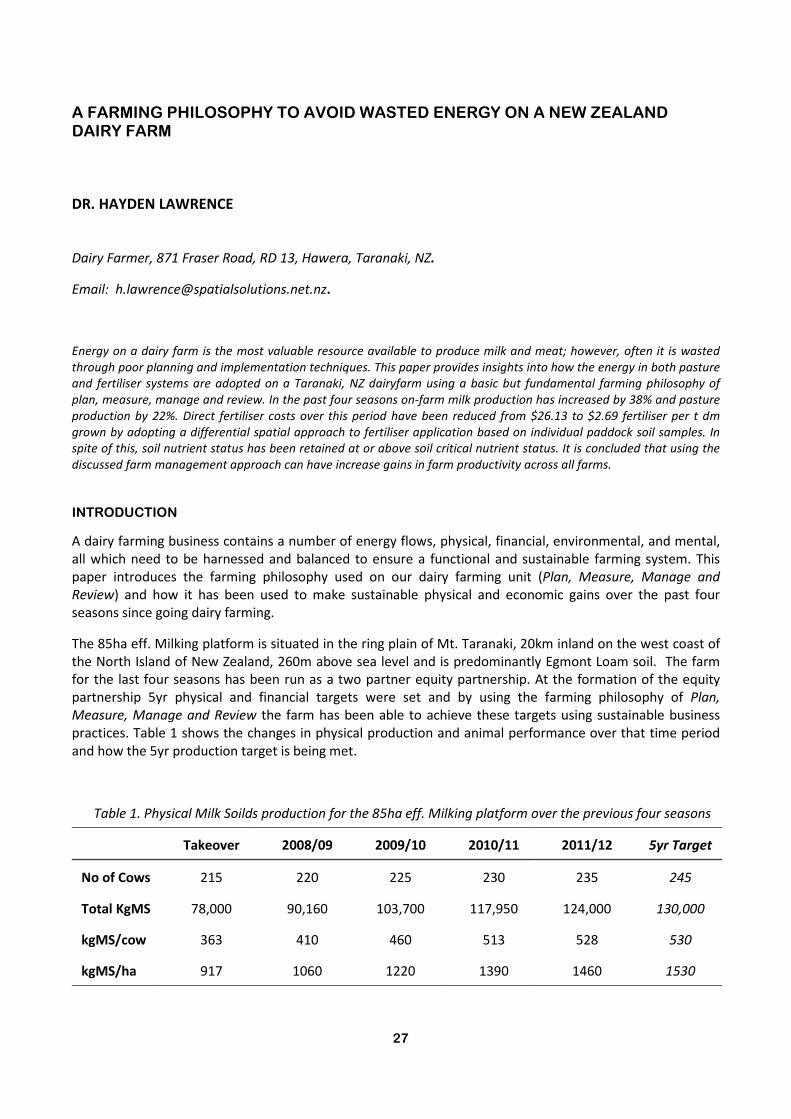
Energy on a dairy farm is the most valuable resource available to produce milk and meat; however, often it is wasted
through poor planning and implementation techniques. This paper provides insights into how the energy in both pasture
and fertiliser systems are adopted on a Taranaki, NZ dairyfarm using a basic but fundamental farming philosophy of
plan, measure, manage and review. In the past four seasons on-farm milk production has increased by 38% and pasture
production by 22%. Direct fertiliser costs over this period have been reduced from $26.13 to $2.69 fertiliser per t dm
grown by adopting a differential spatial approach to fertiliser application based on individual paddock soil samples. In
spite of this, soil nutrient status has been retained at or above soil critical nutrient status. It is concluded that using the
discussed farm management approach can have increase gains in farm productivity across all farms.
INTRODUCTION
A dairy farming business contains a number of energy flows, physical, financial, environmental, and mental,
all which need to be harnessed and balanced to ensure a functional and sustainable farming system. This
paper introduces the farming philosophy used on our dairy farming unit (Plan, Measure, Manage and
Review) and how it has been used to make sustainable physical and economic gains over the past four
seasons since going dairy farming.
The 85ha eff. Milking platform is situated in the ring plain of Mt. Taranaki, 20km inland on the west coast of
the North Island of New Zealand, 260m above sea level and is predominantly Egmont Loam soil. The farm
for the last four seasons has been run as a two partner equity partnership. At the formation of the equity
partnership 5yr physical and financial targets were set and by using the farming philosophy of Plan,
Measure, Manage and Review the farm has been able to achieve these targets using sustainable business
practices. Table 1 shows the changes in physical production and animal performance over that time period
and how the 5yr production target is being met.
Table 1. Physical Milk Soilds production for the 85ha eff. Milking platform over the previous four seasons
Takeover 2008/09 2009/10 2010/11 2011/12 5yr Target
No of Cows 215 220 225 230 235 245
Total KgMS 78,000 90,160 103,700 117,950 124,000 130,000
kgMS/cow 363 410 460 513 528 530
kgMS/ha 917 1060 1220 1390 1460 1530
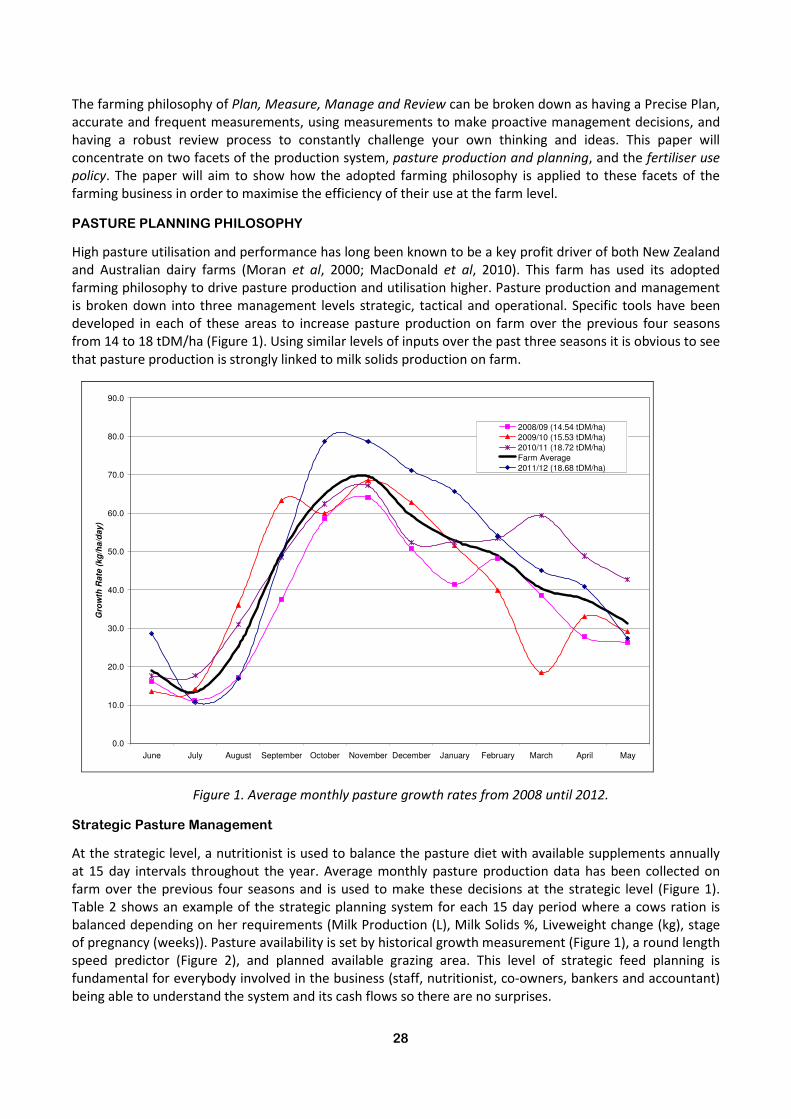
28
The farming philosophy of Plan, Measure, Manage and Review can be broken down as having a Precise Plan,
accurate and frequent measurements, using measurements to make proactive management decisions, and
having a robust review process to constantly challenge your own thinking and ideas. This paper will
concentrate on two facets of the production system, pasture production and planning, and the fertiliser use
policy. The paper will aim to show how the adopted farming philosophy is applied to these facets of the
farming business in order to maximise the efficiency of their use at the farm level.
PASTURE PLANNING PHILOSOPHY
High pasture utilisation and performance has long been known to be a key profit driver of both New Zealand
and Australian dairy farms (Moran et al, 2000; MacDonald et al, 2010). This farm has used its adopted
farming philosophy to drive pasture production and utilisation higher. Pasture production and management
is broken down into three management levels strategic, tactical and operational. Specific tools have been
developed in each of these areas to increase pasture production on farm over the previous four seasons
from 14 to 18 tDM/ha (Figure 1). Using similar levels of inputs over the past three seasons it is obvious to see
that pasture production is strongly linked to milk solids production on farm.
0.0
10.0
20.0
30.0
40.0
50.0
60.0
70.0
80.0
90.0
June July August September October November December January February March April May
Gro
wth
Ra
te (
kg
/ha
/da
y)
2008/09 (14.54 tDM/ha)2009/10 (15.53 tDM/ha)2010/11 (18.72 tDM/ha)Farm Average2011/12 (18.68 tDM/ha)
Figure 1. Average monthly pasture growth rates from 2008 until 2012.
Strategic Pasture Management
At the strategic level, a nutritionist is used to balance the pasture diet with available supplements annually
at 15 day intervals throughout the year. Average monthly pasture production data has been collected on
farm over the previous four seasons and is used to make these decisions at the strategic level (Figure 1).
Table 2 shows an example of the strategic planning system for each 15 day period where a cows ration is
balanced depending on her requirements (Milk Production (L), Milk Solids %, Liveweight change (kg), stage
of pregnancy (weeks)). Pasture availability is set by historical growth measurement (Figure 1), a round length
speed predictor (Figure 2), and planned available grazing area. This level of strategic feed planning is
fundamental for everybody involved in the business (staff, nutritionist, co-owners, bankers and accountant)
being able to understand the system and its cash flows so there are no surprises.

Table 2. Ration planner used to balance feed quantities and qualities with desired production parameters.
Ration
Utilised
% DM % NDF %
ME
(MJ/kgDM) CP %
RDP
(%/CP)
UDP
(%/CP) $/t
AsFed
(kg)
DM
(kg)
NDF
(kg)
ME
(MJ) CP (g)
RDP
(g)
UDP
(g) Cost ($)
Pasture 85% 100% 40% 12.0 23% 75% 25% 0 17 14.5 5.8 173.4 3324 2493 831 -$
Wheat 95% 88% 12% 12.7 11% 78% 28% 400 3 2.5 0.3 31.9 276 215 77 1.20$
Canola 95% 88% 20% 12.0 38% 65% 35% 560 0.5 0.4 0.1 5.0 159 103 56 0.28$
Pasture Silage 80% 35% 48% 10.5 14% 77% 23% 140 0 0.0 0.0 0.0 0 0 0 -$
Palm Kernal 90% 92% 33% 11.5 16% 70% 30% 250 0 0.0 0.0 0.0 0 0 0 -$
Straw 80% 88% 75% 6.0 40% 72% 28% 300 0.5 0.4 0.3 2.1 141 101 39 0.15$
21 17.7 6.4 212.4 3899 2912 1003 1.63$
6.6 221.6 3331 2615 717
-0.2 -9.2 568 297 286
Ration Data As Fed Data
Totals
Cow Req
Variance
Table 4. Applied fertiliser rates and products for corresponding individual paddock soil nutrient tests.
Olsen P QT K Fert Mix Nutrient Values Fert Type
<40 >10 Full maintenance P, No K 50 P,0 K 550kg/ha Super P (Mix A)
<50 >10 Half maintenance P, No K 25 P, 0 K 275kg/ha Super P (Mix B)
<40 <10 Full maintenance P, Full maintenance K 50 P, 50 K 550kg/ha Super P + 100kg/ha KCl (Mix C)
<50 <10 Half maintenance P, Full maintenance K 25 P, 50 K 275kg/ha Super P + 100kg/ha KCl (Mix D)
>50 <10 No P, Full maintenance K 0 P, 50 K 100kg/ha KCl (Mix E)
N/A N/A Heifer maintenance P, Heifer maintenance K 30 P, 35 K 330kg/ha Super P + 50kg/ha KCl (Mix F)
N/A N/A No Application 0 P, 0 K

30
y = 90
y = 0.375x - 15446y = 21
y = -0.84x + 34686.77
y =
x - 4
1335
y = 30
0
20
40
60
80
100
1/0
6/1
2
23/0
7/1
2
13/0
9/1
2
4/1
1/1
2
26/1
2/1
2
16/0
2/1
3
9/0
4/1
3
31/0
5/1
3
Date
Ro
tati
on
Len
gth
(D
ays)
Figure 2. Rotation length planner and corresponding formulas used to meet desired rotation lengths
Tactical and Operational Pasture Management
At the tactical level pasture is measured every week in every paddock using a Rapid pasture meter, this data
is used to make both tactical and operational decisions in accordance with the strategic feed plan. A feed
wedge is produced using collected data to identify paddocks to be grazed and operational grazing decisions
are made using a operational feed planning tool designed in Micorsoft Excel© that calculates kgDM/ha at
grazing from last known measurement, total daily offered/cow (kgDM) and rotation speed. The operational
feed planning tool is linked to data found in the feed wedge and allows the farm to maximize pasture and
supplement efficiency whilst not compromising on milk solids production.
FERTILISER PLANNING PHILOSOPHY
Fertiliser is one of a farms major farm operating expenses, however, fertiliser is often overused, under
utilised and applied by poorly calibrated equipment. For this reason it can also provide the biggest single
cost saving when a structured, systematic approach is followed. The following describes the fertiliser
philosophy used on farm to maximize the nutrient resource available whist achieving more sustainable
farming practices. Target values for macro nutrients P, K, S are well defined in literature in terms of Olsen P,
Quick Test K and Sulphate S for optimum pasture growth (NZFMRA, 2002). Farm target values have been set
around these to ensure nutrients aren’t being wasted (Table 3). Average farm soil test values for the past
three seasons are also given in Table 3.

31
Table 3. Average soil nutrient status values for the past three seasons including the farm target range and
critical optimum range for pasture growth to be maximised.
Optimum Range
(NZFMRA, 2002)
Farm Target Range
2009/10 2010/11 2011/12
Olsen P 30 40-50 62.4 70.0 70.8
Quick Test K 7-10 10 10.0 10.7 10.5
Sulphate S 10-12 12 11.0 12.6 10.6
pH 5.8-6.0 6.0 6.2 6.3 6.0
Farm average values do not allow for the spatial variation across the farm, therefore, individual paddock
testing is used and a decision support system has been developed to apply the right type and amount of
nutrients to each individual paddock. Figure 3 shows the spatial variation in Olsen P, Quick Test K, Sulphate S
and pH at the inception of the program in the 2009/10 season. Olsen P ranged from 32 to 110, Quick test K
from 5 to 20, Sulphate S from 6 to 18 and pH from 5.9 to 6.5. Seven different application types were used in
the developed fertiliser program (Table 4) to account for these variations.
In the 2010/11 season variation in nutrient distribution was reduced meaning only three application types
were used, in the 2011/12 season only two fertiliser mixes was used on the farm. Because of the lack of
Super Phosphate fertiliser now been applied to the farm Sulphate S levels have been reduced, therefore
Sulphur is now applied in with a May application of Urea to ensure pasture growth is not compromised over
the Winter/Spring period.
It has now also been decided to include a liming program following similar spatial principles to those
discussed above. Paddock application rates are now based on soils cation exchange capacity, base saturation
calcium as well as pH using the formula below (eq. 1). Calcium is seen as important as it facilities the uptake
of other nutrients into the plant and avoiding nutrient lockup.
Lime requirement (t/ha) = 26.2 - (4.4 x pH) + (0.07 x CEC) (eq. 1)
Targeted fertiliser application has lead to a significant reduction in costs but as table 5 indicates that has not
been to the detriment of pasture production with the $ Fert spent / T DM grown reducing year on year since
the inception of the program.

32
Figure 3. Spatial Variation in Olsen P (A), Quick Test K (B) Sulphate S (C) and the corresponding designed
fertilser plan for the 2008/09 season.
(A) (B)
(C) (D)

33
Table 4. Total area (ha) of different fertiliser mixes applied and associated direct costs per T DM grown.
Fert Type Previous Fert
program
2009/10 2010/11 2011/12
(Mix A) - 1.7 ha 7.6 ha -
(Mix B) - 1.6 ha - -
(Mix C) - 2.1 ha - 13.7 ha
(Mix D) - 2.0 ha - -
(Mix E) - 36.1 ha 35.6 ha 30.3 ha
(Mix F) 85.0 ha 21.9 ha 10.8 ha -
No Application - 19.6 ha 31.0 ha 41.0 ha
Fertiliser Cost $32,300 $9,692 $6,460 $4,271
T DM grown 1236 1320 1591 1588
$ Fert/T DM grown $26.13 $7.34 $4.06 $2.69
DISCUSSION AND CONCLUSIONS
This paper has presented two key themes around pasture and fertiliser utilisation on a working dairy farm
and how a simple philosophy (Plan, Measure, Manage and Review) has been adopted not only to increase
productivity but also reduce the environmental impact of the farming business. In essence the adopted
farming philosophy allows the farm to reduce the energy inputs required to produce products in the form of
milk and meat.
Some of the biggest challenges in the pasture utilisation program undertaken include predicting pasture
growth, in the future it is hoped that using existing data collected on farm (pasture growth, soil moisture,
soil nutrient status, sunshine hours and pasture species) an accurate model can be built that will allow for an
increase in accuracy of operational and tactical management decisions.
For the undertaken fertiliser program to become widespread within the agricultural industry improvements
in data recording, interpretation and transfer need to occur between the farm, advisor and agronomic level
allowing for spatially disturbed data to be taken into account.
In the future it is hoped that both pasture and fertiliser use programs as shown here can be adopted across
the wider industry enhancing the economic output of any dairy farming business.
REFERENCES
MacDonald, K.A. Glassey C.B. and Rawnsley, R.P. (2010) The emergence, development and effectiveness of
decision rules for pasture based dairy systems. Proceedings of the 4th Australasian Dairy Science Symposium
2010, 199.

34
www.westonmilling.com.au
Phone: 1800 112 118
Moran, J.B. G. R. Drysdale, D. A. Shambrook and N. K. Markham (2000) A Study of Key Profit Drivers in the
Victorian Dairy Industry. Asian-Aus. J. Anim. Sci. 13 Supplement July 2000, 54-57
NZFMRA (2002) The code of practice for fertiliser use - fertiliser practice. The New Zealand Fertiliser
Manufacturers' Research Association, Auckland, New Zealand, 1-24.

35
PASTURE MASTER – CASE STUDY 1 GLENCRAIG JERSEYS - FROM COBARGO TO BEMBOKA
STEVE SALWAY
Dairy farmer, Bemboka NSW
‘GLENCRAIG’ COBARGO, NSW
• Purchased the Jersey herd off Dad and Mum in June 2006;
• Herd purchased consisted of 110 cows; 65 young stock
• Commenced my dairy business on 1 July 2006;
• Milked off the home farm ‘Glencraig’; Cobargo is about 30 minutes north of Bega on the NSW
Sapphire Coast
‘GLENCRAIG’ SPECIFICATIONS
• Farm size - 160ha
• Effective milking area - 100 ha
• Rainfall - 800mm
• Irrigation - None
• Cows – average 130 up to 150
• Dairy – 8 unit walk through
• Feeding System – ad lib pellets through milking
THE CATALYST
• The home farm ‘Glencraig’ was part of the estate of my great grandfather and my grandfather had a
life interest in the farm;
• In September 2006 the loss of my grandfather caused the sale of the property and our move to
Bemboka.
‘FARMHILL’ BEMBOKA, NSW
• Commenced a lease dairy farm at Bemboka in February 2007; Bemboka is about 30 minutes west of
Bega on the NSW Sapphire Coast
‘FARMHILL’ SPECIFICATIONS
• Farm size – 197ha
• Effective Milking Area – 140ha
• Rainfall – 5 year average of less than 500mm
• Irrigation – 60ha bike shift
• Cows – 150 increasing to 300
• Dairy – 16 unit swing over with headlocks
• Feeding System – Cablevey with open trough
PRODUCING MILK
• Pasture based system with high amounts of pellets and introduced fodder;

36
• Herd Mix - 1/3 Holstein and 2/3 Jersey;
• Production – Jersey herd – 5,500 – 6,000 litres / cow / year
• Holsteins – 7,500 – 8,500 litres / cow / year
• Diet – 2 – 2.5 ton of pellets / cow / year combined with pasture, cereal hay and silage
PRODUCTION FOR THE ‘FARMHILL’ YEARS
2006 / 2007
• 1,028,550 Litres Produced
• 47,262.72 Kg Butterfat
• 35,971.23 Kg Protein
2007 / 2008
• 1,308,888 Litres Produced
• 60,286.43 Kg Butterfat
• 45,854.64 Kg Protein
2008 / 2009
• 1,388,709 Litres produced
• 66,047.92 Kg Butterfat
• 50,634.99 Kg Protein
2009/2010
• 1,519,020 Litres Produced
• 69,123.80 Kg Butterfat
• 54,335.60 Kg Protein
2010/2011
• 1,969,538 Litres Produced
• 86,766.45 Kg Butterfat
• 68,876.07 Kg Protein
FROM ‘FARMHILL’ TO ‘FAIRVIEW’
• July 2011 commenced leasing ‘Fairview’;
• January 2012 commenced milking at ‘Fairview’
37
ACCEPTING TECHNOLOGIES ON OUR DAIRY FARMS
NICOLAS LYONS AND RENÉ KOLBACH
The University of Sydney - FutureDairy project
MC Franklin Laboratory, Private Mailbag 4003,
Narellan, NSW 2567, Australia.
Technology has certainly arrived to stay. It has intertwined in our everyday life, from cars and microwaves, to
computers, internet and mobile phones. Denying its use makes no logic to any sensible person. On-farm
acceptance, introduction and adoption of technology is usually much slower, and lags behind other activities.
Examples include wireless weather stations linked to irrigation systems, tractors working with GPS trackers,
the whole new area of possibilities which becomes available through a simple thing such as the electronic
identification of cattle, in line milk quality monitor devices and last but not least automatic milking systems
including the recently introduced world’s first ‘robotic rotary’ (Automatic Milking Rotary; AMR™, DeLaval,
Tumba, Sweden) developed to be able to milk larger herds either in a voluntary or batch system.
Furthermore, it is nowadays more common to see ‘farming’ linked to words such as ‘precision’, ‘smart’, and
‘robotic’.
A trend of a decreasing number of dairy farms can be observed, with a relatively stable number of dairy
cows. At the same time improved genetics and management have resulted in a dramatic rise of the
production of the cows. Together with all this, the fact is that costs of production have escalated at a much
higher rate than milk price, therefore pushing the boundaries of profitability to a limit. As a result, farmers
need to adapt to this constant and dynamic activity if they are to remain competitive and maintain their
position in the industry. A drive for internal efficiency requires a change in the way farmers manage their
operation.
The use of different tools and applications, have allowed farmers to reduce time and labour issues, as well as
ensuring the consistency of tasks. It has also made the whole process of information management, decision
making and monitoring much quicker and more efficient, allowing farms to increase their overall
profitability.
Particularly within the dairy industry, there has been a growing adoption of technologies in the last couple of
years, to accommodate the increase in herd size, cow production, and labour constraints. According to the
2008 - 2009 ABARE report on technology and management practices within the Australian dairy industry, the
main technologies incorporated are; backing gates, vat cleaning systems, cup removers and teat sprays. It
also mentions that almost 90% of farms utilise a computer for financial reasons, whilst 65-70% of farms use
them for management of milking or breeding records.
Managing a dairy farm is a multitask activity, which requires the administration of a set of variables affecting
milk production, in aspects such as pasture management, feeding, milking, calf rearing, reproduction, health
management, labour and interaction with the society. The aim of the present work is to outline some tools
and/or applications that are already available, which address some of the main challenges farmers face
when managing their business. We believe most of them are quite applicable to a wide range of farmers,
who will hopefully identify with some of the issues they focus on. It is not about big, fancy, expensive tools,
but more about simple things that can create a big difference!

38
PASTURE MANAGEMENT
The Grains2Milk project and Dairy Australia have defined five main feeding systems utilised by Australian
dairy farmers, by classifying them according to pasture and supplement usage during the year. They range
from a System (1) with pastures, forages and up to 1 tonne of concentrate per cow per year, through to
System (5) with zero grazing, cows housed and fed a TMR ration. Grazed pastures are used by 98% of
farmers in Australia. Pasture and forage crops are the cheapest source of feed, and it is therefore of
paramount importance for farmers to manage them accordingly, in order to utilise a greater amount of
lower cost home grown feed. The use of tools that allow the user to measure, allocate and monitor pasture
(in conjunction with GPS’s), together with collation of KPI data , is increasing. Yet, according to the 2008 -
2009 ABARE report, less than 20% of farmers utilise computer systems to manage
pasture/cropping/irrigation/rotation records. Users are expected to see a great benefit in how they use their
cheapest source of feed by minimising wastage. But it is also about growing more feed (and utilising it
correctly). According to ABARE, only 57% of farmers conduct regular soil tests, and 80% of them use those
results to implement fertilising programs accordingly to grow more feed.
FEEDING MANAGEMENT
According to the “Performance profit and risk in pasture based dairy systems” report from Dairy Australia
2011, feed accounts for approximately 56% of the operating costs (with a range between 19 – 73%),
primarily related to supplements fed to cows. Feeding management therefore is deemed to have a severe
impact on farm profitability. Several options are available to manage this, which we believe can offer quite a
good amount of information, useful to assess current and future situations, manage feed stocks, targeting
high efficiency when feeding supplements. In this way farmers manage and control their feed, and see a real
economic benefit, that covers any initial software cost.
MILKING - HERD TESTING
Not everything is about quantity, but also about quality. Mastitis is probably the highest impact health issue
on dairy herds around the world. It not only causes an increase in somatic cells, which affect overall milk
quality, but has a negative effect on milk production, as well as costs associated with treatments, dumping
milk and culling. Overall it has a great cost and image impact on the dairy industry. Tools which could
potentially help farmers manage this ongoing battle would be welcome if proven effective. Time is an issue,
and any application able to speed up the detection of potential clinical cases, would result in a great benefit.
Simple things like milk pick up text message reports on your mobile phone, or available testers or counters,
which can help in the detection of mastitis. Most of the latter ones are based on milk conductivity which
changes even prior to the cow showing signs of clinical infection. Many farmers manage to use conductivity
meters to maintain milk quality within the limits required by the factory to ensure payment bonuses are
secured. In New Zealand for example, a joint venture between farmers, commercial companies, milk
industry and local vets, concluded in the development of a platform in which information is gathered
together from different sources, easily accessible for farmers, which make management and daily actions
more efficient.
ANIMAL MANAGEMENT
It was shown in a recent ABARE report, that 65-70% of the farms use computer management to run their
business. A substantial growth in, so called, ‘smart phones’ has been observed, by which it becomes easier
to access all the data on your PC, anywhere and at anytime. By installing remote ‘control programs’, it is
quick and easy to check cow data, feed rations and for example when using AMS, even control the system.
With these programs we become less dependent on the PC, as we do not have to be in the office to access
data. ‘Apps’ for Apple, Android, Windows and Blackberry devices have been developed for agriculture

39
purposes at very affordable prices. It is now easier to take notes while carrying out work, without having a
large number of papers lying around. Other innovations include weather stations connected to a sprinkler
system in a holding yard for example, whilst automating the sprinkler activation it can also alert the user to
this by phone.
LABOUR MANAGEMENT
While the trend of an increased farm operation size continues to take place, keeping and organising staff in
an efficient way becomes more and more challenging. The use of ‘note taking’ apps, increase the efficiency
of employees being able to observe a problem and take down a corresponding note, without having to rely
on paper or white boards. The ‘cloud’ technology even allows all these notes to be synchronised with PCs,
laptops, notepads and telephones connected to a main server. The same principle is used by ‘task killing’
apps. A manager is able to assign certain tasks to particular employees, which need to ‘tick’ the task when it
has being carried out. As internet becomes more accessible, the introduction of remote controlled IP
cameras also offer another tool in regards to supervising and controlling the farm, be it either animal or
people. Wherever you are you have the opportunity to, for example, keep an eye on the calving pad and
assist with any problems if necessary. More controlled working tasks and protocols could lead to a more
efficiently operated dairy farm. Technology increasingly creates opportunities for remote monitoring and
management of the dairying operation.
SOCIAL MEDIA AND AGRICULTURE
In addition to the tools discussed, we need to think about the applications/potentials the Web has created.
We have entered a new type of internet: “Web 2.0”. A Web 2.0 site allows users to interact and collaborate
with each other in a social media dialogue, in contrast to traditional websites where users are limited to the
passive viewing of content that was created for them. Web 2.0 sites include social networking sites, blogs,
wikis and video sharing sites. Social media has applications to dairy farmers. It has been described by
Wikipedia as: “the use of web-based and mobile technologies to turn communication into an interactive
dialogue”. To name a few interesting social media stats; Facebook has over 800 million active users, Twitter
over 380 million and LinkedIn 135 million, an average Facebook user has 130 “friends” and is connected to
80 community pages, groups and events, on average 250 million photo’s are uploaded per day on Facebook,
Barack Obama has 11.4 million followers on Twitter a and he has used this in his presidency campaign, a
billion Tweets are sent per day, 3 billion videos are watched per day and every minute 48 hours of videos are
uploaded on YouTube. If Facebook were a country it would be the world’s 3rd largest population AND 80%
of companies use social media for recruitment.
There is a great potential for the integration of social media on farms because it changes the way of
communication between organizations, communities and individuals.
The image of agriculture has been put to the test in several occasions. Recently the publicity around export
of live animals to Indonesia has had a bad influence on the image of agricultural businesses as has the recent
campaign on Animal Australia; “Demand animals not be treated as ‘waste products’.” These examples
remind us of how much pressure consumers can put on our industry. If we are not part of the solution then
maybe we are part of the problem. As an industry we have every ability to use social media to create the
positive perceptions to counterbalance the negative campaigns.
The Supermarket milk price wars escalated partly due to some very ‘clever’ use of social media by the
supermarkets. As voices of the industry we can continue to be price takers or we can create our own impact
through promotion of our industry, our products, home grown concepts, pasture to plate advantages and
the list goes on. Generate empathy so that people understand the true impact of our industry on Australia’s
economy and what the long term impact of that cheap bottle of milk might be. If we cannot generate a
better milk price ourselves, we should be smart enough to use the voice of the people to help us generate it.

40
Networking with people has never been easier! Social media is the way to get connected with people. It
allows you to follow politicians, board members, CEOs or any decision makers, to stay up-to-date with new
developments while communicating your ideas, thoughts and concerns to a wider audience. It has never
been easier to speak up and share your opinion or at the very least, hear other people’s opinions and the
responses of the decision makers.
The latest statistics published by ABARE, shows that the highest rates of participation in sharing knowledge
are in farmer discussion groups (49% of farms) and field days run by the private sector (42% farms). This
shows the large interest of farmers to share knowledge with colleagues. Social media can be a, THIRD more
interactive, possibility to share knowledge with each other and particularly with select groups of farmers
with a common system type or area of interest. Geographical distance is no longer a barrier to knowledge
sharing. Use social media to ask specific questions, follow colleague farmers and stay up-to-date with the
latest challenges and resolutions they face. It is easy to find related comments and discussions to specific
topics you’re seeking an answer for. Become a member on Facebook and follow companies sharing
knowledge and ideas with the world. Don’t limit your thinking to: “I don't dwell on Facebook or Twitter at all
because I just don't need to get into that area of someone's life. I've got so much going on in my own.... So
I'm looking for weather reports and market reports mostly (www.slideshare.net)” There is so much more
knowledge on the Web, free of charge, for us to use! Of course one has to be careful, filter the knowledge
that is shared and do your homework before you make radical changes to your business.
Even though it takes some time to use social media, “We don’t have a choice on whether we DO social
media, the question is how well we do it” (E. Quallman; www.socialnomics.net). We believe the same
happens with technology. As the saying goes, it is not the stronger one that will survive, it is the one that is
able to adapt. The opportunities are out there, with a whole range of tools and applications, which could
potentially be the next step in the dairy industry, making your ‘farming life’ easier.

41
LEAKY COWS, LEAKY SOILS, LEAKY WALLETS: CAN WE USE NUTRIENTS MORE EFFICIENTLY ON AUSTRALIAN DAIRY FARMS?
CAMERON GOURLEY
Future Farming Systems Research Division, Department of Primary Industries Victoria,
Ellinbank Centre, 1301 Hazeldean Rd, Ellinbank, Victoria 3821, Australia
The changing nature of Australian dairy operations, increasing fertiliser prices, and increasing pressure that
farm practices are minimizing environmental impacts, requires improved nutrient management practices.
Recent studies have found that most dairy farms are importing more nutrients than they export in products.
Nitrogen (n), phosphorus (p) and potassium (k) balances are positively correlated (p<0.001) with stocking
rate and milk production per ha. Many farms have already high soil fertility levels with likely limited
production gains from further fertiliser expenditure. Increasing cow numbers and a greater reliance on
imported feed, has resulted in high nutrient loads in specific areas across the farm. An essential starting point
is farm-scale assessments of nutrient balances and use efficiencies, as well as routine soil testing, to guide
fertiliser, effluent and manure applications. In the future, more sophisticated approaches will likely be
required which quantify nutrient flows through feed and manure; capture and store a greater proportion of
excreted manure; determine nutrient loading rates in areas across the farm; and ensure that fertiliser and
manure is applied under the most favorable soil and climatic conditions for optimum plant uptake. These
improved technologies and practices will assist in developing appropriate industry benchmarks for nutrient
balances and benefit both productivity and environmental outcomes.
INTRODUCTION
Dairy production in Australia has continued to intensify, as measured by the volume of milk per hectare.
While the number of dairy farms in Australia has declined by around 70% over the past 25 years, the average
farm herd size and milk production per cow have increased, with national cow numbers having stayed
roughly the same (Dairy Australia 2011). There is an ongoing trend for fewer, but larger, more capital
intensive operations, with increased stocking rates. Associated with these increases in intensity of
production is often a reliance on greater inputs of fertiliser and feed (Gourley et al. 2012; Weaver et al.
2008). For example, dairy farmers are using between 4 and 10 times the amount of N fertiliser compared
with what they did 20 years ago. Approximately 180,000 tonne of fertiliser N is applied to dairy pastures in
Australia annually; costing around $200m and equivalent to $30,000 per farm on average. The cost of
manufacturing fertilisers, principally associated with the cost of fossil fuels, is expected to rise substantially
in real terms in coming decades and consequently fertiliser decisions will become a larger part of dairy farm
operating costs.
Total N and P inputs onto dairy farms, mainly in the forms of feed, fertiliser and N fixation by legumes, are
usually much greater than the outputs of P and N in milk, animals, and crops (VandeHaar and St-Pierre
2006). These surpluses tend to increase as farms intensify and stocking rates increase. Excess P on dairy
farms can result in increasing soil P levels beyond agronomic requirements (Gourley 2010; Weaver and Reed,
1998), which may also increase the concentration of dissolved P in surface runoff (Sharpley 1995), and
leachate (Fortune et al., 2005). Unlike P, N is not significantly buffered by soils, and where N is applied in
high concentrations such as in dung, urine or fertiliser, losses through volatilization and leaching can be high
(Rotz et al., 2005).

42
The challenge of optimising the production potential and profitability of nutrient inputs in animal agriculture
while reducing negative environmental effects is faced by most industrialized countries (Steinfeld et al.
2006) including Australia. Animal agriculture is now commonly recognised as the dominant contributor of
nutrient inputs to water bodies because of its extensiveness (Department of Water 2010).
The purpose of this paper is to present recent information which has quantified the efficiency of nutrient use
on dairy farms in Australia and discuss ways to enhance the productivity and profitability of nutrient use
while at the same time reduce losses to the broader environment.
Nutrient balances and efficiencies in dairy production systems
Historically, agriculture largely depended on naturally available soil nutrients, nutrient recycling from animal
manure or biological-N fixation by legumes. Innovations in fertiliser manufacturing, declining fertiliser and
feed costs relative to other inputs such as labour and land, and the ability to transport agricultural inputs and
outputs cheaply and extensively has led to a spatial disconnect between nutrient flows required for livestock
production systems. Since the middle part of the 20th century, fertiliser use expanded greatly in Australia,
US, Europe and other parts of the industrialized world (Cordell et al. 2009). Expressed in today’s currency,
world fertiliser prices have declined by 20 to 50% since 1960.
In much of the industrialised world the conversion of
nutrients applied to pastures and crops into milk and
meat are often low and consequently N and P
application frequently exceeds requirements (Powell et
al. 2010; Weaver and Wong 2011). For example, a
national Australian study of nutrient use on dairy farms
(Gourley et al. 2012) found that whole-farm N surplus
(the difference between total nutrient imports and total
nutrient exports) ranged from 47 to 601 kg ha-1 yr-1 and
N use efficiency (the ratio of total nutrient exported in
product divided by total nutrient imported at the farm
scale) ranged from 14 to 50%. They also found a strong
correlation between total N imported and milk
production per ha (Fig. 1a) while N surplus was also
strongly related to milk production (Fig. 1b) with the
slope of this linear relationship (0.0121; SE = 0.0015)
providing an estimate of the productivity N surplus,
equivalent to 12.1 g N litre-1 milk produced. Similar
ranges in N surpluses and use efficiencies have been
reported on commercial dairy farms in Europe (Raison et
al. 2006; Fig. 1c) and also in New Zealand (Ledgard et al.
2004) and the USA (Hristov et al. 2006).
Figure 1. Relationships between milk production and (a)
whole-farm nitrogen inputs and (b) nitrogen surplus for
41 contrasting dairy farms across Australia, and (c)
average dairy nitrogen surpluses for dairy regions in
Western Europe. Unshaded symbols represent organic
dairy farms. Modified from Gourley et al. 2012.
a
y = 0.0121x + 61.361
R2 = 0.6317
0
100
200
300
400
500
600
N S
urp
lus (
kg/h
a)
b
N Inputs
(kg/h
a)
0
100
200
300
400
500
600
700y = 44.47x - 599.84
R2 = 0.8059
800
a
y = 0.0121x + 61.361
R2 = 0.6317
0
100
200
300
400
500
600
0 10000 20000 30000 400000 10000 20000 30000 40000
Milk Production (L/ha)
b
0
100
200
300
400
500
600
700y = 44.47x - 599.84
R2 = 0.8059y = 44.47x - 599.84
R2 = 0.8059
ScotlandBrittany
South England
Portugal
Galicia
Basque countryAquitaine
Pays de Loire
Ireland
Raison et al. 2009
0
100
200
300
400
500
600
N S
urp
lus (
kg/h
a)
0
100
200
300
400
500
600c
a
y = 0.0121x + 61.361
R2 = 0.6317
0
100
200
300
400
500
600
N S
urp
lus (
kg/h
a)
b
N Inputs
(kg/h
a)
0
100
200
300
400
500
600
700y = 44.47x - 599.84
R2 = 0.8059y = 44.47x - 599.84
R2 = 0.8059
800
a
y = 0.0121x + 61.361
R2 = 0.6317
0
100
200
300
400
500
600
0 10000 20000 30000 400000 10000 20000 30000 400000 10000 20000 30000 400000 10000 20000 30000 40000
Milk Production (L/ha)
b
0
100
200
300
400
500
600
700y = 44.47x - 599.84
R2 = 0.8059y = 44.47x - 599.84
R2 = 0.8059
ScotlandBrittany
South England
Portugal
Galicia
Basque countryAquitaine
Pays de Loire
Ireland
Raison et al. 2009
0
100
200
300
400
500
600
N S
urp
lus (
kg/h
a)
0
100
200
300
400
500
600c
A
B
C

43
Long-term fertiliser and manure applications have created P surpluses on soils used for dairy production
throughout many parts of the industrialised world, including Europe (Fanguerio et al. 2008; Tunney et al.
2007; Behrendt and Boekhold, 1994), the USA (Mekken et al., 2006; Ketterings et al., 2005) and New Zealand
(Monaghan et. al. 2008). In a recent analysis of P use in dairy, beef and sheep systems across Australia,
Weaver and Wong (2011) determined that median P use efficiency was 29%, 19% and 11% respectively, and
the systems were often characterized by positive P balance and P accumulation (Fig. 2). These authors also
noted a high degree of variation, with some farms having P use efficiencies of >100%, when inputs were low
or nil, and hence existing soil P reserves were utilised.
Figure 2. Phosphorus balance efficiency (outputs
divided by inputs at the farm scale) for sheep, beef,
dairy and cropping enterprises in Australia (adapted
from Weaver and Wong 2011).
Accumulation and distribution of nutrients on dairy farms
A positive P balance is beneficial when the soil is deficient in P and good agronomic efficiency of applied
fertiliser offsets low efficiency of use. Typically between 30 and 40% of fertiliser N and P applied to soil may
be utilised by pasture and crops. Whilst residual available soil P can be relatively low, over time soil P levels
increase beyond the point where agronomic responses occur.
The issue of nutrient accumulation in dairy soils was highlighted in the recent Accounting for Nutrients
project (Gourley et al. 2010). In this study, more than 2000 individual dairy paddocks were soil sampled
from 44 contrasting dairy farms across Australia, and additional information about the paddock use, distance
from the dairy shed and grazing intensity, collected.
While there was a large range in soil P and potassium (K) levels from grazed pasture paddocks (Olsen P levels
ranged between 3 and 189 mg/kg and the Colwell K levels ranged from 14 to 3400 mg/kg), only 20% of the
paddocks sampled had soil P or K values below the recommended agronomic optimum (Olsen P of 20 mg/kg
and Colwell K of 180 mg/kg), while 50% of the paddocks sampled were 1.5 times or more times the
recommended agronomic optimum (Figure 3).
min
ing
accu
mu
lating

44
At the high fertility end, 20% of paddocks sampled had Olsen P or Colwell K levels at least 3 times the
agronomic requirements. These results support recent assessments in Australia that suggest that excess
nutrients place considerable pressure on the environment in some agricultural systems, but conversely,
nutrient deficiencies may also be undermining crop productivity (OECD 2008). Soil testing to determine
available soil P (i.e. Olsen 1954; Colwell 1965) is therefore an important tool to manage P build-up and
maintenance.
Figure 3. The proportion (%) of
paddocks less than corresponding
Olsen P soil test level (Gourley et al.
2010) and recommended soil P target
(>2000 individual paddocks).
Nutrient accumulation can also be attributed to the high trophic level of grazing systems and the high
proportion of consumed nutrients excreted by grazing animals (Odum 1971), which is further exacerbated by
high stocking rates. In particular, dairy farms generally have high nutrient loading rates in specific parts of
the landscape, due to the management of animal movements through controlled grazing as well as
uncontrolled heterogeneous distribution of dung and urine by grazing animal (Aarons and Gourley 2011).
Consequently, land use and grazing management can have a substantial impact on soil fertility levels.
Gourley et al. (2010) found that areas with high animal densities, such as calving paddocks, feed pads,
holding area and sick paddocks, had substantially elevated soil nutrient levels when compared to the overall
pasture paddocks (Table 1). In contrast, low intensity areas such as ‘other animal’ and treed areas had much
lower fertility levels.
Table 1. Mean soil pH, available P, levels of different land uses from 40 dairy farms.
Management/Use Distance to dairy (m) pH (CaCl2) Olsen P (mg/kg) Colwell P (mg/kg)
Pasture n=1773 881.4 5.3 (0.7) 35.6 (20) 127 (76)
Bull paddock n=6 444.0 5.3 (0.9) 48.8 (26) 169 (82)
Feeding areas n=12 53.1 6.8 (1.2) 319.9 (285) 1151 (1286)
Holding area n=13 400.4 5.8 (0.9) 143.5 (171) 510 (685)
Sick paddock n=16 46.9 5.6 (0.9) 71.4 (61) 280 (282)
Other animal n=104 na 5.1 (0.6) 27.4 (15) 100 (58)
* n= number of paddock areas sampled ^ Standard Deviation in parenthesis
Olsen P soil test level (mg/kg)
Recommended soil P level
Olsen P soil test level (mg/kg)Olsen P soil test level (mg/kg)
Recommended soil P level

45
Production gains from fertiliser inputs
With further anticipated increases in fertiliser prices, continued over application of N, P and K fertilisers may
challenge the on-going profitability and sustainability of many dairy farm businesses. Recent research in
Australia, including the ‘Greener Pastures’ project in WA (Staines et al. 2012), and Accounting for Nutrients
project (Gourley et al. 2012) have demonstrated that the efficiency of nutrient use from fertiliser
applications is variable and often low. For example, Staines et al. (2012) reported that half the dairy farmers
in WA were using more N than the agronomic optimum.
Gourley et al. (2012) investigated the relationship between N, P and K fertiliser inputs and milk production
from home-grown pasture on 41 commercial dairy farms nationally (Figure 4). While they found that milk
production from home-grown feed increased with increasing N fertiliser input, there was a high variation
and uncertainty around milk production gains (Fig. 4a), suggesting substantial improvements in N fertiliser
responses could be achieved on many farms. The relationship improved slightly when additional N from the
fixation of atmospheric nitrogen by pasture legumes was included (Fig. 4b).
In contrast there was no relationship between P and K fertiliser applications and milk production attributed
to home-grown feed (Fig. 4c and d). The lack of a defined relationship between P and K fertiliser inputs and
productivity is supported by the generally high levels of soil P and K measured. Under these high soil P and K
conditions, additional pasture and crop production from the application of P and K fertiliser would not be
expected and therefore neither would an associated increase in milk production from home grown feed.
Moreover, the milk production from farms with low or no P or K fertiliser inputs but with adequate levels of
soil P or K, suggest that these soil reserves can be utilized without a resulting decline in milk production.
Figure 4. Relationships between milk production from home-grown feed and (a) N fertiliser input, (b) N
fertiliser plus N fixation, (c) P fertiliser input and (d) K fertiliser input. Open symbols represent the organic
dairy farms. Modified from Gourley et al. 2012.
y = 0.0128x + 22.59
R2= 0.30
0
100
200
300
400
500
600
700
N F
ert
ilis
er
(kg
/ha)
y = 0.0138x + 50.41
R2= 0.37
0
100
200
300
400
500
600
700
N F
ert
ilis
er
an
d f
ixa
tio
n (
kg
/ha)
a b
0
60
80
0
20
40
100
120
140
160
180
0 5000 10000 15000 20000
Milk Production from Home Grown Feed (l/ha)
K F
ert
ilis
er
(kg
/ha
)
-10
10
20
30
40
50
60
70
80
90
0 5000 10000 15000 20000
Milk Production from Home Grown Feed (l/ha)
P F
ert
ilis
er
(kg
/ha
) c d
y = 0.0128x + 22.59
R2= 0.30
0
100
200
300
400
500
600
700
y = 0.0128x + 22.59
R2= 0.30
0
100
200
300
400
500
600
700
N F
ert
ilis
er
(kg
/ha)
y = 0.0138x + 50.41
R2= 0.37
0
100
200
300
400
500
600
700
y = 0.0138x + 50.41
R2= 0.37
0
100
200
300
400
500
600
700
N F
ert
ilis
er
an
d f
ixa
tio
n (
kg
/ha)
a b
0
60
80
0
20
40
100
120
140
160
180
0 5000 10000 15000 20000
Milk Production from Home Grown Feed (l/ha)
K F
ert
ilis
er
(kg
/ha
)
-10
10
20
30
40
50
60
70
80
90
0 5000 10000 15000 20000
Milk Production from Home Grown Feed (l/ha)
P F
ert
ilis
er
(kg
/ha
) c d
00
60
80
0
20
40
100
120
140
160
180
0 5000 10000 15000 20000
Milk Production from Home Grown Feed (l/ha)
K F
ert
ilis
er
(kg
/ha
)
-10
10
20
30
40
50
60
70
80
90
0 5000 10000 15000 20000
Milk Production from Home Grown Feed (l/ha)
P F
ert
ilis
er
(kg
/ha
) c d
60
80
0
20
40
100
120
140
160
180
0 5000 10000 15000 20000
Milk Production from Home Grown Feed (l/ha)
K F
ert
ilis
er
(kg
/ha
)
-10
10
20
30
40
50
60
70
80
90
0 5000 10000 15000 20000
Milk Production from Home Grown Feed (l/ha)
P F
ert
ilis
er
(kg
/ha
) c d
0
20
40
100
120
140
160
180
0 5000 10000 15000 20000
Milk Production from Home Grown Feed (l/ha)
K F
ert
ilis
er
(kg
/ha
)
-10
10
20
30
40
50
60
70
80
90
0 5000 10000 15000 20000
Milk Production from Home Grown Feed (l/ha)
P F
ert
ilis
er
(kg
/ha
) c d

46
Opportunities to increase the efficiency and profitability of nutrient use
The current efficiency of nutrient use determined on Australian dairy farms suggests that there are
substantial opportunities for improvement, which can enhance production and profitability, and reduce
nutrient losses to the broader environment. While there are stronger regulatory drivers for reduced nutrient
losses from dairy farms in Europe and the USA than in Australia (Gourley and Weaver 2012), recommended
intervention strategies used overseas should also improve nutrient use efficiency on Australian dairy farms.
These key management strategies within the major components of nutrient cycles (Fig. 5) include: a
reduction in, or more strategic use of inorganic fertilisers, optimizing the use of home-produced manure,
reduced grazing time and lowering nutrient concentrations in the ration (Oenema et al. 2011). These
strategies have resulted in substantial reductions in N and P surpluses and increases in use efficiencies on
dairy farms in the Netherlands (Groot et al. 2006), Flanders (Nevens et al. 2006), South-west England (Cherry
et al. 2011), Northern Portugal (Fangueiro et. al. 2008) as well as contrasting dairy systems in the USA
(Jonker et al. 2002; Kohn et al. 1997).
Improving fertiliser decisions
Currently many dairy farmers use excessive fertiliser nutrients because they, and their advisors, make
decisions on average and not marginal responses, do not know enough about the uncertainty in pasture
response functions and at best do superficial analysis of the likely economic benefits. This approach and an
insurance mentality of ‘more just to make sure’ creates incentives for excessive fertiliser use.
The potential milk production benefits of applying P, K and S fertilisers should be strongly scrutinised as
limited milk production gains are likely from further fertiliser inputs when soil P, K and S levels are already
high (Gourley et al. 2010; Gourley et al. 2012). A strategic soil sampling approach should be used to monitor
soil P, K and S reserves and when above agronomic requirements, these may be utilised for a period of time
without a resulting decline in milk production.
Figure 5. Components of nutrient cycling within dairy farms and key points of intervention to increase the
efficiency of nutrient use.
Manure capture: Milking, housing,feeding systems
Nitrogentransformation
inhibitors
Optimum soil conditionsto reduce nutrient loss
Rates, timing and placement of fertilisers & effluent
Dairy
cows
ManurePasture / crops
Soil
RunoffGaseousLeaching Soil accumulation
Milk
Crop and pastureselection
Manure deposition: non- collected,
non-productive areasHigh fertility areas
Lower minerals in feed supplementDiet additives and manipulation
Animal Selection
Reduce inputs
Modified fertilisers
Manure capture: Milking, housing,feeding systems
Nitrogentransformation
inhibitors
Optimum soil conditionsto reduce nutrient loss
Rates, timing and placement of fertilisers & effluent
Dairy
cows
ManurePasture / crops
Soil
RunoffGaseousLeaching Soil accumulation
Milk
Crop and pastureselection
Manure deposition: non- collected,
non-productive areasHigh fertility areas
Lower minerals in feed supplementDiet additives and manipulation
Animal Selection
Reduce inputsReduce inputs
Modified fertilisers

47
Increasing complexity in dairy farm businesses makes more informed decisions about N fertiliser applications
essential. There is a need to move from generalized average and linear predictions of pasture production
responses (e.g. 10 kg DM / kg N applied on average, or, 1 kg N/ha/day of grazing) to advice that is profit-
based and tailored to the system/farm business taking into account the climate and management conditions
under which a farm operates (MacKenzie et. al. 2003a,b). This is particularly the case with N fertiliser where
the benefits are determined by important interactions between parts of the farm system (e.g. feed
production, stock policies and feed utilisation).
Improving dietary intake
Balancing nutrient intakes and reducing the concentration of excreted nutrients may be more difficult on
grazing-based dairy farms, particularly when pasture comprises the majority of the diet. Nutrient intakes in
pasture can vary significantly between farms and seasons, and excess levels of dietary N, P and K intake are
common, particularly during spring (Jacobs and Rigby 1999). This is further exacerbated with regular use of
fertilisers and the application of dairy effluent. McKenzie et al. (2003c) found in Victorian dairy pastures that
increasing rates of N fertiliser consistently elevated whole sward crude protein content, with this effect still
evident three months after the last N application. Better balanced diets can be manipulated through
improved selections of imported feeds. For example, the use of by-products such as brewer’s grain has the
potential to increase nutrient concentrations in the diet, while in contrast, the use of concentrates and
cereal and maize silage presents opportunities to better balance energy and crude protein levels in dairy
feeds.
Improving manure distribution
As a result of the common practice of year-round grazing, a much smaller proportion of dairy manure is
usually collected in Australia than from housing systems overseas (Gourley et al. 2011) and generally from
concreted areas such as the dairy shed, holding yards and feed pads. Collected manure in grazing based
systems is more frequently applied to readily accessible paddocks adjacent to the holding dams (Gourley et
al. 2007). As cow numbers and reliance on feeding systems increase, continued poor redistribution of
collected and uncollected manure has the potential to result in greater nutrient loads and nutrient losses in
the future. Consequently, further investment in collection, storage and redistribution systems may be
required to overcome current and future inefficiencies in the recycling of manure nutrients.
CONCLUSIONS AND RECOMMENDATIONS
• Flows of nutrients into water and the air are an inevitable consequence of dairy production. If current
nutrient management practices persist and dairy farms continue to intensify, nutrient surpluses are
likely to further increase with greater nutrient losses to the broader environment.
• Nutrient use efficiency in dairy production is limited by the biological potential of cows to transform
feed nutrients into milk and of crops and pastures to convert applied nutrients into forage and other
agronomic products.
• The overall industry estimate of whole-farm N use efficiency (the proportion of imported N exported in
product) is 26%, with around 12 g of N lost to the broader environment for each litre of Australian milk
produced. Whole-farm N surplus is strongly linked to milk production per ha, and is comparable to
similar systems in other industrialised dairy industries such as New Zealand, the EU and USA.
• Key indicators of elevated soil P and K fertility are overall stocking rate and milk production per ha.
These indicators reflect the intensity of the dairy operation and likely higher amounts of nutrients
imported in feed and fertiliser.

48
• Within farm soil nutrient heterogeneity is substantial, irrespective of the intensity of the dairy
operation. Higher soil nutrient levels of P, K (and N) are driven by paddock stocking density, proximity
to the dairy, frequency of effluent applications, and feeding strategies.
• High nutrient loading from the deposition of animal excreta is a key driver of elevated soil nutrient
levels. Paddocks with high densities of animals per ha can have high nutrient accumulation while those
infrequently visited and with low stock densities will generally have lower soil nutrient levels.
• There are opportunities on many dairy farms to reduce or exclude fertiliser inputs in the short to
medium term. The relatively small costs associated with a strategic and on-going soil sampling program
are likely to be returned many times through the potential savings in unnecessary fertiliser
expenditure. Where applications are warranted, appropriate rates and blends of fertiliser should
ensure profitable increases in pasture and crop productivity.
• In the future, more sophisticated approaches will likely be required which quantify nutrient flows
through the continuum of feed, milk production and manure; increases the capture and store of
excreted manure; determines nutrient loading rates in areas across the farm; and ensures that
fertiliser and manure are applied under favorable soil and climatic conditions for optimum plant
uptake.
ACKNOWLEDGEMENTS
Financial support for these associated studies was provided by the Department of Primary Industries Victoria
(MIS project 06854), Dairy Australia, Meat and Livestock Australia, Incitec-Pivot Limited, Megafert and
Impact Fertilisers, Land and Water Australia, and other State Agriculture Departments. I wish to
acknowledge the large number of agency staff who have assisted during these projects and in particular, the
many dairy farmers who have contributed considerable time and effort when providing farm information.
Thanks also to David Weaver for the provision of data and input into the manuscript.
REFERENCES
Aarons SR, Gourley CJP (2011) The role of riparian buffer management in reducing off-site impacts from
grazed dairy systems. Renewable Agriculture and Food Systems. In press doi:10.1017/S1742170511000548
Behrendt H, Boekhold A (1994) Phosphorus saturation in soils and ground waters. Land Degradation and
Rehabilitation, 4, 233-243
Cherry K, Mooney SJ, Ramsden S, Shepherd MA (2011) Using field and farm nitrogen budgets to assess the
effectiveness of actions mitigating N loss to water. Agriculture, Ecosystems and Environment. In Press
Colwell JD (1965) An automatic procedure for the determination of phosphorus in sodium hydrogen
carbonate extracts of soil. Chem Ind 13: 893-895.
Cordell D, Drangert JO, White S (2009) The story of phosphorus: Global food security and food for thought.
Global Environmental Change, 19, 292-305
Dairy Australia (2011) ‘The Australian dairy industry in focus’. http://www.dairyaustralia.com.au/Statistics-
and-markets/Dairy-Situation-and-Outlook-September-2011.aspx (verified 04 November 2011)
Department of Water (2010) Vasse Wonnerup Wetland and Geographe Bay Water Quality Improvement
Plan. Department of Water, Western Australia, March 2010.
http://www.water.wa.gov.au/PublicationStore/first/92284.pdf, accessed 13th Dec 2011.
Fangueiro D, Pereira J, Coutinho J, Moreira N, Trindade H (2008) NPK farm-gate nutrient balances in dairy
farms from Northwest Portugal. European Journal of Agronomy 28, 625-634.

49
Fortune S, Lu J, Addiscott TM, Brookes PC (2005) Assessment of phosphorus leaching losses from arable land.
Plant and Soil 269, 99-108.
Gourley CJP, Powell JM, Dougherty WJ, Weaver DM (2007) Nutrient budgeting as an approach for improving
nutrient management on Australian dairy farms. Australian Journal of Experimental Agriculture 47, 1064-
1074.
Gourley CJP, Aarons S, Hannah M, Dougherty W (2010) Soil nutrient concentrations and variations on dairy
farms in Australia. 19th World Congress of Soil Science, Soil Solutions for a Changing World 1 – 6 August
2010, Brisbane, Australia. http://www.iuss.org/19th%20WCSS/Symposium/pdf/2161.pdf. (Accessed 1
August 2011)
Gourley CJP, Aarons SR and Powell JM (2011) Nitrogen use efficiency and manure management in
contrasting dairy production systems. Agriculture Ecosystem and Environment.
(doi:10.1016/j.agee.2011.05.011)
Gourley CJP, Dougherty W, Weaver DM, Aarons S, Awty IM, Gibson DM, Hannah MC, Smith AP and Peverill
KI (2012) Farm-scale nitrogen, phosphorus, potassium and sulphur balances and use efficiencies on
Australian dairy farms. Animal Production Science (In Press).
Gourley CJP and Weaver DM (2012) Policy approaches and difficult choices to reduce nutrient losses from
grazing systems in Australia. Crop and Pasture Science (In Press).
Groot JC, Rossing WAH, Lantinga EA (2006) Evolution of farm management, nitrogen efficiency and
economic performance on Dutch dairy farms reducing external inputs. Livestock Science 100, 99-110.
Hristov AN, Hazen W, Ellsworth JW (2006) Efficiency of use of imported nitrogen, phosphorus and potassium
and potential for reducing phosphorus imports on Idaho dairy farms. Journal of Dairy Science 89, 3702-3712.
Jacobs JL, Rigby SE (1999) Minerals in dairy pastures in Victoria. Department of Natural Resources and
Environment, Melbourne, Australia.
Jonker JS, Kohn RA, High J (2002) Dairy herd management practices that impact nitrogen utilization
efficiency. Journal of Dairy Science 85, 1218-1226.
Ketterings QM, Kahabka JE, Reid WS (2005) Trends in phosphorus fertility of New York agricultural land.
Journal of Soil and Water Conservation 60: 10-20.
Kohn RA, Dou Z, Ferguson JD, Boston RC (1997) A sensitivity analysis of nitrogen losses from dairy farms.
Journal of Environmental Management 50,417-428.
Ledgard SF, Journeaux PR, Furness H, Petch RA, Wheeler DM (2004) Use of nutrient budgeting and
management options for increasing nutrient use efficiency and reducing environmental emissions from New
Zealand farms. OECD Expert meeting on farm management indicators and the environment. Session 5. 8-12
March 2004 (Palmerston North, New Zealand)
McKenzie FR, Jacobs JL, Riffkin P, Kearney G, McCaskill M (2003a) Long-term effects of multiple applications
of nitrogen fertiliser on grazed dryland perennial ryegrass/white clover dairy pastures in south-west Victoria.
1. Nitrogen fixation by white clover. Australian Journal of Agricultural Research 54, 461-469.
McKenzie FR, Jacobs JL, Kearney G (2003b) Long-term effects of multiple applications of nitrogen fertiliser on
grazed dryland perennial ryegrass/white clover dairy pastures in south-west Victoria. 2. Growth rates, dry
matter consumed, and nitrogen response efficiencies. Australian Journal of Agricultural Research 54, 471-
476.
McKenzie FR, Jacobs JL, Kearney G, (2003c) Long-term effects of multiple applications of nitrogen fertiliser
on grazed dryland perennial ryegrass/white clover dairy pastures in south-west Victoria. 3. Botanical
composition, nutritive characteristics, mineral content, and nutrient selection. Australian Journal of
Agricultural Research 54, 477 – 485.

50
Mekken JC, Swink SN, Ketterings QM (2006) Statewide and county-based phosphorus balances for New York
State. First Release. Department of Crop and Soil Sciences Extension Series E06-3. Cornell University, Ithaca
NY. 126 pages. [On-line] (http://nmsp.css.cornell.edu/).
Monaghan RM, de Klein CAM and Muirhead RW (2008) Prioritisation of farm scale remediation efforts for
reducing losses of nutrients and faecal indicator organisms to waterways: A case study of New Zealand dairy
farming. Journal of Environmental Management,87: 609-622.
Nevens F, Verbruggen I, Reheul D, Hofman G (2006) Farm gate nitrogen surpluses and nitrogen use efficiency
of specialized dairy farms in Flanders: evolution and future goals. Agricultural Systems 82, 142-155
Odum HT (1971) Environment, Power, and Society. Wiley-Interscience New York, N.Y.
OECD (2008) Environmental performance of agriculture in OECD countries since 1990, Paris, France,
www.oecd.org/tad/env/ indicators (verified 25th November 2011).
Oenema J, van Keulen H, Schils RLM Aarts HFM (2011) Participatory farm management adaptations to
reduce environmental impact on commercial pilot dairy farms in the Netherlands. NJAS Wageningen Journal
of Life Sciences 58, 39 - 48.
Olsen SR, Cole CV, Watanabe F, Dean LA (1954) Estimation of available phosphorus in soils by extraction with
sodium bicarbonate. U.S.D.A. Circular No. 939, 19pp.
Powell JM, Gourley CJP, Rotz CA, Weaver DM (2010) Nitrogen Use Efficiency: A Measurable Performance
Indicator for Dairy Farms. Environmental Science and Policy 13, 217- 228
Raison C, Pflimlin A, Le Gall A (2006) Optimisation of environmental practices in a network of dairy farms of
the Atlantic Area. Institut de l’Elevage, France.
Rotz CA, Taube F, Russelle MP, Oenema J, Sanderson MA, Wachendorf M (2005) Whole-farm perspectives of
nutrient flows in grassland agriculture. Crop Science 23, 2139-2159.
Satter L (2001) Nutrient management in dairy production systems. In ‘Nutrient Management Challenge in
Livestock and Poultry Operations: International and National Perspectives’. pp 38-53. Babcock Institute 3rd
Technical Workshop. (Madison Wisconsin).
Schroder JJ, Aarts HFM, ten Berge HFM, van Keulen H, Neeteson JJ (2003) An evaluation of whole-farm
nitrogen balances and related indices for efficient nitrogen use. European Journal of Agronomy 20, 33-44.
Sharpley AN (1995) Dependence of runoff phosphorus on Extractable Soil Phosphorus. Journal of
Environmental Quality, 24, 920-926
Staines M, Morris R, Bolland M, Bennett D, Casson T, Fillery I, Lucey J, Russell B (2011) Greener Pastures:
Profitable and sustainable use of nitrogen in dairy grazing systems. Final Report to Dairy Australia, Project
DAW12101. December 2011.
Steinfeld H, Gerber P, Wassenaar T, Castel V, Rosales M & de Haan C (2006) Livestock’s long shadow:
environmental issues and options. Food and Agriculture Organisation, Rome.
Tunney H, Breeuwsma A, Withers PJA, Ehlert PAI (2007). Phosphorus fertiliser strategies: past, present and
future. IN: Phosphorus losses from soil to water, H Tunney. OT carton, PC Brookes, AE Johnson (eds), C.A.B.
Wallingsford, UK. 358 – 361.
VandeHaar MJ, St-Pierre N (2006) Major advances in nutrition: relevance to the sustainability of the dairy
industry. Journal of Dairy Science 89, 1280-1291.
Weaver DM, Neville SN, Ovens R, Keipert N, Summers RN, Clarke MF (2008) Farm gate nutrient balances in
south west Western Australia – understanding nutrient loss risk within agricultural landuses. 12th
International Conference on Integrated Diffuse Pollution Management (IWA DIPCON 2008). Khon Kaen
University, Thailand; 25-29 August 2008.

51
Weaver DM, Reed AEG (1998) Patterns of nutrient status and fertiliser practice on soils of the south coast of
Western Australia. Agriculture, Ecosystems and Environment 67, 37-53.
Weaver DM, Wong MTF (2011) Scope to improve phosphorus (P) management and balance efficiency of
crop and pasture soils with contrasting P status and buffering indices. Plant and Soil, 349, 37-54.

52
HOW COMPLEMENTARY FORAGE SYSTEMS CAN HELP FARMERS TO REDUCE ‘WASTAGE’ AND INCREASE PRODUCTIVITY
SERGIO (YANI) GARCIA AND RAFIQ ISLAM
University of Sydney, Faculty of Veterinary Science
Camden NSW
Email: [email protected], [email protected]
Complementary forage systems (CFS) are a combination of crop rotations and pasture designed to increase,
directly or indirectly, milk production from home-grown feed. Complementary forage systems can be
implemented in many different ways according to individual farms’ needs. The principles behind CFS have
been developed and tested by FutureDairy 1 and 2 over the last 7 years. They can be used in an integrated
way to achieve maximum productivity benefits or individually to help farmers with specific feedbase related
challenges. This paper summarises how the principles and application of the CFS concept can help dairy
farmers save time and money, by increasing productivity efficiency and reducing wastage.
INTRODUCTION
Complementary forage systems (CFS) are any combination of pasture and planned (complementary) forage
crop rotations (CFR) designed to increase the amount of feed grown on farm and, from this, productivity
(Farina et al., 2011).
The term CFR refers to any planned forage crop rotation (double or triple crop, grazable, harvestable or a
mix of both, etc.). The common factor of all CFR’s options is that they can potentially achieve a much higher
forage production than pasture alone (Garcia et al., 2008). However, the actual impact of CFR on the whole
system (CFS) will depend on the particular combination of CFR and pasture areas. This in turn, depends on
individual situation and needs of each farm.
The potential impact of a CFS (see Figure 1) includes increased forage production, more milk from
home-grown feed, improved nutrient efficiency and risk management.
The concept, principles, knowledge and
information developed by FutureDairy
(feedbase) can help Australian farmers to
reduce ‘wastage’ and increase production
efficiency. Key ways in which this can occur
are through saving of time, nutrients, grain,
risk and money.
Figure 1: A combination of CFR and
pasture areas can increase total home
grown feed and milk production, reducing risk exposure to grain
prices and increasing effiency of nutrient
use.
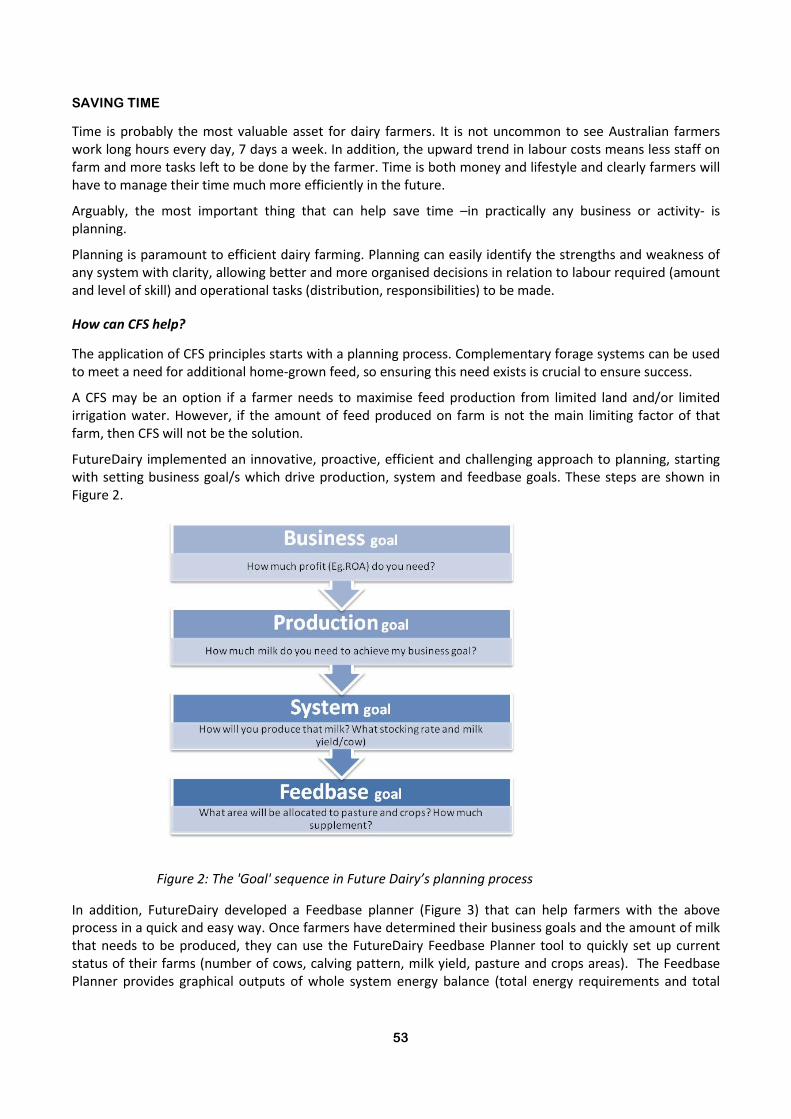
53
SAVING TIME
Time is probably the most valuable asset for dairy farmers. It is not uncommon to see Australian farmers
work long hours every day, 7 days a week. In addition, the upward trend in labour costs means less staff on
farm and more tasks left to be done by the farmer. Time is both money and lifestyle and clearly farmers will
have to manage their time much more efficiently in the future.
Arguably, the most important thing that can help save time –in practically any business or activity- is
planning.
Planning is paramount to efficient dairy farming. Planning can easily identify the strengths and weakness of
any system with clarity, allowing better and more organised decisions in relation to labour required (amount
and level of skill) and operational tasks (distribution, responsibilities) to be made.
How can CFS help?
The application of CFS principles starts with a planning process. Complementary forage systems can be used
to meet a need for additional home-grown feed, so ensuring this need exists is crucial to ensure success.
A CFS may be an option if a farmer needs to maximise feed production from limited land and/or limited
irrigation water. However, if the amount of feed produced on farm is not the main limiting factor of that
farm, then CFS will not be the solution.
FutureDairy implemented an innovative, proactive, efficient and challenging approach to planning, starting
with setting business goal/s which drive production, system and feedbase goals. These steps are shown in
Figure 2.
Figure 2: The 'Goal' sequence in Future Dairy’s planning process
In addition, FutureDairy developed a Feedbase planner (Figure 3) that can help farmers with the above
process in a quick and easy way. Once farmers have determined their business goals and the amount of milk
that needs to be produced, they can use the FutureDairy Feedbase Planner tool to quickly set up current
status of their farms (number of cows, calving pattern, milk yield, pasture and crops areas). The Feedbase
Planner provides graphical outputs of whole system energy balance (total energy requirements and total

54
energy offered by each forage and supplement source). Users can easily change area of crops and pasture,
or type and amount of supplements to correct energy balance (see examples in Figures 4 and 5).
Figure 3: FutureDairy's Feedbase Planner interface
Figure 4: Feedbase Planner showing a deficit of energy (gap between the 2 lines) from April to October

55
Figure 5: Feedbase Planner showing adequate whole system energy balance after including
supplementation with maize silage from CFR area
SAVING MONEY
1. By increasing efficiency of key inputs
Water (W) and nitrogen (N) are quantitatively the two most important limiting factors of forage production.
In the future, the cost of irrigation W is expected to increase due to decreased availability of W. This is
consequence of new government policies (e.g. Murray –Darling basin plan) and competition with other
activities (other agricultural activities, urbanisation and mining). Similarly, the cost of urea is expected to
increase in the future in line with increased cost of fossil-derived energy.
How can CFS help?
Complementary forage systems can substantially increase efficiency of W and N use compared to typical
pasture systems. FutureDairy’s work has demonstrated that similar amounts of W and N are required to
maximise yield of crops or pasture. As a triple crop forage rotation can yield twice as much as a well
managed pasture the efficiency of nutrient use also doubles (Garcia et al. 2008) (Figure 6).

56
Figure 6: Irrigation water (left) and nitrogen use efficiency of CFR (dark bars) and
pasture systems (Garcia et al 2008)
The above-mentioned work was carried out with no limitation of W and N. More recent work by FutureDairy
has been conducted to fine tune water use efficiency (WUE) and nitrogen use efficiency (NUE). This involved
a whole range of N for triple crop forage rotations all under 4 different irrigation regimes. This study showed
that:
• WUE decreases as irrigation increases and NUE decreases as N fertiliser rate increases.
• However, there is strong synergic effect between W and N (ie, NUE increases with irrigation and
WUE increases with N rate)
• Full irrigation increased NUE by at least ~30% compared to no irrigation. The effect of irrigation on
NUE increased as N rate increased. However, the maximum marginal increment in NUE due to
irrigation occurred at moderate-high (~400 kgN/ha) rather than maximum levels of N input
(Figure 7).
• Similarly, the increase in WUE due to N level was higher at 66% of irrigation in comparison to 100%
irrigation treatment.
Thus, these results indicate that significant gains in both WUE and NUE can be obtained by using moderate-
high levels of nutrients rather than maximum levels. Clearly, optimisation of nutrient use will be key to
efficiency gain in the future.
Figure 7: Relationship between N input
(kg/ha) and increment of NUE due to
irrigation (% over control with no
irrigation). Moderate-high levels of N
(~400 kg/ha) maximised effect of
irrigation on NUE (kg DM/kg N)

57
2. By producing more milk from home grown feed
Energy-based concentrates are typically the single most expensive cost of producing milk in Australia. Cost of
concentrate fluctuates with cost of cereal grains, which in turn depends on both external (international
market) and internal (e.g. seasonal conditions) factors. Australian dairy farms use an average of ~1.7 t
concentrate/cow (~30-35% of total dietary requirements).
The cost of concentrates is expected to rise in the future. This is mainly due to pressures on land availability
to grow grains coupled with increased demand of grain for feed and fuel usages. In addition to the cost, the
use of grain to produce animal protein will be increasingly questioned in the future. This is because grains
are edible feed and therefore can be consumed directly by humans; and animal protein, at least ruminant
animal protein, can be produced efficiently from non-edible feeds (forages) (Wilkinson, 2011).
Thus reducing farms’ dependence on concentrate and increasing feed conversion efficiency (FCE) may
become increasingly important for Australian dairy systems in the future.
How can CFS help?
FutureDairy’s feedbase work has shown that:
• FCE in well managed pasture based system can be in the order of ~1.3L/kg DM for a medium to high
stocking rate and medium to moderate production per cow. The key to achieve high FCE is to ensure
that supplements, including grain, are fed to cows primarily when true pasture- (or better, grazed
forage-) deficits exist.
• Almost 30,000 L/ha can be produced from home-grown feed and using relatively small amount of
concentrate (~1 t/cow) when a full CFS is implemented. The key to achieve increased milk
production from home grown feed is to properly integrate CFR into the pasture based system,
producing more feed per ha.
3. By helping farmers managing risk
Risk has different meaning for different people. In the context of dairy production and from an economic
viewpoint, risk can be quantified in terms of probability of not achieving a given target. Farmers however,
intuitively associate risk with chances of a financial loss due to adverse outcomes and/or the size of the loss
(Little, 2011).
There are five types of risk associated with a CFS: climate, price, human, financial and environmental risks
(Farina, 2010).
Climate risk relates to variable seasonal conditions and/or adverse climate-related events (e.g. floods and
droughts) and is generally perceived as the largest risk of introducing forage crops in pasture-based systems.
The probability of occurrence is moderate (provided reliable irrigation water is available) but the potential
impact very high when it occurs (e.g. flooded paddocks or wet, cold weather at harvest of a maize crop).
However, FutureDairy’s work has shown that:
• Risk associated to forage production is reduced by good nutrient and water management. Irrigation
in particular is crucial in reducing risk of crop failure and/or poor yields (Farina, 2010) (see Figure 8).
• Risk associated to fluctuations in grain price can be reduced by implementing CFS (see above)
• Compared to a pasture plus concentrate system, a CFS system is less risky in economic terms
(potentially achieving economic target more consistently over a long period of time)
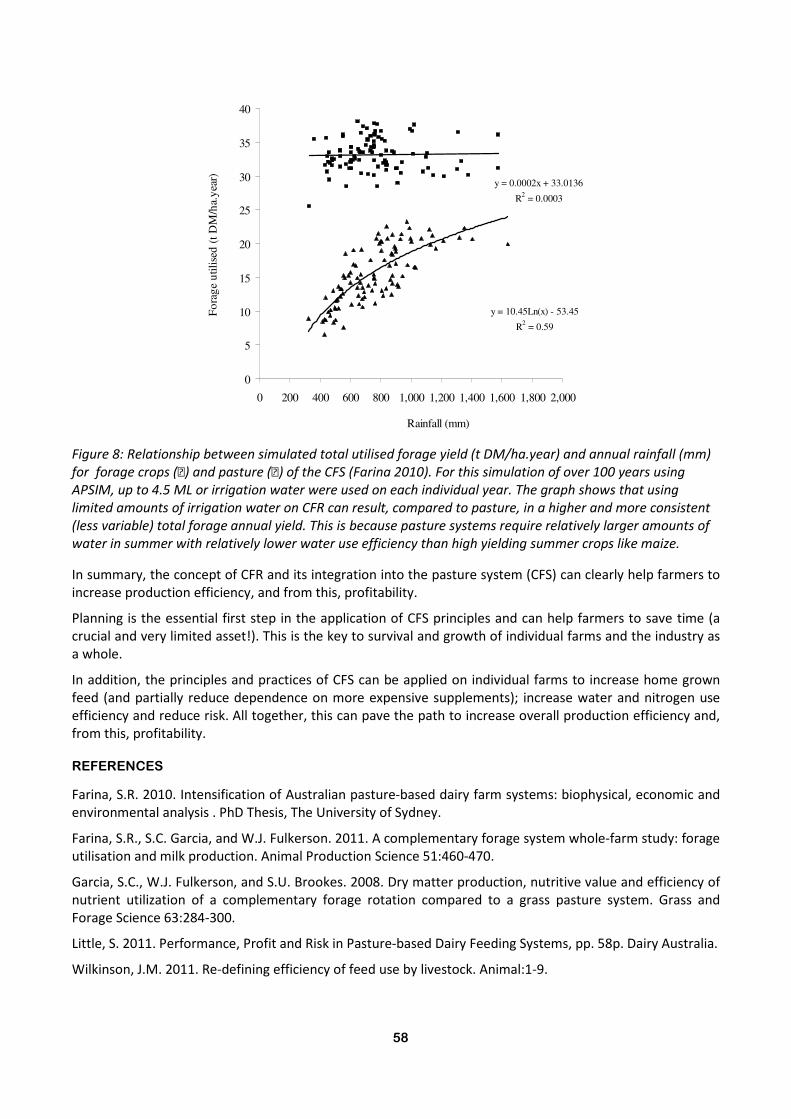
58
y = 0.0002x + 33.0136
R2 = 0.0003
y = 10.45Ln(x) - 53.45
R2 = 0.59
0
5
10
15
20
25
30
35
40
0 200 400 600 800 1,000 1,200 1,400 1,600 1,800 2,000
Rainfall (mm)
Fo
rag
e u
tili
sed
(t
DM
/ha.
yea
r) .
Figure 8: Relationship between simulated total utilised forage yield (t DM/ha.year) and annual rainfall (mm)
for forage crops (■) and pasture (■) of the CFS (Farina 2010). For this simulation of over 100 years using
APSIM, up to 4.5 ML or irrigation water were used on each individual year. The graph shows that using
limited amounts of irrigation water on CFR can result, compared to pasture, in a higher and more consistent
(less variable) total forage annual yield. This is because pasture systems require relatively larger amounts of
water in summer with relatively lower water use efficiency than high yielding summer crops like maize.
In summary, the concept of CFR and its integration into the pasture system (CFS) can clearly help farmers to
increase production efficiency, and from this, profitability.
Planning is the essential first step in the application of CFS principles and can help farmers to save time (a
crucial and very limited asset!). This is the key to survival and growth of individual farms and the industry as
a whole.
In addition, the principles and practices of CFS can be applied on individual farms to increase home grown
feed (and partially reduce dependence on more expensive supplements); increase water and nitrogen use
efficiency and reduce risk. All together, this can pave the path to increase overall production efficiency and,
from this, profitability.
REFERENCES
Farina, S.R. 2010. Intensification of Australian pasture-based dairy farm systems: biophysical, economic and
environmental analysis . PhD Thesis, The University of Sydney.
Farina, S.R., S.C. Garcia, and W.J. Fulkerson. 2011. A complementary forage system whole-farm study: forage
utilisation and milk production. Animal Production Science 51:460-470.
Garcia, S.C., W.J. Fulkerson, and S.U. Brookes. 2008. Dry matter production, nutritive value and efficiency of
nutrient utilization of a complementary forage rotation compared to a grass pasture system. Grass and
Forage Science 63:284-300.
Little, S. 2011. Performance, Profit and Risk in Pasture-based Dairy Feeding Systems, pp. 58p. Dairy Australia.
Wilkinson, J.M. 2011. Re-defining efficiency of feed use by livestock. Animal:1-9.

59
GREEN CLEANING™ SYSTEMS – 12 MONTHS ON
ANNETTE ZURRER
Dairy Farmer, Gippsland Region, Vic
Green Cleaning™ systems are milking machine wash systems that operate at low temperatures, re-use the
cleaning solutions and are energy efficient. The various makes and models now available comprise an
automated cleaning unit that is capable of capturing, storing and re-using the wash solutions.
They use chemicals that are specifically designed for re-use, and to work at lower temperatures (less than
50°C).
Figure 1. The Green Cleaning TM System installed by GEA Farm Technologies (WestFalia) on
the Victorian case study trial farm.
In some models the wash solutions are heated using energy from renewable sources such as solar or heat
recovery. The storage tanks are well insulated to minimise any heat losses.
A website has been established specifically for information about Green CleaningTM systems at
www.agvetprojects.com.au/greencleaning
It’s been over a year since the first commercial Green Cleaning™ systems appeared on four farms in different
areas of Victoria. The dairy farmers who installed the systems were doing so for a range of reasons; energy
and cost savings being integral factors.
These early systems functioned as ‘trial systems’ for the companies making them. It was an opportunity to
monitor, adjust, and enhance the systems before they were offered more widely.
60
SO, ONE YEAR ON, HOW HAVE THEY PERFORMED? HAVE THERE BEEN SAVINGS? AND IF SO, WHERE HAVE THEY BEEN?
Three different companies – Ecolab, GEA Farm Technologies and Milka-Ware – have Green Cleaning™
systems installed. Each system is different but they all aim to achieve the essential elements of Green
Cleaning, that is: operate at low temperatures, re-use the cleaning solutions, and be energy efficient.
Over the year, all farms have experimented with different re-use chemicals, different cleaning programs, and
different operating temperatures. Fine tuning is continuing (as of May 2012) to further reduce energy
consumption.
One of the farms where the principles of Green Cleaning have been fully deployed the savings have been
substantial, and serves as a good case study example of what can be achieved.
RESULTS FROM A COMMERCIAL CASE STUDY FARM
Our case study farm is typical of many; a herd size of around 400 cows, milking twice a day through a 50 unit
rotary. There is an automatic wash system to clean the milking machine. The original wash program was
similar to that used on other dairy farms; cold rinse, hot wash (alternating between alkali & acid) and a warm
rinse as the final cycle.
All solutions were discarded after use. Water used for cleaning the milking machine was heated to 90oC
using a 1,800-litre conventional dairy hot water service.
The Green Cleaning™ system was installed on this farm in February/March 2011. It comprised three 750
litre, well insulated tanks to store the cleaning solutions, a heat recovery unit (on the refrigeration system)
to pre-heat water, and the control system.
The Green Cleaning project was delivered by AgVet Projects on behalf of GippsDairy, and was funded through the Victorian Government’s Sustainability Fund and the Gardiner Foundation.
Water heated in the heat recovery unit is used for the pre-rinse (1st cycle), and to top up the hot water
service (HWS). The hot water from the HWS is used to top up the alkali tank (~120 l/day) and as a means to
heat the alkali to the required temperature (initially 60oC but now 50oC).
The thermostat in the hot water service was turned down to 70oC to reduce standing heat losses in the
HWS.
THE SAVINGS
The table on the next page compares the two cleaning systems. The Green CleaningTM System has resulted
in reductions in electricity use, chemicals, water, and greenhouse gas emissions.
For this farm, the overall milking machine cleaning costs have been reduced by 38.5% - a good outcome but
significant improvements are still possible.

61
Table 1: Comparison of conventional and Green Cleaning machine cleaning systems on case study farm.
BEFORE
original wash system
(single-use)
AFTER
Green CleaningTM
System
(re-use)
IMPACT
AM PM AM PM
1st cycle Warm pre-rinse Warm pre-rinse Warm pre-rinse Warm pre-rinse
2nd cycle Hot alkali wash Hot acid wash
Combined
warm alkali
wash & sanitizer
Combined cold
acid wash &
sanitizer
3rd cycle Warm rinse Warm rinse
Cycle volume (L) 400 400
400 (rinse)
550-575 (Alkali
sanitizer)
400 (rinse)
550-575 (Acid
sanitizer)
Total hot water used (L)
600 600 120 0 90%
Total water used i.e. discarded (L)
1,200
(400/cycle)
1,200
(400/cycle)
520 (400 for 1st
cycle & 120 to
top up alkali)
520 (400 for 1st
cycle & 120 to
top up acid)
57%
Electricity use (kWh/day)
114 43 62%*
Daily Greenhouse gas emissions
140.7 kgCO2 –e 52.9 kgCO2 –e 62%
Daily electricity cost**
$8.09 $3.04 62%
Total chemical use (L/day)
2.3 1.7 26%
Daily chemical costs $9.57 $7.83 18%
TOTAL DAILY COSTS
$17.67 $10.87 38%
* Standing heat losses in the HWS were estimated to be 25 kWh/day. Minimising heat loss would see
electricity use decrease by 85%.
** Average electricity off-peak tariff rate was 7.07 cents/kWh – lower than the 10-14 cents/kWh found on
many farm electricity bills.
62
FURTHER IMPROVEMENTS IN THE PIPELINE
Using the original HWS – at a lower temperature – as a heat source for the alkali tank seems a logical and
cost effective option. However, a review of energy use of the case study farm identified that this may not be
the best option. This is because of the standing heat losses in the HWS.
Of the 43 kWh used in the Green CleaningTM system, 25 kWh was attributed to HWS heat losses, which
means 58% of the energy consumed was actually lost through poor insulation of the HWS.
Removing the HWS and using an alternative way of heating the alkali solution (such as having a heating
element inside the tank itself), or by improving insulation of the HWS would see electricity use drop to
around 18 kWh per day – representing an 85% reduction in electricity consumption.
Similarly, additional savings in water and chemical use have also been identified and AgVet Projects is
working with each of the manufacturers to improve the efficiency of the various commercial systems on
offer.
Stable operating conditions (chemical concentrations, temperatures and water quality) result in consistently
good cleaning efficacy and milk quality.
Alarms on the automated systems help to ensure the systems are operating as intended.
TOTAL COSTS OF OWNERSHIP
A good way to compare the financial merits between a conventional cleaning system and a Green
CleaningTM system is to work out the total cost of ownership for each option.
The total cost of ownership is a financial tool that can help determine the total cost of a piece of equipment
over its lifetime. It includes the initial capital cost as well as the operating costs during its practical service
life.
Taking the findings from this case into consideration – but using better insulating properties and more
representative electricity tariff rates – a TCO comparison between the Green CleaningTM system and the
pre-existing system can be made. This is shown in the figure below.
Like most energy efficient equipment, the initial capital cost of the Green CleaningTM system is likely to be
greater than conventional auto-wash systems, but the on-going operating costs are lower. In this case, the
there is an existing system so no capital outlay is required.
A Green CleaningTM System costing $40,000 installed is used for the comparison.
For the first 6½ years the total cost of ownership for the Green CleaningTM system is greater than the
conventional auto-wash system. After this time the total cost of ownership will be less for the Green
CleaningTM system.
After 10 years, the existing system has cost $26,884 more to own and operate.
If the same conditions were applied to a new dairy where the options were:
• a conventional auto wash (with large HWS) costing $20,000 installed or
• a high-end Green CleaningTM system costing $40,000 installed
then the total cost of ownership becomes less for the Green CleaningTM system after 3.25 years, saving
$46,884 (in today’s dollars) over a 10 year lifespan.
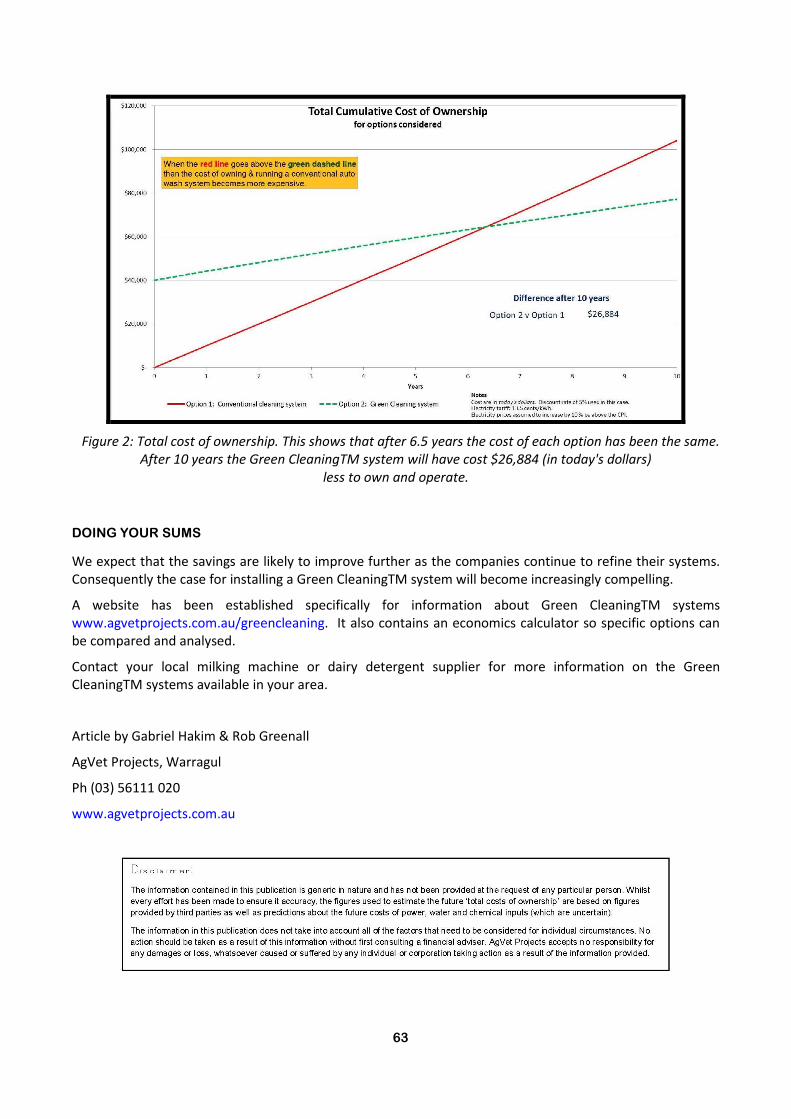
63
Figure 2: Total cost of ownership. This shows that after 6.5 years the cost of each option has been the same.
After 10 years the Green CleaningTM system will have cost $26,884 (in today's dollars)
less to own and operate.
DOING YOUR SUMS
We expect that the savings are likely to improve further as the companies continue to refine their systems.
Consequently the case for installing a Green CleaningTM system will become increasingly compelling.
A website has been established specifically for information about Green CleaningTM systems
www.agvetprojects.com.au/greencleaning. It also contains an economics calculator so specific options can
be compared and analysed.
Contact your local milking machine or dairy detergent supplier for more information on the Green
CleaningTM systems available in your area.
Article by Gabriel Hakim & Rob Greenall
AgVet Projects, Warragul
Ph (03) 56111 020
www.agvetprojects.com.au

64

65
REDUCING THE DIVIDE CONVERSATIONS FOR CHANGE
STEPHANIE TARLINTON
DAIRY FARMER, COBARGO, NSW
Knowledge is largely acquired by experience and education which has the ability to empower individuals and
conversely highlight issues of separation.
Australia is increasingly facing this issue of knowledge disparity in regards to consumer awareness about
food and fibre production, agricultural industries and issues. This disconnect is commonly referred to as the
‘rural – urban divide’ which signifies that based on your location there is a divide or separation in your
everyday lifestyle. This division can be seen in geographic terms on the eastern seaboard with the Great
Dividing Range however it is increasingly becoming a common term used to express the distance between
the individuals whom produce the nation’s food and fibre and those whom merely consume products. It
suggests that based on your location being rural or urban you will or will not have knowledge of food
production and associated topics. This highlights an opportunity for both consumers and producers to have
conversations of change which will ultimately increase the knowledge of both parties on issues removed
from their daily lives. By acquiring education from individuals whom have firsthand knowledge in agricultural
fields will enable those divided by urban boundaries to have informed opinions and increased
understandings.
A conversation between two individuals has the amazing ability to inspire, inform, and change perceptions
which creates an opportunity for change. With a considerable amount of Australia’s population living in
urban centres those classified as rural including the countries farmers have an important role to play in
reducing the separation between communities. Engaging in a conversation with someone who has little
knowledge of how their food moves from the farm gate to their plate has the potential to give them insights
into the real story of modern agriculture.
Connecting with consumers on shared values increases the possibility of forming trust in farming and those
whom participate in agricultural business. Sharing personal stories allows consumers to gain insight and
confidence in farming systems, ultimately building connections and breaking down barriers in society which
further decreases the divide. A conversation which has the potential to lead to knowledge transfer is one
that allows each party to listen and engage on a topic of common interest. So therein lays the question; who
is interested in stepping outside of their segment?
As a consumer you are able to vote three times a day; breakfast, lunch and dinner which is determined by
your values, knowledge and experience. Members from either side of the divide consume food in order to
survive which is therefore a fundamental feature of unity and mutual dependency.
A simple discussion on the origin of a food product has the potential for rural person A to connect with
urban person B to produce an outcome of greater understanding C.
A + B = C highlights the impact a single conversation can have if society will allow itself the simple pleasure to
connect and challenge perceptions.
To quote Ghandi, ‘be the change you want to see in the world’ reinforces the challenge that in order to
create ways in which to build relations between the two sectors of society one must accept their role and be
prepared to create opportunities for conversation. For the agricultural sector to develop positive images and
perceptions of farming practices and lifestyle individuals who align themselves with this segment must be
prepared to participate in the dialogue.

66
Building trust in and empathy with rural and remote areas of the country is in many ways the change that
will reduce the misunderstandings that result in the ‘divide’. By participating rather than watching as is
commonly done by agriculturalists allows for the change of public perception around the individuals whom
grow our food and fibre. It is necessary for a collaborative approach from industries however each individual
involved in the business that is agriculture have the opportunity to engage and educate through
conversations.
Telling the story of modern innovative farming businesses during discussions aids in challenging the
stereotype portrayed in traditional media of people involved in agriculture. Breaking down such stereotypes
also has the potential to reduce the disconnect between rural and urban communities as greater
understanding allows for a more informed approach to thinking about the reality of one another’s daily life.
To recreate the image of farmers in the mind of modern consumers conversations need to be had which
allow for positive connotations to be formed reinforced by fact which builds trust. As other sectors of the
community have done in recent media, the agricultural community has to actively seek out and celebrate
the people who are generating change for the greater good of all involved.
In summary, to offer one’s knowledge also allows them to have power and in modern society consumers
hold significant power which is expressed in daily decision. By providing opportunities for knowledge
transfer between the two sectors decreases the misunderstanding and lack of esteem shown toward one
another. Conversations provide the key to reducing the disconnect which is present in today’s society of
consumers.
Having open and informed discussions create a basis for relations to be built with trust and empathy as
influential outcomes. By highlighting areas of unity through shared values allows conversations to be a
forum to engage and educate which are paramount in linking the two sectors together. Connecting
producers and consumers or as it is commonly referred to, rural and urban audiences requires individuals to
become part of the change they want to see.
Actively participating in the conversations is essential for progress to be made in reducing the disparity of
knowledge, experience and education in terms of food and fibre production. Challenging stereotypes
through highlighting connections has the ability to show how together as people both have a mutual
dependency on food and therefore one another as a producer and a consumer. As knowledge is power,
every individual has the power to share knowledge regardless of which side of the classroom divide, they
take a seat during story telling.
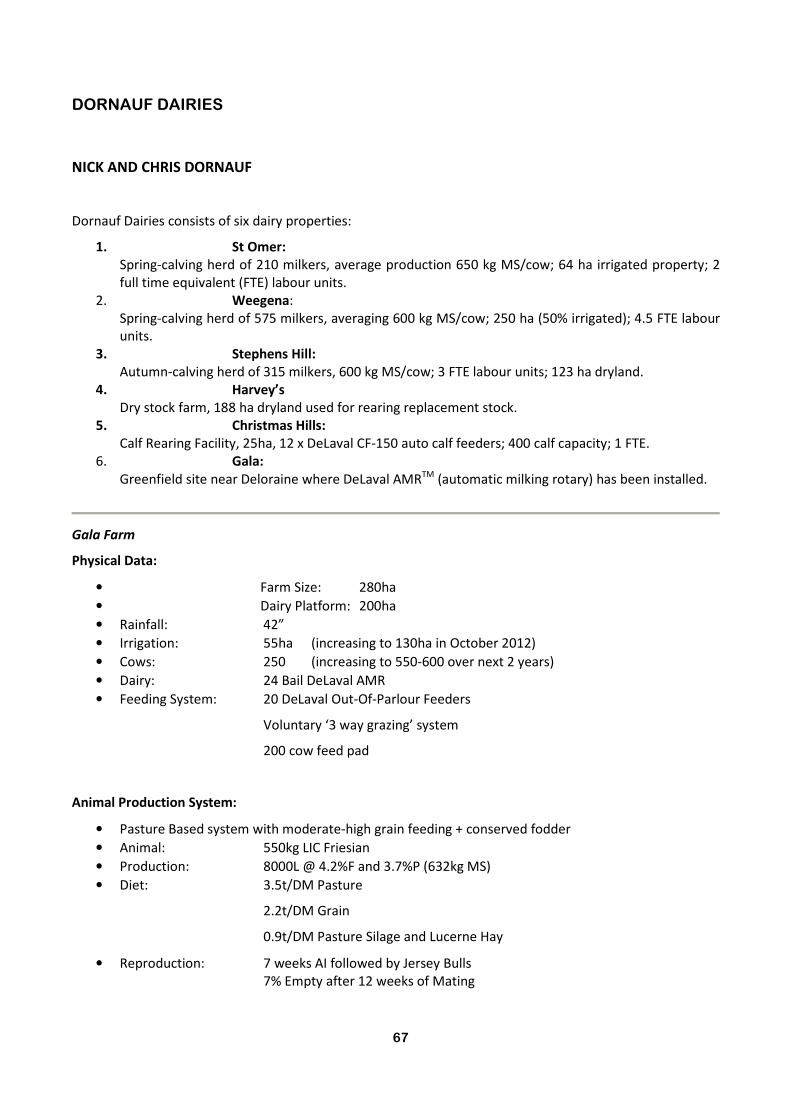
67
DORNAUF DAIRIES
NICK AND CHRIS DORNAUF
Dornauf Dairies consists of six dairy properties:
1. St Omer: Spring-calving herd of 210 milkers, average production 650 kg MS/cow; 64 ha irrigated property; 2
full time equivalent (FTE) labour units.
2. Weegena:
Spring-calving herd of 575 milkers, averaging 600 kg MS/cow; 250 ha (50% irrigated); 4.5 FTE labour
units.
3. Stephens Hill: Autumn-calving herd of 315 milkers, 600 kg MS/cow; 3 FTE labour units; 123 ha dryland.
4. Harvey’s Dry stock farm, 188 ha dryland used for rearing replacement stock.
5. Christmas Hills: Calf Rearing Facility, 25ha, 12 x DeLaval CF-150 auto calf feeders; 400 calf capacity; 1 FTE.
6. Gala: Greenfield site near Deloraine where DeLaval AMRTM (automatic milking rotary) has been installed.
Gala Farm
Physical Data:
• Farm Size: 280ha
• Dairy Platform: 200ha
• Rainfall: 42”
• Irrigation: 55ha (increasing to 130ha in October 2012)
• Cows: 250 (increasing to 550-600 over next 2 years)
• Dairy: 24 Bail DeLaval AMR
• Feeding System: 20 DeLaval Out-Of-Parlour Feeders
Voluntary ‘3 way grazing’ system
200 cow feed pad
Animal Production System:
• Pasture Based system with moderate-high grain feeding + conserved fodder
• Animal: 550kg LIC Friesian
• Production: 8000L @ 4.2%F and 3.7%P (632kg MS)
• Diet: 3.5t/DM Pasture
2.2t/DM Grain
0.9t/DM Pasture Silage and Lucerne Hay
• Reproduction: 7 weeks AI followed by Jersey Bulls
7% Empty after 12 weeks of Mating
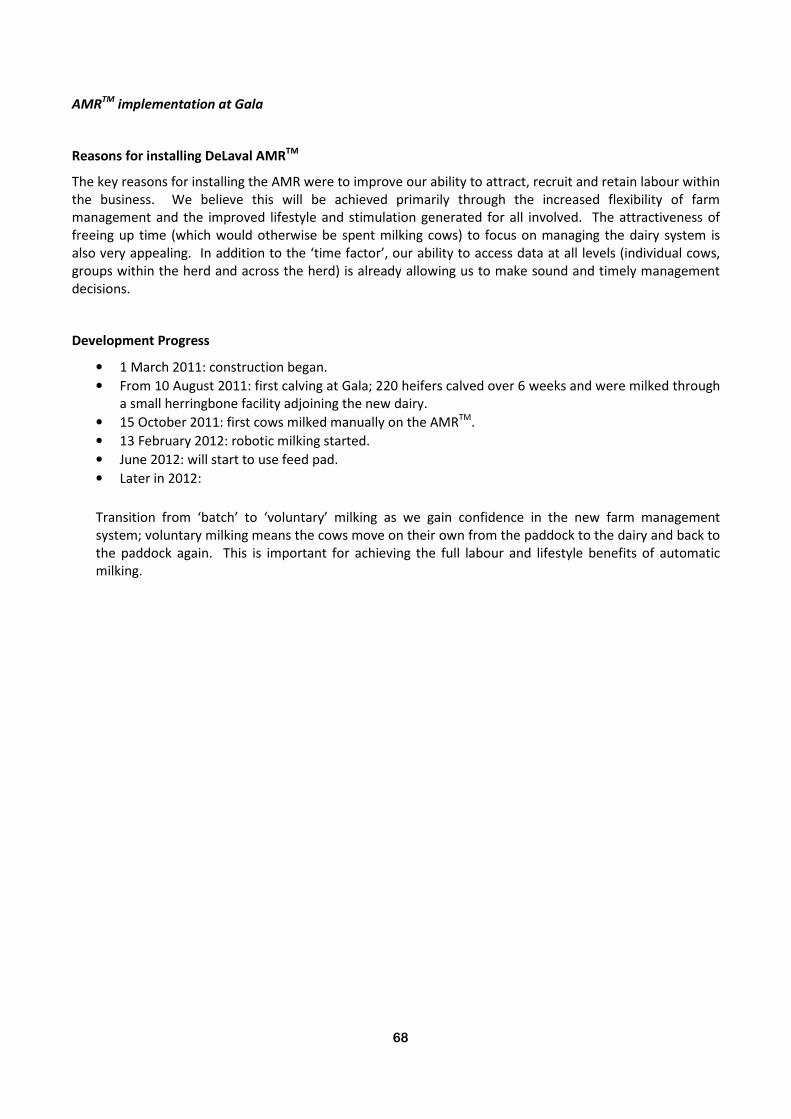
68
AMRTM
implementation at Gala
Reasons for installing DeLaval AMRTM
The key reasons for installing the AMR were to improve our ability to attract, recruit and retain labour within
the business. We believe this will be achieved primarily through the increased flexibility of farm
management and the improved lifestyle and stimulation generated for all involved. The attractiveness of
freeing up time (which would otherwise be spent milking cows) to focus on managing the dairy system is
also very appealing. In addition to the ‘time factor’, our ability to access data at all levels (individual cows,
groups within the herd and across the herd) is already allowing us to make sound and timely management
decisions.
Development Progress
• 1 March 2011: construction began.
• From 10 August 2011: first calving at Gala; 220 heifers calved over 6 weeks and were milked through
a small herringbone facility adjoining the new dairy.
• 15 October 2011: first cows milked manually on the AMRTM.
• 13 February 2012: robotic milking started.
• June 2012: will start to use feed pad.
• Later in 2012:
Transition from ‘batch’ to ‘voluntary’ milking as we gain confidence in the new farm management
system; voluntary milking means the cows move on their own from the paddock to the dairy and back to
the paddock again. This is important for achieving the full labour and lifestyle benefits of automatic
milking.

69
BUSINESS TRANSITION AND SUCCESSION PLANNING
MARK SCANLON Consultant, NextRural
UNDERSTANDING BUSINESS TRANSITION
Overview
Business transition means different things to different business owners. Each owner faces their own
particular issues surrounding their business, their family and their future. Whether it is the succession of the
business to the next generation or it is time to sell the business and move on, proper planning and guidance
is required so that a clear path can be developed and followed.
This paper will outline how to develop a sound Business Transition and Succession Plan. It has been based on
actual experiences of completing the process with many families in the dairy industry. The process is
designed by Next Rural with additional online resources provided by Dairy Australia’s The People in Dairy
program at:
http://www.thepeopleindairy.com.au/planning-for-the-future/planning-future-insight.htm
By utilising the framework and tools developed for dairy farmers, business owners will achieve:
• Clear objectives and a future action plan
• Cost effective solutions
• Definite outcomes in realistic timeframes
The following provides an understanding of the business transition and succession planning process. It will
equip business owners with knowledge and tools on how they can obtain real results that will allow them to
move through the transition process.
This paper has been specifically prepared for you, as the business owner.
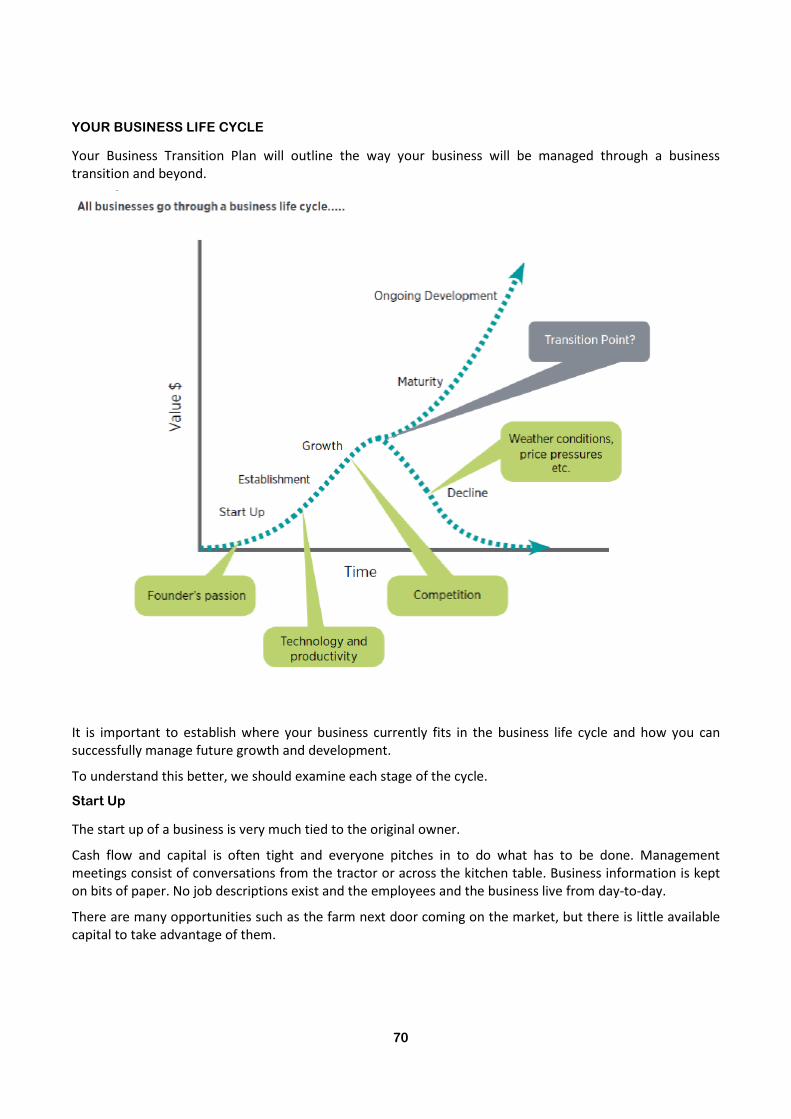
70
YOUR BUSINESS LIFE CYCLE
Your Business Transition Plan will outline the way your business will be managed through a business
transition and beyond.
It is important to establish where your business currently fits in the business life cycle and how you can
successfully manage future growth and development.
To understand this better, we should examine each stage of the cycle.
Start Up
The start up of a business is very much tied to the original owner.
Cash flow and capital is often tight and everyone pitches in to do what has to be done. Management
meetings consist of conversations from the tractor or across the kitchen table. Business information is kept
on bits of paper. No job descriptions exist and the employees and the business live from day-to-day.
There are many opportunities such as the farm next door coming on the market, but there is little available
capital to take advantage of them.

71
Establishment
During the establishment period, cash flow becomes more predictable. Suppliers and bankers look more
favourably on the business.
The potential to build capital starts to emerge along with a profitable bottom line.
The business is still strongly linked with the original owner and forward planning is still fairly informal.
Growth
Production is growing. Cash flow is improving and investment back into the business is increasing. With
improved capital, there are opportunities for growth and development.
New properties come onto the market and the size of the holding is increased. More people have to work on
the farm and organisation becomes complicated.
The potential for conflict increases. New challenges start to emerge.
Decision Time
Growth has been good, however the risks are higher.
Changes in weather conditions or commodity prices can have a significant effect.
It is time to make some important decisions. The business is now more complex to run and requires more
formality in its planning and operations.
There are three choices:
1. Ignore the challenges and continue to run the business as it was in the past. Keep things informal
and ad hoc
If this course of action is taken, then sooner or later the business will fall into decline
2. Sell the business and move on
If the business has become too much of a burden and a more rigid structure doesn’t suit,
then it may be a good time to sell i.e. while the business is still strong
3. Move the business strategically and operationally to the next phase
By doing this, significant rewards can be gained from the ‘maturity’ phase of the cycle
Maturity
Production is growing and the business is operating more effectively.
Price pressures continue, however production and input costs are less. Critical mass has been achieved and
increased access to capital means opportunities for growth can be realised.
Ongoing development
To ensure the ongoing development of a mature business, a focus must be maintained on key elements of
the business:
• Innovation: Are you using the latest production techniques and machinery?
• Markets: Are your commodities suited to a changing and demanding marketplace?
• Diversification: Have you spread your risk in terms of production e.g. prices and competition?

72
• Business Risks: Are you adequately insured against all risks? Have you had an occupational health
and safety assessment?
• Skills and Knowledge: Is your knowledge adequate and up-to-date? If not, consider undertaking
training course in order to improve your skills and be able to efficiently handle a demanding and
changing business world.
• Financial Management: Do you have the right structures in place? Are your reporting systems
adequate? Have you effectively forecast your profit and loss projections and capital requirements?
• Planning and Strategy: Have you “professionalised” your business? Do you have a strategic plan that
clearly determines:
o Where you are now?
o Where you want to be?
o How are you going to get from here to there?
WHAT IS BUSINESS TRANSITION?
You may have reached a time where you need to make some important decisions regarding your business
and your family’s future.
It may be time to:
Prepare to transition the business to the next generation
A succession plan will outline the way your business will be managed and owned after the retirement of the
current owners and provide planning for the continuation and success of the business. It will help enable the
next generation to manage effectively without conflict and the current owners to satisfactorily fund their
retirement. It will also take into account the needs and expectations of family members not working on the
farm.
Sell the business and move on
If the business has become too much of a burden, it may be a good time to sell; perhaps the business is still
strong and/or the property has increased in value and you can realise a financial gain. You may simply need
to limit any future losses. If this is the best course of action, you should begin by preparing a Business Exit
Strategy. This will ensure that you maximise your returns and minimise potential for taxation liabilities.
Have a partial release of ownership/management
A partial release of ownership and/or management can have a number of beneficial effects:
• Realise much needed cash for development, to reduce debt or pay outstanding bills
• Reduce the physical burden of managing the property/business
• If partial ownership or management is passed on to the next generation, it will allow them to
develop their skills and derive income in preparation for a future transition of the whole business.
Lease the property to the next generation or an outside party
There are at least 2 types of leasing arrangements:
1. Fixed term lease with renewable extensions which are predetermined
73
2. A lease with the option to purchase
Leasing offers the landowner a more certain financial return than share farming. The returns to the
landowner are not subject to variations in farming ability, seasonal conditions or commodity prices and offer
a more certain future for the leasee.
Share Farming
Share farming agreements should be in writing. All parties must be satisfied they are receiving a fair share of
the income and that the cost sharing arrangements are appropriate for the amount of capital invested.
Review funding for future development
Perhaps your debt and banking facilities can be better structured to meet your needs. Your finance should
be appropriately arranged to meet your immediate and future requirements. You may need to negotiate
with financiers/banks to achieve your goals. This restructuring may reduce costs and/or free up
development funds for further investment.
Other ways of transitioning the farm
If you would like to sell your land but stay involved in the industry, it may be possible to manage a farm for someone
else or to provide labour to another farm. Large landholders and corporate farmers offer the opportunity to stay
involved in agriculture in this way.
WHY IS YOUR BUSINESS TRANSITION PLAN IMPORTANT?
The most important aim of the Business Transition planning process is to bring about a smooth transition
of the family farm and at the same time, improve business confidence and maintain family harmony.
A Business Transition Plan evaluates business and personal circumstances in light of current and possible
future options in order to develop a preferred course of action from a range of alternatives, importantly,
while the business owners are still in a position of control.
It will provide planning for the continuation and success of the business. It will enable the next generation
to manage effectively without conflict and the current owners to satisfactorily fund their retirement.
It will also take into account the needs and expectations of family members not working on the farm.
Business transition management and planning addresses the complexities involved in transitioning the
ownership of a business, usually from one generation to the next.
A Business Transition Plan outlines the way a business should be owned and managed after the retirement
of the current owners and provides for the smooth continuation of the business.

74
COMMON PROBLEMS WITH THE BUSINESS TRANSITION PLANNING PROCESS
Too many transition plans are thought about but not acted upon. Often when they are started, they do not
come to a conclusion. Some of the common reasons that transition plans stall include...

75
BUILDING YOUR BUSINESS TRANSITION PLAN
A structured approach- “The four phases”
This part of the paper outlines each stage of the process. How quickly you complete each stage will depend
on a number of factors.
The business transition may take place over a number of years and your Plan should accommodate changing
future circumstances
Undertaking a Plan will take you through a four stage process. Within each stage, there are a series of sub-
sections designed to address specific issues.

76
1. KEY FINDINGS PHASE
Conducting the first family meeting
Open communication
The first and most important step, or pre-step before entering the transition process, is to open the lines of
communication between the generations. Once the generations are talking, everyone will start to think
about his or her involvement in the future of the farm business.
Business transition and succession planning cannot be approached as a one-time event. Instead, it is a
process that should begin long before the owners plan to exit the business. Starting the conversation early
also ensures you can select from the widest range of options available to you.
Some tough decisions may need to be made such as whether parties wish to hand over property, the
business or assets and whether the other parties are willing to accept that ownership. Consideration may
need to be given to the financial capability of the future owners to meet ongoing costs and to provide
sufficient funds to meet the current owner’s retirement expectations.
An effective way to start the conversation is to conduct a formal family meeting to better understand the
attitudes of the participants to a business transition and succession process.
Objectives
The objectives of the family meeting are to achieve the following:
• A commitment from all family members to the process and to the goal of achieving a positive
outcome.
• Gain and share a better understanding of the history of the property, the family legacy and the
needs and expectations of all the participants.
• Collect the legal, accounting and financial information necessary to prepare a draft plan.
• Identify any potential impediments to a successful outcome.
• Ensure that the process is undertaken in a way that maintains family harmony and business
prosperity.
• An understanding of the retirement lifestyle goals and aspirations of the current owners, and future
goals and aspirations of other family members.

77
Starting the discussion
An important objective of the family meeting is to better understand the attitudes of the various
participants to a business transition and succession process. The following list of questions and subjects can
help to open discussions:
• What would the ideal outcome be from the business transition planning process for the business?
• What about the outcome for the family?
• What are the key issues that would need to be resolved to reach an outcome that would satisfy
everyone?
• What would make you feel the process was successful?
• What would be the consequences if this process wasn’t undertaken? For the business? For the
family?
• List the top three issues that you think could put a good outcome at risk
It is important that any issues are clearly identified and a resolution and commitment is achieved.
A family meeting may help to identify the potential for any conflicts or difficulties amongst family members
that may inhibit the planning process. A meeting should also help all participants understand in an open and
honest manner the feelings and attitudes of the various stakeholders.
The stakeholders need to participate honestly and openly without fear or favour, to gain maximum benefit.
Ensuring harmony between the family and the business
The key to achieving a successful outcome to the business transition planning process is for all stakeholders
to be committed to the process.
A family business is a unique business structure and we must achieve the delicate balance of effectively
combining the family system and the business system, while also keeping them separate enough to avoid
conflict.
The communication systems between a family and the business are complicated. For the planning process
to be successful, all parties need to be considered.

78
Checklist for gathering information
For the initial family meeting you will need to collect certain information and give consideration to a range
of issues.
At this meeting you will discuss your needs and expectations. This will assist in preparing a draft structure of
your plan and will include some or all of the following points.

79
Preparing a draft Business Transition Plan
During this stage the information gathered during the family meeting will be analysed and the needs of each
party determined.
There will be a different expectation from all involved. The current business owners will want a graceful exit.
They will want to know that the business will be in good hands and that they have established a sound
retirement or semi-retirement income.
The future owners/managers will need the Plan to ensure their future is secure and not burdened by too
much debt.
Other members of the family not involved in the business, will want to know the Plan values their position
appropriately.
The whole family will want a smooth transition without creating tensions and acrimony.
In essence, the Plan must deal with the sometimes conflicting needs and aspirations of:
• The business owners both current and future
• The family
• The business itself
Objectives
The objectives at this stage of the program from each of the above perspectives are:
The Business Owners (Current and Future)
To determine effective estate planning and retirement funding for the current owners
Institute appropriate financial structures
• Determine the nature, structure and term of the transition process
• Agree on the actual value of the business/property and the value to be applied to the transition
• Establish sufficient liquidity to fund the current owners retirement and transition to retirement
• Align the needs and expectations of the current owners with the requirements and manageability
the future owners
The Family
• To determine future equity ownership
• If appropriate, establish income streams to beneficiaries not involved in the business
• Ensure adequate risk protection exists on family members receiving an income stream to avoid
family disputes in the event of premature death of the beneficiary
• Establish correct legal and accounting structures
80
• Document a transition agreement to assist in the avoidance of future disputes
The Business
• Determine the nature and term of the transition
• Determine management transition/ownership transition timetable and conditions
• Establish suitable equity ownership for all stakeholders
• Determine any debt requirements and seek favourable arrangements
• Ensure there are appropriate rewards for both family and non-family members
• Conduct a review of all business risks including occupational health and safety, loss of income
through injury, illness or death, financial, taxation risks etc.
• Determine any buy/sell arrangements and ensure they are appropriately supported by adequate
insurance protection
• Agree on an actual value of the business and property and a transition (transfer) value to the future
owners
• Ensure that the structures adopted protect the assets from potential liabilities and risks
2. RECOMMENDATION PHASE
The structuring of a solution
Business transition planning is not simply a matter of passing the business to the next generation. Many
issues will need to be dealt with.
Establishing goals and objectives, values, suitable structures, term of the transition, minimising tax and
funding retirement are but a few of the necessary considerations.
‘Circle of REWARD’
Next Rural’s ‘Circle of REWARD’ is a systematic way of structuring your Transition Plan. It separates each
area of consideration and enables the family to assess the proposed solution through a step-by-step plan.

81
Remuneration planning
Attitudes to remuneration are often coloured by personal circumstances and relationships within the
business, particularly where members of the family are involved.
Some of the areas to be considered include:
• What has been the history of remuneration and reward for past effort?
• How do you pay different salary levels to different family members?
• How do you reward “sweat for equity”?
• What should the basis be for establishing different salary levels within the business?
• How do you manage the expectations of non-family members who do similar jobs, but are not paid
the same?

82
Equity ownership by family members
Equity ownership amongst a family needs to be structured to ensure that the business can be effectively
managed on a day-to-day basis. Sometimes, the allocation of equity to family members not working on the
farm can make business decisions difficult.
These issues should be dealt with early in the business transition process. If left unresolved, they can cause
problems for the future owners especially where the property and business values increase as a result of
their decisions and efforts.
Some of the areas to be considered are:
• How should control be released and over what term?
• How is equity to be paid for?
• If sold, should this only be to family members or outsiders as well?
• How should equity be transferred and under what conditions?
• What financial and legal structures should be utilised to transfer the business/ownership and how
should these structures be documented?
• How will equity issues be dealt with, in the unfortunate event of the death of any of the parties?
Working on/off the farm
Managing the expectations between different family members (those actively involved and those not
involved in the business), is essential to meet their needs and at the same time, provide for the future
success of the business.
• Some of the areas covered here include:
• Should ownership be based on active participation in the farm?
• Under what conditions are family members introduced into the business?
• Does the next generation have the skills and knowledge to manage the business?
• How are the differing ages of children managed?
• What rights, if any, do family members not working on the farm have in the day-to-day running of
the business?
• Does the Business Transition Plan consider those family members wishing to return to the farm in
the future? If so, under what conditions?
• Should there be a financial distribution to family members not working on the farm, and if so, in
what form and over what term?

83
• What has already been provided to non-working family members e.g. university education and
off-farm career path?
Accounting and legal structures
This is often a crucial issue for owner-managed businesses. The financial structure should provide maximum
flexibility in running the business and should be tailored to individual circumstances and needs.
It is important that the financial and legal structures used to bring about the transition and to conduct the
ongoing business, are effective from taxation, legal and risk perspectives.
Some of the areas covered here include:
• Do the financial and legal structures reasonably reflect the intent of the Business Transition Plan and
expectations of the key stakeholders?
• Are the structures effective in protecting assets?
• Do they protect against changing circumstances such as a death or divorce?
• Are they effective from a stamp duty and capital gains tax perspective?
• What legal documentation and structures are in place to safeguard against changes to the current
owner’s wills?
The People in Dairy website provides a good overview of the different business structures available at
http://www.thepeopleindairy.org.au
Retirement and estate planning
In both personal and business terms, planning for the retirement of the current owners is an essential
component of your Business Transition Plan. Not only does this enable a smooth transition to the next
generation, but can also help to minimise tax liabilities. Estate planning is a continuing process and should be
reviewed on a regular basis to ensure that needs are met.
Some of the areas covered here will include:
• What is a fair price to be paid by the next generation for the business/property?
• Has the retiring generation planned for adequate liquidity to meet tax liabilities?
• Who will inherit the assets?
• How will the business be transferred and over what timeframe?
• Have the retiring generation planned effectively for retirement?
• Do the current owners have a sound financial plan? Have they determined how much income they
require for retirement?
• Do the wills accurately reflect the wishes of the current owners and are they still relevant following
the transition process?

84
Direction for the future
Every business, regardless of its size, needs to decide what its objectives are and how these are going to be
achieved. For family businesses it can be more complex, with a need to take into account personal and
family considerations.
Some of the areas covered here include:
• Where is the business now?
• Where do you want it to be?
• How are you going to get from here to there?
• Are the financial and legal structures tax effective?
• Do the financial and legal structures minimise risk?
• Have all the potential business risks and liabilities been addressed?
• Are the finance facilities cost effective and can the debt levels be managed?
• What legal documentation or structures can be put in place to reduce reliance upon, or safeguard
against, future changes to the current owner’s wills and testaments?
For the current owners transitioning into retirement, the plan will assist them to establish their new goals
and objectives.
3. IMPLEMENTATION PHASE
Consideration of the Plan
Following the preparation of a Draft Recommendations Report, a family meeting should be arranged so the
Plan can be presented and discussed. At this point, you may wish to make amendments or take some time to
discuss the suggested Plan with other family members, stakeholders or advisors.
Once the Draft Recommendations Report has been agreed upon, a draft Heads of
Agreement should be prepared for consideration.
Heads of Agreement
This agreement can be a formal legal document or simply a written creed that is adopted by the family. It
can be either binding or non-binding. In either case, it is worthwhile to have all parties sign the document to
avoid confusion and a dispute at a later date.
The Heads of Agreement should document all major decisions.
This may include decisions on:
� The current business structure and land/property ownership
� The business/property restructure
85
� The restructure of existing debt and capital accounts
� The transfer of the farm including:
• Water entitlements
• Valuation and market appraisals
• Value of improvements
• Adjustments
� The consideration to be paid including:
• Payments to the current owners
• What expenses incurred by the exiting owners will continue to be met, such as telephone, rent,
motor vehicle etc?
• What housing arrangements will be made for the exiting owners?
� How will income be distributed?
� What security will be provided to ensure future transition payments?
� Estate planning issues including review of wills
� Capital gains tax and stamp duty issues and consequences
The Heads of Agreement will also include legal documentation necessary to complete the transition.
The supporting documentation required will vary according to the particular circumstances and may typically
include:
Succession planning documents
� Deed of Family Arrangement to guarantee parents’ entitlements
� Options to purchase
� Lease/license to occupy – containing right of first refusal if needed
� Contracts for transfers of farmlands including specified special conditions applicable to the farm
transfer
� and agreed terms of the transfer
Farmlands
� All Transfer documents
� Subdivision documents
� Easements documents
� Tenders for sale or lease
Water
� Contracts for sale and purchase of water
� Subdivision of entitlements
� Mortgage over water entitlements

86
Securities/Asset Protection
� Mortgages (registered or unregistered)
� Guarantees
� Bills of Sale/Personal Property Securities, caveats
Trusts and Companies
� Discretionary Trust Deeds
� Unit Trust Deeds
� Unit Holders/Shareholders
� Transfer of Units/Shares documentation
� Registration of company
Other Legal documentation
Buy/Sell Agreements
� Lease documents
� Deed of Assignment of Lease
� Power of Attorney
� Last Will and Testament and Testamentary Trust (if applicable)
Implementation
Once the Heads of Agreement has been signed and adopted, it is now time to put the Plan into effect.
Following a thorough review of the timing, structure, financial and risk outcomes, the Plan must be
implemented. Many effective transition plans remain as ‘a piece of paper on the shelf’.
It is important that once the Plan has been agreed to, it is implemented without delay.
The financial outcomes
The Plan will need to meet the retirement needs of the current owners. The ongoing debt and funding
requirements will be established and must be capable of being managed within the capacity of the business
by the new owners.
Most importantly, the terms of the transition must be agreed upon and match the needs and expectations
of all stakeholders.
The requirements of family members not involved in the business may also need to be taken into account.
The Current Owners
The current owners will want to re-evaluate their retirement lifestyle goals aspirations and need to know the
level of funds available for investment. How much is available for retirement and what funds can be
allocated to family members who have not benefited from the transition of the business/property?
The Future Owners
The future owners should be able to identify their financial commitments and the transition cost. This should
be summarised to enable cash flow management to be easily monitored into the future.
All costs will need to be identified and indicate any debt servicing and vendor term obligations to the
previous owners.

87
Non-Working Family Members
Benefits to family members not working on the farm will need to be determined. This may include the
nature and term of any income distribution arrangements.
The transition payment and schedule
The transition payment and schedule is the financial outcome of the Business Transition Plan.
The transition payment is the final amount that is calculated to enable the future owners to purchase the
farm and the current owners to enjoy a retirement lifestyle that meets their goals and aspirations. It
provides a simple and concise means of establishing and monitoring the key financial components of the
transition.
It provides certainty and clarity for all stakeholders including the present owners, the future business owners
and those family members not working on the farm.
Final reports
Business Transition Plan - finalised and agreed by all parties
Transaction Schedule - finalised and agreed by all parties
Financial Plan – completed and reviewed by current owners. Following agreement, the Plan is then
implemented
Debt (Finance Facility) Plan - completed and reviewed by future owners. Following agreement, the
Plan is then implemented
Risk Assessment - completed and reviewed by current and future owners. Following agreement, the
Plan is then implemented
This will complete your Business Transition and Continuance Plan2
4. NEW BEGINNING PHASE
Realising Objectives
Following the business transition, both the current and future owners will face a new beginning. They will
need to revaluate their definition of success.
The retiring owners may wish to take that long overdue holiday or spend more time contributing to their
local community.
In this phase of the program your transition payments will be matched against your short, medium and long
term goals.
As an example, your objectives may be:
Short term:
� An overseas holiday
� A new house, on or off the farm
� A caravan or boat

88
Medium term:
� Spend more time playing golf
� Pay regular visits to see the grandchildren
� Become more involved in voluntary community work
Long term:
� Maintain financial security and well being
� Enjoy a good lifestyle
Whatever your dreams and aspirations may be, you should seek support you along the way and help you
achieve your new goals and objectives.
For the new owners, they will want to know that the key elements of their business are being managed
effectively, and will have personal goals and objectives such as wealth creation and work-life balance.
As described earlier, all businesses go through a business life cycle. As the new owner you should establish
where your business currently fits into the business life cycle and how you can successfully move into the
next phase.
Further information and tools for dairy farmers regarding business transitions (including leasing) is available
at The People in Dairy website:
www.thepeopleindairy.org.au
THE NEXT RURAL TEAM
With collective experience of over 90 years in business, accounting and financial services, our principals
bring value adding skills and expertise to our clients across rural Australia from a broad range of business
segments.
Our key Principals, Ric Moffitt, Mark Scanlon and James Benson are recognised throughout Australia for
their expertise and experience in helping hundreds of rural family businesses.
Presenter : Mark Scanlon
T 02 8297 2616
M 0423 685 725
W www.nextrural.com.au
© Copyright 2012
The content contained within this document is the property of Next Rural Pty Ltd (ABN 11 305 622 945) and is not to be reproduced
in whole or part without the express permission o f Next Rural.

89
HANNAM VALE
KEN ATKINS
Dairy farmer, Hannam Vale NSW
Ken and Margaret Atkins milk 160 cows - two thirds Jerseys and the rest Holsteins at Hannam Vale just north
of Taree on the Mid North Coast of NSW.
The farm is on well drained red volcanic soils, with average annual rainfall of 1650mm with summer/autumn
dominance. Even though the farm has a 12 hectare irrigation licence Ken has not had to irrigate for the past
two seasons.
Ken over sows his permanent kikuyu pastures with annual ryegrass on the 95 ha leased property. A further
25 ha is owned nearby for the heifer run.
The Atkins family moved to the farm from the Hunter Valley five years ago and quickly learned to adjust to
managing a large quantity of home grown feed - now accounting for 80% of intake. Ken targets to make at
least 600 round bale silage predominately from annual ryegrass clover pastures.
The base pasture consists of kikuyu which can provide some feed year round. Ken is realistic about the role
of kikuyu as a forage base as he says, “it can be your best friend or worst enemy”.
To achieve the best out of kikuyu Ken maintains a tight rotation when it is growing rapidly and quickly
identifies surpluses to be conserved and taken out of rotation.
Last year production per cow averaged 7,027 litres with a 4.3% fat and 3.5% protein. Production is around 1
million litres per annum.

90
ENERGY EFFICIENCY IN THE DAIRY
NICK BULLOCK
NBA Consulting, NSW
BACKGROUND
Energy costs in NSW have increased by over 60% in NSW over the last 4 years and further increases are
expected. NBA Consulting has worked with over 500 dairy farmers over the last 4 years in NSW and other
states including Western Australia, Queensland and South Australia to:
• benchmark energy costs at the dairy
• identify cost efficient tariffs
• identify costs and savings achievable from a range of energy efficiency upgrades.
In 2007, the Mid North Coast Dairy Advancement Group (DAGs) identified adjusting to climate change as a
major issue for local dairy farmers, particularly in terms of increased costs.
DAGs have a history of helping local farmers with local and relevant issues, and were recognised in 2009 with
the NSW Environment and Landcare Award. The projects have included designs for dairy effluent systems,
access to funding to improve farm infrastructure such as laneways, stock watering systems, workshops on
how to cool cows and minimise the impacts of climate change.
Since 1998, the DAGs have managed several large Natural Resource Management projects that have directly
benefited their farmers. One of these projects Efficient Energy Water and Nutrients on dairy farms (EWEN)
was delivered between 2008 and 2011. EWEN was funded primarily by Caring for our Country and Mid Coast
Water.
The EWEN project has developed an energy audit and assessment procedure to compare and benchmark
energy use at dairies and identify cost effective solutions to improve energy efficiencies: from low cost
checks to equipment upgrades.
The implementation of EWEN has worked in with a NSW Government initiative by Department of Energy
Climate Change and Water: the Efficient Energy for Small Business Program (EESB). The EESB provides
$5,000 in funding to dairy farmers to upgrade electrical equipment on farm to improve energy efficiencies.
ENERGY USE AND COSTS: VARIATIONS ACROSS THE DAIRY INDUSTRY
The audits have included all the energy costs to run the dairy business excluding irrigation: milk cooling, hot
water, milk harvesting, effluent and cleaning, stockwater, feed milling and processing, lights and shed costs.
From the energy audits conducted, the general trend is that larger herds use more energy. However, there is
a large variation in energy use across herd sizes.
Energy costs at the dairy are dependent on the energy consumed and the tariffs paid. Figure 2 shows the
general trend and the spread of actual costs

91
Figure 1: Energy use at the dairy
Data from energy audits carried out in NSW, Queensland, Western Australia and South Australia.
.
Figure 2 Energy Costs

92
To compare costs of energy between farms energy costs in $ per kL milk produced has been adopted
There is significant variation in the cost of energy at the dairy in terms of $ per kL milk produced. A small
portion of this variation is due to different equipment at the dairy: eg some farms mill and mix feed whilst
others buy-in processed feed in the form of pellets or pre-mix; some farms use town water with no
stockwater pumping costs, whilst most farmers have pumping costs for stockwater.
This benchmark can be a useful guide for farmers to start to understand how their costs compare to their
neighbours. The chart can also be used to identify potential energy savings at the dairy: for example, a 200
cow herd with energy costs at $10 / kL milk can potentially save up to $5.0 / kL milk: for production of 1.5
ML/year, a $ 7,500 annual saving.
The two main factors that impact on total energy costs at the dairy are: (i) the tariff structure for each farm
(ii) the energy efficiency of equipment on the farm.
TARIFFS IN NSW
Careful selection of tariffs to match the equipment and timing of operations at the dairy can reduce total
energy costs for the dairy. Tariffs in NSW vary between suppliers and lower tariffs can be negotiated. Many
farmers in NSW have changed to “time of use” meters saving many $1 ,000s of dollars each year.
Whilst low tariffs can result in low annual costs, Figure 3 below shows that even with a low average tariff,
total costs of energy per 1000 L of milk can be high.
Figure 3: Tariff Costs
Average tariff depends on the energy supplier, the amount of off-peak power used, whether time of use
meters are in use and the timing of operations at the dairy.
Example: two farms with average tariff of $ 0.20 / kW-hr (ie low): farm 1 has actual costs of $5.0/ kL milk,
whilst farm 2 has actual costs of $14.0/ kL milk.

93
IMPROVING THE ENERGY EFFICIENCY OF EQUIPMENT AT THE DAIRY.
The EWEN energy assessment provides a reconcilation of actual energy bills for the dairy to the estimated
costs of running the motors and equipment at the dairy. Each dairy audited has an accurate breakdown of
the actual energy costs at the dairy. Figure 4 shows the range of energy use for the main components at the
dairy.
Figure 4: Breakdown of energy use at the dairy
Milk cooling is the highest cost at the dairy and accounts for 40-60% of energy cost of dairy.
Milk harvesting 15-25%; Hot water 10-25%; Other (stockwater, cleaning, feed, shed) 10-25% total
Equipment upgrades have been targeted at the specific breakdown of energy costs for each individual dairy
in the EWEN energy assessment. However, the main three energy uses at the dairy offer the biggest gains in
energy use efficiency: milk cooling, milk harvesting, and hot water.
IMPROVING ENERGY USE EFFICIENCY: ACTIONS IMPLEMENTED
Projects implemented on farm as part of the EWEN project have used existing technology that can be
maintained by local service providers. The EWEN project has monitored with meters actual costs and
benefits of changes made in the dairy and developed a series of case studies and fact sheets based on actual
data. Projects implemented to improve energy efficiencies have included low cost to higher cost actions that
attract a rebate in NSW under the Office of Environment and Heritage (OEH) EESB program.
Milk Cooling:
Low cost actions: correcting flow rate and direction in plate cooler, sourcing the coolest water for the plate
cooler, removing restrictions to airflow through fins at compressor, protect refrigeration unit from direct
sunlight.
Higher cost actions: installation of new more efficient plate coolers, modify existing plate cooler installation
to achieve improved milk to water ratios, increased storage for plate cooler water, off-peak chiller with
underground insulated storage.

94
Hot water:
Low cost actions: check heater elements are wired to correct power supply, check CIP procedures and
storage fill, check thermostat setting, changing anodes and elements, changing to off-peak, reducing the
volume of hot water used.
Higher cost actions: new efficient hot water system, pre-heating with solar, heat exchange unit or heat
pump.
Milk harvesting:
Low cost actions: remove restrictions to airflow at vacuum pump.
Higher cost actions: variable speed drive on either existing vacuum pump (if suitable) or with a new vacuum
pump.
PAYBACK PERIODS
Payback periods are site specific as no two dairies are the same. The range of payback periods for actions
identified by the EWEN audits are shown in Figure 5.
Figure 5: Payback periods for actions identified by energy audit.
Actions identified with long payback periods have generally not been implemented. Typical payback periods
for projects actually implemented have been in the range 2½ to 8 years, not taking into account the NSW
DECCW rebate. If the rebate is taken into account, typical payback periods are 1½ - 5 years.
In NSW approximately 400 audits have been carried out with an uptake rate of 40-50% with the current
rebate program.

95
BROMBIN, VIA WAUCHOPE
LEO AND LUKE CLEARY
Dairy Farmers, Wauchope, NSW
Leo and Luke Cleary were involved in all three aspects of the Efficient, Water, Energy & Nutrient Project
(EWEN) conducted by the Mid Coast Dairy Advancement Group. Through the project efficiency audits were
conducted on irrigation and energy consumption. Whole farm soil testing occurred with a nutrient budget
produced which allowed them to modify fertiliser inputs and incorporate a new dairy effluent plan.
As part of the EWEN Project they changed all the metered power in the dairy, except for water heating, from
normal business tariff to Time of Use tariff. This has saved them more than $5,500 per annum.
BACKGROUND
Leo and Luke Cleary operate a 120 hectare (300 acre) dairy farm at Brombin, near Wauchope. In March
2009, they completed building a new 24-aside swing-over rapid exit dairy to reduce milking times. It took 7½
hours each day to milk 300 cows with the old milking plant.
The new dairy has reduced milking times to six hours per day. Morning milking starts at 5.45 am with cups
off by 8.45 am. The afternoon milking is another three hours from 3 pm to 6 pm. Plant washing takes nine
minutes after each milking.
When the new dairy was installed, Leo and Luke were required to upgrade the power supply to meet current
regulations and safety standards. Polyphase meters were installed, one of which has Time of Use metering
capability. It records kilowatt hours used during the peak, shoulder and off-peak times of the day. The hot
water heaters for the vat and plant wash were wired to a separate polyphase meter operating on the
Controlled 2 (CL2) tariff.
BENEFITS OF THE EWEN PROGRAM
An energy audit of the dairy was conducted on 31st July, 2009. An analysis of power bills for the three month
period from August to November 2009 was also carried out.
Polyphase meters record both the total kilowatt hours used and the time when the electricity is being
consumed. This data can be accurately analysed to determine the power being used during each of the three
periods – peak, shoulder and off-peak. Switching to Time of Use (TOU) tariffs has the potential to save
money. However, the service charge for Time of Use is considerably higher than the normal service charge
and must be taken into account when calculating the savings.
For Leo and Luke, the final analysis showed that nearly 50% of the total power was being used at the dairy
during off-peak times. Even with the extra service charge, considerable savings could be made by changing
to Time of Use tariffs. Since the polyphase, Time of Use capable meter was already installed, all it took was a
phone call to Country Energy to request the tariff change. There was no charge to make the change.
THE BOTTOM LINE
In the 180-day period to 8th February, 2010, Leo and Luke saved $2,755 from their power bill by switching to
the Time of Use tariff from the normal business tariff.

96
THE EPREG - A NON-INVASIVE PREGNANCY DETECTION SYSTEM FOR CATTLE
RICHARD SHEPHARD
HEARD Systems
502/143 York Street, Sydney, NSW, 2000
www.heardsystems.com.au
HEARD Systems Pty Ltd is developing a farmer-operated, cost-effective, real-time, rapid and digital
pregnancy diagnostic system. Diagnostic approaches are novel and are based on physical detection of foetal
cardiac signals (audio and electrical) from patented sensor systems placed against the external surface of the
cow. Pregnancies have been detected from the 5th week of gestation. Current focus is on refinement of
hardware to optimise data capture, signal processing systems to effectively filter captured data and on
detection algorithms for accurate classification of pregnancy status. The objective is for test sensitivity and
specificity to be 95% (or greater) – current performance is approximately 90% for both parameters. Extensive
field-testing is underway as the company seeks performance targets before commercial release.
INTRODUCTION
Pregnancy status of individual cattle is essential management information for commercial beef and dairy
producers. Research and development organisations such as Meat & Livestock Australia and Dairy Australia
strongly recommend the use of pregnancy testing as part of effective management cycles1,2. Current
commercial methods of pregnancy testing rely upon use of a skilled operator/contractor such as a
veterinarian. The commercial cattle industries seek a farmer-operated, cost-effective, real-time, any-time,
rapid and digital pregnancy diagnostic system that does not require extensive operator skill. Such a tool will
help farmers manage individual animals in a timely manner.
Manual pregnancy diagnosis by veterinarians or contractors is mainly via per-rectum examination of cattle.
This task provides (albeit small) risks to the cow and operator of acute physical injury. The trend towards
larger herds and bigger cows has increased the workload for operators and increasing numbers report
repetitive strain injuries. The emergence of specialised rectal ultrasound equipment has reduced the amount
of ‘arm work’ but not eliminated the practice, as manual rectal examination may be necessary to confirm the
absence of a pregnancy or to confirm pregnancies greater than 100 days.
These expert-based methods are essentially ‘bulk buy’ services — applied at the herd level. It is usually not
economical or practical for producers to use these services for individual animals or for small numbers.
Similarly, reliance on a third-party contractor make unscheduled ‘on the spot’ pregnancy diagnosis
impossible for the majority of farmers. The value of individual animals has increased over recent years,
especially for dairy cows. Increasing herd size and greater reliance on employed labour has lifted demand for
both individual animal pregnancy testing and objective herd data gathering.
The ePreg system is digital. Sensor data is processed using an analogue-to-digital converter to allow
mathematical processing of data. Results can therefore be directly integrated into farm management
software systems. The increased uptake of unique whole-of-life digital identification systems (such as NLIS in
Australia) provides opportunity for automated pregnancy data recording. Analogue methods – such as
ultrasound – require manual transfer of results and the associated transcription errors are an
underestimated source of commercial loss for producers. A digital diagnostic system that incorporates a NLIS
tag reader allows direct assignment of pregnancy status to specific animals whilst ‘cow side’. Future releases
of the ePreg are planned to incorporate a RFID tag reader and this capacity.

97
EXISTING MODALITIES
A summary of the practicalities of existing pregnancy testing modalities is provided in Table 12.
Table 12: Practicalities of existing pregnancy diagnosis methods for cattle
Method Operator
skill level
Farmer
convenience
Single animal
use
Universal
test
Accuracy Real
time
E-data Cost
Manual
palpation
High Low Not
economic
Yes High Yes No Mod
Ultra-sound High Low Not
economic
Yes High Yes No Mod
Blood test Mod Mod Not
economic
Yes Variable No Possible High
Milk test Low Mod Not
economic
No Variable No Possible High
IDEAL TEST Low High Economic Yes High Yes Yes Low
An ideal pregnancy diagnostic test is one that can be applied quickly, safely and cost-effectively to female
cattle of any physiological status (dry, lactating) by lay operators who do not require extensive training in the
technique. Results are provided in real time and of sufficient accuracy (status and foetal aging) and in a form
that can be readily integrated with herd management software systems. These principles guide the
development of the ePreg by HEARD Systems. Foetal heart signals were identified as a potential physical
indicator of pregnancy around 2007. This signal has suitable qualities that may support a pregnancy detector
including early onset of cardiac activity (day 35), persistence throughout pregnancy (for live births), dual (or
more) modality (audio and electrical), radiating nature (detectable at an external surface) and characteristic
signal nature (identifiable signal shape and spectral density distribution).
The signal-to-noise ratio (SNR) in data captured using external sensors is low and the desired signal is
typically not visible in plots of raw data. This is one of the reasons why application of various human
diagnostic devices (such as ECGs) on large animals has not been successful in the past. Effective contact
between the sensors and the subject are essential for capture of signal. For the ECG component this requires
effective electrode contact with the cow. This is difficult to achieve on unprepared cow hide using human
electrodes.
Raw data signals can be improved before analysis. Techniques such as filtering (for controlling noise within
set frequency ranges) when combined with electronic gain (to increase signal amplitude) within a circuit of
high resolution (capable of detecting signals with small amplitude) and wide dynamic range (to minimise
clipping) can strip extraneous noise (such as DC common-mode noise) and provide data with acceptable
SNR. HEARD has developed patented circuitry for this purpose. These circuits, when combined with
specialised sensors, have enabled the capture of foetal cardiac signals from pregnant cows from the 5-week
stage onwards.
On-board classification algorithms then process digitised signals to provide a diagnosis in real time and with
sufficient accuracy. Algorithm development and refinement is currently the primary focus of the company.
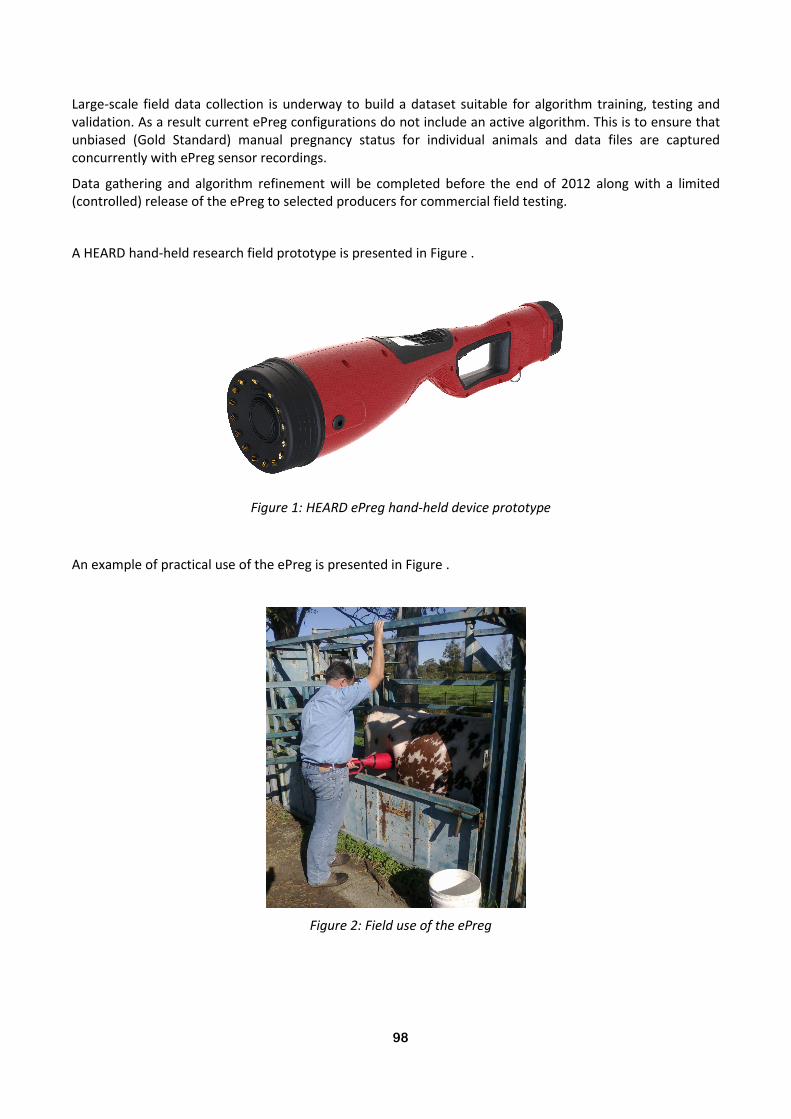
98
Large-scale field data collection is underway to build a dataset suitable for algorithm training, testing and
validation. As a result current ePreg configurations do not include an active algorithm. This is to ensure that
unbiased (Gold Standard) manual pregnancy status for individual animals and data files are captured
concurrently with ePreg sensor recordings.
Data gathering and algorithm refinement will be completed before the end of 2012 along with a limited
(controlled) release of the ePreg to selected producers for commercial field testing.
A HEARD hand-held research field prototype is presented in Figure .
Figure 1: HEARD ePreg hand-held device prototype
An example of practical use of the ePreg is presented in Figure .
Figure 2: Field use of the ePreg

99
CONCLUSIONS
HEARD Systems has been actively involved in development of a farmer-operated, hand-held, rapid, real-
time, cost-effective pregnancy diagnosis tool since 2007. Current focus is on improving the performance of
the diagnostic algorithms (sensitivity, specificity, time required) and on the development of a commercial
product with suitable performance, operator and cost characteristics prior to commercial release.
ACKNOWLEDGEMENTS
HEARD Systems would like to thank Allen & Buckeridge, Meat & Livestock Australia, and Sydney Angels
Nominees for financial assistance.
REFERENCES
Dairy Australia. (2003) ‘The InCalf Book for dairy farmers’. Melbourne: Dairy Australia.
Meat & Livestock Australia. (2004) ‘More Beef from Pastures: The producer's manual, More Beef from
Pastures’. Sydney: Meat & Livestock Australia.
100
USING ULTRASONOGRAPHY ON DAIRY FARMS TO IMPROVE HERD REPRODUCTIVE PERFORMANCE AND IN FOETAL SEXING
DR LUKE INGENHOFF
Veterinary Registrar, Livestock Veterinary Services,
University of Sydney, 410 Werombi Road, Camden NSW 2570
Email: [email protected]
Ultrasonography is being used increasingly by dairy veterinarians to improve herd reproductive performance
and to provide additional services that are beyond the scope of manual palpation. Routine pregnancy testing
from 32 days enables earlier detection of non-pregnant cows while accurate diagnosis of ovarian structures
enables treatment with hormone protocols tailored to the individual cow. When combined with regular
routine visits this technology can be used to help farmers rebreed non-pregnant cows sooner, resulting in
improved 100 day in-calf rates, fewer days to conception and shorter average calving intervals. Ultrasound
can also be used to sex the 58 -100 day bovine foetus.
INTRODUCTION
Good reproductive management is essential to the productivity and profitability of dairy farms. It is widely
recognised that dairy cows have an optimal calving interval of 12 -13 months and therefore a well managed
year-round calving herd will have a target calving interval of less than 400 days. Farms benefit from good
reproductive performance in several ways (Morton et al, 2003):
• A higher proportion of the herd in peak lactation results in higher average daily milk production.
• Fewer excessively fat transition cows results in better dry matter intakes and less negative energy
balance in periparturient cows, less metabolic disease in post-parturient cows and better fertility
during the next lactation. (Good reproductive management this lactation has a bearing on fertility
next lactation).
• Fewer stale cows to dry-off early.
• Fewer cows culled for reproductive reasons enables farmers to cull more low-producing cows and
chronic mastitis cows.
• Increased calving frequency enables dry cow therapy to occur more frequently, increasing the
potential to cure chronic and subclinical mastitis cows.
At Livestock Veterinary Services routine fertility visits occur every 2 - 4 weeks on most year-round calving
farms, but will even occur weekly in the largest herds. When used to scan the uterus and ovaries, ultrasound
is an important tool that allows earlier diagnosis of pregnancy, earlier rebreeding of empty cows and
administration of treatments based on accurate identification of ovarian structures and uterine pathology.
Ultrasound can also be used to sex the 58 – 100 day foetus; a service that is beyond the scope of manual
pregnancy testing.

101
THE 32 DAY PREGNANCY DIAGNOSIS AND ASSESSMENT OF FOETAL VIABILITY
Uterine fluid can first be observed via ultrasound from 26-27 days gestation and therefore it is possible to
diagnose pregnancy from 27 days. In many cows, the early foetus will be located very close to the uterine
wall and between folds in the endometrium (DesCoteaux et al, 2005). This can make it difficult to identify
the foetus and therefore difficult to distinguish between pregnancy and mucometra. As pregnancy
progresses beyond 30 days the volume of fluid present increases, distending the uterus and projecting the
foetus into the lumen of the uterus. This allows for better visibility of the echogenic (white) foetus and
amnion against the contrast of the anechogenic (black) fluid. DesCoteaux et al (2005) reports the predictive
value for a negative pregnancy test at 28 days to be 95%, whereas the predictive value for a negative test
from 31 days is 100%. This reflects the better visibility of the foetus from 31 days.
Cattle can be routinely pregnancy tested at 32 days post-mating. This enables accurate diagnosis to be made
earlier than by manual palpation, while avoiding the need to recheck cows scanned at 27-31 days when
pregnancy may be difficult to distinguish from mucometra. More importantly, earlier diagnosis enables
farmers to rebreed empty cows earlier, which helps to reduce the average number of days from calving to
conception.
Ultrasound also allows the veterinarian to assess foetal viability. Observation of the foetal heart beat by
ultrasound confirms the presence of a live foetus.
Observation of a degenerating foetus may enable embryonic loss to be detected as it is occurring. Again,
this information enables the farmer to induce oestrus and rebreed the cow sooner.
When pregnancy testing cows early, there is a need to remember that late embryonic loss is normal for a
proportion of pregnancies. Walsh et al (2011) estimates that 7% of lactating cows will lose their foetus
between day 24 and day 80, with almost half of these losses occurring between day 28 and day 42. For this
reason, routine fertility visits should also target cows approaching mid-gestation for reconfirmation of
pregnancy. By structuring herd health programs in this manner there is the opportunity to diagnose and
rebreed empty cows as early as possible, while continuing to have a system in place to detect cows in which
late embryonic loss has occurred.
DIAGNOSIS OF OVARIAN STRUCTURES
When a cow is anoestrous or non-pregnant, scanning of her ovaries allows for accurate diagnosis of the
ovarian structures present, allowing the vet to tailor hormonal treatments to the individual cow. In many
circumstances hormone treatments that are inappropriate (given the ovarian structures present) will be
ineffective. For example, prostaglandins induce oestrus by causing luteolysis of a Corpus Luteum (CL). If
there is no CL present, a prostaglandin injection will not induce oestrus.
Scanning may reveal one or more of the following structures:
• Corpus Luteum (CL)
• Follicles
• Follicular Cyst
• Luteal Cyst
• No structure (small anoestrous ovaries)
A large number of treatment protocols have been devised to induce oestrus, synchronise ovulation or treat
ovarian cysts. Table 1 gives examples of appropriate treatment decisions.

102
Table 1. Examples of hormonal treatments appropriate to specific ovarian structures
Structure Appropriate treatment
Corpus Luteum Prostaglandin injection and heat detect
Corpus Luteum Ovsynch (fixed-time AI) if heat detection is poor
Follicles Ovsynch (fixed-time AI)
Follicles Vaginal progestagen-releasing device (eg. CIDR)
Follicular Cyst High dose GnRH
Luteal Cyst High dose GnRH
Luteal Cyst Prostaglandin injection
Anoestrous Vaginal progestagen-releasing device (eg. CIDR)
Anoestrus Time (if cow is still low DIM)
By tailoring treatments to the ovaries of the individual cow, cows can be mated sooner and ineffective
treatments can be avoided.
DIAGNOSIS OF UTERINE PATHOLOGY
Pyometra, endometritis and mucometra can also be detected via ultrasonographic visualisation of exudates
within the uterus.
An endometritis exudate may vary in appearance from isoechoic (grey-white) fluid to hyperechoic material
floating in anechoic fluid (white material surrounded by black fluid). Ultrasound is particularly useful for the
detection of low-grade endometritis, which may go undiagnosed during palpation if there is too little fluid
present to palpate.
Mucometra (excessive mucus) will appear as anechoic fluid in the absence of a foetus, foetal membranes
and placentomes.
The nature of an exudate detected by ultrasound can be confirmed by metricheck or vaginal examination.
FOETAL SEXING
The bovine foetus can be sexed from 58 – 100 days gestation, although 58 – 80 days is optimum.
Within the first 50 days of gestation the male and female foetus are indistinguishable. Between days 50 and
58, the male and female genitalia of the foetus become differentiated as the genital tubercle, urogenital
folds and genital swellings migrate (DesCoteaux et al, 2005).
At day 50, the genital tubercle; a swelling located on the ventral midline of the abdomen begins to migrate.
In the male foetus the genital tubercle migrates cranially toward the umbilicus where it will form the penis.
The surrounding urogenital folds will form the prepuce. Meanwhile the genital swellings migrate
caudomedially to form the scrotum (DesCoteaux et al, 2005).

103
In the female foetus the genital tubercle migrates caudally to the base of the tail where it will form the
clitoris. The surrounding urogenital folds will form the vulval labiae. Meanwhile the genital swellings
atrophy and disappear (DesCoteaux et al, 2005).
The migration of the genital tubercle will be complete at day 58.
On sonographic examination, the male foetus will appear to have a hyperechoic swelling just caudal to the
umbilicus, whereas a female foetus will appear to have a hyperechoic swelling at the base of the tail.
Sexing of the foetus relies on the ability of the ultrasonographer to position the ultrasound probe against the
gravid uterus adjacent to the foetus. As the foetus increases in size and sinks deeper into the abdominal
cavity, it may become more difficult for the ultrasonographer to position the foetus satisfactorily relative to
the ultrasound probe. For this reason sexing should ideally occur at 58 – 80 days.
Curran et al (1989) showed that experienced ultrasonographers can distinguish between the male and
female foetus from day 53, however migration of the genital tubercle is not complete until day 58 and
therefore the disparity between a male and female foetus becomes more obvious from day 58.
REFERENCES
Curran, S., Kastelic, J.P., Ginther, O.J. (1989). Determining Sex of the Bovine Fetus by Ultrasonic Assessment
of the Relative Location of the Genital Tubercle. Animal Reproduction Science, 19, 217-227.
DesCoteaux, L, Carriere, P.D, Durocher, J. (2005) Ultrasonography of the reproductive system of the cow: A 4
languages interactive CD-rom for continuing education of veterinarians. Continuing education services of
the University of Montreal, St-Hyacinthe, Quebec, Canada.
Morton, J., Larcombe, M., Little, S. (ed.) (2003). The InCalf Book for Dairy Farmers, Dairy Australia,
Melbourne.
Walsh, S.W., Williams, E.J., Evans, A.C.O. (2011) A review of the causes of poor fertility in high milk producing
dairy cows. Animal Reproduction Science , 123, 127-138.

104
INVESTIGATION INTO THE CHALLENGES ASSOCIATED WITH REPRODUCTIVE MANAGEMENT ON COMMERCIAL DAIRY FARMS UTILIZING AUTOMATIC MILKING SYSTEMS
DEREK KEEPER
Livestock Veterinary Services, University of Sydney
410 Werombi Road, Camden, NSW 2570.
Email: [email protected]
Automatic Milking Systems (AMS) are a relatively new technology worldwide in pasture based systems,
introduced mainly to combat increasing labour costs within the dairy industry. Much work has been done on
the reproductive management of dairy herds, but it has yet to be seen how much of this work is applicable to
AMS herds in pasture based systems. AMS dairies require the voluntary actions of the cows to present
themselves to the milking unit for milking, which yields variability between cows within a herd in terms of
milk yields and milking frequency. As these systems within Australia are generally incorporated into a
pastured based system, this may create difficulties in terms of heat detection, insemination timing and
decreased reproductive performance relating to increased negative energy balance if milk yield and/or
milking frequency is increased. The purpose of this study is to investigate the reproductive management
procedures in use in AMS dairies within Australia and New Zealand, determine reproductive performance
levels, and determine specific challenges that occur within AMS herds with respect to reproductive
management. Ultimately, finding potential solutions to those challenges will drive the research direction.
INTRODUCTION
The introduction of automatic milking systems
(AMS) first occurred commercially in the
Netherlands in 1992 and within Australia since
2001 (de Koning and Rodenburg 2004). By 2003,
there were over 8000 commercial AMS dairies
worldwide (de Koning 2010) with unpublished
claims that the global number of installations now
exceeds 15,000. At the time of writing there are 16
commercial AMS dairies operating in Australia,
with at least 5 additional systems being installed
(Kerrisk pers. comm.). Worldwide, labour and
lifestyle factors have been among the major
motivators for implementation of AMS technology
on farm (de Koning and Rodenburg 2004). When
taking these drivers into account, saving labour
associated directly with milk harvesting may or may
not result in redeploying that labour to other
aspects of the farm enterprise, including
reproductive management. It is well known that
successful farm businesses are consistently striving
for improved efficiency and productivity. As the
goal of dairy farming is to produce milk efficiently
and profitably, getting cows pregnant efficiently is
an integral step (Senger 2002). If the time to
conception post calving is extended, then potential
milk production declines and profitability is
negatively impacted.
Accurate and timely oestrus detection is necessary
if target calving intervals are to be achieved.
Within a dairy enterprise, oestrus detection
amounts to as much as 30 % of labour costs (Firk et
al. 2002; Sanders 2005). Cattle may show signs of
oestrus at any time during the day or night, and as
such, monitoring for oestrus would ideally take
place continuously. Without detection aids,
monitoring for oestrus behavior 2 to 3 times per
day for a total of 30 minutes results in an accuracy
of detection rate approximating only 12-19% of
cows on heat (Saint-Dizier and Chastant-Maillard
2012). While this type of heat detection alone
seems unfeasible, problems arise from the majority
of herd management tasks now being combined,
leading to less effective monitoring time per cow
(Caraviello et al. 2006). Also, cows in an AMS
system present themselves voluntarily to the
milking unit at varying intervals and frequencies (de

105
Koning 2010). Depending on the timing, methods
and frequency of herd monitoring, this may result
in some cows being consistently missed if
alternative detection methods are not
incorporated. The consequence is that incorrect or
inadequate heat detection leads to
missed/untimely insemination, loss of income due
to calf production, increased cost of semen per
conception and loss of marginal milk yield, as cows
spend more of their lactation in the later and lower
producing stages (Firk et al. 2002; Overton 2006).
While there is potential for oestrus synchronization
programs to alleviate some of this problem, the
voluntary nature of presentation for milking may
make drafting and treatment timing difficult in an
AMS herd. Other automated heat detection
systems may be of benefit, however the costs can
be significant; for example approximately $6000 US
for a pedometer style system, to more than $50000
US for an in line milk progesterone assay per
system, with ongoing disposables costs (Saint-
Dizier and Chastant-Maillard 2012; Roelofs et al.
2010).
Missed or untimely inseminations raise potential
concern in both conventional and AMS dairies.
Work in conventional dairies involving blood or
milk progesterone assays suggest that 5 to 30% of
inseminations occur in cows that are not in heat
(Lima et al. 2009). Others discuss the timing of
insemination as being approximately 12 to 18
hours post peak oestrus activity (Bar 2010; Roelofs
et al 2010). Similar to the difficulties in compliance
of synchronization protocols, if cows are presenting
themselves to the milking unit and are
subsequently drafted for breeding at varying
intervals, there is a reasonable possibility that the
ideal breeding interval will be missed, and
conception rates subsequently lowered. To date,
there has not been any work conducted to
determine practical and feasible le solutions to
ensure timely inseminations are consistently
achieved in pasture based AMS.
Within an AMS herd, milking frequency is another
potentially interesting and complicated issue. As
cows present themselves for milking voluntarily,
there is a potential for a large variation in the
timing and milking frequency of each cow. It is
known that an increase in milking frequency can
result in an increase in milk yields (provided milking
frequency is the most limiting factor) as can be
seen from moving from twice a day milking to
three times a day (Amos et al. 1985). However,
there has been much controversy over whether or
not increasing milk yields result in a decrease in
reproductive performance (Amos et al 1985; Weiss
et al 2004; Senger 2002). While transition to AMS
by a thrice daily milking herd would expect a loss of
5-10% of milk yields (de Koning 2010) a similar
transition with a twice daily milking herd has the
potential to create an increase in milk yields. To
date there is insufficient knowledge to be sure of
the effects the variability in milk yields and milking
frequency will have on overall herd reproductive
performance, nor the effects on individual groups
of cows within the herd.
This study aims to investigate the reproductive
management practices currently used in AMS
dairies within Australasia, determine how well
these practices are working, and identify system
level challenges and/or problem cow
demographics. This will position us to inform
future adopters of the technology of realistic
expectations with regard to achievable
reproductive performance levels and practical
management practices in pasture-based farming
systems. If there are specific challenges that arise
we will investigate the potential for technologies
that are either available or currently in
development that may assist in managing these
challenges.
MATERIALS AND METHODS
The study will be divided into three phases. The
first phase involves conducting a paper survey to
determine what reproductive management
practices are currently employed in AMS dairies,
what changes have occurred recently been
implemented on farm, and what challenges have
been encountered. This phase will also survey
conventional (i.e. non-robotic) dairies in
corresponding regions, to determine if changes in
management that have occurred have been specific
to AMS dairies, or if they are general trends within
regions, or within the wider Australian dairy
industry.
The second phase involves quantitative evaluation
of reproductive performance within commercial
AMS herds. This will provide insight into the levels
of performance being achieved in AMS dairies, and
highlight potential problem areas that may be
causing issues (for example heat detection or

106
conception rates through timing of insemination,
challenges associated with bull management etc).
Analyzing the data with respect to demographics
will determine “at-risk” groups of cows, which may
assist in development of best-practice guidelines,
which are likely to help improve reproductive
performance on farm. Potential “at-risk” groups
could include cows that milk at a particular
frequency (as their presentation to the milking unit
is voluntary), or cows eating over or under a
particular level of supplements.
The final phase will involve assessment of the
results and available/developing technologies to
determine methods of addressing or improving
specific challenges that arise through the first two
studies.
The results of these studies will be published in
scientific journals and be presented to scientific
audiences. They will also be used in presentations
and fact sheets to the dairy industry to assist
producers in avoiding or dealing with challenges
that arise in reproductive management of AMS
dairies, thereby making the transition to this
technology more streamlined and helping to
ensure high levels of farm productivity can be
achieved.
ACKNOWLEDGMENTS
The author would like to acknowledge the
assistance and support of the FutureDairy Project
and its investors (DeLaval, NSW Department of
Primary Industries, The University of Sydney and
Dairy Australia) and The University of Sydney
Livestock Veterinary Services Unit.
REFERENCES
Amos, H.E., Kiser, T., and Loewenstein, M. (1985)
Influence of Milking Frequency on Productive and
Reproductive Efficiencies of Dairy Cows. Journal of
Dairy Science, 68:3, 732-739.
Caraviello,D.Z., Weigel, K. A., Fricke, P. M.,
Wiltbank, M. C., Florent, M. J. , Cook, N. B.,
Nordlund, K. V., Zwald, N. R., and Rawson C. L.
(2006) Survey of Management Practices on
Reproductive Performance of Dairy Cattle on Large
US Commercial Farms. Journal of Dairy Science, 89,
4723–4735.
De Koning, K and Rodenburg, J (2004) Automatic
Milking: State of the Art in Europe and North
America. In A Better Understanding: Automatic
Milking. Wageningen, the Netherlands, 27-37.
De Koning, C. J.A. M. (2010) Automatic Milking –
Common Practice on Dairy Farms. Proceedings of
The First North American Conference on Precision
Dairy Management
http://www.precisiondairy2010.com/conferencepr
oceedings.htm
Firk, R., Stamer, E., Junge, W., Krieter, J. (2002)
Automation of oestrus detection in dairy cows: a
review. Livestock Production Science. 219-232.
Lima, F.S., Risco, C.A., Thatcher, M.J., Benzaquen,
M.E., Archbald, L.F., Santos, J.E.P., and Thatcher,
W.W. (2009) Comparison of Reproductive
Performance in Lactating Dairy Cows Bred by
Natural Service or Timed Artificial Insemination.
Journal of Diary Science, 92, 5456-5466.
Overton, M. W. (2006) Cash Flows of Instituting
Reproductive Programs: Cost vs Reward. The AABP
proceedings, 39, 181-188.
PL Senger, (2002) Fertility Factors: Which Ones Are
Really Important? AABP proceedings, 35, 112-123
Roelofs, J., Lopez-Gatius, F., Hunter, R. H. F., van
Eerdenburg, F. J. C. M., Hanzen, C. (2010) When is a
cow in estrus? Clinical and practical aspects.
Theriogenology, 74, 327-344.
Saint-Dizier, M. And Chastant-Maillard, S. (2012)
Towards an Automated Detection of Oestrus in
dairy Cattle. Reproduction in Domestic Animals.
(Online release prior to publication)
http://onlinelibrary.wiley.com/doi/10.1111/j.1439-
0531.2011.01971.x
Sanders, D. E. (2005) Troubleshooting Poor
Reproductive Performance in Large Herds.
Veterinary Clinics of North America, Food Animal
Practice, 21, 289-304.
Weiss, D., Reist, M., and Bruckmaier, R.M. (2004)
The Acyclic Period Postpartum in Automatic and
Conventional Milking. Journal of Veterinary
Medicine, 51, 268-272.

107
SUPPLEMENTATION OF HAND-REARED NEONATAL CALVES WITH NUCLEOTIDES AND EFFECTS ON GROWTH, HEALTH AND IMMUNITY
CLAIRE KENTLER
La Trobe University
Bundoora, Victoria, 3086
Calf morbidity and mortality in the dairy industry result in significant economic losses in terms of treatment
and management of sick calves and potential production losses at maturity. Diarrhoea is a common health
problem in young calves and causes severe water loss, resulting in rapid health decline and death. Nucleotide
supplementation has been shown to reduce diarrhoea and improve growth and aspects of immunity in
infants and other species. This study aimed to investigate effects of nucleotide supplementation of calf milk
replacer with mixed nucleotides at a rate of 2g/day on health and immunity in Friesian bull calves hand-
reared to 2 weeks of age. There was no effect of nucleotides on calf growth, health or the overall incidence of
diarrhoea throughout the study. However, the incidence of severe, watery diarrhoea was significantly
reduced in nucleotide supplemented calves in comparison to control calves. There were also no differences in
immune parameters measured between treatments. Numbers and types of circulating leukocytes and serum
IgG concentration were similar between treatment groups throughout the study. A beneficial effect of
nucleotide supplementation on immunity was not evident in 2-week old neonatal dairy calves, except for the
reduction in the incidence of watery faeces.
INTRODUCTION
Mortality rates in Australian dairy calves are
between 2 and 10%, (Moran, 2002) and rates of
morbidity are much higher. Whilst calf deaths
represent an obvious economic and industry cost,
recent evidence has also shown that a reduction in
health and nutrition early in life can affect heifer
productivity upon herd entry (Svensson & Hultgren,
2008). It is therefore imperative for the industry to
have the ability to rear cost-effective, healthy,
productive calves (Place, Heinrichs, & Erb, 1998).
Diarrhoea caused by enteric pathogens is a
significant problem in Australian dairy herds (Izzo,
et al., 2011) and is still the biggest cause of
morbidity and mortality in neonatal calves (Foster
& Smith, 2009). An ability to reduce diarrhoea
incidence, or at least reduce the severity of the
disease would therefore significantly improve calf
health outcomes and economy on-farm.
Nucleotides are semi-essential nutrients found in
relative abundance in bovine colostrum (Gil &
Sanchez-Medina, 1981), but their concentration in
milk replacers is usually low (Kehoe, et al. 2008).
Supplementation of infant formula with
nucleotides has been shown to improve growth
(Cosgrove, et al., 1996), reduce diarrhoea incidence
(Brunser, et al. 1994) and improve immunity
(Carver et al, 1991).
Two recent studies in calves (Kehoe, et al., 2008;
Mashiko, et al., 2009) have shown conflicting
results for the benefits of nucleotide
supplementation. Kehoe, et al. (2008) showed
positive effects on severity of diarrhoea at 2 – 4
weeks of age, as well as a reduction in the number
of treatments for disease during the pre-weaning
period when calves were supplemented with
nucleotides containing a mixture of adenine,
cytosine and uridine. These authors did not observe
any effects on immunity (Kehoe, et al., 2008). In
contrast, Mashiko, et al. (Mashiko, et al., 2009) did
not record specific effects on calf health with
supplementation of uridine only, but observed
positive effects on mucosal and innate immunity in
calves supplemented from 4 days of age to 11 or 56
days of age.
Mashiko, et al. (2009) used a much higher rate of
supplementation (2g/day) than Kehoe, et al. (2008)
(approximately 175mg/L) and as such the observed
effects may be a dose response to the rate of
supplementation, or a difference in the action of
108
mixed versus single nucleotides. However, given
that Kehoe, et al. (2008) observed effects on
diarrhoea with much lower concentrations of
mixed nucleotides, it is useful to investigate this
dose response further. This study, therefore, aimed
to examine the effects of mixed nucleotide
supplementation at a rate of 2g/day of neonatal
dairy calves to 2 weeks of age on calf growth,
health, serum IgG concentration and numbers of
circulating leukocytes.
MATERIALS AND METHODS
Thirty-two purebred Friesian bull calves were
obtained at 2-5 days of age from the Dept Primary
Industries (DPI) Vic. Ellinbank Centre between July
and September 2008.
Calves were hand-reared on the La Trobe
University Agricultural Reserve (Bundoora, Victoria)
in a naturally ventilated Ecoshelter (Redpath
Ecoshelters®, Bendigo East, Victoria, Australia), in
group pens (3 calves/pen, approximately 2.5 x 3m)
for 2 weeks. Calves were fed Veanavite Full Cream
Extra (Rivalea Australia, Corowa, N.S.W.) calf milk
replacer (CMR) twice daily at approximately 0800
and 1600 hours in individual feeders. Water, oaten
hay and calf meal (Southern Livestock Nutrition,
Murgheboluc, Victoria, Australia) were available ad
libitum throughout the study.
Calves were randomly assigned to control (CON, N
= 16) or nucleotide (NUCL, N = 16) groups,
commencing treatment at 5 days of age. CON
calves were fed CMR only throughout the rearing
period and NUCL calves were fed CMR plus 2/g day
(1g/feed) of Ascogen™ (Chemoforma, Augst,
Switzerland); a commercial preparation of mixed
nucleotides.
Calves were monitored daily and assigned health
scores for feeding and other behaviours, rectal
temperature, eye and nasal discharge, coughing
and faecal consistency. The percentage of study
days on which calves presented with different
scores were calculated for analysis, with a focus in
this study on the percentage of study days on
which calves presented with diarrhoea or abnormal
faecal consistency. Calves were weighed at
commencement of the study and again at 10 and
12 – 14 days of age. Blood samples were taken by
jugular venipuncture at 5, 10 and 13 – 14 days of
age.
Serum samples were collected from blood clotted
for 24 hours at 4˚C and centrifuged at 3000 x g for
15 minutes. IgG concentration was measured by
capture-ELISA using a Bovine IgG ELISA
Quantitation Kit (Bethyl Laboratories Inc.,
Montogomery, TX, USA). Total leukocyte counts
were completed using whole blood within 48 hours
of collection. Differential counts were completed
under oil immersion with Giemsa-stained whole
blood smears (made within 12 hours of collection).
Statistical differences between groups were
determined with IBM SPSS Statistics 19.0
(‘GradPack’, IBM Corporation, Somers, NY, USA).
Data was tested first for normality and where
violation occurred, data was analysed using a
Mann-Whitney U Test. ‘Normal’ data was analysed
with an Independent Samples T-Test. Data was
significant when p < 0.05.
RESULTS
Weight gains of both CON (3.2 ± 0.8% of initial
liveweight) and NUCL (4.7 ± 0.9% of initial
liveweight) groups were similar over the 2 week
rearing period and there were no differences in
liveweight at any age. Supplementation with
nucleotides had no effect on the incidence of
moderately high (39.4 – 39.9˚C) rectal
temperatures (3.7 ± 1.7% in CON and 5.9 ± 3.3% in
NUCL calves). No calves from either group
presented with temperatures above 39.9˚C
throughout the study. There were no differences
between treatments in calf behaviour, eye and
nasal discharge, or coughing.

109
Figure 1: Incidence of abnormal faecal consistency
(% study days) in Friesian bull calves hand-reared
from 5 days to 2 weeks of age with CMR only
(CON), or CMR supplemented with nucleotides at
2g/day (NUCL) (means ± SEM, different letters
represent significant differences at p < 0.01)
There were no differences between groups in the
percentage of days calves presented with (normal
or) abnormal faecal consistency. However, the
percentage of days calves presented with watery
faeces, (indicative of severe diarrhea) was
significantly (p = 0.005) reduced in NUCL calves (2.1
± 1.5%) in comparison to CON calves (11.7 ± 3.3%)
(Figure 1).
Figure 2 shows the decline in serum IgG
concentration to be similar in both CON (-8.6 ±
2.7mg/ml) and NUCL (-4.2 ± 1.0mg/ml) groups from
5 to 13 – 14 days of age. No differences between
groups were observed at 5, 10 or 13 – 14 days of
age.
Figure 2: Serum IgG concentration (mg/ml) in
Friesian bull calves hand-reared from 5 days to 2
weeks of age with CMR only (CON), or CMR
supplemented with nucleotides at 2g/day (NUCL)
(means ± SEM)
Total numbers of leukocytes were similar between
CON (range: 68.3 ± 5.9 – 81.5 ± 8.3 x10⁵ cells/ml
whole blood) and NUCL (range: 65.7 ± 7.1 – 89.7 ±
8.8 x10⁵ cells/ml whole blood) calves at 5, 10 and
13 – 14 days of age (Table 1). Similarly, numbers of
lymphocytes, monocytes, neutrophils, basophils
and eosinophils did not differ between groups at 5,
10, or 13 – 14 days of age (Table 1). Subsequently,
neutrophil to lymphocyte ratios were similar
throughout the study, ranging from 0.3 ± 0.1– 0.4 ±
0.1 in CON calves and 0.3 ± 0.0 – 0.7 ± 0.2 in NUCL
calves.
DISCUSSION
Age (in days)
Treatment Group
Total Leukocytes
(x105/ml whole blood)
Lymphocytes
(%) Monocytes
(%) Neutrophils
(%) Basophils
(%) Eosinophils
(%)
5 CON 68.3 ± 5.9 74.5 ± 3.4 6.1 ± 0.9 19.0 ± 3.1 0.1 ± 0.1 0.4 ± 0.2
NUCL 65.7 ± 7.1 71.4 ± 3.0 8.4 ± 1.1 17.0 ± 1.9 0.1 ± 0.1 0.3 ± 0.2
10 CON* 81.5 ± 8.3 66.6 ± 2.5 5.7 ± 1.1 27.7 ± 2.6 0.0 ± 0.0 0.0 ± 0.0
NUCL 82.8 ± 8.6 61.9 ± 4.3 5.0 ± 1.0 33.1 ± 4.8 0.0 ± 0.0 0.2 ± 0.1
13 - 14 CON 73.1 ± 7.2 77.2 ± 3.2 4.6 ± 0.9 18.1 ± 3.3 0.1 ± 0.1 0.1 ± 0.1
NUCL 89.7 ± 8.8 72.6 ± 2.9 5.9 ± 1.3 21.3 ± 3.2 0.0 ± 0.0 0.3 ± 0.1
Table 1: Total leukocytes (x105/ml whole blood) and percentage of cells per differential leukocyte subset in
whole blood of Friesian bull calves hand-reared from 5 days to 2 weeks of age with commercial CMR without
additives (CON) or CMR supplemented with nucleotides at 2g/day (NUCL) (means ± SEM) *N = 15

110
Although contrary to previous work in infants
(Brunser, et al., 1994; Carver, et al., 1991;
Cosgrove, et al., 1996) where nucleotides produced
beneficial effects on diarrhoea, immunity and
growth, the lack of effect of nucleotide
supplementation on growth and health parameters
was consistent with previous work in young calves
(Kehoe, et al., 2008; Mashiko, et al., 2009). The
results reported here for improvements in faecal
consistency with dietary supplementation of
2g/day of mixed nucleotides are consistent with
those of Kehoe et al. (2008) using approximately
175mg/L nucleotides in calves aged 2 – 4 weeks.
Those authors also noted an increase in the
persistence of less severe diarrhoea in nucleotide
supplemented calves in comparison to control
calves from birth to weaning (Kehoe, et al., 2008).
This result was reflected in an increase in milk
refusals in nucleotide supplemented calves, but a
decrease in disease treatment. This indicated less
severe, but more prolonged disease in the
nucleotide calves (Kehoe, et al., 2008). Whilst
there are obvious advantages in terms of reduction
in labour and economic costs (and antibiotic use) to
not having to treat sick calves, the effects of long-
term subclinical disease on animal welfare and
productivity in comparison to acute bouts of more
severe infection have not been adequately
addressed. Although there was no difference in
milk refusals in the current study, it is important to
note that no differences were observed between
groups for the overall incidence of abnormal faecal
consistency, which may reflect similar patterns of
low-grade infection to Kehoe, et al.’s (2008) work.
In comparison to the immune parameters
measured in this study, in which no significant
treatment effects were found, Mashiko et al.
(2009) using purified uridine at the same rate of
supplementation did show significant increases in
immune responses. Concentration of secretory IgA
(sIgA) at the mucosal surface of the ileum of
nucleotide supplemented calves was almost double
that of control calves at 24 days of age when calves
had been supplemented from 1 – 11 days of age
(Mashiko, et al., 2009). This suggests that whilst
supplementation may have no effect on circulating
antibody concentration (such as serum IgG
measured here and by Kehoe et al. (2008)), innate
immunity may be stimulated.
Such an effect in terms of numbers of circulating
leukocytes was not observed here. However,
Mashiko et al. (2009) observed an up-regulation of
a non-specific cellular response to CD3 mitogens in
56 day old calves supplemented for the entire
rearing period, which suggested nucleotides act
most strongly on T-lymphocytes. Considering the
increase in sIgA following supplementation
(Mashiko, et al., 2009), it could also be that
nucleotide supplementation exerts its effects most
strongly in the gut-associated immune system of
calves.
Whilst elucidating the method of action warrants
further research, it is clear that nucleotide
supplementation reduces the severity of diarrhoea
in 2 week old calves.
ACKNOWLEDGEMENTS
The authors gratefully acknowledge the invaluable
support of Mr J Laidlaw and the DPI Ellinbank staff,
as well as that of Mr R Evans at La Trobe University
and the calf rearing assistance of, Ms D Rayment,
Ms J Norrie, Ms N Hellyer, Dr O Tabing, Dr D Delia
and Mr W Kentler.
REFERENCES
Brunser, O., Espinoza, J., Araya, M., Cruchet, S., &
Gil, A. (1994). Effect of dietary nucleotide
supplementation on diarrhoeal disease in infants.
Acta Paediatrica, 83(2), 188-191.
Carver, J. D., Pimentel, B., Cox, W. I., & Barness, L.
A. (1991). Dietary nucleotide effects upon immune
function in infants. Pediatrics, 88(2), 359-363.
Cosgrove, M., Davies, D. P., & Jenkins, H. R. (1996).
Nucleotide supplementation and the growth of
term small for gestational age infants. Archives of
Disease in Childhood Fetal Neonatal Edition, 74(2),
F122-125.
Foster, D. M., & Smith, G. W. (2009).
Pathophysiology of diarrhea in calves. Veterinary
Clinics of North America: Food Animal Practice,
25(1), 13-36, xi.
Gil, A., & Sanchez-Medina, F. (1981). Acid-soluble
nucleotides of cow's, goat's and sheep's milks, at
different stages of lactation. Journal of Dairy
Research, 48(1), 35-44.
Izzo, M. M., Kirkland, P. D., Mohler, V. L., Perkins,
N. R., Gunn, A. A., & House, J. K. (2011). Prevalence
of major enteric pathogens in Australian dairy
111
calves with diarrhoea. Australian Veterinary
Journal, 89(5), 167-173.
Kehoe, S. I., Heinrichs, A. J., Baumrucker, C. R., &
Greger, D. L. (2008). Effects of nucleotide
supplementation in milk replacer on small
intestinal absorptive capacity in dairy calves.
Journal of Dairy Science, 91(7), 2759-2770.
Mashiko, T., Nagafuchi, S., Kanbe, M., Obara, Y.,
Hagawa, Y., Takahashi, T., et al. (2009). Effects of
dietary uridine 5'-monophosphate on immune
responses in newborn calves. Journal of Animal
Science, 87(3), 1042-1047.
Moran, J. (2002). Calf Rearing: a practical guide
(2nd Edition ed.). Collingwood, Vic: CSIRO
Publishing.
Place, N. T., Heinrichs, A. J., & Erb, H. N. (1998). The
effects of disease, management, and nutrition on
average daily gain of dairy heifers from birth to four
months. Journal of Dairy Science, 81(4), 1004-1009.
Svensson, C., & Hultgren, J. (2008). Associations
between housing, management, and morbidity
during rearing and subsequent first-lactation milk
production of dairy cows in southwest Sweden.
Journal of Dairy Science, 91(4), 1510-1518.

112

113
A RETROSPECTIVE STUDY INTO THE ASSOCIATION OF MATERNAL PERICONCEPTIONAL METABOLIC STRESS ON PROGENY PERFORMANCE: THE DAIRY COW PARADIGM EPIGENETICS AND FOETAL PROGRAMMING – THE CAUSE OF FAILING FERTILITY?
HARDY MANSER
Faculty of Veterinary Science,
Sydney University, Camden NSW 2570
Email: [email protected]
Periconceptional developmental programming is likely to have profound implications for the efficiency of
livestock production. The decreasing reproductive performance of Holsteins, due to selection pressure for
high milk yield, is having a significant effect on farm profitability and cow longevity in the herd. It is thought
that an environmental factor (metabolic stress of the dam at conception) may be involved. During early
lactation, dairy cows usually experience metabolic stress, including negative energy balance, especially in
pasture based systems where nutritional intake can be limited or of lesser quality. The mechanism of
periconceptional developmental programming is thought to be epigenetic, where DNA methylation and
histone modification alters the expression of the genes by controlling which sections of DNA are folded to
restrict expression, and which are folded to allow expression.This paper will outline the proposed influence of
the dam’s metabolic status at conception on offspring production which forms the basis of this PhD project. It
is hypothesized that cows that are inseminated during periods of negative metabolic status will produce
offspring who will have a decreased performance in lactation and reproduction.
In a pilot study, calves recorded as being born in December 2009 with complete records for both dam and
offspring (n=29) were assessed for a relationship between dam test day production data at conception, and
offspring reproductive performance as indicated by days to first conception as heifers. No significant
correlation was found, however this is not expected to be indicative of the broader study which will involve
the analysis of data from many thousands of heifers.This study endeavours to highlight the need for tightly
controlled studies where a dam’s metabolic status is accurately measured and regulated. There is also a need
for studies that clearly elucidate the mechanism of action by which the dam’s periconceptional metabolic
stress affect progeny performance. This is hoped to provide real world solutions for the management and
nutritional issues facing the dairy industry in its quest to maximise production and profitability.
BACKGROUND
In recent years a decline in fertility in the Holstein
has been demonstrated along with a massive
increase in production. Holsteins now take a longer
time to return to oestrus, have poorer conception
rates and have an increased rate of early embryo
loss (Roche, et al 2011). But what is the cause of
this failing fertility? Could it be that maternal
nutrition at conception is the answer to solving this
major issue?
Typical demands of a continuous breeding system
require a 365d calving interval which necessitates a
cow to conceive in as short a time as 60 days
postpartum. Whilst this is proving to be
increasingly difficult for the industry to achieve, the
challenge for the dairy cow are numerous and far-
reaching. Conception often occurs during peak
yield and therefore peak metabolic demand when
the cow diverts the majority of nutrients towards
the mammary gland (genetic selection for high milk
yield) (Roche, et al., 2011). Embryo development
might be affected metabolic stress and these

114
effects might become evident only in adult life.
Cows not in peak lactation and heifers are less
metabolically stressed due to the absence of a huge
lactation demand (Kirkland & Gordon, 2001).
Although significant gains have been made in
recent years towards understanding the nutritional
management of the transition period, dairy cows
still commonly experience a negative metabolic
status in early and peak lactation. This is the critical
time for development of both the oocyte and the
embryo. Thus, what are the consequences of
metabolic stress at conception on offspring health,
reproduction and production?
Periconceptional Metabolic Programming
The concept of the mother’s nutrition affecting
performance after birth has been discussed for
decades. Barker showed in humans that offspring
who suffered malnutrition, and were born small
had a higher risk of developing disease as an adult
(Barker, 1995; Godfrey, et al, 1996; Godfrey, et al,
1997). It was proposed that somehow the foetus
was programmed, without alteration to the genes
themselves, to suit its expected environment. This
also possibly benefits the mother by reducing the
metabolic demands of gestation during times of
nutritional stress. In other words babies of a small
birth weight, due to a malnourished gestation,
would go through a catch up growth in an
unexpectedly good nutritional environment. They
fulfill a predisposition to obesity and go on to
suffering from adult onset disease states. This
concept of the ‘thrifty phenotype’ and the
‘developmental origins of adult disease’ was
renamed “the Barker Hypothesis” by the British
medical Journal.
Researchers postulate that this type of
modification to expression occurs with
ramifications outside of chronic disease (Mathers &
McKay, 2009).
Epigenetics
Epigenetics or ‘above genetics’ is a term used to
describe modifications to genetic expression
without altering the genetic code itself, but rather
how the genes are expressed.
There is now substantial evidence that maternal
nutrition at conception alters the genetic
expression and therefore foetal development, thus
providing a probable mechanism of this
periconceptional developmental programming
(PDP) (Leroy, et al., 2011; Mathers & McKay, 2009).
What about dairy cows? Has metabolic stress
during early lactation around conception and
gestation been demonstrated to affect offspring
performance?
There is a paucity of studies in the dairy cow but
observations in sheep indicate that nutrient
restriction during the periconceptional period
altering the methylation status of the DNA at
specific sites, resulting in heavier, fatter and insulin
resistant adult offspring with high blood pressure.
Interestingly this was more obvious in male
offspring (Sinclair, et al., 2007). Complications of
insulin resistance in cattle includes diabetes, fatty
liver syndrome, ketosis, milk fever and infertility
(Sinclair, 2010) If calves are born small because of
malnutrition during gestation, it is thought they
might develop diseases once they start lactating
and they might be culled earlier than calves that
are within normal birth liveweight ranges.
In dairy cows it was found that offspring survival
and performance were negatively affected by
prepartum milk production or related factors
(namely nutrition) experienced as an oocyte,
embryo or foetus (Berry, et al., 2008).
Another study (Pryce, et al, 2002) using dairy cows
suggests there is no effect on daughter
reproductive performance when compared to dam
parity, milk production, dry matter intake or body
condition score (BCS) in the first or second 13 week
postpartum period from the previous parity.
However the dataset used in this study was limited
in number and diversity of management systems.
Maternal body condition during gestation has been
shown to correlate positively with daughter BCS,
non-return rate, and number of inseminations per
conception, therefore suggesting a better fertility
status. Changes to the Dam’s BCS during gestation
did not affect daughter performance significantly
(Banos, et al, 2007).
To the best of our knowledge, there are no studies
that have compared metabolic status at conception
to offspring performance in the dairy cow.

115
Therefore, the purpose of this research is to
establish if a correlation between maternal
periconceptional nutritional status and offspring
performance exists in dairy cows. This could
provide real solutions for the Australian dairy
industry in its quest to improve reproductive
management of the national herd.
It is hypothesized that maternal periconceptional
metabolic stress will result in a reduced lactational
and reproductive performance in the offspring.
METHODOLOGY
Retrospective confirmation of correlation
The retrospective confirmation of correlation
involves the analysis of reproduction and
production data from daughters and dams in the
Australian Dairy Herd Improvement Scheme
(ADHIS) national database for the period of 2000 to
2011. Data will be extracted for Holstein herds with
a year round, split and seasonal calving systems.
As a pilot study calves born to multiparous dams,
with complete lactation and reproductive records
in December 2009 were selected (n=29). Dams of
offspring were stratified for metabolic status using
production variables including test day Yield, Milk
Protein and Fat at conception, determined by using
a standardized gestation length of 285 days.
A linear interpolation between the two closest test
day records surrounding the calculated date of
conception was adopted. Using univariate linear
regression analysis, an association between
lessened offspring performance (as indicated in the
pilot study by days to first conception) and
maternal periconceptional metabolic status was
assessed.
RESULTS
Figure 1 – Dam conception test day Yield vs.
Offspring Days to first conception
Figure 2 – Dam conception test day protein
percentage vs. Offspring Days to first conception
Figure 3 – Dam conception test day fat percentage
vs. Offspring Days to first conception
Figure 1 illustrates a no significant association
(r2=0.08) between dam test day yield and days to
first conception in the offspring. Similar no
significant relationships between dam test day
protein (r2=0.09) and fat (r2=0.03) levels and
offspring days to conception were observed.

116
DISCUSSION AND CONCLUSION
Whilst these results do not show a significant
correlation between maternal nutritional status at
conception and offspring days to first conception,
only 29 dam daughter pairs were assessed and it is
anticipated that with a wider study of the broader
dataset there will be a positive correlation between
these, as well as other reproductive and production
characteristics of both the dam and offspring.
Further analysis will include multivariate analysis of
metabolic measures such as fat to protein ratio,
days in milk, and stratification of before and after
peak lactation. Inclusion of a large number of herds
will also allow the removal of other influences such
as nutrition, herd genetics, and database record
accuracy.
In addition to the retrospective study, controlled
studies should be undertaken to confirm or rule out
any association.
The advantage of a prospective study is that
maternal metabolic status can be accurately
measured using physiological indicators, once they
are established, as well as having the ability to
regulate nutritional intake. This approach will then
establish a foundation for the investigation of exact
mechanisms involved with the epigenetic alteration
of genetic expression, thereby affecting offspring
reproduction and lactation. If a relationship
between periconceptional metabolic stress and
offspring performance will be proven, it will be
possible to device nutritional intervention to
prevent this from occurring.
Studies are needed to confirm the association and
mechanism of failing fertility and as a result provide
the industry with the knowledge and tools to
address this significant issue.
ACKNOWLEDGMENTS
The authors would like to thank Ian Lean &
Navneet Dhand for the ongoing support and advice
on this project, as well as ADHIS for providing
access to the data.
REFERENCES
Banos,G., Brotherstone, S., & Coffey, M. P. (2007).
Prenatal maternal effects on body condition score,
female fertility, and milk yield of dairy cows. J Dairy
Sci, 90(7), 3490-3499.
Barker, D. J. (1995). Fetal origins of coronary heart
disease. BMJ, 311(6998), 171-174.
Berry, D. P., Lonergan, P., Butler, S. T., Cromie, A.
R., Fair, T., Mossa, F., et al. (2008). Negative
influence of high maternal milk production before
and after conception on offspring survival and milk
production in dairy cattle. J Dairy Sci, 91(1), 329-
337.
Godfrey, K., Robinson, S., Barker, D. J., Osmond, C.,
& Cox, V. (1996). Maternal nutrition in early and
late pregnancy in relation to placental and fetal
growth. BMJ, 312(7028), 410-414.
Godfrey, K. M., Barker, D. J., Robinson, S., &
Osmond, C. (1997). Maternal birthweight and diet
in pregnancy in relation to the infant's thinness at
birth. Br J Obstet Gynaecol, 104(6), 663-667.
Kirkland, R. M., & Gordon, F. J. (2001). The effects
of milk yield and stage of lactation on the
partitioning of nutrients in lactating dairy cows. J
Dairy Sci, 84(1), 233-240.
Leroy, J. L. M. R., Rizos, D., Sturmey, R., Bossaert,
P., Gutierrez-Adan, A., Van Hoeck, V., et al. (2011).
Intrafollicular conditions as a major link between
maternal metabolism and oocyte quality: a focus
on dairy cow fertility. Reproduction, Fertility and
Development, 24(1), 1-12.
Mathers, J. C., & McKay, J. A. (2009). Epigenetics -
potential contribution to fetal programming. Adv
Exp Med Biol, 646, 119-123.
Pryce, J. E., Coffey, M. P., Brotherstone, S. H., &
Woolliams, J. A. (2002). Genetic relationships
between calving interval and body condition score
conditional on milk yield. J Dairy Sci, 85(6), 1590-
1595.
Roche, J. R., Burke, C. R., Meier, S., & Walker, C. G.
(2011). Nutrition × reproduction interaction in
pasture-based systems: is nutrition a factor in
reproductive failure? Animal Production Science,
51(12), 1045-1066.
117
Sinclair, K. D. (2010). Declining fertility, insulin
resistance and fatty acid metabolism in dairy cows.
Acta Scientiae Veterinariae, 38(Supl 2), 545-557.
Sinclair, K. D., Allegrucci, C., Singh, R., Gardner, D.
S., Sebastian, S., Bispham, J., et al. (2007). DNA
methylation, insulin resistance, and blood pressure
in offspring determined by maternal
periconceptional B vitamin and methionine status.
Proc Natl Acad Sci U S A, 104(49), 19351-19356.

118
VALIDATION OF AN ACIDOSIS MODEL
HELEN GOLDER AUniversity of Sydney, Faculty of Veterinary Science,
Camden, N.S.W., 2570.
BSBScibus, Camden, N.S.W., 2570
Email: [email protected]
The lack of consistent techniques to diagnose ruminal acidosis is a major challenge for management of dairy
and feedlot cattle. Developing better diagnostic tools will help farmers and their advisors identify cows and
herds at risk of acidosis. It is important to validate the model that Bramley et al. (2008) developed to define
ruminal acidosis using newly gathered data. The model (Bramley et al., 2008), classified cows into three
categories: 1) acidotic, 2) suboptimal rumen function, or 3) normal. The classification was based on analysis
of rumen volatile fatty acid, lactate, ammonia and pH measures from 800 cows from 100 commercial dairy
herds in Southern Australia. In order to validate the model, measures from five independent carbohydrate
challenge studies were incorporated into the existing dataset and cattle were classified for acidosis status.
Category classifications from the five studies were consistent with anticipated status based on examination
of the raw data, physiological observations and current biological understandings. Our approach can identify
crucial biochemical shifts occurring in the rumen suggesting that it is effective at diagnosing acidosis severity,
which occurs along a continuum of ruminal conditions from mild to severe. Receiver operating characteristic
(ROC) methods showed that valerate (sensitivity = 0.90; specificity = 0.90; area under the curve (AUC) =
0.954) and propionate (sensitivity = 0.93; specificity = 0.87; AUC = 0.955) are key indicators of acidosis status,
while pH taken using stomach tube (sensitivity = 0.68; specificity = 0.84), or rumenocentesis pH (sensitivity =
0.74; specificity = 0.79) are less useful and low milk fat: protein ratio (sensitivity = 0.54; specificity = 0.81) is
not sensitive. Development of a rapid, low-cost cowside test to measure valerate or propionate
concentrations could assist in rapid on-farm diagnosis of acidosis using rumen fluid samples.
INTRODUCTION
Acidosis is a major challenge in dairy and feedlot
cattle worldwide. It is caused by the consumption
of diets high in readily fermentable carbohydrates
such as grain and low in effective fibre which lead
to organic acids exceeding the buffering capacity
of the rumen (Nagaraja and Tigemeyer, 2007).
Acidosis occurs in a range of forms, varying in
severity from very mild, where symptoms can be
subclinical, to peracute resulting in death. The
initial step in treatment and prevention of a
disease is accurate diagnosis of cases with
minimal false positive and negative cases. There
are currently no consistent definitions for the
accurate diagnosis of acidosis. Ruminal pH is often
used; however, there are discrepancies in the
thresholds defining acidosis severity (Nagaraja
and Tigemeyer, 2007). Rumen pH may not be an
accurate indicator of acidosis, this reflects the
daily fluctuations of rumen pH, and that a rumen
sample used may not accurately represent the
entire rumen contents. Bramley et al. (2008)
collected diet, health, production and rumen fluid
data from 800 cows from 100 randomly selected
commercial dairy herds across Southern Australia.
The data was used to create a model by K-Means
cluster and discriminant analysis that classified
cattle based on the rumen pH, individual volatile
fatty acids (VFA), ammonia and D-lactate
concentrations into one of three categories 1)
acidotic, 2) suboptimal rumen function, or 3)
normal. Bramley et al. (2008) also showed the
VFAs valerate and propionate were the most
important variables in acidosis prediction.
The primary objective of this paper was to
examine several different methods to detect
ruminal acidosis for their value as diagnostic tests.

119
We also aimed to validate the acidosis model by
analysing independent studies using the Bramley
model and compare these results with anticipated
acidosis status based on diet composition, clinical
signs and rumen fermentation data.
MATERIALS AND METHODS
Carbohydrate (CHO) Challenge Datasets: Data
from five challenge studies; four from
independent CHO challenge studies conducted
using a similar protocol, and a fifth from a longer
period challenge diet study, were used to validate
the acidosis model. A description of these studies
is briefly outlined here.
Dairy CHO: Thirty Holstein dairy heifers were
randomly allocated to five treatment groups: 1)
control (no grain); 2) grain [triticale fed at 1.2% of
bodyweight (BW)]; 3) grain (0.8% of BW DMI) +
fructose (0.4% of BW DMI); 4) grain (1.2% of BW
DMI) + histidine (6 g/head); and 5) Grain (0.8% of
BW DMI) + fructose (0.4% of BW DMI) + histidine
(6 g/head) in a partial factorial arrangement
(Golder et al. 2012).
Beef CHO: Eighteen beef cattle (9 heifers and 9
steers) were divided into a control (no grain) or
treatment group (1.2% of BW Triticale) (Lawrence,
2010).
Twenty grains: Forty dairy Holstein heifers were
fed 1 of 20 test grains which included: oats (n = 3),
wheat (n = 6), barley (n = 4), triticale (n = 4) and,
sorghum (n = 3) cultivars at 1.2% of BW. Heifers
were re-assigned to a different grain after a 9 day
washout period (n = 4 heifers/grain) (Lean &
Rabiee, 2007a).
Rumen modifiers: Data were pooled from two
similar independent challenge studies. A total of
58 Holstein heifers were allocated to 1 of 14
treatment diets in an incomplete factorial
arrangement. All groups were fed 1.2% of BW
wheat and one of the following rumen modifiers:
1) Grain only, 2) Fermenten (Fe), 3)
Flavophospholipol (FL), 4) Tylosin (T), 5) Monensin
(M), 6) Fe+FL, 7) Fe+T, 8) Fe+M, 9) FL+T, 10) FL+M,
11) T+M, 12) Fe+FL+T, 13) Fe+FL+M, 14) Fe+T+M
(Lean & Rabiee, 2007b). In the four above
datasets, cattle were fed a forage-based diet
during a pre-adaptation period of up to 21 days
followed by an adaptation period where 0.5-1
kg/d of grain was added to the forage-based diet
(4-11 days). A total of five rumen fluid samples
were taken from each cow via a stomach tube.
The first sample was collected 0-5 minutes after
diet consumption, the second 60 minutes later
and 3 subsequent samples at 45-50 minute
intervals.
Grain vs. partial mixed ration (PMR): Twenty
mixed age lactating Holstein cows were allocated
into a control (wheat + silage) or PMR group and
were fed at one of the following rates: 8, 10, 12,
14 or 16 kg DM/d (75:27 cereal grain:forage DM;
n = 2 cows/diet/rate). Rumen samples were
collected via a rumen fistula at 10 time periods at
approximately 2.4 hour intervals over a 24 hour
period.
Validation
Data from each time period of the five
independent studies for rumen pH, ammonia,
individual VFA and D-lactate were added one
independent study and one time period at a time
to the existing Bramley et al. (2008) dataset.
Existing categories were used to determine
categories for the newly added data based on
standardized Z-scores for each variable using
discriminant analysis. A new set of standardized Z-
scores for each variable incorporating the existing
data was calculated (PASW Statistics 18, SPSS Inc.,
Chicago, IL, USA). The process was repeated for
each of the five studies.
Receiver Operating Characteristic (ROC) Curves
The Bramley et al. (2008) dataset was analysed
using ROC methods to estimate the area under
curve (AUC) and determine the diagnostic value of
individual rumen VFA, rumen pH and milk
fat:protein ratio for the detection of ruminal
acidosis in cattle. The ROC analysis provided an
estimation of the sensitivity, specificity, AUC and
cut-off point for each variable. Sensitivity is a
measure of the ability of the diagnostic test to
correctly identify a positive case of acidosis.
Specificity is a measure of the number of false
positives detected by the diagnostic test. The
closer the sensitivity and specificity values are to
1.0 the more reliable the test is. The AUC
measures the ability of the diagnostic test to
discriminate between cattle with or without
ruminal acidosis and ranges from 0.5-1.0 with 1.0

120
representing perfect performance and 0.5 being
of no value. The cut-off point represents a value
for a particular variable with optimized diagnostic
characteristics. The variables that were assessed
in this study were; rumen concentrations of
acetate, butyrate, propionate, valerate, rumen pH
measured by stomach tube or rumenocentesis
and milk fat: protein ratio.
RESULTS
The classification of acidotic cattle using the data
from the five independent carbohydrate studies
was successfully performed. In the Dairy CHO
study 140 out of 150 rumen samples were ranked
as category 2 and 10 rumen samples as category
3. Seven of the 10 category 3 heifers were from
the control group. In the Beef-CHO study, 53 out
of 90 rumen samples were classified as category 2
and 37 rumen samples belonged to category 3. In
the Twenty grains study; rumen samples obtained
from heifers fed triticale and wheat were the
most acidotic and acidotic status over the
sampling time increased. A total of 202 out of 400
rumen samples were classified as category 2 and
198 of rumen samples were considered as
category 3. In the Rumen modifiers study; there
was little variation among the rumen samples
collected from heifers in the 14 different groups,
with 264 out of 295 rumen samples classified as
category 2 and 31 rumen samples classified as
category 3. Data obtained from the Grain versus
PMR study showed that cows became more
acidotic as rate of concentrate increased and
cows in the control group were more acidotic
than the PMR fed cattle. A total of 30 rumen
samples were classified as category 1 (30/200=
15%), 144 were in category 2 (72%) and 26 were
in category 3 (13%). Twenty of the category 1
rumen samples, were from the control group and
25 of the category 1 cows were fed at a rate of 14
or 16 kg/d from either the control or PMR group.
Table 1. Sensitivity (Se), specificity (Sp), area under
the curve (AUC) and cut-off points from receiver
operator curves for the acidosis diagnostic value
of rumen and milk measures. ST = stomach tube
Measure Se Sp AUC Cut-points
Acetate (mM) 0.94 0.27 0.627 36.7
Butyrate
(mM)
0.94 0.20 0.530 5.28
Propionate
(mM)
0.93 0.87 0.955 23.10
Valerate (mM) 0.90 0.90 0.954 1.62
pH
(Stomach
tube)
0.68 0.84 0.801 6.54
pH
(Rumenocent
esis)
0.74 0.79 0.822 5.96
Milk
Fat:Protein
0.54 0.81 0.716 1.02
ROC curves comparing the value of ruminal and
milk parameters as diagnostic tests for acidosis
are shown in Figure 1. Sensitivity, specificity, AUC
and cut point are reported for each variable in
Table 1. Rumen concentrations of acetate and
butyrate had the highest sensitivity; and lowest
specificity. The specificity and AUC of rumen
concentrations of valerate and propionate were
higher than other rumen parameters. Sensitivity
was also high for these variables. The AUC and cut
point for valerate are shown in Figures 2 and 3.
The rumen pH that were measured using stomach
tube and rumenocentesis pH produced lower
values for both sensitivity and specificity than the
VFA. Stomach tube pH had a higher specificity in
comparison to rumenocentesis pH which had a
higher sensitivity. The milk fat to milk protein
ratio was specific but not sensitive. It had an AUC
greater than that of acetate and butyrate but
lower than that of propionate, valerate and pH.
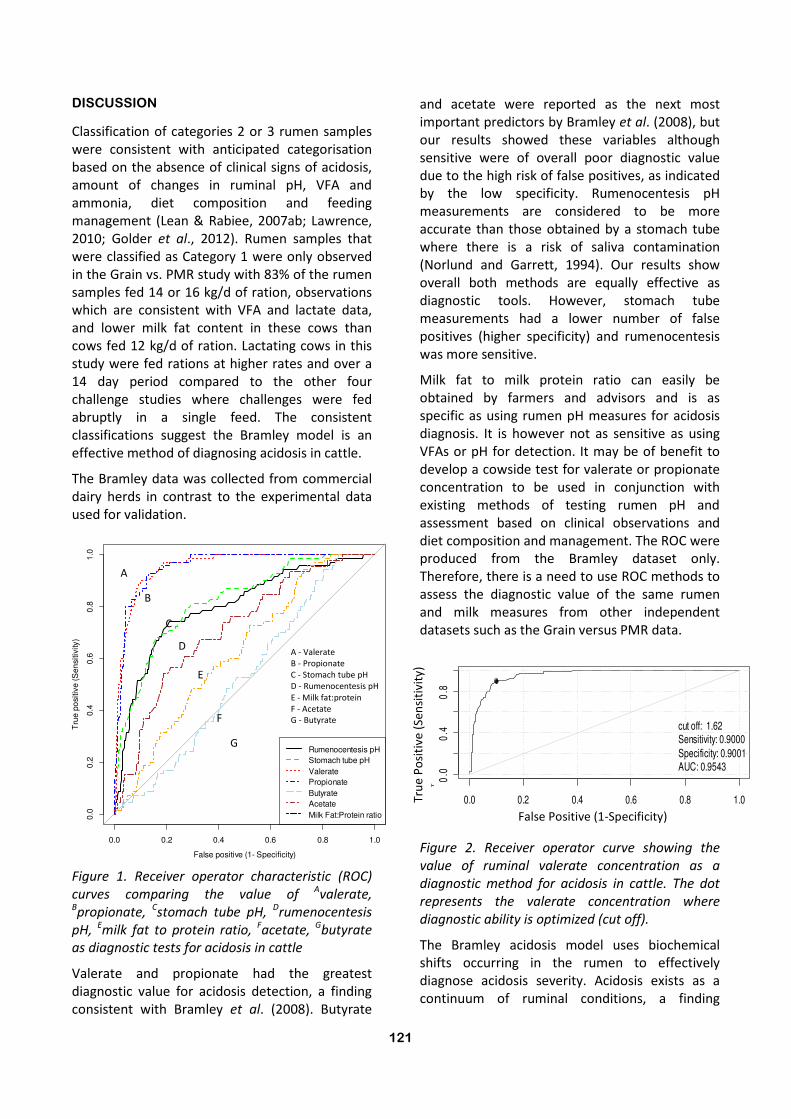
121
DISCUSSION
Classification of categories 2 or 3 rumen samples
were consistent with anticipated categorisation
based on the absence of clinical signs of acidosis,
amount of changes in ruminal pH, VFA and
ammonia, diet composition and feeding
management (Lean & Rabiee, 2007ab; Lawrence,
2010; Golder et al., 2012). Rumen samples that
were classified as Category 1 were only observed
in the Grain vs. PMR study with 83% of the rumen
samples fed 14 or 16 kg/d of ration, observations
which are consistent with VFA and lactate data,
and lower milk fat content in these cows than
cows fed 12 kg/d of ration. Lactating cows in this
study were fed rations at higher rates and over a
14 day period compared to the other four
challenge studies where challenges were fed
abruptly in a single feed. The consistent
classifications suggest the Bramley model is an
effective method of diagnosing acidosis in cattle.
The Bramley data was collected from commercial
dairy herds in contrast to the experimental data
used for validation.
Figure 1. Receiver operator characteristic (ROC)
curves comparing the value of Avalerate, Bpropionate, Cstomach tube pH, Drumenocentesis
pH, Emilk fat to protein ratio, Facetate, Gbutyrate
as diagnostic tests for acidosis in cattle
Valerate and propionate had the greatest
diagnostic value for acidosis detection, a finding
consistent with Bramley et al. (2008). Butyrate
and acetate were reported as the next most
important predictors by Bramley et al. (2008), but
our results showed these variables although
sensitive were of overall poor diagnostic value
due to the high risk of false positives, as indicated
by the low specificity. Rumenocentesis pH
measurements are considered to be more
accurate than those obtained by a stomach tube
where there is a risk of saliva contamination
(Norlund and Garrett, 1994). Our results show
overall both methods are equally effective as
diagnostic tools. However, stomach tube
measurements had a lower number of false
positives (higher specificity) and rumenocentesis
was more sensitive.
Milk fat to milk protein ratio can easily be
obtained by farmers and advisors and is as
specific as using rumen pH measures for acidosis
diagnosis. It is however not as sensitive as using
VFAs or pH for detection. It may be of benefit to
develop a cowside test for valerate or propionate
concentration to be used in conjunction with
existing methods of testing rumen pH and
assessment based on clinical observations and
diet composition and management. The ROC were
produced from the Bramley dataset only.
Therefore, there is a need to use ROC methods to
assess the diagnostic value of the same rumen
and milk measures from other independent
datasets such as the Grain versus PMR data.
Figure 2. Receiver operator curve showing the
value of ruminal valerate concentration as a
diagnostic method for acidosis in cattle. The dot
represents the valerate concentration where
diagnostic ability is optimized (cut off).
The Bramley acidosis model uses biochemical
shifts occurring in the rumen to effectively
diagnose acidosis severity. Acidosis exists as a
continuum of ruminal conditions, a finding
0.0 0.2 0.4 0.6 0.8 1.0
0.0
0.4
0.8
cut off: 1.62Sensitivity: 0.9000
Specificity: 0.9001AUC: 0.9543
T
A - Valerate B - Propionate C - Stomach tube pH D - Rumenocentesis pH E - Milk fat:protein F - Acetate G - Butyrate
False positive (1- Specificity)
Tru
e p
osi
tive (
Sen
sitivi
ty)
0.0
0.2
0.4
0.6
0.8
1.0
0.0 0.2 0.4 0.6 0.8 1.0
Rumenocentesis pH
Stomach tube pH
Valerate
Propionate
Butyrate
Acetate
Milk Fat:Protein ratio
A C B
D E
F G
Tru
e P
osi
tive
(S
en
siti
vity
)
False Positive (1-Specificity)

122
reflected in the challenge studies. Further
validation from acute CHO challenges and
commercial farms will provide additional insights
to the causes and means of preventing acidosis.
Valerate and propionate have potential for
development into cowside tests for acidosis. Milk
fat to protein ratios have value in identifying cows
at risk of acidosis. While a cow with a low
fat:protein test may not be acidotic, an acidotic
cow is very likely to have a low fat:protein ratio.
This test is as effective in terms of specificity as
ruminal pH samples.
Figure 3. Two-graph receiver operator
characteristic (ROC) curve for ruminal valerate
concentration. The intersect represents the
valerate concentration where diagnostic ability is
optimized (cut off)
REFERENCES
Bramley, E., Lean, I. J., Fulkerson, W. J.,
Stevenson, M. A., Rabiee, A. R., & Costa. N. D.
(2008). The definition of acidosis in dairy herds
predominantly fed on pasture and concentrates.
Journal of Dairy Science, 91,308-321.
Golder, H. M., Celi, P., Rabiee, A. R., Heuer, C.,
Bramley, E., Miller, S. W., King, R., & Lean, I. J.
(2012). Effects of grain, fructose and histidine on
ruminal pH and fermentation products during an
induced subacute acidosis protocol. Journal of
Dairy Science, 95, 1971-1982.
Lawrence, K. (2010). Investigation of rumen
fermentation products and histamine in cattle
induced with acidosis. Honours thesis. Murdoch
University.
Lean, I. J. & Rabiee, A. (2007a). Effect of Feeding
Grain on Ruminal Acidosis in Cattle: Validation of
an NIR Index. Report to Dairy Australia.
Lean, I. J, & Rabiee, A. R. (2007b). Effects of
Flavomycin, Tylosin, Monensin & Fermenten on
ruminal fermentation in young dairy cattle during
an induced acidosis. Report to Dairy Australia.
Nagaraja, T. G. & Titgemeyer E. C. (2007). Ruminal
acidosis in beef cattle: The current microbiological
and nutritional outlook. Journal of Dairy Science,
90,E17-E38.
Nordlund, K. V. & Garrett, E. F. (1994).
Rumenocentesis: A technique for collecting
rumen fluid for the diagnosis of subacute rumen
acidosis in dairy herds. Bovine Practitioner
28:109-112.
0 2 4 6 8
0.0
0.4
0.8
SeSpInc limits
Se conf. bandSp conf. band
Sen
siti
vity
& S
pe
cifi
city
Valerate (mM)
Sen
siti
vity
& S
pe
cifi
city
Valerate (mM)

123
CHARACTERISTICS OF EXTENDED LACTATION AND PERSISTENCY IN AUSTRALIAN DAIRY COWS
MARY ABDELSAYED
Reprogen Animal BioScience group,
Faculty of Veterinary Science,
University of Sydney, Camden, NSW, 2570.
Email: [email protected]
Extended lactation is a novel aspect for the dairy industry as it takes the period for which cows are milked
from standard 305 day lactation to an open ended (longer) lactation as long as cows remain productive.
Extending lactation has been used as a management tool to manage the decreasing fertility problem seen in
some of the Australian dairy herds and retain high milking cows for longer, resulting in healthier, more
productive cows and increasing profit for the dairy producer. The aim of this research is to understand the
variation that exists between Australian dairy cattle in their milk yield profiles (lactation curves) over an
extended lactation and obtain derived traits that could be used in the genetic analysis. The Wood model was
fitted to milk yield records from a random subset of 6,022 pure Holstein cows with 250,929 test day records
to obtain parameters which describe the different shapes of lactation curves. Two traits of interest, namely
persistency and extended lactation were quantified and relevant descriptive parameters derived. Variation
among cows in their abilities to maintain high production over a longer period of time was evident with all
measures expressing a high degree of variation (CV range 8%-75%). An average representation of the shape
of the lactation curve seen in Australian dairy cows has been presented based on the Wood model
parameters obtained. Findings showed that milk production during extended lactation phase (from day 305
to day 610 of lactation) is on average 40% of the production of day 305 (standard lactation) with an average
milk yield over the extended lactation of 8,968 L. The derived traits and Wood model parameters obtained
will now be utilised in the estimation of genetic parameters and breeding values for extended lactation traits.
This research will provide dairy farmers with a breeding tool to select cows that are best suited to milk for
longer than the traditional 305 days.
INTRODUCTION
There has been a shift especially in Victoria
Australia for herds having a seasonally
concentrated calving pattern (63%) in 2004 to
41% in 2006 (Auldist et al., 2007; Grainger et al.,
2009). The reason for such a shift is from
improved feeding of cows and the introduction of
new germplasm from North American Holstein
Friesian animals into some Australian dairy herds.
Such impacts have resulted in an increase in the
genetic potential of cows to produce more milk,
while at the same time causing a decrease in
reproductive performance largely as a
consequence of changes in metabolic and
physiological requirements of being milked. The
result is an ongoing trend of cows being milked
beyond the traditional 305 day system as a
management tool to manage decreasing fertility
and retain super milking cows for longer, resulting
in healthier, more productive cows and more
profit for the dairy producer.
Lactation curve models are useful tools in helping
to define and estimate lactation characteristics of
individual cows for genetic selection (Dekkers et
al., 1998; VanRaden et al., 2006), predicting milk
yields and milk components, analyse responses of
yield to environmental and management changes,
and identify opportunities for maximising net
value effectively (Dematawewa et al., 2007;
Dijkstra et al., 2010). Thus a fundamental aspect
of evaluating extended lactation is the modelling
of extended lactation and persistency traits in
Australian dairy cattle based on industry herd
recording data.
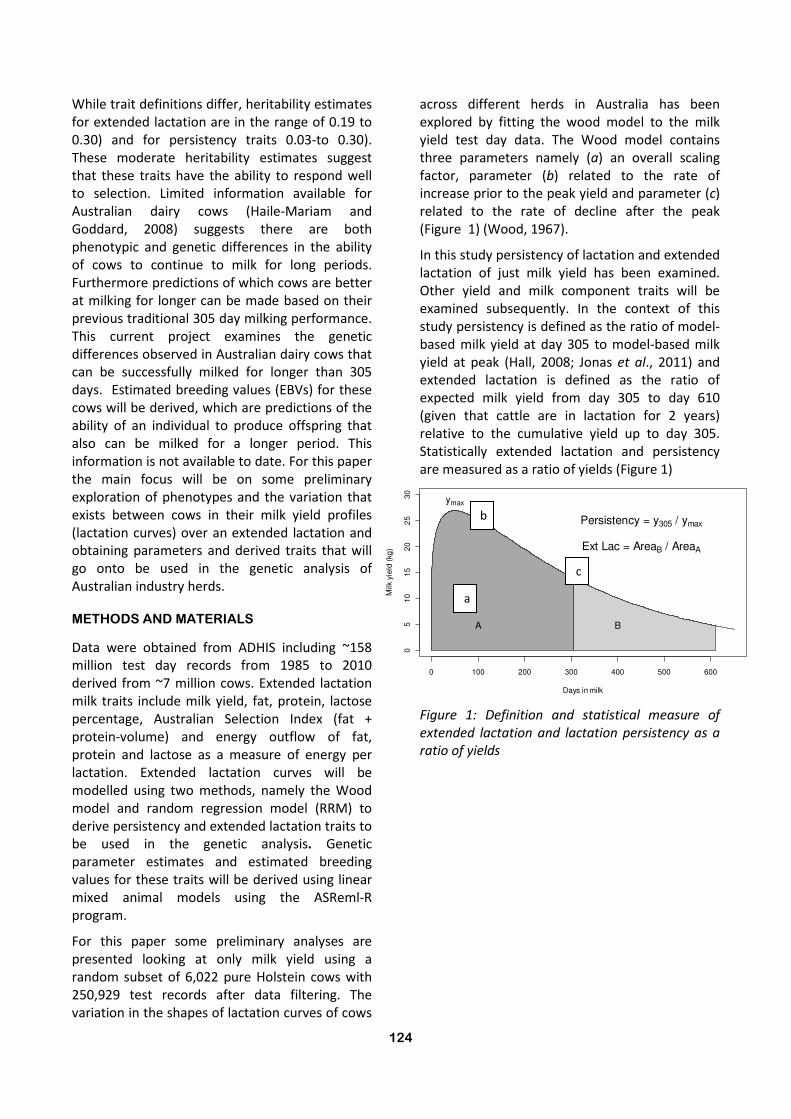
124
While trait definitions differ, heritability estimates
for extended lactation are in the range of 0.19 to
0.30) and for persistency traits 0.03-to 0.30).
These moderate heritability estimates suggest
that these traits have the ability to respond well
to selection. Limited information available for
Australian dairy cows (Haile-Mariam and
Goddard, 2008) suggests there are both
phenotypic and genetic differences in the ability
of cows to continue to milk for long periods.
Furthermore predictions of which cows are better
at milking for longer can be made based on their
previous traditional 305 day milking performance.
This current project examines the genetic
differences observed in Australian dairy cows that
can be successfully milked for longer than 305
days. Estimated breeding values (EBVs) for these
cows will be derived, which are predictions of the
ability of an individual to produce offspring that
also can be milked for a longer period. This
information is not available to date. For this paper
the main focus will be on some preliminary
exploration of phenotypes and the variation that
exists between cows in their milk yield profiles
(lactation curves) over an extended lactation and
obtaining parameters and derived traits that will
go onto be used in the genetic analysis of
Australian industry herds.
METHODS AND MATERIALS
Data were obtained from ADHIS including ~158
million test day records from 1985 to 2010
derived from ~7 million cows. Extended lactation
milk traits include milk yield, fat, protein, lactose
percentage, Australian Selection Index (fat +
protein-volume) and energy outflow of fat,
protein and lactose as a measure of energy per
lactation. Extended lactation curves will be
modelled using two methods, namely the Wood
model and random regression model (RRM) to
derive persistency and extended lactation traits to
be used in the genetic analysis. Genetic
parameter estimates and estimated breeding
values for these traits will be derived using linear
mixed animal models using the ASReml-R
program.
For this paper some preliminary analyses are
presented looking at only milk yield using a
random subset of 6,022 pure Holstein cows with
250,929 test records after data filtering. The
variation in the shapes of lactation curves of cows
across different herds in Australia has been
explored by fitting the wood model to the milk
yield test day data. The Wood model contains
three parameters namely (a) an overall scaling
factor, parameter (b) related to the rate of
increase prior to the peak yield and parameter (c)
related to the rate of decline after the peak
(Figure 1) (Wood, 1967).
In this study persistency of lactation and extended
lactation of just milk yield has been examined.
Other yield and milk component traits will be
examined subsequently. In the context of this
study persistency is defined as the ratio of model-
based milk yield at day 305 to model-based milk
yield at peak (Hall, 2008; Jonas et al., 2011) and
extended lactation is defined as the ratio of
expected milk yield from day 305 to day 610
(given that cattle are in lactation for 2 years)
relative to the cumulative yield up to day 305.
Statistically extended lactation and persistency
are measured as a ratio of yields (Figure 1)
0 100 200 300 400 500 600
05
10
15
20
25
30
Days in milk
Milk y
ield
(kg
)
A B
ymax
y305
Persistency = y305 / ymax
Ext Lac = AreaB / AreaA
Figure 1: Definition and statistical measure of
extended lactation and lactation persistency as a
ratio of yields
a
b
c

125
Figure 2: Different shapes of lactation curves of a
sample of 13 cows selected with extended
lactations (~600 days) also showing that there are
cows that are more persistent flatter curves,
slower rate of decline in milk production after
peak milk yield, more than others. Illustrating best
(top red) and worst (bottom blue) cow lactation
curves and the variation in their lactation curve
shape.
RESULTS AND DISCUSSION
As can be seen from Figure 2 there is variation in
the shapes of the lactation curve of different cows
with extended lactation (beyond the traditional
305 day lactation). This is also supported with all
measures expressing a high degree of variation
(CV range 8%-75% Table 1). Some cows have a
steeper rate of decline where we see a rapid drop
in milk production straight after peak lactation
while other cows have a slower rate of decline in
milk yield after peak lactation.
The latter are more persistant cows and tend to
have flatter curves than traditional 305 day
lactation curves. Figure 2 also shows two
different lactation curves, one illustrating not an
ideal lactation curve (worst cow) and the other
illustrating best lactation curve (best cow) in
terms of high persistence while maintain peak
production over a longer period of time. The best
cow has a more persistant lactation (0.92) curve
where peak production is maintained for a longer
period of time (c=0.001847, smaller than the
average (Table 1). Whereas with the worst cow
the rate of decline (c) is high (0.004361) out of all
the other curves and persistency is higher than
average (Table 1) but lower (0.552331) when
compared to the best cow (Figure 1).
It is also evident that some cows that have
extended lactation may not necessarily be highly
persistent and vice versa this is illustrated by the
two red curves in Figure 1 one is highly persistent
and with high yield while the other has a rapid
decline from peak production (low persistency)
and has a lower yield. This demonstrates that
persistency and extended lactation always
equivalent.
Table 1 below shows summary statistics of wood
model parameters and derived persistency and
extended lactation traits from a subset of 6000
pure Holstein cows as an average representation
of the full dataset (population).
Milk production during extended lactation phase
(from day 305 to day 610 of lactation) is on
average 40% of the production of day 305
(standard lactation) with an average milk yield
over the extended lactation of 8,968 L. Cows
have on average, almost 50% ability to maintain
peak yield from peak to day 305 of lactation
(persistent).
CONCLUSION
Overall there is considerable variation between
cows in the Australian dairy herds in persistency
of their lactation and extended lactation. There
are certain cows that have higher persistency than
others and who are able to maintain production
over a longer period of time (extended lactation).
The derived parameters adequately describe such
differences between cows and could be used as
input variables in genetic analyses. Genetic
parameters such as heritability, genetic,
phenotypic, environmental correlations and more
importantly breeding value estimates for
extended lactation can now be derived for
extended lactation and lactation persistency. Thus
the findings of such research will provide dairy
farmers with a breeding tool to select cows that
are best suited to milk for longer than the
traditional 305 days.
0 100 200 300 400 500 600
01
020
30
40
Days in Milk
Milk y
ield
(L)

126
Table 1: Summary Statistics for wood model
parameters (k(log a),b,c) of milk yield for subset of
6000 pure Holstein cows and derived traits
persistency(r305) extended lactation (XLAC) and
cumulative yield up to day 610
*r305=Persistency, ^XLAC=extended lactation, +CumYT610=cumulative yield (L) total up to day
610, CV= coefficients of variation (%)
ACKNOWLEDGEMENTS
Authors would like to thank the ADHIS for
providing the dataset for this study, Dairy Futures
CRC and the University of Sydney for the funding
for this project.
REFERENCES
Auldist, M.J., O'Brien, G.N., Cole, D.J., Macmillan,
K.L., Grainger, C. (2007). Effects of Varying
Lactation Length on Milk Production Capacity of
Cows in Pasture-Based Dairying Systems. Journal
of Dairy Science, 90, 3234-3241.
Dekkers, J.C.M., Ten Hag, J.H., Weersink, A.
(1998). Economic aspects of persistency of
lactation in dairy cattle. Livestock Production
Science, 53, 237-252.
Dematawewa, C.M.B., Pearson, R.E., VanRaden,
P.M. (2007). Modeling Extended Lactations of
Holsteins. Journal of Dairy Science, 90, 3924-3936.
Dijkstra, J., Lopez, S., Bannink, A., Dhanoa, M.S.,
Kebreab, E., Odongo, N.E., Fathi Nasri, M.H.,
Behera, U.K., Hernandez-Ferrer, D., France, J.
(2010). Evaluation of a mechanistic lactation
model using cow, goat and sheep data. Journal of
Agricultural Science, 148, 249-262.
Grainger, C., Auldist, M.J., O'Brien, G.N.,
Macmillan, K.L., Culley, C. (2009). Effect of type of
diet and energy intake on milk production of
Holstein-Friesian cows with extended lactations.
Journal of Dairy Science, 92, 1479-1492.
Haile-Mariam, M., Goddard, M.E. (2008). Genetic
and phenotypic parameters of lactations longer
than 305 days (extended lactations). Animal 2,
325-335.
Hall, E. (2008). Statistical Modelling of Lactation
Curves in Australian Dairy Cattle. Faculty of
Veterinary Science. Univeristy of Sydney, Sydney.
Jonas, E., Thomson, P., Hall, E., McGill, D., Lam,
M., Raadsma, H. (2011). Mapping quantitative
trait loci (QTL) in sheep. IV. Analysis of lactation
persistency and extended lactation traits in sheep.
Genetics Selection Evolution, 43, 22.
VanRaden, P.M., Dematawewa, C.M.B., Pearson,
R.E., Tooker, M.E. (2006). Productive Life Including
All Lactations and Longer Lactations with
Diminishing Credits. Journal of Dairy Science, 89,
3213-3220.
Wood, P.D.P. (1967). Algebraic Model of the
Lactation Curve in Cattle. Nature, 216, 164-165.
Trait Mean
SD
Min
Max
CV
(%)
k(log a)
18.62 1.468
4.25
87.79 8%
b
0.1377 0.103
-0.277
0.553 75%
c
0.0039 0.0016
0.0001
0.0103 41%
r305*
0.4747 0.148
0.0884
1.891 31%
XLAC^
0.3969 0.147
0.0475
1.1531 37%
CUM
YT610+ 8,968 2,710
2,936
31,466 30%

127
CAN PRE – FEEDING REDUCE MILKING INTERVALS OF COWS MILKED IN A PASTURE-BASED AUTOMATIC MILKING SYSTEM?
NICOLAS LYONS
The University of Sydney - FutureDairy project, MC Franklin Laboratory (CO4), Private Mailbag 4003,
Narellan, NSW 2567, Australia. b [email protected]
Cows milked in pasture-based automatic milking system (AMS) tend to have a lower daily milking frequency
(MF) in comparison with cows milked in indoor AMS. Milkings with intervals beyond 16 h have previously
been reported to have a negative impact on yield and udder health, and therefore it is important to minimise
their occurrence. Given that feed is the main incentive to encourage cows to move around the system, a field
experiment was design to compare two different supplementary feed placement strategies. Cows would
traffic from the paddock to the dairy, and either receive feed prior to, or after being milked (Pre and Post
Feeding treatments, respectively). The hypothesis was that Pre Feeding would create a stronger incentive to
come back from the paddock to the dairy, due to the reward being more immediate, thereby reducing their
milking interval and increasing daily milking frequency and milk yield. Cows in the Pre Feeding group took
over an hour and a half less to return to the dairy, but surprisingly spent more time in both the feeding and
waiting areas, creating a net increase in milking interval. No significant difference in daily milk yield was
observed between cows in the Pre Feeding and Post Feeding groups.
INTRODUCTION
Adoption of AMS has increased significantly in the
last 10 years, with currently over 10,000 farms
operating with the technology (De Koning, 2011).
Milk harvested per cow at any given milking is
directly related to the time since previous milking,
commonly described as milking interval (MI). This
relationship is not continuously linear; hence the
aim is to minimize the frequency of milkings
occurring with intervals beyond 16 hours, which
are known to have a reduced milk yield (in kg of
milk accumulated per hour of MI) (Lyons, unpubl.
data). It has been previously reported that in
pasture-based systems, around 30% of all milkings
have intervals above 16 hours (Lyons, unpubl.
data), which is much higher than the 4.2%
reported in indoor systems (Hogeveen, et al,
2001).
It is well accepted that feed is the main incentive
encouraging reliable cow traffic around the
system (Prescott, Mottram, & Webster, 1998a,
1998b). It therefore becomes imperative to plan
the farm layout and manage the incentives in such
a way as to encourage frequent cow traffic
around the system.
Previous exploration of cow traffic data from cows
milked in the pasture-based AMS research herd of
the FutureDairy Project, has shown that the main
factor explaining extended MI is the time it takes
cows to return to the dairy, where up to 94% of
milkings with intervals above 16 hours, had return
times over 14 hours (Lyon, unpubl. data). Yet
during that period, whenever supplementary feed
was on offer it was available after milking on the
way out to the paddock. Previous studies have
compared different cow traffic management
(Bach, et al, 2009; Hermans et al, 2003; Ketelaar-
de Lauwere, et al, 1998; Melin, et al, 2005) and
different concentrate allowances (Bach, et al,
2007; Halachmi, et al, 2005) on attendance to the
milking station and milk production. Yet to date,
no data have been published addressing the
impact of location of supplementary feed in a
pasture-based AMS on MI, as well as on time
spent in different animal areas (pasture, feeding
area or pre-milking waiting area).

128
The aim of this study was to compare two
different supplementary feed placement
strategies, made available to cows at the dairy
either prior to or immediately after milking, Pre
and Post Feeding Treatments respectively
(referred to as PRE and POST from here onwards),
on the cow traffic and milk production, of cows
milked within a pasture-based AMS. It was
hypothesised that cows which were allocated
supplementary feed prior to being milked would
traffic back to the dairy (from the paddock) after
shorter intervals than cows that were offered
supplementary feed after milking and that this
would result in a lower average MI and a reduced
incidence of MI’s exceeding 16-hr.
MATERIAL AND METHODS
A pilot trial was conducted between September,
12th and October 10th 2011, at the FutureDairy
Automatic Milking Research dairy (Elizabeth
Macarthur Agricultural Institute, Camden,
Australia). The herd was comprised of 175 cows
(30% primiparous and 70% multiparous cows)
mixed Holstein and Illawara breed.
Cows were managed under a two way grazing
system in which they were granted access to 2
fresh breaks of pasture per 24-hr period, referred
to as “day” and “night” breaks, with a 40:60 ratio
of pasture allocations in the day and night
paddocks respectively. Cows presenting at the
dairy with no milking permission (based on a
minimum milking interval of 4 hours since last
milking) or leaving the dairy after milking, were
automatically drafted to the day paddock
between 9am and 9pm. Likewise cows were
drafted to the night paddock between 9pm and
9am so that each paddock had a 12 hour ‘active
access period’. Each active access period was
followed by a 10 hour ‘voluntary exit’ period,
during which cows were expected to voluntarily
traffic to the next pasture allocation. At the end of
each voluntary exit period, i.e. at 7am for day
breaks, and at 7pm for night breaks, any cows
that had not volunteered out were fetched and
encouraged to the dairy.
Total target dry matter intake was 23 kg
DM/cow/day with 60% of their daily ration
provided as pasture and 40% by supplements
(Table 1).
Supplements were offered in a feeding area
located at the dairy, and consisted of pelleted
concentrates supplied through four automatic
feed stations (FSC400, DeLaval, Tumba, Sweden),
and a PMR ration on an adjacent feeding area
(hay, maize silage and pelleted concentrates).
Table 1: Daily ration for the herd
Type Allocation Feed kg
DM/cow/d
Pasture Day Pasture 6.00
Night Pasture 8.00
Supplements
PMR
Cereal Hay 0.69
Maize
Silage 2.70
Concentrate 2.67
Feed
Stations Concentrate 2.67
Cows were randomised into two groups balanced
for stage of lactation (days in milk). Treatments
were then allocated to each group in a cross over
design trial with 2 periods of 14 days. Cows were
milked using a 16-bail prototype Automatic
Milking Rotary (AMR™, DeLaval, Tumba, Sweden).
STATISTICAL ANALYSIS
Data was analysed using linear mixed modelling,
with parameters and estimates calculated using
Restricted Maximum Likelihood Procedures
(REML) in Genstat 13th Edition (VSN International,
UK).
Individual MI times were subdivided into 3 main
components: time to return to the dairy (TR =
time elapsed from exiting the dairy to re-
presentation back at the dairy), feeding time (FT =
time elapsed from the entry to feeding area to
exit from feeding area, and waiting time (WT =
time elapsed from entry to the pre-milking
holding yard to milking start). Milk yield (MY =
yield of milk at a particular milking, in kgs
milk/cow/milking), milking frequency (MF =
number of milkings in a 24 hours period) and daily
yield (DY = yield of milk on given day, in kgs
milk/cow/day) were also explored.
The models included the main effects of
treatment sequence, period , treatment (PRE and
POST), stage of lactation (Early ≤ 100 days in milk
(DIM); Mid >100 to ≤ 200 DIM and Late > 200
DIM), parity (primiparous or multiparous) and

129
milk yield category (based on pre-trial 7-day
average milk yield, cows were allocated into one
of three equally sized categories,: Low, Mid or
High), as well as the interactions treatment x
stage of lactation, parity and milk yield. The
random term included sequence nested within
animal, to account for repeated measures on the
same animal. Significance was determined at p <
0.05.
RESULTS
Mean (±SEM) MI (hh:mm) for cows fed PRE
milking was 10% higher than for cows fed POST
milking (14:58 ± 0:11 and 13:38 ± 0:10
respectively). Furthermore, pre-fed cows had an
extra 9% of milkings with intervals exceeding 16-h
(46.8% vs. 37.7% for PRE and POST-fed cows,
respectively) (Figure 1).
0
2
4
6
8
10
12
14
16
18
< 4
4 -
6
6 -
8
8 -
10
10
-1
2
12
-1
4
14
-1
6
16
-1
8
18
-2
0
20
-2
2
22
-2
4
> 2
4
Pro
po
rtio
n o
f mil
kin
gs (%
)
Milking interval (hours)
PRE POST
Figure 1: Histogram of milking interval (MI)
distribution of cows in a pasture-based AMS fed
PRE or POST milking
Treatment had no significant interaction with any
main term on TR, FT, MI, MY, MF and DY.
Treatment was significant in explaining
differences in TR, FT, MI, MY and MF (Table 3).
Only the interaction between treatment and milk
yield was significant for WT (Table 3). Cows in the
PRE feeding group took an hour and a half less to
return to the dairy, yet they spent more than
double the time at the feeding area. An increase
of milk yield was associated with a numerical
decrease in WT in both treatments. Low yield
cows which were PRE fed waited significantly
more time to be milked, in comparison with cows
with higher yield in either treatment. Mid and
high producing cows seemed unaffected by a
change in feed placement. Overall, cows in the
PRE feeding group had a milking interval of one
hour longer than the Post Feeding treatment
group which impacted in a significant 5% higher
milk yield per milking. Pre feeding cows also had a
5% lower MF, yet no significant difference was
observed in DY (Table 4).
Table 2: Predicted means of a REML for time to
return from the paddock (TR), feeding time (FT),
waiting time, milking interval (MI), milking yield
(MY), milking frequency (MF) and daily yield (DY)
Outcome PRE POST P -
value
TR (hh:mm) 11:51a 13:17b <0.001
FT (hh:mm) 0:55a 0:23b <0.001
WT (hh:mm)
Low
Milk
Yield
2:38a 1:55b 0.005
Mid
Milk
Yield
2:05ab 1:55b
High
Milk
Yield
1:56b 1:34b
MI (hh:mm) 15:18a 14:15b <0.001
MY
(kgs/cow/milking) 12.6a 11.95b <0.001
MF
(milkings/cow/day) 1.4a 1.5b 0.004
DY (kgs/cow/day) 19.33a 19.58a 0.457
Note: Different upper case letters within an effect
for a particular outcome are significant at p<0.005
DISCUSSION
Pre-feeding cows had a significant effect in
reducing the time it took cows to return from the
paddock. They had a 1.5 hour shorter TR. The
provision of supplementary feed upon arrival at
the dairy appears to be a strong incentive for
cows to volunteer out from the paddock. Previous
research conducted by Prescott, et.al. (1998)
suggested that the ‘cost’ (effort) involved in
getting a certain reward could affect the
willingness to search for it, which could be the

130
case of the POST fed cows. Reducing TR could
have a positive impact on the proportion of
voluntary milkings, therefore not requiring to be
fetched before the subsequent allocation opened.
Long TR were probably due to the fact that in
pasture-based systems, feeding and resting
behaviours take place in the same area. The
condition on pasture is in some ways similar to
free cow traffic layouts in indoor AMS, whereby
cows typically tend to show a lower MF than in
controlled traffic situations (Bach et al., 2009;
Ketelaar-de Lauwere et al., 1998).
However, the apparent initial advantage of a
reduction in TR of PRE fed, was offset by changes
in behaviour at the dairy. Compared to POST fed
cows, PRE feeding cows spent more than double
the amount of time in the supplementary feeding
area. The reason, by which POST fed cows spend
less time in the feeding area, is likely to be related
to time on concrete. Cows prefer a soft non
abrasive surface on their hooves and by the time
POST fed cows arrived at the feeding area they
had spent an average 1.5-2.0 hours on concrete.
This may have impacted their willingness to stay
in the feeding area for an extended period.
It appears that cows that walk from the pasture
allocation up to the dairy and received an
immediate feed reward spend more time in that
area. Behaviour in the holding yard, was explained
by an interaction of milk yield category with
treatment. Low producing cows which were PRE
fed, seemed to be the slowest to move across the
holding yard (highest WT), spending more than
2.5 hours (average) in the holding yard. Low levels
of production are usually related to lower feed
requirements, therefore resulting in a weaker
appetite/motivation for feed and less willingness
to voluntarily walk on the platform and get
milked. PRE fed cows may have a further reduced
motivation to move onto the milking platform,
because milking itself is not a strong reward for
them (Prescott et al., 1998b) and the access to
PRE feed may have been sufficient to abate their
appetite. On the other hand the POST fed cows,
which have walked up to the dairy in search for
fresh feed, were more motivated to be milked and
receive some supplementary feed after milking.
Research conducted in an indoor system to
quantify usage relationship between facilities,
indicated a strong association between milking
procedure and feeding in a concentrate station in
the exit lane (Halachmi, Metz, Maltz, Dijkhuizen,
& Speelman, 2000), suggesting that feeding after
milking was an effective way of managing cows.
Yet the comparison was not made with the
reverse order, of feeding before milking.
Comparable results were found in a past trial that
compared the presence or absence of a small feed
allocation on the platform. When the feed was
not offered, cows took twice as long to traffic
across the holding yard (Scott, unpubl. data).
The difference of behaviour at the dairy translates
to a benefit from the MI point of view, for cows
that receive feed after milking. The PRE fed cows
had a one hour longer MI, which related to a
significant 5% increase in MY at each session (12.6
± 0.20 and 11.95 ± 0.20 kgs milk/cow/milking for
PRE and POST treatments respectively). The
significant difference in MF (1.4 vs. 1.5
milkings/cow/day for PRE and POST groups), did
not translate to a difference in DY with both
groups producing an average of 19.46 ± 0.36
kgs/cow/day.
Given the lack of difference on daily milk
production, it is possible that best results could be
obtained from a combination or mixed system, by
which some feed is offered PRE and other POST.
Further investigations into the dataset will allow
us to determine the overall impact on MI for
different groups of cows which could help to
determine whether one strategy better suits
different groups within the herd.
CONCLUSION
Pre feeding cows can reduce the time to return to
the dairy of cows milked in a pasture based AMS,
although it also increases the time spent in
feeding and waiting area, resulting in an overall
higher milking interval. No difference was
observed in daily milk yield. Design of dairy and
feeding layout for AMS installations, should
consider the allowance for flexible management
for different levels of supplementary feeding.
Future research and analysis should focus on
trying to reduce the time cows spend in feeding
and waiting area, to be able to achieve the
potential benefits of a higher milking frequency.

131
ACKNOWLEDGEMENT
The author acknowledges the support of all
sponsors of the FutureDairy project, particularly
Dairy Australia, NSW Department of Primary
Industries, University of Sydney, and DeLaval. We
would also like to thank the farm staff and
technicians for their assistance in preparing and
running the trial.
REFERENCES
Bach, A., Devant, M., Igleasias, C., & Ferrer, A.
(2009). Forced traffic in automatic milking systems
effectively reduces the need to get cows, but
alters eating behavior and does not improve milk
yield of dairy cattle. Journal of Dairy Science,
92(3), 1272-1280.
Bach, A., Iglesias, C., Calsamiglia, S., & Devant, M.
(2007). Effect of amount of concentrate offered in
automatic milking systems on milking frequency,
feeding behavior, and milk production of dairy
cattle consuming high amounts of corn silage.
Journal of Dairy Science, 90(11), 5049-5055.
De Koning, K. (2011). In Automatic Milking:
Common practice on over 10,000 dairy farms
worldwide. Paper presented at the Dairy Research
Foundation Symposium The University of Sydney.
Halachmi, I., Metz, J.H.M., Maltz, E., Dijkhuizen,
A.A., & Speelman, L. (2000). Designing the optimal
robotic milking barn, Part 1: Quantifying facility
usage. Journal of Agricultural Engineering
Research, 76(1), 37-49.
Halachmi, I., Ofir, S., & Miron, J. (2005).
Comparing two concentrate allowances in an
automatic milking system. Animal Science, 80,
339-343.
Hermans, G.G.N., Ipema, A.H., Stefanowska, J., &
Metz, J.H.M. (2003). The effect of two traffic
situations on the behavior and performance of
cows in an automatic milking system. Journal of
Dairy Science, 86(6), 1997-2004.
Hogeveen, H., Ouweltjes, W., de Koning, C., &
Stelwagen, K. (2001). Milking interval, milk
production and milk flow-rate in an automatic
milking system. Livestock Production Science,
72(1-2), 157-167.
Ketelaar-de Lauwere, C.C., Hendriks, M., Metz,
J.H.M., & Schouten, W.G.P. (1998). Behaviour of
dairy cows under free or forced cow traffic in a
simulated automatic milking system environment.
Applied Animal Behaviour Science, 56(1), 13-28.
Melin, M., Svennersten-Sjaunja, K., & Wiktorsson,
H. (2005). Feeding Patterns and Performance of
Cows in Controlled Cow Traffic in Automatic
Milking Systems. Journal of Dairy Science, 88(11),
3913-3922.
Prescott, N.B., Mottram, T.T., & Webster, A.J.F.
(1998a). Effect of food type and location on the
attendance to an automatic milking system by
dairy cows and the effect of feeding during
milking on their behaviour and milking
characteristics. Animal Science, 67, 183-193.
Prescott, N.B., Mottram, T.T., & Webster, A.J.F.
(1998b). Relative motivations of dairy cows to be
milked or fed in a Y-maze and an automatic
milking system. Applied Animal Behaviour
Science, 57(1-2), 23-33.

132
INVESTIGATING THE EFFECT OF A FORAGE CROP ON VOLUNTARY COW TRAFFIC IN A PASTURE-BASED SYSTEM
VICTORIA SCOTT
University of Sydney,
Faculty of Veterinary Science, Camden, NSW, 2570.
Email: [email protected]
Feed is known to be one of the greatest motivators for voluntary cow traffic in Automatic Milking Systems
(AMS). It has also been shown that cows have preferences for certain crops over others, with soybean being a
preferred forage crop. The use of forage crops may be a useful strategy for encouraging cows to exit a stale
pasture break in anticipation of accessing the ‘preferred’ crop. This study investigated the effect of soybean,
compared with a mixed species grass paddock, on voluntary cow traffic in a pasture based Robotic Rotary
(RR) system. Preliminary results indicated that soybean did not significantly affect cow movement, with
P>0.05 for milking interval, waiting time in the pre-milking waiting yard, and return time. Results suggested
that cows milked at night had shorter milking intervals than those milked during the day, however further
investigations are required to fully understand the causes of this increased movement.
INTRODUCTION
Automatic milking systems (AMS) were
introduced in The Netherlands in 1992 in an
attempt to address challenges associated with
increased labour costs. It is now estimated that
over 11,000 farms across 25 countries operate
with AMS (Koning 2011). In Australia, the first
AMS installation was in 2001 in Victoria. Since
then, the number of operational AMS farms has
grown to 16, with a further 5 currently installing
units (Kerrisk, pers comm). It is expected that
adoption rates of AMS in Australia will continue to
rise.
It is widely accepted that the average herd size in
pasture-based regions is larger than that of the
indoor-housed systems common in Europe –
where AMS was originally developed. In Australia,
average herd size is approximately 230 head
(www.dairyaustralia.com.au), while in New
Zealand it is 376 head (www.lic.co.nz). The
combination of large herd size with pasture-based
farming means that walking distances between
the dairy and paddock increase with an increasing
milking platform area (the area required to
sustainably graze and support the milking herd).
For batch milked herds, walking distance would
most likely have very little impact on milking
frequency due to the farmer fetching and milking
the herd at defined intervals. However research
by Lyons (unpublished) has indicated that when
operating a voluntary cow traffic system,
distances exceeding 800 metres can reduce
voluntary traffic, and subsequently milking
frequency.
Continued improvements in efficiency, and
therefore throughput capacity of AMS (ie. the
number of milkings an individual AMS unit can
complete), along with the development of an
Automatic Milking Rotary - AMR™ (DeLaval,
Tumba, Sweden), have lead to opportunities for
AMS to be more readily adopted by farms with
large herds. Therefore it is necessary to
understand the challenges presented by large
herd sizes, coupled with walking distance, in a
voluntary pasture-based AMS.
A study was designed and conducted in February
2012 to investigate the potential for using forage
crops in a pasture-based AMS, with the potential
to combine CFS (Complementary Forage Systems)
with AMS. It is known that feed is a strong
motivator for cow traffic in AMS (Jago et al, 2007;
Scott (unpublished)). It is also known that cows
show clear preferences when offered a selection
of grazing forages (Horadagoda et al, 2009), with
more recent work by Horadagoda (unpublished)
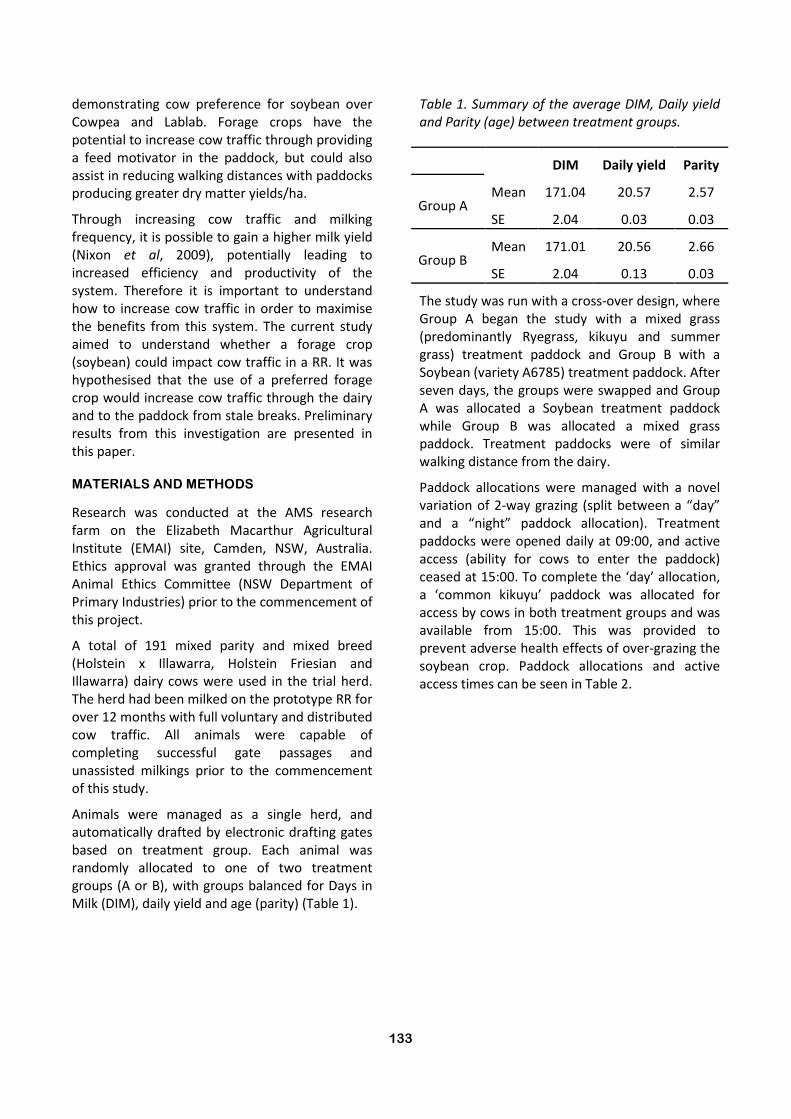
133
demonstrating cow preference for soybean over
Cowpea and Lablab. Forage crops have the
potential to increase cow traffic through providing
a feed motivator in the paddock, but could also
assist in reducing walking distances with paddocks
producing greater dry matter yields/ha.
Through increasing cow traffic and milking
frequency, it is possible to gain a higher milk yield
(Nixon et al, 2009), potentially leading to
increased efficiency and productivity of the
system. Therefore it is important to understand
how to increase cow traffic in order to maximise
the benefits from this system. The current study
aimed to understand whether a forage crop
(soybean) could impact cow traffic in a RR. It was
hypothesised that the use of a preferred forage
crop would increase cow traffic through the dairy
and to the paddock from stale breaks. Preliminary
results from this investigation are presented in
this paper.
MATERIALS AND METHODS
Research was conducted at the AMS research
farm on the Elizabeth Macarthur Agricultural
Institute (EMAI) site, Camden, NSW, Australia.
Ethics approval was granted through the EMAI
Animal Ethics Committee (NSW Department of
Primary Industries) prior to the commencement of
this project.
A total of 191 mixed parity and mixed breed
(Holstein x Illawarra, Holstein Friesian and
Illawarra) dairy cows were used in the trial herd.
The herd had been milked on the prototype RR for
over 12 months with full voluntary and distributed
cow traffic. All animals were capable of
completing successful gate passages and
unassisted milkings prior to the commencement
of this study.
Animals were managed as a single herd, and
automatically drafted by electronic drafting gates
based on treatment group. Each animal was
randomly allocated to one of two treatment
groups (A or B), with groups balanced for Days in
Milk (DIM), daily yield and age (parity) (Table 1).
Table 1. Summary of the average DIM, Daily yield
and Parity (age) between treatment groups.
DIM Daily yield Parity
Group A Mean 171.04 20.57 2.57
SE 2.04 0.03 0.03
Group B Mean 171.01 20.56 2.66
SE 2.04 0.13 0.03
The study was run with a cross-over design, where
Group A began the study with a mixed grass
(predominantly Ryegrass, kikuyu and summer
grass) treatment paddock and Group B with a
Soybean (variety A6785) treatment paddock. After
seven days, the groups were swapped and Group
A was allocated a Soybean treatment paddock
while Group B was allocated a mixed grass
paddock. Treatment paddocks were of similar
walking distance from the dairy.
Paddock allocations were managed with a novel
variation of 2-way grazing (split between a “day”
and a “night” paddock allocation). Treatment
paddocks were opened daily at 09:00, and active
access (ability for cows to enter the paddock)
ceased at 15:00. To complete the ‘day’ allocation,
a ‘common kikuyu’ paddock was allocated for
access by cows in both treatment groups and was
available from 15:00. This was provided to
prevent adverse health effects of over-grazing the
soybean crop. Paddock allocations and active
access times can be seen in Table 2.

134
Table 2. Summary of paddock allocations.
Paddock Active access
Fetched Max. time in
paddock
Allocation
Treat.
Soybean
09:00-
15:00 17:00 8hr 3kg/cow
Treat.
Mixed
Pasture
09:00-
15:00 17:00 8hr 3kg/cow
Common
Kikuyu
15:00-
21:00 07:00 16hr 4kg/cow
Night
Kikuyu
21:00-
09:00 19:00 22hr 4kg/cow*
*The night paddock allocation was supplemented
with 4kg/cow maize silage/hay ration on the
feedpad
Prior to 15:00, cows exiting their treatment
paddock were sent directly to the dairy and were
returned to their treatment paddock after a
milking or if milking permission was not granted.
After 15:00, cows leaving their treatment paddock
were sent to the common kikuyu paddock without
a forced visit to the dairy. Therefore a complete
day allocation was made up from 50% treatment
and 50% kikuyu (total of 7kg/cow, 12hr active
access). The night allocation was shared by both
treatment groups.
Cows were allocated an average of 21kg
DM/cow/day. As can be seen in Table 2, 11Kg of
this total daily allocation was fed in the paddock.
A further 4kg/cow (80% maize silage and 20%
lucerne hay) was allocated at the feedpad to
supplement the night paddock allocation. Pelleted
concentrates (6kg/cow, at 18% protein) were fed
through feeding stations in the post-milking area
and daily concentrate consumption levels were
recorded electronically. The feedpad ration was
available from 21:00-09:00 daily whilst the
pelleted concentrate was available across the
24hr day. Water was available ad lib within the
dairy and laneways.
The 16-bail prototype RR operated 24 hours a day
although voluntary cow access was denied during
batch milking of abnormal milk cows and
subsequent machine washing twice-a-day.
Washing took place at approximately 07:00 and
18:00, totalling 2.5hr per day. Day and night
voluntary milking sessions commenced at
approximately 08:30 and 19:00 respectfully.
10
11
12
13
14
15
16
17
18
19
20
0 1 2 3 4 5 6 7 8 9 10 11 12 13 14 15 16 17 18 19 20 21 22 23
Milk
ing
Inte
rval
(H
r)
Hour of day milking startedMixed Grass Soybean
Figure 1. Mean milking interval predicted across
each hour of the day dependent on treatment.
Throughout the study, 8 of the total 16 milk points
(MP’s) were activated. This was done in order to
reduce the impact of underutilisation (the herd
size was approximately half the capacity of the
RR). A small, unmeasured quantity of concentrate
pellets (approximately 300g/cow.milking) was fed
as a reward at each milking as cows accessed the
milking platform.
The entire herd was given access to the soybean
crop and trained to use one-way gates along the
laneways for two days before the first trial period.
At the commencement of the first period, cows
were split into treatment groups and trained for
two days. A habituation period of two days was
then given to settle cows into their treatment.
During this time, human interference in the dairy
(encouraging cows onto the platform, drafting
and sorting cows) was minimised. The habituation
period was followed by a 3-day experimental
period prior to the cross-over of treatments.
Voluntary waiting time in the pre-milking holding
yard was recorded as the time from entering the
holding yard until presenting on the RR platform
for milking. Activities in the dairy were recorded in
order to allow for waiting time to be defined as
proportions of forced vs. voluntary waiting.

135
Milking interval was recorded as the total time
between consecutive milkings provided the cow
was sent to the paddock between milkings.
Incompletely milked animals (for example, failed
attachments or kick-offs) were automatically
drafted back through the dairy for a second
attempt at milking. Milking permission was
granted after a minimum of 4 hours since
previous milking or immediately if previous
milking was incomplete.
Electronic data was captured on-farm using the
support software DelPro (DeLaval, Tumba,
Sweden). Data was cleaned and sorted in
Microsoft Excel 2007. Descriptive statistics
provided a simple summary of data to assist in
explaining preliminary results. Data was analysed
using GenStat version 13.1 (VSN International
Ltd.), modelling effects using Linear Mixed Models
(REML).
RESULTS
Preliminary results indicate that treatment did not
significantly affect MI, waiting time in the pre-
milking waiting yard, or return time to the dairy
(the time from leaving the dairy to the paddock
until first returning) (P>0.05). However there was
a significant interaction between treatment and
time of day (the time of day that a milking
commenced) (P = 0.012, df = 23, F stat = 1.80) for
milking interval (Figure 1).
Figure 1. Mean milking interval predicted across
each hour of the day dependent on treatment.
Results indicated that cow age, DIM and average
yield significantly impacted waiting time in the
pre-milking holding yard, along with MI and return
time. Younger cows averaged shorter waiting
times, with a shorter MI, while high producing
cows also averaged shorter waiting times and MI
(data not presented here).
Period and Group did not significantly affect
waiting time, MI or return time (P>0.05).
DISCUSSION
Preliminary results presented here indicated that
offering soybean as a forage crop, alternative to
pasture species common for this time of year, did
not significantly affect cow traffic, as seen through
similar MI, waiting time in the dairy and return
time. However the data presented here included
cow traffic across the entire 24hr day, and was
not specific to the traffic leading up to a milking
with access to treatment paddocks. It is possible
that a difference in treatment could be seen when
focusing only on milkings in which access to
treatment paddocks was granted, and a more
complete analysis of the data set will be necessary
to ensure a full understanding of the role of
forage crops in voluntary pasture-based AMS is
generated.
It may be possible that the incentive of soybean as
a forage crop was not strong enough to impact
waiting times in the dairy. Within the dairy, it is
possible to manipulate cow movement through
the strategic placement of feed (both in a feedpad
and pellet feeders, and on the RR itself) (Scott,
unpublished). However, it is unknown as to how
the strength and success of a feed incentive
interacts with time or energy expenditure
(through walking to the feed) after the desired
event occurred (in this case, voluntary
movement). When training animals, the
immediacy of a reward directly following the
desired behaviour can be important for repetition
of that behaviour. This may also be the case here,
and further research into this area could provide a
greater understanding of voluntary cow traffic in a
pasture-based AMS, through which improved
management recommendations could be
developed.
As the first study into incorporating a forage crop
in a pasture-based voluntary RR, it was unknown
as to how far the crop should be planted from the
dairy, or how the cows would respond to the crop.
While preliminary results did not indicate an
effect on traffic, potentially due to a dilution
effect of using the entire traffic data and not
traffic associated with a milking given access to
the treatment paddocks, it could be that weather
and plant maturity reduced the “appeal” of the
crop during the trial. Weather has been previously
reported as altering cow behaviour in a pasture-
based AMS (Ketelaar-de Lauwere and Ipema,
2000). High and consistent levels of rain were
experienced during the entire trial, and plant
maturity increased as the trial progressed.
Interestingly, cow factors (DIM, yield and parity)
significantly affected cow traffic throughout the
whole farm system. As expected, young animals
trafficked the fastest across the system, as did
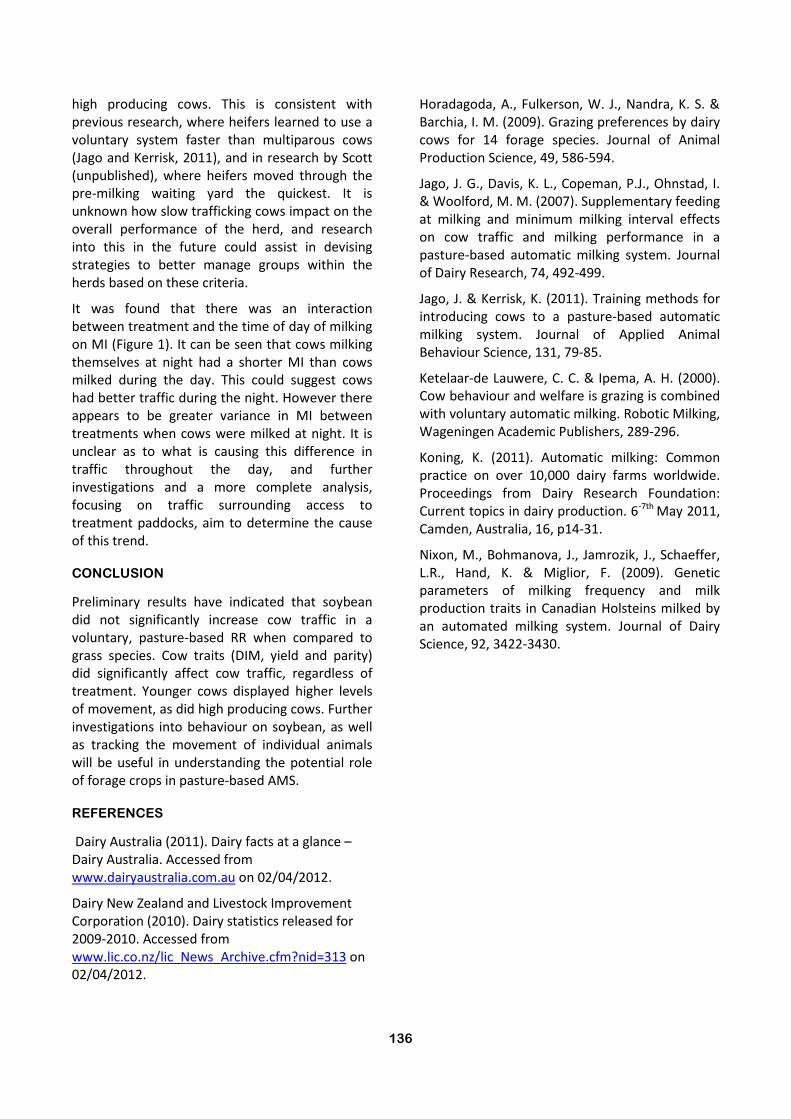
136
high producing cows. This is consistent with
previous research, where heifers learned to use a
voluntary system faster than multiparous cows
(Jago and Kerrisk, 2011), and in research by Scott
(unpublished), where heifers moved through the
pre-milking waiting yard the quickest. It is
unknown how slow trafficking cows impact on the
overall performance of the herd, and research
into this in the future could assist in devising
strategies to better manage groups within the
herds based on these criteria.
It was found that there was an interaction
between treatment and the time of day of milking
on MI (Figure 1). It can be seen that cows milking
themselves at night had a shorter MI than cows
milked during the day. This could suggest cows
had better traffic during the night. However there
appears to be greater variance in MI between
treatments when cows were milked at night. It is
unclear as to what is causing this difference in
traffic throughout the day, and further
investigations and a more complete analysis,
focusing on traffic surrounding access to
treatment paddocks, aim to determine the cause
of this trend.
CONCLUSION
Preliminary results have indicated that soybean
did not significantly increase cow traffic in a
voluntary, pasture-based RR when compared to
grass species. Cow traits (DIM, yield and parity)
did significantly affect cow traffic, regardless of
treatment. Younger cows displayed higher levels
of movement, as did high producing cows. Further
investigations into behaviour on soybean, as well
as tracking the movement of individual animals
will be useful in understanding the potential role
of forage crops in pasture-based AMS.
REFERENCES
Dairy Australia (2011). Dairy facts at a glance –
Dairy Australia. Accessed from
www.dairyaustralia.com.au on 02/04/2012.
Dairy New Zealand and Livestock Improvement
Corporation (2010). Dairy statistics released for
2009-2010. Accessed from
www.lic.co.nz/lic_News_Archive.cfm?nid=313 on
02/04/2012.
Horadagoda, A., Fulkerson, W. J., Nandra, K. S. &
Barchia, I. M. (2009). Grazing preferences by dairy
cows for 14 forage species. Journal of Animal
Production Science, 49, 586-594.
Jago, J. G., Davis, K. L., Copeman, P.J., Ohnstad, I.
& Woolford, M. M. (2007). Supplementary feeding
at milking and minimum milking interval effects
on cow traffic and milking performance in a
pasture-based automatic milking system. Journal
of Dairy Research, 74, 492-499.
Jago, J. & Kerrisk, K. (2011). Training methods for
introducing cows to a pasture-based automatic
milking system. Journal of Applied Animal
Behaviour Science, 131, 79-85.
Ketelaar-de Lauwere, C. C. & Ipema, A. H. (2000).
Cow behaviour and welfare is grazing is combined
with voluntary automatic milking. Robotic Milking,
Wageningen Academic Publishers, 289-296.
Koning, K. (2011). Automatic milking: Common
practice on over 10,000 dairy farms worldwide.
Proceedings from Dairy Research Foundation:
Current topics in dairy production. 6-7th May 2011,
Camden, Australia, 16, p14-31.
Nixon, M., Bohmanova, J., Jamrozik, J., Schaeffer,
L.R., Hand, K. & Miglior, F. (2009). Genetic
parameters of milking frequency and milk
production traits in Canadian Holsteins milked by
an automated milking system. Journal of Dairy
Science, 92, 3422-3430.

137
COMMERCIAL REALITY OF INTEGRATING FORAGE CROPS ON A PASTURE BASED DAIRY
MICHAEL CAMPBELL
The University of Sydney, PMB 4003
Narellan, NSW 2567.
The pasture-based dairy industry in Australia has been looking for ways to increase the quantity of forage
produced above that of grazed pasture alone. In recent years a new technology of a complementary forage
rotation was reported to be able to grow 40tDM.ha in one year. It involved a triple crop rotation that would
be grown a 35% of the farm area. This has been termed a complementary forage system. This concept has
been tested at a research farm level but not in a commercial farming situation. The aim of this study is to
model the impact of implementing a CFS on 5 case study farms across two different dairying regions. The
results showed that all 5 farms could benefit from utilizing a CFS through an increase in total forage yields
across the farm and a higher gross margin. The largest benefits of implementing a CFS can be seen by farms
that have relatively lower pasture utilization. Further research should be directed at fully understanding the
cost of implementing a CFS as all the modeling has been conducted in a steady state presently.
INTRODUCTION
The pasture-based dairy industry in Australia has
been looking for ways to increase the quantity of
forage produced above that of grazed pasture. An
option for farmers to increase the quantity of
forage produced on farm is to integrate crops and
pastures in sequence. The use of complementary
forage crops to provide additional home-grown
feed in a pasture based dairy system has been
investigated by Garcia et al., (2008). Garcia and
Fulkerson (2005) developed a concept of a system
of forage crops that could be grown in sequence
and potentially increase the production of home-
grown forage above the yield of pasture alone.
This system was termed a complementary forage
rotation and involved growing maize as a bulk
silage crop, forage rape for an autumn grazing and
a field pea crop for silage.
To investigate this concept further Garcia et al.
(2008) conducted a paddock scale experiment
resulting in a yield of over 40tDM.ha.yr for the 3
years of the experiment. Garcia et al. (2007)
conducted a modeling exercise of these results and
concluded that the optimal area for the CFR in a
commercial dairy would be 35% of the land area
with the other 65% left as pasture for grazing.
This CFR concept was then further explored by
Farina et al. (2011) by conducting a farmlet study
integrating the CFR with pasture and this was
termed a complementary forage system (CFS). It
was found that it was possible to achieve 25tDM.ha
yield across the whole farm (33.1tDM.ha from CFR,
22.4tDm.ha from pasture) and over 27,000litres.ha
of milk. Farina et al. (2011) concluded that a triple
crop complementary forage system had the
potential to allow an increase in production from
the same land area without the need for additional
bought-in feed.
The economic impact of this CFS on a commercial
farm has been investigated by Alford et al. (2009)
by utilising a whole-farm economic model of a
representative farm constructed from various
information sources including the physical data
from the trial conducted by Farina et al. (2011),
ABARE, and the NSW DPI. It was concluded from
this work that even at the lower realized
production levels that Farina et al. (2011) reported
compared to Garcia et al. (2008) the CFS compares
profitably with other strategies to increase
production such as increasing pasture utilization
and concentrate feeding level.

138
A limitation of this economic analysis is that it used
a representative farm rather than a real case study
farm. Malcolm (2004) suggests that the use of real
case study farms enhance the use of model farms
when evaluating new technologies and outlines the
limitations of using the representative farm.
Isalm et al. (2012) was able to validate the
Agricultural Production Systems Simulator (APSIM)
as an effective tool to simulate the yield of a CFS in
different dairying regions in Australia.
With this background information it was decided
that the next logical step would be to investigate
the impact of a CFS on a commercial farm. In this
study it is hypothesized that the use of a CFS on
real commercial case study dairy farms will provide
a profitable way to increase milk production from
the land resource already available to the farmer
independent of their current production levels.
MATERIALS AND METHODS
A modeling approach was adopted to investigate
the effect of adopting a CFS on commercial pasture
based dairy farms.
The case study farms used in this study are located
in two different dairying regions, Northern Victoria
irrigation area and the Hunter Valley, NSW. A total
of 3 farms were in the Hunter Valley and 2 farms in
Northern Victoria.
The farms were monitored on a fortnightly basis
with production data collected along with feed
samples and ration composition. This information
provided the robustness needed to ensure that any
modeling conducted is a fair representation of the
individual farm.
The complementary forage rotation adopted in this
study was drawn from the previous work of Garcia,
et al. (2008) and Islam et al. (2012). The cost of the
various forages was taken from the economic study
of the CFS by Alford, et al. (2009). The CFR yields
and cost are outlined in Table 1.
The logic of the modeling was to develop a base
year for each of the farms which relied on the
actual farm data collected. The CFR area was set at
35% of the land area available to each of the farms
as recommended by Garcia, et al. (2008). The logic
of decision making in the modeling process was
that the extra yield harvested from the CFR area
would first be used to replace any bought-in
fodder. Once all the bought in fodder had been
replaced then an increase in cow numbers
proportional to the extra metabolisable energy
produced on the CFR area was allowed.
Metabolisable energy was chosen as the method to
compare the yields from the different scenarios as
it takes into account the quality of different forage
systems.
The fitness of the model to the actual farm data
was determined by using the Root of the Mean
Square Prediction Error (RMSPE) method on four
production elements of total farm milk solids, total
farm fat, total farm protein, and total farm litres.
Once the RMSPE was below 20% it was determined
that the model was calibrated.
Table 1. Yield and Cost data used in each region
Region Northern Victoria
Hunter Valley
Yield
(tDM.
ha(
Cost
($.ha)
Yield
(tDM.
ha)
Cost
($/ha)
Maize 16.2 $3200 23.9 $3200
Forage
Rape 10.5 $900 11 $900
Field
Peas 2.9 $400 4 $400
Each of the case study farms was modeled using
UDDER, a decision support model that predicts the
milk production of dairy herds grazing under
different management regimes.
To account for the different levels of genetics and
production from the individual herds no change
was made to the concentrate feeding levels and so
all extra milk production would be assumed to be
coming from the increased forage yields from the
CFR area and the extra cows being run.
Pasture utilization for each farm was determined
from the actual farm data inputted into UDDER.

139
THE CASE STUDY FARMS
A brief description of the case study farms is
provided in Table 2. All of the farms are pasture
based grazing dairies with different levels of milk
production and feeding.
RESULTS
Table 3 provides a summary of the results of the
modeling study.
The largest impact of implementing the CFS was on
Farm 4 which resulted in over a 60% increase in
gross margin and more than double the forage
yield from the base year.
All five case study farms were able to increase milk
production, forage yield and gross margin when a
CFS was modeled over a base year.
Table 2. Brief description of case study farms
Farm 1 Farm 2 Farm 3 Farm 4 Farm 5
Region Nth Vic Nth Vic Hunter Hunter Hunter
Peak Cow No 250 675 140 164 453
Area 110 424 50 78 112
Litres/ha 9809 11226 20046 13821 31692
Solids/ha 874 795 1378 1030 2176
Concentrate/lactation (tDM) 1 2 1.6 2 2.7
Av Milk Price c/L 0.44 0.32 0.49 0.55 0.56

140
Table 3: Key performance results from UDDER
FARM 1 FARM 2 FARM 3 FARM 4 FARM 5
Base CFS Base CFS Base CFS Base CFS Base CFS
Solids (kgMS.ha) 874 1338 795 1176 1378 1699 1030 1904 2176 2505
Litres (L.ha) 9809 14809 11226 16254 20046 24491 13821 24534 31692 36319
Peak Cow No 250 348 675 830 140 176 164 288 453 521
Total Forage Yield (tDM/ha)
7.6 13.9 5.9 10 14.5 15.2 7 15.2 13.2 19.4
Feed Costs ($) 139,451 273,957 496,605 929,101 132,796 193,445 154,760 329,700 554,518 714,562
Gross Margin ($) 152,869 208,790 591,611 741,697 259,860 286,643 306,056 499,769 1,113,712 1,206,364

141
DISCUSSION
The main objective of this study was to examine
the effect of implementing a CFS on five case
study dairy farms across two regions. The results
showed that in all situations the farms are able to
increase total forage yields, milk production and
gross margin.
When all the five farms are compared the largest
impact of utilizing a CFS on profitability is a result
of increasing total forage yield. These results
show that the CFS technology can be applied
across a range of farms and production systems
with positive results.
Total forage yields increases for the two farms
located in Northern Victoria were 82% and 70%.
In the Hunter Valley the total forage yield
increases were 5%, 112% and 47%. With these
small number of farms it is not possible to
establish a trend based on regions. It appears
from these results that farms with lower total
forage harvest at a base year can actually benefit
more than those farms who are already
harvesting relatively larger amounts of forages.
It is generally accepted that farmers should focus
on increasing pasture utilization before embarking
on implementing a CFS. The results of this study
show that it is possible to use a CFS to increase
production on farms that have relatively low
pasture utilization rate and so might provide an
option for farms that are finding it difficult to
increase pasture utilization.
A limitation of this study is that it is examining the
case studies in a steady state. This means that the
cost of implementing the CFS has not been
accounted for. It would be beneficial to examine
the cost of implementing this technology on these
farms and determine the appropriate payback
period.
ACKNOWLEDGMENTS
Thanks to my supervisor Associate Professor Yani
Garcia for his help in guiding me through this
research process.
Many thanks go to Neil Lane from Intelact
Australia for his assistance in modeling the farms
in UDDER.
REFERENCES
Garcia, S.C., Fulkerson, W.J. and Brookes, S.U.
(2008) Dry matter production, nutritive value and
efficiency of nutrient utilization of a
complementary forage rotation compared to a
grass pasture system. Grass and Forage Science,
63,284-300
Garcia S. C., Jacobs J. L., Woodward S. L. and Clark
D. A. (2007) Complementary forage rotation
systems: a review of recent developments. In:
Chapman D. F., Clark D. A., Macmillan K. L. and
Nation D. P. (eds). Proceedings of the Australasian
Dairy Science Symposium 2007, Melbourne,
Australia, pp. 221-239
Islam, M.R. and Garcia, S.C. (2012) Simulation of
an annual cycle of a triple-crop complementary
forage rotation of maize, forage rpae and field
peas gorwn with different rates of nitrogen
fertilizer and irrigation water using APSIM
(submitted and waiting for publilcation).
Farina, S. R., Garcia, S.C. and Fulkerson W.J. (2011)
A complementary forage system whole-farm
study: forage utilisation and milk production.
Animal Production Science 51(5) 460-470
Alford, A, Garcia, S.C., Farina, S. and Fulkerson,
W.J. (2009) An economic evaluation of the
FutureDairy complementary forage rotation
system – using whole farm budgeting. Economic
Research Report No 45, Industry and Investment,
NSW Government.
Malcolm, B. (2004) Where’s the economics? The
core discipline of farm management has gone
missing! The Australian Journal of Agricultural and
Resource Economics, 48 (3), 395-417
Garcia S. C. and Fulkerson W. J. (2005)
Opportunities for future Australian dairy systems:
a review. Australian Journal of Experimental
Agriculture, 45, 1041-1055.