dairy research foundation - university of...
TRANSCRIPT

DAIRY RESEARCH FOUNDATION CURRENT TOPICS IN DAIRY PRODUCTION
Volume 16
July 6th and 7th 2011
FACULTY OF VETERINARY SCIENCE

DAIRY RESEARCH FOUNDATION
Current topics in Dairy Production Volume 16
2011
Edited by Pietro Celi
Compiled by Michelle Heward
Published By: University Printing Service Sydney

Page | 2
CONTENTS
WELCOME TO THE DAIRY RESEARCH FOUNDATION 2011 SYMPOSIUM ............................................... 5
DAIRY RESEARCH FOUNDATION 2011 SYMPOSIUM SPONSORS ........................................................... 6
THE EMERGING DAIRY SCIENTISTS’ PROGRAM .................................................................................... 7
ADDITIONAL DAIRY INDUSTRY ACTIVITIES ........................................................................................... 7
KEYNOTE SPEAKERS ............................................................................................................................. 8
CONFERENCE PROGRAM ...................................................................................................................... 9
AUTOMATIC MILKING: COMMON PRACTICE ON OVER 10,000 DAIRY FARMS WORLDWIDE .............. 14
KEES DE KONING
STRATEGIES TO INCREASE THE EFFICIENCY OF AUTOMATIC MILKING AND MILK PRODUCTION FROM HIGH PRODUCING DAIRY COWS: LESSONS LEARNT AT THE KELLOGG BIOLOGICAL STATION’S PASTURE DAIRY RESEARCH CENTER .................................................................................................................. 32
SANTIAGO UTSUMI ............................................................................................................................... 32
WILLORA AMS CASE STUDY ............................................................................................................... 45
MANUKA HEIGHTS AMS CASE STUDY ................................................................................................ 46
MATANDAL PASTORAL -AMS CASE STUDY ......................................................................................... 47
DAIRY FARM PERFORMANCE AND PROFIT: SOME LESSONS FROM THE TASMILK60 STUDY ............... 48
STEVE LITTLE
NEW WAYS OF SELECTING FOR IMPROVED FEED CONVERSION EFFICIENCY USING GENOMIC TECHNOLOGIES .................................................................................................................................. 58
JENNIE PRYCE
IT’S ALL IN THE TIMING ...................................................................................................................... 61
CARL HOCKEY
CALF REARING CASE STUDY: GUNDAGAI DAIRY – SCOTT FAMILY, BOYANUP WA .............................. 66
PETER ROSHER
ROBOTIC ROTARY: REVOLUTIONISING MILK HARVESTING AS WE KNOW IT? ..................................... 70
KENDRA KERRISK
UNDERSTANDING THE EFFECT OF FEED vs. NO FEED ON COW QUEUING BEHAVIOUR WITHIN THE NEW ROBOTIC ROTARY SYSTEM ........................................................................................................ 76
TORI SCOTT
MANAGEMENT STRATEGY TO IMPACT ON MILKING INTERVALS AND TOTAL DAILY YIELD OF DAIRY COWS IN AN AUTOMATIC MILKING SYSTEM, UNDER TYPICAL AUSTRALIAN PASTURE-BASED CONDITIONS ...................................................................................................................................... 82
NICOLAS LYONS

Page | 3
INVESTIGATION INTO THE EFFECT OF DIFFERENT BAIL ACTIVATION SEQUENCES WITH A ROBOTIC ROTARY ............................................................................................................................................. 88
RENE KOLBACH
MANAGE LAMENESS FOR INCREASED PROFITS .................................................................................. 94
KARL BURGI
REDUCING NITROGEN LOSSES ON DAIRYFARMS IN SOUTH-WESTERN VICTORIA ............................... 98
TIM HUGGINS
MONITORING AND MANAGING SPATIAL VARIABILITY IN PASTURES: DEVELOPING ACTIVE OPTICAL SENSORS TO INCREASE NITROGEN USE EFFICIENCY AND GPS TRACKING TO UNDERSTAND LIVESTOCK PASTURE UTILISATION AND NUTRIENT REDISTRIBUTION................................................................. 103
MARK TROTTER
BREEDING FOR EXTENDED LACTATION IN AUSTRALIAN DAIRY COWS: A REVIEW ......................................................................................................................................... 106
MARY ABDELSAYAD
SERUM IgG CONCENTRATION IN HAND-REARED CALVES AND IT’S RELATIONSHIP TO DIARRHOEA AND INCREASED RECTAL TEMPERATURE ................................................................................................. 111
CLAIRE KENTLER
GENOMIC SELECTION IN DAIRY CATTLE: AN OVERVIEW AND DISCUSSION ON SOME POSSIBLE APPLICATIONS ................................................................................................................................. 117
DAVID MCGILL
THE HUNTER PROJECT: USING FUTURE DAIRY RESEARCH ON COMMERCIAL DAIRY FARMS ............. 123
ANTHEA LISLE AND KERRY KEMPTON
AN INVESTIGATION INTO THE FLEXIBLE USE OF FORAGE SYSTEMS IN NORTHERN VICTORIA: THE FORAGE PLANNING EXERCISE ................................................................................................... 132
MICHAEL CAMPBELL
APPLICATION OF FUTUREDAIRY AND 3030 PROJECT KEY FINDINGS ON FARMING SYSTEMS IN VICTORIA ......................................................................................................................................... 138
SANTIAGO FARIÑA
BUSINESS RISK OF PASTURE-BASED DAIRY INTENSIFICATION: INCREASING CONCENTRATES VS. ADOPTING A COMPLEMENTARY FORAGE SYSTEM ........................................................................... 146
SANTIAGO FARIÑA
ANIONIC SALT SUPPLEMENTATION AND INTRA-RUMEN DELIVERY OF 25OHD INCREASE URINARY CALCIUM EXCRETION IN STEERS FED A FORAGE DIET ....................................................................... 154
JOE MCGRATH
EFFECTS OF CARBOHYDRATES AND HISTIDINE ON RUMINAL PH AND FERMENTATION PRODUCTS DURING AN INDUCED ACIDOSIS PROTOCOL .................................................................................... 160
HELEN GOLDER
Page | 4
THE EFFECTS OF SOME ENVIRONMENTAL AND MANAGEMENT FACTORS ON CONCEPTION RATE AT FIRST SERVICE OF THE AUSTRALIAN DAIRY HEIFERS......................................................................... 165
ANAS ALMAKHZOOMI
THE PRESSURE OF WATER: ASSISTING HAWKESBURY NEPEAN DAIRY FARMERS TO BE WATERSMART ........................................................................................................................................................ 168
MATTHEW PLUNKETT

Page | 5
WELCOME TO THE DAIRY RESEARCH FOUNDATION 2011 SYMPOSIUM
It is with pleasure that we present to the Australian dairy industry, our 2011 Symposium.
This year we have moved forward from our traditional spring date in order to re-invigorate the event and also, to collaborate with Dairy NSW Members’ Council and NSW Farmers’ Association Dairy Section annual general meetings. This means we now have a collaborative series of major dairy events in the single time frame.
The 2011 Symposium has a strong focus on the opportunity to view the robotic rotary at the Camden Robotic Milking Research Farm, but will also take in a range of technology opportunities suited to the full spectrum of dairy systems.
While there is enormous curiosity and interest in the robots, especially the new rotary version of this, there is certainly much more than robots on the agenda for the 2011 event. The program framework will mean that the first day (July 6) will comprise all presentations at the Liz Kernohan Conference Centre on the University Campus, while the second day (July 7) is a much less formal but highly interactive day at the Robotic Milking Research Farm.
A key philosophy of the Dairy Research Foundation is to nurture and promote young or emerging professionals in the dairy industry – our young scientists, our young farmers – and our young service providers. Our approach to program design has been to integrate youth with experience - and to do this in a manner that creates a really inter-personal experience for the delegates. Please refer to the Emerging Dairy Scientists’ section in this document for further information.
With Day 2 being all on site at the Camden Robotic Milking Research Farm, we ask that you come ‘weather prepared’. We have designed the day in a manner to allow each of you to have an up close and personal look at the Robotic Rotary – but to achieve this we have created a very different format to the day. We know you will enjoy it. Meanwhile, the annual Symposium dinner and announcement of the Dairy Science Award will once again take place at Gledswood Winery – on the evening of July 6. This is sure to be a great night of fellowship.
We look forward to welcoming you to Camden in July.
Assoc Professor Yani Garcia
Chair, Dairy Research Foundation 2011 Symposium

Page | 6
DAIRY RESEARCH FOUNDATION 2011 SYMPOSIUM SPONSORS
The Dairy Research Foundation would like to acknowledge and thank the following companies for their support
PLATINUM
GOLD
SILVER
BRONZE
THE DAIRY RESEARCH FOUNDATION WOULD ALSO LIKE TO ACKNOWLEDGE AND THANK THE FOLLOWING EXHIBITORS FOR THEIR SUPPORT
AGRIG8 • NSW FARMERS’ ASSOCIATION • SBS CIBUS
DAVIESWAY • ADF MILKING • MILK MARKETING NSW

Page | 7
2011 SYMPOSIUM ORGANISING COMMITTEE
Associate Professor Yani Garcia, University of Sydney
Dr Kendra Kerrisk, University of Sydney
Dr Pietro Celi, University of Sydney
Ms Sherry Catt, University of Sydney
Ms Michelle Heward, University of Sydney
Mr Michael Perich, NSW Farmers Association – Dairy Section
Mr Bill Inglis, Dairy Research Foundation
Ms Kerry Kempton, NSW Department of Trade and Investment, Regional Infrastructure and Services
Ms Vicki Smart, NSW Department of Trade and Investment, Regional Infrastructure and Services
Mr Todd Middlebrook, George Weston Foods Limited
THE EMERGING DAIRY SCIENTISTS’ PROGRAM
The DRF is pleased to showcase the talents of 10 emerging dairy scientists at the 2011 event. These presentations have been integrated into our Day 2 program and all have been paired with a senior consultant or scientist to create a highly interactive series of discussions.
The objective of this process is to offer a quality professional development opportunity for these emerging scientists and to ‘introduce them to and integrate them with’ our industry. The program is in the form of a competition, where we ask you, the audience, to assess the quality, relevance and interest of each presentation – with the audience scores combined to determine a winner – announced at the conclusion of Day 2.
The program clearly identifies those competing in the Emerging Scientists’ Program – and we encourage your full participation. Your encouragement of participation will do much towards encouraging our next generation of dairy science.
ADDITIONAL DAIRY INDUSTRY ACTIVITIES The Dairy Research Foundation is pleased to be collaborating with Dairy NSW and NSW Farmers’ Association Dairy Section, who’s Members’ Council and Annual General Meetings will take place at the Camden Campus on Tuesday July 5, the day before the Symposium. The meetings will run from 10am to 5pm.
The NSW Farmers’ Association and Dairy NSW cordially invite all dairy farmers to attend their meetings to discuss the current issues and opportunities in dairying.
Persons wishing to attend these functions (which are complimentary) must register their intent to do so via this registration form, or alternatively, contact the organisations direct for more information.
Dairy NSW NSW Farmers’ Association Dairy Section Kate McGilvray Cameron Clark 02 6373 1435 02 8251 1885 [email protected] [email protected]

Page | 8
KEYNOTE SPEAKERS
KEES DE KONING
Kees de Koning is a senior scientist and currently holds a position as Manager Dairy Campus within Wageningen UR Livestock Research. He has over 25 years of research experience related to agricultural engineering, milking technology, energy saving techniques, farm management, smart farming, sensor technology, quality assurance and food technology within
the dairy chain. He was overall program leader of the EU research programme ‘Implications of the introduction of automatic milking on dairy farms’. This project focused on major implications of automatic milking on grazing, animal health, farm management, milk quality, farm economics and consumer aspects.
SANTIAGO UTSUMI
Dr Santiago Utsumi is a nationally recognized young scientist in the field of pasture-based livestock and dairy production. He has particular interest in the development of grazing-based animal production systems that promote
the competitiveness of family farmers, sustainable uses of natural resources and environmental stewardship.
Santiago has deep roots in grass-based animal agriculture. He was raised in a dairy, beef and crop family farm from where he gathered valuable experience in dairy grazing and whole farm management from early life. While working at the Argentinean National Institute of Agricultural Technology (INTA) his research work integrated mechanistic modelling and field experiments focusing on the forage intake and grass utilization by dairy cattle. Between 2005 and 2009 Santiago received various prestigious scholarship awards to complete his PhD dissertation with the New Mexico State University, where he was appointed as research specialist and postdoctoral fellow to examine plant-animal dynamics in intensively and extensively managed grazing lands. He was appointed as an Assistant Professor of Animal Science with Michigan State University in 2009 to fully integrate a research, extension and education program on pasture-based dairy farming. Since then, Santiago has become research leader of the Pasture Dairy Research Centre of the W.K. Kellogg Biological Station, a Robotic Milking and Grazing-based dairy project committed to the perpetuation of a competitive Michigan dairy industry rooted on sustainable agricultural practices and environmental stewardship. His research interest expands from the optimization of automatic milking systems in grazing -based dairies to forage production and utilization, dairy nutrition and grazing behaviour of high producing dairy cows.

Page | 9
CONFERENCE PROGRAM
TAILORING TECHNOLOGY
A TWO-DAY EXPLORATION OF THE NEW TECHNOLOGY OPTIONS FOR AUSTRALIAN DAIRY FARMS, UNDERSTANDING THAT ONE-SIZE DOESN’T NECESSARILY FIT ALL!
INCORPORATING THE EMERGING DAIRY SCIENTISTS’ AWARD
DAY 1 – LIZ KERNOHAN CONFERENCE CENTRE
8.00 Trade Exhibitions and Registrations
SESSION 1 – International perspectives
8.45 Official Welcome Dr Rosanne Taylor, Dean Faculty of Veterinary Science, University of Sydney and Ian Halliday, Managing Director, Dairy Australia
9.00 International keynote Dr Kees de Koning, Research leader, Dairy Campus, Wageningen University, The Netherlands. This acclaimed scientist led the multi-national EU AMS project in the 1990s and knows better than most, the opportunities that AMS technology will offer dairy farmers of the future. Whilst AMS is not for everyone (yet), the technology that drives it is has application to us all. This is a unique opportunity to hear what the latest trends and challenges are in this area.
9.45 International keynote, Dr Santiago Utzumi, Research leader, AMS dairyKellog Biological Station, Michigan University, USASantiago is leading a research program of pasture-based AMS cows in Michigan, where cows graze during the spring-summer and are fed TMR during the 1-m snow winter. Whilst those conditions aren’t common to Australian dairy, what is of great relevance is the management of high producing cows during the grazing season, and also what can we take from the TMR phase in winter. His research work also monitors methane emissions from the AMS cows. His presentation will draw on this experience in order to challenge the Australian audience to extract some new approaches for our conditions.
10.30 Morning Tea
SESSION 2 - The Farmer Case Studies
A selection of farmer case studies that explore the challenges and opportunities associated with AMS from a range of feeding systems and environments.
11.00 Grant Williams – a pasture-based low input system – from Hallora, Gippsland, Victoria
11.20 Simon Scowen – a high producing/high input system – from Kentgrove Pastoral, Mt Gambier, SA
11.40 Matthew Cahill – operates his AMS under feedlot conditions - from Matandali Pastoral, Beaudesert , QLD
12.00 Discussion panel
12.30 Lunch

Page | 10
SESSION 3 – New approaches to traditional systems
1.30 Exploring the profit probability curve: Dairy Australia’s Dr Steve Little teams up with emerging dairy professional Courtney Gronow (University of Melbourne Masters student working at Agrilink FarmStats in Victoria) to discuss feeding system performance and showcase an exciting new opportunity to factor risk and return into farm decision making and the profit planning process.
2.20 New ways of looking at Feed Conversion Efficiency: The CRC’s Dr Jennie Pryce is part of an exciting new project that will enable farmers to use genomics to select for FCE. She says there are significant opportunities to select for efficient converters of feed into profit.
2.55 A new meaning to timing: Queensland based veterinarian Dr Carl Hockey sheds a different light on the average AI program, questioning traditional practises and suggesting new ones.
3.30 Afternoon Tea
4.00 Calf Rearing Case study: An exploration of labour efficiency, growth and survival from a 650 cow WA herd, presented by veterinary consultant Dr Peter Rosher and his ‘star’ calf rearing client, Wade Scott from Boyanup, WA.
4.45 Housekeeping and Day 1 close
6.30 Symposium dinner at Gledswood Winery
DAY 2 - CAMDEN ROBOTIC MILKING RESEARCH FARM
Today our crowd rotates around 4 sites, working in groups of approximately 50 as delegates have ‘up close and personal’ conversations with our team of presenters – who range from experienced researchers to young and emerging scientists to a selection of dairy farmers whose perspectives we share and value. Spend 80 minutes at each site, (40 minutes per platform) – and really get to know the technological future of your industry.
8.30 Arrival and welcome
9.00 Platform presentations commence (four platform stations visited in this period over two sites)
12.00 Lunch
12.30 Visit the final four platforms
3.00 Announcement of the winner of the Emerging Dairy Scientist Competition Platform Presentation Series (incorporating the Emerging Dairy Scientists’ Program)
FETURE PLATFORMS
Page | 11
Site # 1
PLATFORM 1 ALL THINGS ROBOTIC
• Rotary Robots up close and personal – with Dr Kendra Kerrisk
• You snooze, you lose – Emerging dairy scientist Tori Scott explains cow queuing behaviour within a voluntary trafficking system.
• More Meals, More Milk, Higher Efficiency – Emerging dairy scientist Nicolas Lyons discusses management routines to optimise milking intervals and impact on milk production.
• Moove out the way – Emerging dairy scientist Rene Kolbach provides his findings on the effect of different bail activation sequences within a robotic rotary dairy.
PLATFORM 2 COW COMFORT UNDER THE SPOTLIGHT
US veterinarian Dr Karl Burgi, known as the ‘cow comfort specialist’ takes visitors through a practical demonstration of foot trimming underpinned by his comfort philosophies.
Site # 2
PLATFORM 3 NEW TECHNOLOGIES FOR NUTRIENT MANAGEMENT
• Driving Nitrogen further on your dairy farm
• Monitoring and managing spatial variability in pastures - University of New England researcher Mark Trotter talks about developing Active Optical Sensors to increase Nitrogen use efficiency and GPS tracking to understand dairy cow pasture utilisation and nutrient redistribution.
PLATFORM 4 REPRODUCTION
WA dairy veterinarian Dr Peter Rosher has extensive experience in calf rearing and the intricacies of extended lactation and today we ask him to facilitate the presentation and ensuing discussions of three of our emerging scientists:
• Extending lactation of dairy cows – Emerging dairy scientist Mary Abdelsayed looks at the challenges of breeding for extended lactation in Australian dairy cows.
• Narrowing the gap – Emerging dairy scientist Claire Kentler explores the intricacies of innate immunity to reduce calf mortality rates.
• Quantifying genetics to accelerate development - Emerging dairy scientist David McGill talks about the Future of Breeding Values in Australia.

Page | 12
Site # 3
PLATFORM 5 COMPLEMENTARY FORAGES SYSTEMS AND THE HUNTER VALLEY PROJECT
• A celebration of the science in practise – NSW Department of Primary Industry’s Kerry Kempton and Anthea Lisle join with the Future Dairy Hunter Valley partner farmers to describe the journey over the last two years of implementing the Complementary Forage System research on farms.
PLATFORM 6 GREAT AGRONOMY
• Forage Planning – a money making exercise – Emerging dairy scientist Michael Campbell shares his investigation into the flexible use of different complementary forage systems in Northern Victoria.
• Agronomy after Camden: Former FutureDairy scientist turned consultant, Dr Santiago Farina from Intelact returns to Camden to talk about the application of FutureDairy and 3030 key findings on farming systems in Victoria.
Site # 4
PLATFORM 7 FACILITATING FEEDING
Camden consultant Dr Neil Moss from SBS Cibus has an intimate understanding of the research farm’s nutrition challenges – but today, his job is to facilitate the messages and applications from our three emerging scientists in the nutrition theme:
• Improving the response to transition feed with Vitamin D: Emerging dairy scientist Joe McGrath investigates the potential for Vitamin D in complementing transition feeds to reduce the impact of sub clinical hypocalcemia (milk fever) in calving cows.
• Exploring acidosis: Emerging dairy scientist Helen Golder looks at the links between nutrition, inflammatory responses, oxidative stress and acidosis.
PLATFORM 8 THE PRESSURE OF WATER:
NSW DPI’s Matthew Plunkett and David O’Donnell put the pressure on, so to speak, to raise the irrigation bar. This is a platform that explores water efficiency in all its forms - with a focus on the gadgets that improve irrigation efficiency, from installation of new G Dot moisture probes and a big hard look at the latest irrigation systems including the new big “Gun” sprinklers installed at the University. Joining them for the practical implementation perspective is the University of Sydney’s, Camden farm manager, Kim McKean.

Page | 13

Page | 14
AUTOMATIC MILKING: COMMON PRACTICE ON OVER 10,000 DAIRY FARMS WORLDWIDE KEES DE KONING Wageningen UR Livestock Research, Lelystad, The Netherlands
No other new technology since the introduction of the milking machine has aroused so much interest and expectations among dairy farmers and the periphery as automatic milking did. Since the first commercial systems appeared in 1992, automatic milking systems (AM-systems) have drawn considerable interest both to farmers as society. Reduced labor, a better social life for dairy farm families and increased milk yields due to more frequent milking are generally recognized as important benefits of automatic milking. Without doubt automatic milking changes many aspects of farm management since both the nature and organization of labor is altered. Manual labor is partly replaced by management and control, and the presence of the operator at regular milking times is no longer required. Visual control on cow and udder health at milking is, at least partly, taken over by automatic systems. Facilities for teat cleaning and separation of abnormal milk are incorporated into the automatic system and several adaptations are needed to accommodate continuous milking. Cow management including routing within the barn, the opportunity for grazing and the use of total mixed rations is altered. A high level of management and realistic expectations are essential to successful adoption of automatic milking. Results from commercial farms indicate, that milk quality is somewhat negatively affected, although bacterial counts and somatic cell counts remain well below penalty levels. In terms of quality control, AM-systems offer extra means to assure milk quality and food safety. No adverse effects of the transition have been found for body condition, lameness or teat condition. Automatic milking systems require a higher investment than conventional milking systems. However increased milk yields and reduced labor requirements may lead to a decrease in the fixed costs per kg milk. In recent years the first mobile automatic milking systems appeared on dairy farms in Denmark and The Netherlands. Automatic milking has gained widespread acceptance and is mid 2011 estimated to be in use on more than 11000 farms in over 25 countries worldwide. The historical development of automatic milking, as well as the current situation and perceived challenges and opportunities for future development of automatic milking are discussed.
Introduction
The main reason to start the development of automatic milking in the eighties of the last century was the need for improved labor efficacy due to the growing costs of labor in many dairy countries (Rossing et al, 1985; Rossing & Hogewerf, 1997; Lind et al, 2000). Milking is on many dairy-farms a time consuming activity, which takes about 25 to 35% of the annual labor demand. In this way the milking activities contribute also substantially to the costs of the

Page | 15
farm enterprise. Apart from substituting manual labor by technology, robotic milking affects the whole farming operation. The farmer's presence at regular milking times is no longer required. The nature and organization of farm labor changes such that manual labor dealing with milking is largely replaced by management and control activities.
Regular visual checks of cow and udder health during milking are, taken over by automated monitoring using smart sensor technology. Satisfactory cleaning of cows and teats, as well as milk analysis and separating abnormal milk is required. An AM-system is in use for 24 hrs a day, which requires a high reliability of the system as well as the adaptation of cleaning and cooling systems. Permanent access to the milking system may require specific cow routing within the barn and is likely to affect the possibilities of grazing. Although less than with conventional milking systems, many AM-farms are able to apply (partly) grazing. Reduced labor demand and better social circumstances for the dairy farmers are the attractive benefits of AM-systems. Other potential benefits are improved animal health and wellbeing and increased milk yields.
Technical aspects
After the development of the milking machine, milking parlors and automatic cluster removers in the sixties and seventies of the last century, automatic attachment of the teat cups was the only missing step in the complete automation of the milking process. The development of AM-systems started with the development of equipment for automatic attachment of the teat cups (Rossing & Hogewerf, 1997). However automatic milking requires more than automatic teat cup attachment. An AM-system has several main modules, like the milking stall itself, the teat cleaning system, the teat detection system, a robotic arm device for attaching the teat cups, a control system including sensors and software and of course the milking machine.
AM-systems include single stall systems with integrated robotic and milking functions and multi-stall systems with a transportable robot device, combined with milking and detachment devices at each stall. Single stall systems are able to milk 55-65 cows several times a day, while multi-stall systems with 2 to 4 stalls milk 80 to 150 cows up to three times per day. Automatic milking strongly relies on the cow’s motivation to visit the AM-system voluntarily. The main motive for this is the supply of concentrates dispensed in a feed manger in the milking box during the milking process. An automatic milking system has to take over the ‘eyes, ears and hands” of the milker. Therefore such a system is equipped with electronic cow identification, cleaning and milking devices and computer controlled sensors to detect abnormalities in milk, in order to meet international legislation and hygiene rules from the dairy industry. Teat cleaning systems include brushes or rollers, inside teat-cup cleaning or a separate ‘teat cup like’ cleaning device. Several trials showed that cleaning with a device is better than no cleaning (Schuiling, 1992, Knappstein et al, 2004), although these systems are not as good as manual cleaning by the herdsman. AM-systems are also equipped with sensors to observe and to control the milking process. Data are automatically stored in a database and the farmer has a management program to control the settings and conditions for cows to be milked. Attention lists and reports are presented to the farmer by screen or printer

Page | 16
messages. The AM-system also provides remote notification to the farmer if intervention is required.
Farms with Automatic Milking Systems
The first AM-systems on commercial farms were implemented in The Netherlands in 1992. Increasing costs of inputs while milk prices decreased, forced farmers to increase their output per man-hour. After the introduction of the first AM-systems, adoption went slowly, until the end of the nineties. From 2000 automatic milking became an accepted technology in the Netherlands and other European countries, but also Japan and North America. At the end of 2010, worldwide over 10,000 commercial farms used one or more AM-systems to milk their cows (figure 1). The majority of farms are family run with 1 to 3 milking boxes, however also operations with more than 10 units can be found. More than 90 % of the world’s AMS farms are located in north-western Europe. The largest number AM farms is found in the Netherlands with over 2300 farms, however as a percentage of the national number of farms the greatest adoption can be found in the Scandinavian countries with up to 25% of the dairy farms using AMS.
To date, adoption of AMS has taken place in areas where there is a fairly high density of dairy production. Since AMS systems have a fairly high requirement for technical support, this has made servicing these systems manageable. In view of the importance of continuous operation, future adoption in less intense dairy production areas will result in new challenges regarding maintenance services.
Figure 1. Development of the number of AM-farms world-wide since first introduction in 1992.

Page | 17
Automatic Milking and Management Aspects
Switching from a milking parlor to automatic milking results in big changes for both the herdsman and the cows. Although with AMS immediate supervision of milking is eliminated, new labor tasks appear ((Schön et al, 1992; Lind et al, 2000; De Koning et al, 2002). They include control and cleaning of the AM-system, twice or three times a day checking of attention lists including visual control of the cows and fetching cows that exceeded maximum milking intervals. Compared with the conventional twice daily milking there is an average of 20% -30% reductions in total labor, but large variations between farms can be found. Especially in the first transition year, automatic milking might take extra time.
The biggest change without doubt lies in the nature of the labor. The physical work of machine milking is replaced with management tasks such as frequent checking of attention lists from the computer and appropriate follow up. This work is less time bound than parlor milking, so the input of labor is more flexible. This is attractive on family farms. But because milking is continuous, and system failures can occur anytime there must be a person “on call” at all times. System failures and associated alarms typically occur about once every two weeks although this varies with the level of maintenance and management. In terms of the impact on cows, the AM-system is not suitable for all cows. Poor udder shape and teat position may make attachment difficult and some cows may not be trainable to attend for milking voluntarily. In new installations, the number of cows found to be unsuitable is generally reported to be less than 5% (De Koning Rodenburg, 2004). In the transition from conventional to automatic milking, cows must learn to visit the AM-system at other than traditional milking times. Training and assistance in the first weeks should involve quiet and consistent handling, so the animals adapt quickly to the new surroundings and milking system.
Milking frequency
In practice, the average number of milkings per cow day varies from 2.5 till over 3.0 milkings per day, but rather big differences in milking intervals are reported by commercial farms. A typical figure is presented in figure 2. Almost 10% of the cows realized a milking frequency of 2 or lower over a two year period milking with a single stall AM-system. This occurred even though cows with a too long interval were fetched three times per day.

Page | 18
Figure 2. Frequency distribution of milking intervals in hours over a 2-year period (data high-tech farm Waiboerhoeve)
Such cows will not show an increase in yield or may even show a production loss. By changing the milking parameters of the AM-system, it is quite easy to prevent cows from being milked at low yields or short intervals. But it is much more difficult to prevent cows from being milked with long intervals. This means it will be necessary to manage the intervals by fetching cows that have exceeded a maximum interval. Usually this is done several times per day at fixed times around the cleaning procedures of the AM-system.
Increase in milk yield
One of the benefits of automatic milking is increased milk yield from more frequent milking. An increase from 6 to 25% in complete lactations has been shown when milking frequency increases from two times to three times per day (Erdman & Varner, 1995). As can be deducted from figure 2, several cows are milked less than twice a day in automatic milking and may therefore produce less milk. Data from all over Europe indicate a production increase of 5-10% for herds milked automatically (de Koning & Rodenburg, 2004, Bach et al, 2007, Bijl et al, 2007), however large variations can be seen. In many larger US herds with highly automated conventional parlors, 3 times daily milking is commonplace. For 3x herds adopting automatic milking, a production decrease of 5 to 10% would be expected (De Koning & Rodenburg, 2004).
Dynamic milking and feeding
Within automatic milking systems, a considerable variation in milking characteristics between individual cows, as well as in interval sensitivity as in feed efficiency can be seen. Current
0
2
4
6
8
10
12
14
16
<4 5 6 7 8 9 10 11 12 13 14 15 16 17 18 19
Length of milking interval (h)
% of milkings

Page | 19
decision support systems do not account for this variation. This is due to lack of applications that estimate individual response parameters from real time process data. Suitable models to enable on-line estimation are dynamic linear models (DLM), based on a Bayesian approach to time series analysis. A prototype for dynamic milking and feeding was developed and tested on the high-tech farm of Wageningen UR Livestock Research, both for milking frequencies as concentrate feeding (André et al, 2007, 2010). The first results show a considerable increase in feed efficiency and a better utilization of the AMS capacity.
Sensors and data handling
AM-systems are also equipped with sensor technology and integrated data management systems to observe and to control the milking process. Data are automatically stored in a database and the farmer has a management program to control the settings and conditions for cows to be milked. Attention lists and reports are presented to the farmer by screen or printer messages. With their sensors AM systems collect enormous amounts of data, which have to be processed with appropriate software (Hogeveen & Ouweltjes, 2003, De Koning & Ouweltjes, 2004). The challenge for both manufacturers as end users is to detect in the data the abnormalities, so actions can be taken. Because abnormalities are rare this is called management by exception. One of the problems for example is clinical mastitis, especially in relation to abnormal milk. By definition, milk of cows that suffer from mastitis has an abnormal visual appearance. It is also one of the most frequently occurring diseases in dairy cattle, and is responsible for the majority of abnormal milk. Despite this, milking a cow with abnormal milk is a rather exceptional event on most dairy farms. As an example, assume that abnormal milk is always caused by mastitis, that 25% of all cows have one case of mastitis each year, and that each mastitis case causes 10 milkings with abnormal milk. For a 100 cow herd with 310 days in milk per cow per year and 2.5 milkings per cow per day, only 0.32% of all milkings will be abnormal. This figure clearly indicates that, even with a high mastitis frequency, the percentage of abnormalities is very low.
Modern AM-systems are equipped with various sensors ranging from sensors to control the milking process till sensors that analyze the milk quality in several ways, like milk composition, cell counts, blood detection, conductivity, progesterone, and so on. All these sensors require smart data handling solutions in order to help the farmer to make the right decision. Research from Steeneveld et al (2010) showed that decision support systems based on sensor measurement are a valuable tool in mastitis control on farms using an AM-system. However adding non-AMS cow information to the data did not improve the clinical mastitis detection performance as is often expected by farmers.
Special guide lines for automatic milking were developed and approved for automatic milking systems and involved sensor technology within the framework of the International Standards Organisation (ISO20966, 2007).

Page | 20
Attitude and expectations
One important factor in successful implementation of an AM-system is the attitude and expectation of the dairy farmer (Mathijs, 2004, Ouweltjes & De Koning, 2004). Almost all manufacturers have had some customers switching back to conventional milking systems. While there is considerable variation in level of satisfaction with different types of systems, an estimated 5-10% of owners have switched back to conventional technology (De Koning& Rodenburg, 2004). In some cases expectations were not realistic, in others farmers were unable to adapt to the different management style, and in some cases a high rate of failures of the AM-system discouraged the farmer to continue. However this figure seems to decrease in more recent years, showing that farmers improved their decision process before buying and also that hardware technology has been improved. During the startup period, automatic milking requires a high input of labor and management. Key factors of a successful implementation of AM-systems are:
• Realistic expectations;
• Good support by skilled consultants before, during and after implementation;
• Flexibility and discipline to control the system and the cows;
• Ability to work with computers;
• Much attention to the barn layout and a good functioning cow traffic;
• Good technical functioning of the AM-system and regular maintenance;
• Healthy cows with good feet and ‘aggressive’ eating behavior.
Barn Layout
Since automatic milking systems largely depend on voluntary attendance, a well laid-out free stall barn is essential for success (Lind et al, 2000). The main motive for a cow to visit the AMS is the concentrate provided in the manger of the milking box. Cows should have easy access to the milking stall and selection gates: long alleys, steps and other obstructions should be avoided. A central location for the AM-system minimizes walking distances of the cows. In many countries regulations from the dairy industry require that the AM-system has to be located close to the milking room and that the system is accessible to the operator or the service technician through a clean route.
Cow traffic
After visiting the milking system, the cow should have access to the feeding area. In “forced traffic” systems she has to pass the milking system in order to get access. In “controlled traffic” systems one-way-gates, with cow identification and selection capabilities, restrict
Page | 21
cows to go directly to the feeding area only when the interval since the last milking exceeds the pre-set minimum.
AM-systems with a high occupancy rate and forced traffic may affect the number of visits to the roughage station or feeding fence. In “free cow traffic” systems access to the feeding area is unrestricted and only the concentrate fed in the AM system is used to attract cows. Forced traffic can improve the number of voluntary milkings, however it alters eating and lying behavior (De Koning & Rodenburg, 2004, Hams, 2004, Bach et al, 2009). This might even result in reduced intake of roughage and therefore also production losses. Free, semi-free and forced cow traffic have been tested in several studies. Harms (2004) observed that free cow traffic resulted in lower milking frequencies and higher number of fetched cows due to long milking intervals. Milk yield did not differed much, but tended to be higher in the free traffic system. Unlimited access to feed is a prerequisite for cow traffic and milking visits. Harms (2004) reported that in all tested traffic systems repeated lack of feed resulted in decreased number of milkings. There is general consensus that for animal welfare, (semi) free cow traffic is preferred An example of the semi free cow traffic is the Feed-First principle which is used as a mix between controlled cow traffic and free cow traffic. The system also relies on the cows’ motivation to eat. Without doubt, well-functioning cow traffic is a key-factor for successful automatic milking. This can be achieved when feed is available for 24h/day.
Grazing
In most European countries, grazing during summer time is common routine, in some Scandinavian countries like Sweden even compulsory. Moreover, from an ethological point of view, many consumers in North Western Europe believe grazing is essential for cows and several Dutch dairies pay a premium for milk from grazed herds. In the Netherlands grazing is common practice (>80%). The basic principle of grazing cows is that they need to walk at least twice a day to a barn with a milking parlor to be milked. This is faced with problems. The development of large-scale farms and the related large dairy herds lead to long walking distances, increased labor demands and, in many cases, milk production losses. Often the allocation of land makes grazing impossible or leaves too little area for the purpose, causing high leaching potentials due too large urination and defecation surplus.
The introduction of automatic milking induced extra problems, caused by the reluctance of cows to come voluntarily when distances to the barn are longer than 500 meters. In The Netherlands only about 52% of the farms with an AM-system apply grazing, showing on one hand that grazing in combination with AM is less common, but on the other that it is still possible (Van der Vorst & Ouweltjes, 2003; Mathijs, 2004). Overcapacity of the AM-system, e.g. fewer cows per AM-system can partly compensate but this solution is inefficient due the increased fixed costs of the robots. In respect of capacity use of the milking system and percentage of cows to be fetched, restricted grazing systems perform better than unrestricted (Van Dooren et al., 2004). Walking distances of up to 500 meters seem to be of little influence on the frequency of robot visits, however longer distances show a negative effect. Moreover the natural synchronized behavior of the cows when moving to the milking
Page | 22
unit in the barn causes cueing in front of the AM-system and also ineffective feeding. Several solutions are available to overcome (partly) the disadvantages. Smart pasture gates or selection boxes that control the cow traffic to and from the pasture can be a very helpful tool to the farmer. Only those cows that have recently been milked are sent outside, while the cows that still need to be milked, have to stay inside. Cows have to be attracted to go outside and inside the barn. Grass quality, walking distances, cow health, weather conditions and water supply are important factors within a grazing system. It is widely accepted that water supply should not be limited, nor be used as a motivation for cow to return to the barn.
Grazing is critical to low cost milk production in Ireland, Australia and New Zealand. An extensive research project in New Zealand, the “Greenfield” project showed that automatic milking in a 100% grazing system under very different circumstances than those found in Europe is quite well possible (Jago et al, 2004).
Mobile automatic milking systems
While AM-systems are always positioned in a fixed place within the barn, some years ago the idea was born to design a mobile milking robot. Recently prototypes of mobile automatic milking equipment have been developed in Denmark and the Netherlands. A Mobile Automatic Milking System (MAMS) follows the cows to the pasture. This solves the problem of long distances between the grazing cow and the immobile automatic milk system in the barn. The development of mobile automatic milking systems might also be an opportunity to maintain grazing with bigger herds and on grassland not close to the farm. While the Danish mobile milking system (Oudshoorn et al, 2008) uses a transportable automatic milking system positioned for several months at the pasture, the Dutch mobile milking system can drive from one place to another (Lennsinck & Zevenbergen, 2007). The system has caterpillar tracks resulting in a very low pressure per square centimeter to prevent grassland damage. The system is equipped with all necessary machinery, bulk tank, vacuum pump, cleaning systems and an automatic milking system so it can operate independently for 2 days. The system was tested in 2008 during the grazing season with a herd of 35 cows with good results, both technically as with respect to the cows (Houwelingen et al, 2009). During the 2009 grazing season a herd with 60 cows was managed by the mobile milking system. The research focused on the grazing system and the relation with cow traffic and the milking frequency. The mobile milking system was capable to combine a herd of 60 cows with 24 hour grazing without additional roughage supply while producing a rolling average of 7500 kg milk/year. Offering fresh grass when passing the milking robot really motivates cows to visit the robot. Development of selection units preventing individual cows to enter fresh grass without being milked might or strip grazing might increase milking frequencies (De Haan et al, 2010).
Animal Health
Within a large EU project Automatic Milking carried out between 2000 and 2004, special attention was paid to animal health. In Denmark, The Netherlands, and the UK, 15 herds each were selected for monitoring the impact of transition to automated milking on animal health (Hillerton et al, 2004). The herds recruited represented the types of AMS marketed in each

Page | 23
country. Each farm was visited at least twice before installation of the AMS and a minimum of twice, but often up to six times, after installation. On these visits assessments were made of at least half of the cows or fifty animals on body condition and locomotion, and forty cows for teat condition (on some farms in the Netherlands and UK only). Farm data including milk production, milk quality, animal records on individual cow milk cell count, fertility, animal treatments, animal movements, veterinary purchases were collected.
The body conditions varied more between countries than in response to the introduction of AM (Hillerton et al, 2004). In Denmark and the UK there was no change in body condition between 3-6 months prior to AM installation and 6 months post installation. A slight but not significant drop occurred with the Dutch cows. On the Dutch farms the range of body condition narrowed significantly from 1.35 to 0.98 points score suggesting that the farms are managing body condition better.
No change in locomotion was seen one month after AM installation. The scores in Denmark and UK increased slightly by 3 months after installation, but not significant. In the UK the average score increased on seven farms whilst unchanged on 6 farms. Scoring was continued on 12 of the UK farms. Twelve months after installation of AMS the lameness has increased significantly. Prior to installation eleven of fourteen UK herds were grazed but only six after installation. The poorer locomotion may reflect the increase in constant housing (Hillerton et al, 2004). The overall impact of conversion to AM was assessed by comparing how each individual farm handled the main indicators of animal health during and after the transition to automatic milking. Comparing 12 Dutch farms only one farm improved in locomotion, body condition as well as cell counts. Overall, little change was apparent. Locomotion improved in five herds and deteriorated in five herds. Body condition score decreased in eight herds but only by a small amount. It increased in two herds but not making the cows any fatter, just more typical. The only major deterioration found was an increase in somatic cell count and the proportion of cows with a cell count above a threshold, where only two of the herds produced better quality milk. Overall there was little evidence of major changes occurring in the common measures of fertility. None of the changes were statistically significant but all suggestive of poorer fertility, at least in the transition period from conventional milking to AM.
Hillerton et al (2004) conclude that no major problems in converting from conventional milking to AM could be identified but equally none of the 44 farms has been found to achieve a substantial improvement in any aspect of cow health. The transition period to AMS comprises a period of higher risk to health that extends from weeks before installation when resources start to be diverted from cow management. The length of the transition will vary on individual farms related to many unique factors. Several potential problems may develop in the longer term and anticipation of these is necessary.
A large study to risk factors related with automatic milking in The Netherlands (Neijenhuis et al, 2009) showed that risk factors for mastitis are more or less comparable with those found at conventional milking. However the udder health status in the period just before the transition to automatic milking showed a large correlation with the udder health status

Page | 24
afterwards. Dohmen et al ( 2010) concluded that both at the farm level was well as the cow level, a direction relation was found between cow hygiene and SCC confirming the relationship between cow hygiene and udder health on AMS-farms.
Milk quality
Milk quality is a critical concern on modern dairy farms because milk payment systems are based on milk quality and consumers expect a high level of quality and safety from the milk products they buy. Although automatic milking uses the same milking principles as conventional milking, there are major differences. The AM-system is in use for 24 hours continuously. Visual control during the milking process is not possible. Cows will visit the AM-system more or less voluntarily and this will result in a big variation in the milking frequency from cow to cow. All these aspects may influence the quality of the milk produced.
Somatic cell count (SCC) and Total Bacterial Count (TBC) are, respectively, measurements of the number of white blood cells and the total number of bacteria present in a milk sample. A high SCC might indicate reduced udder health due to Mastitis (udder infection) and implies a lowered milk quality. The cleaning of the milking equipment and the cooling of the milk seem to be the most important factors regarding the increase in TBC. In general AMS herds consistently show slightly higher SCC and TBC values than conventionally milked herds (Klungel et al, 2000; Rasmussen et al, 2002; De Koning et al, 2004). Table 1 presents the results for 4 quality parameters. In general differences are relatively small and far within the requirements of the dairy industry. Nevertheless with 24h operation, milk hygiene requires continuous attention from the herdsman. Special attention has to be paid to teat cleaning and the cleaning of the teat cups and the milking machine including transfer line to the bulk tank, Hygiene management should not only focus to the automatic milking system, but also to the general hygiene standards in cubicles and the floors in the barn.
Table 1. Milk quality results for farms before and after introduction of AM-system (adapted: De Koning et al, 2004)
Conventional milking Automatic Milking Two times milking Three times milking Before After
Bacterial count (*1000/ml) 8 8 8 12
Cell count (* 1000/ml) 181 175 175 190
Freezing point (°C) -0,520 -0,521 -0,521 -0,516
Free fatty acids (meq/100 g fat)
0,44 0,54 0,41 0,59
Page | 25
Free fatty acids
Free Fatty Acids (FFA) in milk are formed as a result of hydrolysis of milk fat by milk lipase, also called lipolysis. Milk fat is protected from lipase activity because the milk fat is protected by a membrane around the milk fat globules. Lipolysis can be initiated either by physical damage to milk fat globules during milking or pumping, stirring or cooling of milk or by animal-related factors such as the cow’s health status, lactation stage, the frequency of milking and dietary factors.
It is generally known that the content of free fatty acids (FFA) in milk will increase with shorter milking intervals, all the more if the yield per milking is rather low. All studies with AM-systems show a significant increase in FFA levels for AM-systems (Ipema & Schuiling, 1992; Klungel et al, 2000; Rasmussen et al, 2002, De Koning et al, 2004). This increase cannot be explained solely by the shorter intervals, because the increase of FFA with AM-systems is even bigger than with conventional milking parlors milking three times per day. In a Danish study (Rasmussen et al, 2006) small but statistically significant differences in average FFA concentration of milk between five different brands were detected. Apart from differences in diameter or length of “short” milk tubes, the technical specifications of the AM systems could not explain these differences.
AM systems generally have about 3 to 4 times higher air intakes (air inlet) during milking than conventional milking clusters. It is known that excessive air intake increases lipolysis in raw milk. The higher air intake of AM systems has been recognized as a factor that can partially explain higher FFA concentrations of raw milk. Rasmussen et al (2006) also reported on visits to 55 farms with high FFA levels. For 31 conventional farms most frequent faults were air leakage (71% of the herds) and intake of too much air in the cluster (61%) and pumping and stirring faults occurred on 29% of the farms. The main faults for 24 AM system farms concerned stirring of milk at very low levels in the bulk cool tank (79%), pumping of milk (67%) and the cooling of milk (58%). Low milk yields and low-energy diets increase the FFA level of milk. However, many aspects of the role of nutritional factors in lipolysis and FFA levels are still unclear and require further investigations.
Economic aspects
Investment required for AM-systems are much higher than for conventional milking systems and thus the fixed costs of milking are higher. However more milk with less labour means that the costs of milking per kg of milk will decrease. Theoretically, with an AM-system more cows can be kept with the same labor force than with conventional milking, but this may involve additional investments in buildings, land or feed and perhaps in milk quota. On a farm with more than one full time worker the possibility exists to reduce labor input and thus costs. Quite often that does not happen and the time saved as a result of lower labor requirement is used for personal activities. Meknes and Mathijs (2002) found that two third of AM-farmers state social reasons for investing in automatic milking, such as increased labor flexibility, improved social life and health concerns. In parts of North America, with large-size

Page | 26
herds and numerous milkers, it may turn out that savings on labor costs may become a decisive motive to implement automatic milking
Simulation models
Several simulation models have been developed to calculate the pure economic effect of investment in automated milking. The “Room for Investment” model computes the amount of money that can be invested in an AMS, without a decrease in net return compared with conventional milking (Arendzen & van Scheppingen, 2000). The RFI-value calculates the annual accumulated return from increased milk yield, savings in labor, and savings in not investing in a milking parlor and divides this by the annual costs of the AM-system. The model can use farm specific factors and circumstances to calculate the RFI-value. Figure 3 shows the results of a combined sensitivity analysis illustrating that increased milk yield and labor savings are essential factors regarding the economy of automatic milking. The RFI-value for the basic farm (700.000 kg milk, 8500 kg milk per cow per lactation, 82 cows, 75 hrs of labor per week ) with 500 kg per cow yield increase, 0,75 hour net labor saving per day (~10% labor saving), compared with an automated milking parlor and 20% annual costs of the AM-system amounts € 137.000. In this example this would be sufficient for investment in a single box (investment ~ €120,000). Both labor saving and yield increase have a large effect on the RFI value.
1500 1000 500 0
0 0,75
1,5 100
120
140
160
180
200
RFI -value
Increase in yield (kg) per cow
h / day
Figure 3. Room for Investment (RFI) due to labor saving and milk yield increase with annual costs for AM-system of 25% of investment. Comparison made with a highly automated milking parlour

Page | 27
American models (Rodenburg, 2002; Rotz et al, 2003) suggest that on large farms, as the hours of use of large automated milking parlors increase, their relative economic advantage over AM-systems increases. These studies showed that on farms with 60 to 180 cows, capital investment in automatic milking is only slightly higher than in conventional milking systems, in part because of smaller space requirements than for parlors with large holding areas. Lower labor input for AM-systems makes them competitive in this herd size range. For herds with more than 240 – 270 cows, extending the hours of use of conventional parlors, without additional capital investment made parlor milking much more efficient. It follows that in the central and western United States, where herds of 500 to several thousand cows predominate, widespread adoption of automatic milking will not occur unless capital cost of these systems decrease or labor costs increase substantially. Since both of these parameters are highly likely to trend in this direction, more widespread adoption of automatic milking in nearly all areas of the developed world would appear to be only a matter of time.
Economic results from commercial farms
Economic results from commercial farms show that the use of AM-systems in general is profitable, although highly depending on the extra milk yield and labor savings. A Dutch case control study (Bijl et al, 2007) between farms with AM-systems and farms with conventional milking systems showed no differences in margin, although fixed costs for the AM-farms were higher. AM-farms saved 29% labor and therefore when economical results were transformed to full time equivalents (FTE), AM-farms in the case control study had greater revenues, margins, and gross margins per FTE than the farms with conventional milking systems. So when deciding between investment in an AM-system or in a conventional milking system, dairy farmers must weigh decreased labor needs for the AM-system against the increased fixed costs of milking with an AM-system. Therefore in many cases adoption of an AM-system is for many dairy farmers a socio-economic decision, rather than just a purely economic decision ( Mathijs, 2004; Bijl et al, 2007).
Concluding remarks
The number of farms milking with automatic milking has increased significantly since 2000. In areas where labor is expensive or in short supply automatic milking is a valid alternative to traditional parlor milking. However if labor is available, and particularly where herd sizes are large conventional milking, often with rotary or rapid exit parlors equipped with features to increase throughput per man hour will remain popular. The introduction of automatic milking has a large impact on the farm and affects all aspects of dairy farming. Because milking is voluntarily there is large variation in milking intervals. Both farm management and the lifestyle of the farmer is altered by automatic milking. AM-systems require a higher investment than conventional milking systems but increased milk yields and reduced labor may lead to lower fixed costs per kg milk and increased margins per FTE.
Successful adoption of automatic milking depends on the management skills of the farmer and the barn layout and farming conditions. Animal health and well-being is not negatively affected by automatic milking, but till now no particular benefits for the health of the cows
Page | 28
have been found. Grazing is a common routine in many countries and although grazing with automatic milking requires extra attention from the herdsman, grazing is still profitable. New solutions like mobile milking systems might be an alternative for large herds. Improved sensor technology will help farmers to manage the individual cow within the herd. A better understanding of the characteristics of automatic milking systems will help farmers to make the right decision. Both conventional and automatic milking will be used on dairy farms in modern dairy countries in the foreseeable future. Even mixed systems like conventional milking rotaries with robotic technology already entered enter the dairy scenery.
References
André, G., W. Ouweltjes, R.L.G. Zom, E.J.B. Bleumer. 2007. Increasing economic profit of dairy production utilizing individual real time process data. Precision Livestock Farming ’07 (Ed. S. Cox), pp. 179-186, Wageningen: Wageningen Academic Publishers.
André, G., P.B.M. Berentsen, B. Engel, C.J.A.M. de Koning, A.G.J.M. Oude Lansink, 2010. Increasing the Revenues from Automatic Milking by Using Individual Variation in Milking Characteristics. Accepted for publication J. Dairy Sci.
Arendzen I, A.T.J van Scheppingen, 2000, Economical sensitivity of four main parameters defining the room for investement of AM-systems on dairy farms, in: Robotic Milking, Proceedings of the international symposium held in Lelystad, pp 201-211.
Bach, A., M. Devant, C. Igleasias, and A. Ferrer, 2009, Forced traffic in automatic milking systems effectively reduces the need to get cows, but alters eating behavior and does not improve milk yield of dairy cattle, Journal of Dairy Science 92:1272–1280.
Bijl, R., S. R. Kooistra, and H. Hogeveen, 2007, The Profitability of Automatic Milking on Dutch Dairy Farms, Journal of Dairy Science 90:239–248.
De Haan, M., 2010, project leader project mobile milking Wageningen UR Livestock Research – personal communication.
De Koning C.J.A.M., and W. Ouweltjes, 2000, Maximising the milking capacity of an automatic milking system, in: Robotic Milking, Proceedings of the international symposium held in Lelystad, pp 38-46.
De Koning, C.J.A.M., Y. van de Vorst, A. Meijering, 2002, Automatic milking experience and development in Europe, in: Proceedings of the first North American Conference on Robotic Milking, Toronto, Canada, pp I1 – I11.
De Koning, C.J.A.M., J. Rodenburg, 2004, Automatic Milking: State of the Art in Europe and North America. In: Meijering A, Hogeveen H, De Koning CJAM (eds). Automatic milking – A better understanding, Wageningen Academic Publishers, Wageningen, the Netherlands, pp 27-40.

Page | 29
De Koning, C.J.A.M., B. Slaghuis, Y. van der Vorst, 2004. Milk Quality on Farms with an Automatic Milking System. In: A.Meijering, H. Hogeveen C.J.A.M. de Koning (Eds) Proceedings of the international symposium Automatic Milking, a better understanding, Wageningen Academic Publishers, Wageningen, The Netherlands, pp 311-320.
Dohmen, W., F. Neijenhuis, H. Hogeveen, 2010, Relationship between udder health and hygiene on farms with an automatic milking system, Journal of Dairy Science 93:4019–4033.
Erdman, R.A. and M. Varner. 1995. Fixed yield responses to increased milking frequency. Journal of Dairy Science 78: 1199-1203.
Haan, M.H.A. de; Philipsen, A.P.; Pol-van Dasselaar, A. van den; Holshof, G.; Lenssinck, F.A.J.; Koning, C.J.A.M. de (2010), Better grazing opportunities with a mobile milking robot. In: 23th General Meeting of the European Grassland Federation, Kiel, Germany, 29 August - 02 September, 2010. - Zürich, Switzerland: European Grassland Federation EGF, 23th General Meeting of the European Grassland Federation, Kiel, Germany, 2010-08-29/ 2010-09-02.
Harms, J. , 2004. Untersuchungen zum Einsatz verschiedener Varianten des Tierumtriebs bei automatischen Melksystemen (Einboxenanlagen). PhD. Dissertation Institute of Agricultural Engineering, Technial University of Munich, Germany.
Hillerton JE, Dearing J, Dale J, Poelarends JJ, Neijenhuis F, Sampimon OC, Miltenburg JDHM, Fossing C. 2004, Impact of automatic milking on animal health. In: Meijering A, Hogeveen H, De Koning CJAM (eds). Automatic milking – A better understanding. Pp 125-34. Wageningen Academic Publishers, Wageningen, the Netherlands.
Hogeveen, H., A.J.H. van Lent and C.J. Jagtenberg (1998). Free and one-way cow traffic in combination with automatic milking, in J.P. Chastain (editor) Proceedings of the Fourth International Dairy Housing Conference, ASAE 01-98, pp 80-87, Michigan, U.S.A.
Hogeveen, H., W. Ouweltjes, 2003, Sensors and management support in high-technology milking, Journal of Animal Science 2003. 81:1-10.
Houwelingen, K.M., M.H.A. de Haan, F. Lenssinck, A.P. Philipsen, R. N. Baars, 2009, First experiences in mobile automatic milking, report 196 (in Dutch), Wageningen UR Livestock Research.
Ipema, A.H., Schuiling, E., 1992. Free fatty acids; influence of milking frequency. Proceedings of the Sumposium Prospects for Automatic Milking November 23-25, 1992, EAAP Publ. 65, Wageningen, The Netherlands, pp 491-496.
ISO20966, 2007, Automatic milking installations -- Requirements and testing. International Organization for Standardization (ISO), Paris, www.iso.org .
Jago, J., A. Jackson, K. Davis, R. Wieliczko, P. Copeman and M. Woolford, 2004, Automatic Dairy Farming in New Zealand using extensive grazing systems, In: A.Meijering, H. Hogeveen

Page | 30
C.J.A.M. de Koning (Eds) Proceedings of the International Symposium Automatic Milking, a better understanding, Wageningen Academic Publishers, The Netherlands.
Klungel, G.H., B.A.Slaghuis, H. Hogeveen, 2000, The effect of the introduction of automatic milking on milk quality, Journal of Dairy Science, 83:1998-2003.
Knappstein, K., N. Roth, B. Slaghuis, R. Ferwerda-van Zonneveld, H.G. Walte, J. Reichmuth, 2004, Farm hygiene and teat cleaning requirements in automatic milking, In: A.Meijering, H. Hogeveen C.J.A.M. de Koning (Eds) Proceedings of the International Symposium Automatic Milking, a better understanding, Wageningen Academic Publishers, The Netherlands, pp 83-93.
Lenssinck F., G. Zevenbergen, 2007, Mobiele melkrobot ‘Natureluur’ melkt koeien in de wei, Veehouderijtechniek, pp 16-17 (in Dutch).
Lind O., A.H. Ipema, C.J.A.M. de Koning, T.T. Mottram, H.J. Herrmann, 2000, Automatic milking, Bulletin of the IDF 348/2000, pp3-14.
Mathijs, E., 2004, Socio-economic aspects of automatic milking, In: A.Meijering, H. Hogeveen C.J.A.M. de Koning (Eds) Proceedings of the international symposium Automatic Milking, a better understanding, Wageningen Academic Publishers, Wageningen, The Netherlands, pp 46-55.
Meskens, L. and E. Mathijs, 2002, Socio-economic aspects of automatic milking; Motivation and characteristics of farmers investing in automatic milking systems. Deliverable D2 from EU project Implications of the introduction of automatic milking on dairy farms (QLK5 2000-31006), www.automaticmilking.nl.
Neijenhuis, F.N., J. Heinen, H. Hogeveen, 2009, Automatic milking: Risk factors for udder health, Report 257 (in Dutch), Wageningen UR Livestock Research.
Oudshoorn, F.W., 2008, Mobile milking robot offers new grazing concept, In: Proceedings of 22nd General Meeting of the European Grassland Federation.
Ouweltjes, W., C.J.A.M. de Koning, 2004. Demands and opportunities for operational management support. Proceedings of the international symposium Automatic Milking, a better understanding, Wageningen Academic Publishers, Wageningen, The Netherlands, pp 433-442.
Rasmussen, M.D., Wiking, L., Bjerring, M. & Larsen, H.C. (2006) Influence of air intake on the concentration of free fatty acids and vacuum fluctuations during automatic milking. Journal of Dairy Science 89, 4596-4605.
Rossing, W, A.H. Ipema and P.F. Veltman (1985). The feasibility of milking in a feeding box. IMAG Research Report 85-2, Wageningen, The Netherlands.

Page | 31
Rossing, W., P.H. Hogewerf, 1997, State of the art of automatic milking systems, Computers and Electronics in Agriculture, Volume 17, Issue 1, pp 1-17.
Rotz, C.A., C.U. Coiner and K.J. Soder, 2003. Automatic Milking Systems, Farm Size and Milk Production, J. Dairy Sc. 86:4167-4177.
Schön, H., R. Artmann, H. Worstorff, 1992. The automation as a key issue in future oriented dairy farming: in: Proceedings of the international symposium on prospects for automatic milking, EAAP publication 65, pp 7-22.
Schuiling H.J., 1992, Teat cleaning and stimulation, in: Proceedings of the international symposium on prospects for automatic milking, EAAP publication 65, pp 164-168.
Steeneveld, W., C. Kamphuis, E. Mollenhorst, H. Hogeveen, 2010, In: Decision support for mastitis on farms with an automatic milking system / Steeneveld, W., Utrecht : Faculty of Veterinary Medicine, Utrecht University, 2010 - ISBN 9789039353844
Van der Vorst Y, Knappstein K, Rasmussen MD. 2002. Milk quality on farms with an automatic milking system; Effects of automatic milking on the quality of produced milk. www.automaticmilking.nl/projectresults/Reports/DeliverableD8.pdf. Research Institute for Animal Husbandry, Lelystad, The Netherlands.
Van Dooren, H. J. C., L. F. M. Heutinck, G. Biewenga and J. L. Zonderland, 2004. The influence of three grazing systems on AMS performance. In : A. Meijering, H. Hogeveen and C.J.A.M. de Koning (eds) Automatic Milking, a better understanding, Wageningen Academic Publishers, Wageningen, The Netherlands, pp 292-297.
Page | 32
STRATEGIES TO INCREASE THE EFFICIENCY OF AUTOMATIC MILKING AND MILK PRODUCTION FROM HIGH PRODUCING DAIRY COWS: LESSONS LEARNT AT THE KELLOGG BIOLOGICAL STATION’S PASTURE DAIRY RESEARCH CENTER
SANTIAGO UTSUMI
Assistant Professor of Animal Science W.K. Kellogg Biological Station, Michigan State University, United States Email: [email protected]
Introduction
Automatic milking systems (AMS), also known as robotic milking, are being accepted as a viable alternative to traditional parlor milking throughout the United States and the world. Currently, in North America there is an estimated of 500 AMS dairy farms voluntarily milking on average herd sizes ranging from 40 to 1200 cows (Rodenburg 2011). Most of these AMS farms are completely housed operations and consist in modular units of multiplier numbers of single AMS milking stalls with capacity to milk around 60 cows per AMS. It is estimated that as labor and production costs continue to increase and new improved AMS machinery arise, particularly for larger dairy operations (> 1000 cows), the adoption rate of AMS in North America will continue in the future.
The flexible labor and concept of continuous milking offered by current single AMS stalls is particularly attractive for moderate sized family farms where seasonal grazing from spring to fall continues as a profitable practice. Most of these pasture-based dairies are mainly concentrated in the Southeast, Midwest and North East regions of the US, representing an important segment for the American dairy industry. Adoption of AMS in small to moderate sized dairies (i.e. 60 - 200 cows), using either seasonal or year around milking strategy, may represent a viable option to leverage profit gains from savings in labor, feeding costs and potential for higher milk production (Rotz et al. 2003, De Koning 2010). Previous research work conducted in European countries, Australia and New Zealand has shown that single AMS milking stalls can be successfully combined with pasture grazing (Ketelaar-de Lauwere et al. 1999, Jago et al. 2002, Spordly et al. 2004, Greenall et al., 2004), but great variability in production results is found. This variability, implicit in the seasonality and difference in forage base, animal genetics and feeding systems across AMS farms, regions and countries, suggest that there is large flexibility of opportunities and room for future improvement of AMS management in grazing dairies. In North America, this is particularly important for the design of year around lactation, feeding and milking strategies to efficiently manage a high productivity per cow, AMS and area.
In 2009, Michigan State University established the Pasture Dairy Research Center (PDRC) at the W.K. Kellogg Biological Station (KBS), Hickory Corners, MI. The mission of the PDRC is “the development of a leadership program in research, education and extension on AMS pasture-based dairy systems, the agroecological interactions with ecosystem processes and the biophysical and socio-economic impacts on profit, labor, land use and environment”. In this report I present preliminary results of the first phase of the project (2009-2011). The
Page | 33
emphasis will be placed on some of the lessons learned from our first 2 years of managing AMS and grazing with high producing dairy cows.
The KBS dairy farm
The PDRC facility straddles the border between the Kalamazoo and Barry counties, MI and is located over a sandy loamy site dominated almost in the entirely by the Kalamazoo loam soil series (USDA-NRCS, 2009). This soil series is developed over a sandy parental material and exhibits a gentle to moderate slope of 2 to 6 %. The Kalamazoo series has a deep soil profile of more than 200 cm, including a loam layer over the first 30 cm followed by variable clay loam, gravelly loam sand, and gravelly sand layers. Soils at the farm have a well drainage capacity, a relatively rapid infiltration rate of 15-50 mm/h and a moderate water capacity of 180 mm. The historical mean annual precipitation in the area ranges between 760-915 mm, the mean annual air temperature between 7 - 9 ºC, and the frost-free period ranges between 140 to 150 d. Snow cover is common from December to March.
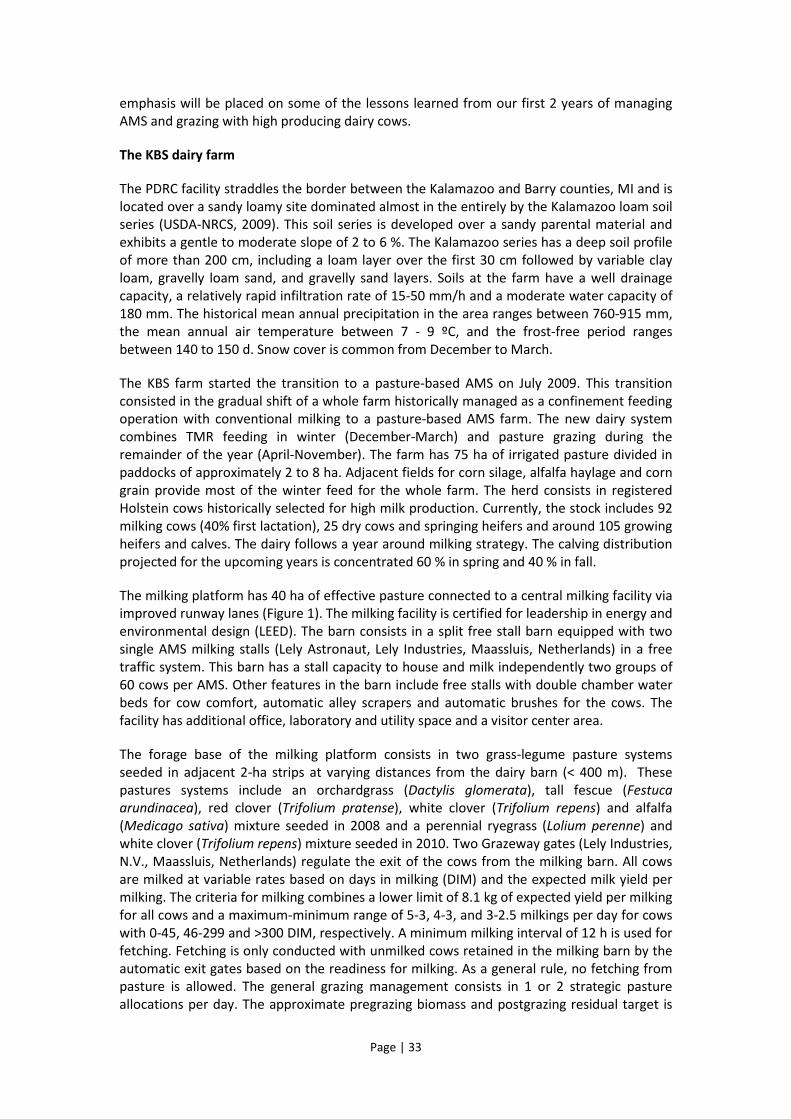
The KBS farm started the transition to a pasture-based AMS on July 2009. This transition consisted in the gradual shift of a whole farm historically managed as a confinement feeding operation with conventional milking to a pasture-based AMS farm. The new dairy system combines TMR feeding in winter (December-March) and pasture grazing during the remainder of the year (April-November). The farm has 75 ha of irrigated pasture divided in paddocks of approximately 2 to 8 ha. Adjacent fields for corn silage, alfalfa haylage and corn grain provide most of the winter feed for the whole farm. The herd consists in registered Holstein cows historically selected for high milk production. Currently, the stock includes 92 milking cows (40% first lactation), 25 dry cows and springing heifers and around 105 growing heifers and calves. The dairy follows a year around milking strategy. The calving distribution projected for the upcoming years is concentrated 60 % in spring and 40 % in fall.
The milking platform has 40 ha of effective pasture connected to a central milking facility via improved runway lanes (Figure 1). The milking facility is certified for leadership in energy and environmental design (LEED). The barn consists in a split free stall barn equipped with two single AMS milking stalls (Lely Astronaut, Lely Industries, Maassluis, Netherlands) in a free traffic system. This barn has a stall capacity to house and milk independently two groups of 60 cows per AMS. Other features in the barn include free stalls with double chamber water beds for cow comfort, automatic alley scrapers and automatic brushes for the cows. The facility has additional office, laboratory and utility space and a visitor center area.
The forage base of the milking platform consists in two grass-legume pasture systems seeded in adjacent 2-ha strips at varying distances from the dairy barn (< 400 m). These pastures systems include an orchardgrass (Dactylis glomerata), tall fescue (Festuca arundinacea), red clover (Trifolium pratense), white clover (Trifolium repens) and alfalfa (Medicago sativa) mixture seeded in 2008 and a perennial ryegrass (Lolium perenne) and white clover (Trifolium repens) mixture seeded in 2010. Two Grazeway gates (Lely Industries, N.V., Maassluis, Netherlands) regulate the exit of the cows from the milking barn. All cows are milked at variable rates based on days in milking (DIM) and the expected milk yield per milking. The criteria for milking combines a lower limit of 8.1 kg of expected yield per milking for all cows and a maximum-minimum range of 5-3, 4-3, and 3-2.5 milkings per day for cows with 0-45, 46-299 and >300 DIM, respectively. A minimum milking interval of 12 h is used for fetching. Fetching is only conducted with unmilked cows retained in the milking barn by the automatic exit gates based on the readiness for milking. As a general rule, no fetching from pasture is allowed. The general grazing management consists in 1 or 2 strategic pasture allocations per day. The approximate pregrazing biomass and postgrazing residual target is
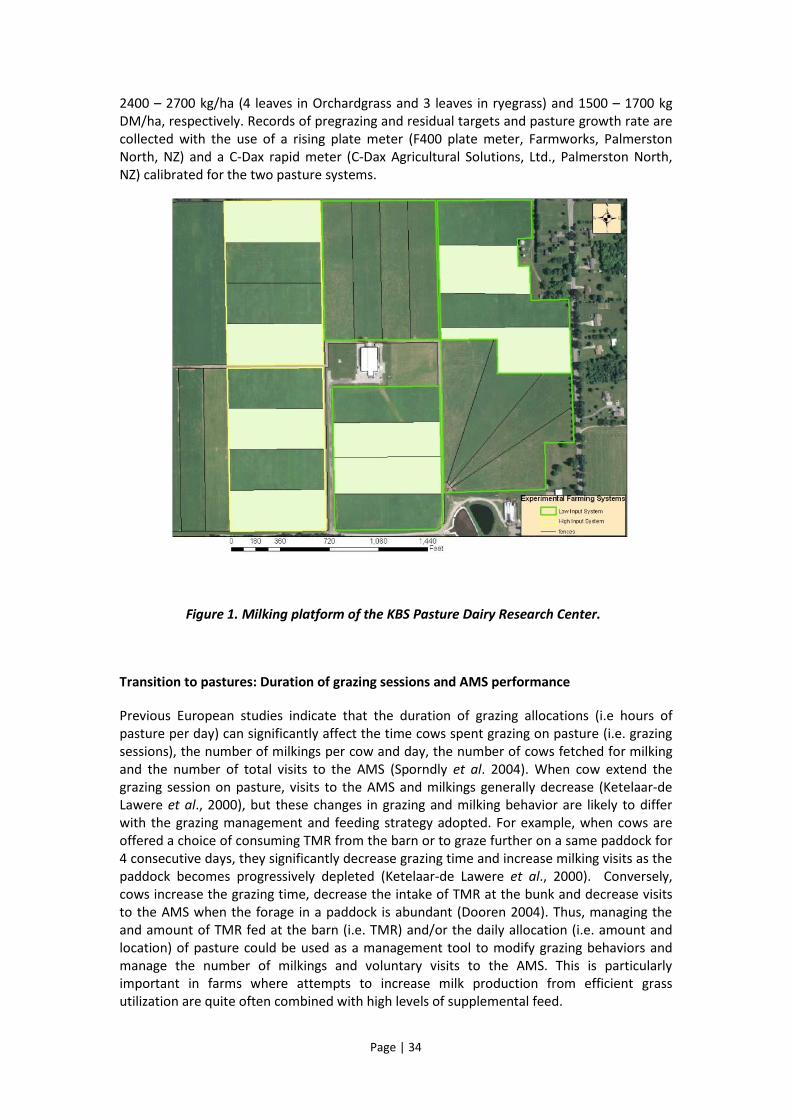
Page | 34
2400 – 2700 kg/ha (4 leaves in Orchardgrass and 3 leaves in ryegrass) and 1500 – 1700 kg DM/ha, respectively. Records of pregrazing and residual targets and pasture growth rate are collected with the use of a rising plate meter (F400 plate meter, Farmworks, Palmerston North, NZ) and a C-Dax rapid meter (C-Dax Agricultural Solutions, Ltd., Palmerston North, NZ) calibrated for the two pasture systems.
Figure 1. Milking platform of the KBS Pasture Dairy Research Center.
Transition to pastures: Duration of grazing sessions and AMS performance
Previous European studies indicate that the duration of grazing allocations (i.e hours of pasture per day) can significantly affect the time cows spent grazing on pasture (i.e. grazing sessions), the number of milkings per cow and day, the number of cows fetched for milking and the number of total visits to the AMS (Sporndly et al. 2004). When cow extend the grazing session on pasture, visits to the AMS and milkings generally decrease (Ketelaar-de Lawere et al., 2000), but these changes in grazing and milking behavior are likely to differ with the grazing management and feeding strategy adopted. For example, when cows are offered a choice of consuming TMR from the barn or to graze further on a same paddock for 4 consecutive days, they significantly decrease grazing time and increase milking visits as the paddock becomes progressively depleted (Ketelaar-de Lawere et al., 2000). Conversely, cows increase the grazing time, decrease the intake of TMR at the bunk and decrease visits to the AMS when the forage in a paddock is abundant (Dooren 2004). Thus, managing the and amount of TMR fed at the barn (i.e. TMR) and/or the daily allocation (i.e. amount and location) of pasture could be used as a management tool to modify grazing behaviors and manage the number of milkings and voluntary visits to the AMS. This is particularly important in farms where attempts to increase milk production from efficient grass utilization are quite often combined with high levels of supplemental feed.

Page | 35
During the first phase of the establishment of the pasture-based AMS at the KBS farm, the effect of the duration of grazing allocations on the AMS performance, milkings and milk production of the whole KBS herd was evaluated. Two groups of cows (n= 49±3, DIM = 213±1 d, Age = 3.8±01 yr, BW= 611±6 kg) voluntarily milked with single-stall AMS at rates of 4 to 2 milkings/day (based on DIM and milk yield), were exposed to 1-wk adaptation periods of 0, 2, 4, 6, and 8 h of grazing followed by six 1-wk periods of voluntary grazing (i.e. free traffic) for 12 h. Groups grazed (46 ± 8% intensity) on grass-legume strips located within 400 m from the barn. Exit to pasture was permitted via the computer-operated gates only when expected milking intervals (range: 6 to 12 h) were not exceeded. Fetching of cows with 12-h since the last successful milking was conducted twice per day, only with cows retained in the barn. Cows received once a day at 5 am declining amounts of a forage-based TMR (60 % forage-40% concentrate, fed to 5% orts; range: 19 to 10 kg DM/cow) at the bunk and 1 kg of concentrate per 4 kg of milk at the AMS stall. Contrast of linear and quadratic effects of the length of grazing periods on AMS performance and milking variables was conducted. Total milk, milking visits and the time AMS spent milking decreased linearly as grazing sessions extended (Table 1). Performance of AMS was likely increasingly limited by lower milkings and milk yield of individual cows exposed to longer grazing sessions (Table 1). Length of grazing sessions did not affect milk speed or duration of milking visits, but milking time and yield per milking dropped when the length of grazing session was intermediate (Table 1). These initial results suggested that the optimization of single milking AMS stalls in a pasture-based system receiving complementary pTMR supplement, may require strategic planning of stocking rates to efficiently lessen declines in milking frequency and milk yield per cow when the performance of AMS in a grazing-based dairy is compared to a confinement feeding dairy.
Table 1. Effect of the duration of grazing allocations on AMS performance and individual cow productivity.
Influence of grazing patterns on voluntary visitations to the AMS
Multiple factors can affect the grazing behavior of cows and visits to the AMS stall. In addition to some biotic factors such as the quantity and quality of pasture offered and supplemental feed fed in the barn and/or AMS stall, other abiotic factors such as the distance to pasture, weather and terrain condition can also influence the grazing behavior of cows and their visits to the AMS stall. During the fall of 2009, a replicated study was

Page | 36
conducted over a period of 5 weeks to gain mechanistic insights on how weather and distance to pasture directly affects the grazing behavior of cows, and indirectly the frequency of visits to the AMS. Twelve cows in early lactation (82 ± 19 DIM), randomly selected from two groups of 45 cows independently milked in separate AMS stalls (6 cows per group), were equipped with GPS collars (GS-3300, Lotek Wireless Inc., Newmarket, Ontario, Canada) to record daily grazing patterns including, the frequency of pasture visits, the duration of pasture visits and the overall distance walked per day. The 2 groups of cows were strip grazed for 12 h/day (6:00 AM to 6:00 PM) on orchardgrass dominated pastures (with a daily pasture allowance of 15-20 kg DM/cow. Cows had access to TMR in the barn (10-11 kg DM/cow) and received concentrate feed (17 % CP, 3% molasses) in the AMS trough at a rate of 4 kg per 1 kg of milk. Distance to the daily strip ranged from 30 to 395 m. Daily visits to the AMS (successful milkings plus refusals), concentrate intake, and lactation days (DIM) were recorded by the AMS computer software (T4C software, Lely Industries, N.V., Maassluis, Netherlands). Weather including daily precipitation (mm), wind speed (km/h) and mean temperature (ºC), was collected from the KBS Long-Term Ecological Research weather station. The wind-chill factor (indicator of felt air temperature) was calculated from daily records of mean temperature and wind speed. The direct and indirect effect of weather factors, grazing behavior variables, distance to pasture, DIM and supplement intake on AMS visits was analyzed with path analysis (PROC CALIS, SAS). As expected from the AMS milking and feeding settings, visits to the AMS increased with supplement intake and lower DIM (Figure 2). Interestingly, the motivation of cows to visit and spent longer time on pasture decreased during rainy days and increased with warmer conditions (higher wind-chill factor) during this time of the year are relatively cold weather (Temp. range: 1-15 ºC). Perhaps the most remarkable finding from this study is the fact that the frequency and duration of pasture bouts had a higher direct effect on the overall distance walked per day than the distance to pasture (Figure 2). Consequently, the indirect negative effect on AMS visits was lower for the distance to pasture (-0.05) than the duration of pasture bouts (-0.11) or frequency of pasture bouts (-0.15). Walking overall longer distances per day negatively impacted the visiting behavior of cows to the AMS. Results from this study, therefore, suggest that the control of the frequency and duration of pasture visits per day (i.e. number of allocations and intervals between allocations) could be used to manipulate the overall walking distance and the frequency of visits to the AMS. However, additional studies in this topic and with higher degree of control are needed to deliver stronger management recommendations.

Page | 37
Figure 2. Path analysis (n=396) describing the direct and indirect relationship of weather factors, distance to pasture, grazing behavior, lactation days (DIM) and concentrate supplement intake on the visiting behavior of cows to AMS stalls. Single arrows represent the direct effects and double arrows the correlation between variables. P < 0.10, ** P < 0.05, *** P < 0.001.
Influence of social rank and correlated behaviors on the grazing and milk performance of high producing cows
Case studies and reports on from AMS farms indicate that the achievement of a high frequency of voluntary visits to the AMS is a basic prerequisite to ensure a proper utilization of AMS stalls. However, the concept of individual visits introduced by the single milking AMS stall could lead to conflictive situations for some individuals of the herd, especially low ranking or timid cows or first lactation cows with low experience. Differential use of AMS stalls due to differences in feeding motivation between high and low ranking cows could be particularly important in pasture-based dairies where cows generally tradeoff visitations to the AMS with extended feeding times on pasture (Figure 2). A pilot study was conducted to explore the relationship between animal rank, feeding motivations and the use of AMS stalls across contrasting feeding contexts. The hypothesis was that high ranking cows would consistently show higher attitude to feed resources and therefore would consistently experience higher voluntary milking frequency (VMF) at the AMS stall. In a first phase, the net displacement behavior (ND = positive-negative) and the time of arrival of individual cows to a freshly delivered forage-based (60% forage 40% concentrate) TMR (TA) was assessed during 6 days in two groups of dairy cows (n=51) housed (i.e. zero grazing) and milked in separate AMS-free stall pens. In a second phase, GPS collars were used to monitor the grazing behavior of high (Dominant; n = 6) and low (Subordinate; n= 6) ranking animals during 11 week periods of progressive exposure to pasture (2 to 12 h/day) and decreasing amounts of TMR (20 to 10 kg DM/cow). The routing of cows to pasture was controlled via computer-operated gates and the milking and feeding settings for the AMS was as described in previous studies. Body mass (BM), days in milk (DIM), milk yield (MY) and concentrate intake rate (IR) were measured as explanatory variables.
Dominant and subordinate cows differed (P < 0.05) in rate of ND (7 vs. -9 ±2), and TA to fresh TMR (9 vs. 21 ± 4 minutes). Compared to subordinate conspecifics, more dominant cows tended to have shorter DIM (56 vs. 109 ±18d; P = 0.08) and higher IR (7 vs. 5 ±1kg/d; P = 0.09), but similar MY (39 vs. 36 ±4 kg), VMF (3.8 vs. 3.1 ±0.4) and BM (578 vs. 537 ±20 kg).
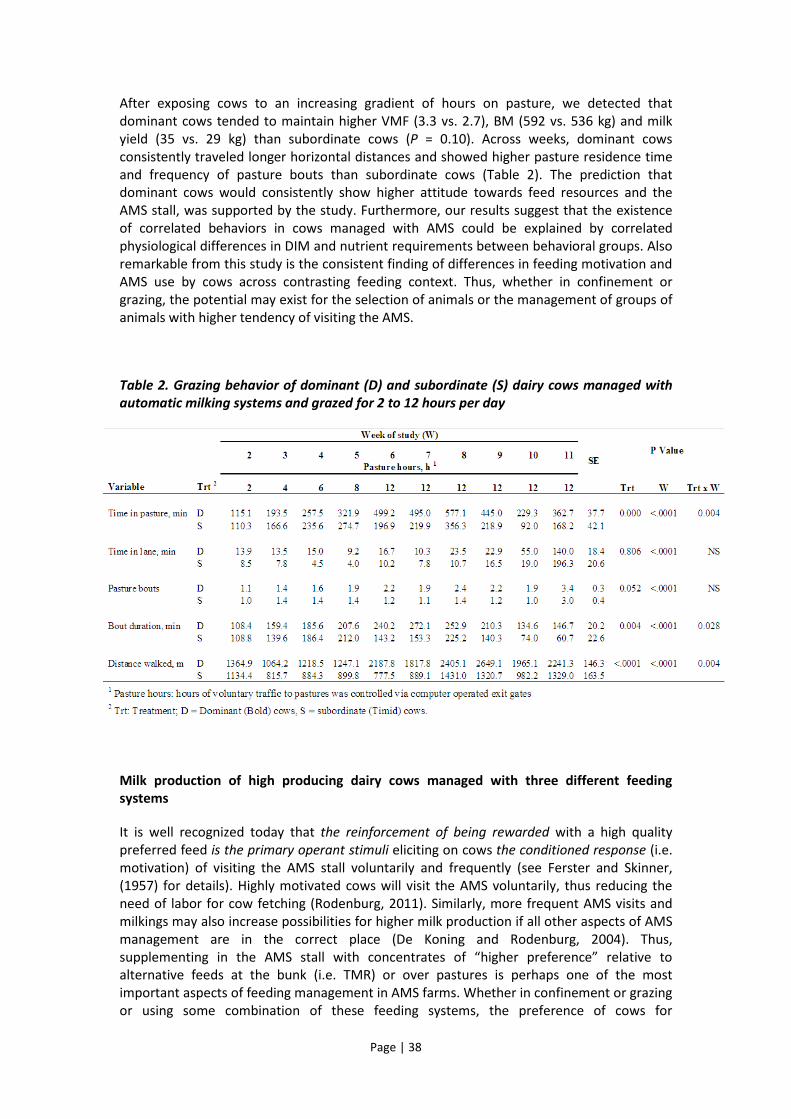
Page | 38
After exposing cows to an increasing gradient of hours on pasture, we detected that dominant cows tended to maintain higher VMF (3.3 vs. 2.7), BM (592 vs. 536 kg) and milk yield (35 vs. 29 kg) than subordinate cows (P = 0.10). Across weeks, dominant cows consistently traveled longer horizontal distances and showed higher pasture residence time and frequency of pasture bouts than subordinate cows (Table 2). The prediction that dominant cows would consistently show higher attitude towards feed resources and the AMS stall, was supported by the study. Furthermore, our results suggest that the existence of correlated behaviors in cows managed with AMS could be explained by correlated physiological differences in DIM and nutrient requirements between behavioral groups. Also remarkable from this study is the consistent finding of differences in feeding motivation and AMS use by cows across contrasting feeding context. Thus, whether in confinement or grazing, the potential may exist for the selection of animals or the management of groups of animals with higher tendency of visiting the AMS.
Table 2. Grazing behavior of dominant (D) and subordinate (S) dairy cows managed with automatic milking systems and grazed for 2 to 12 hours per day
Milk production of high producing dairy cows managed with three different feeding systems
It is well recognized today that the reinforcement of being rewarded with a high quality preferred feed is the primary operant stimuli eliciting on cows the conditioned response (i.e. motivation) of visiting the AMS stall voluntarily and frequently (see Ferster and Skinner, (1957) for details). Highly motivated cows will visit the AMS voluntarily, thus reducing the need of labor for cow fetching (Rodenburg, 2011). Similarly, more frequent AMS visits and milkings may also increase possibilities for higher milk production if all other aspects of AMS management are in the correct place (De Koning and Rodenburg, 2004). Thus, supplementing in the AMS stall with concentrates of “higher preference” relative to alternative feeds at the bunk (i.e. TMR) or over pastures is perhaps one of the most important aspects of feeding management in AMS farms. Whether in confinement or grazing or using some combination of these feeding systems, the preference of cows for

Page | 39
concentrates at the AMS stall may decrease as the feed value of the TMR and/or pasture increases. The interrelationship between the amount and quality of concentrate at the AMS stall and the milking frequency and milk production of cows needs to be properly understood if the goal is the identification of feeding management strategies that are compatible with a realistic production expectation, goals and costs.
A comparative analysis of the performance of high producing Holstein cows (< 400 DIM) housed in a free stall barn consuming TMR or grazed on pasture with a partial TMR (pTMR) or pasture plus concentrate (PC) was conducted.
The analysis included 14035 daily records from individual cows collected from August 4, 2010 to March 7, 2011, including 66, 51 and 96 days of PC, pTMR and TMR, respectively. The average DIM of cows included in the analysis was 180, 165 and 184 during the PC, pTMR and TMR periods, respectively. During PC, pTMR and TMR, cows received a pellet concentrate (17 % CP, 3% molasses) in the AMS stall at a rate of 1 kg per 4 kg of milk.
In the TMR period cows received as a group a forage-based TMR (60% forage, 40% concentrate; 17% CP, 32% NDF) once per day at 5 am (fed to 5% orts, approximately 18.5 kg DM/cow). In the pTMR period cows received as a group the same forage-based TMR at 5 am but the amount of TMR fed varied between 4.6 to 13.7 kg DM/cow based on pasture growth rate and availability. In the PC period cows individually received 1.8 kg of ground corn dispensed in automatic feeding stations (Cosmix feeder, Lely Industries, N.V., Maassluis, Netherlands) located near the exit of the AMS milking stall.
During the PC and pTMR periods cows were rotationally grazed on 1-ha paddocks containing a grass-legume mixture of orchardgrass, tall fescue, alfalfa, red clover and white clover. New fresh paddocks were offered every 1 to 3 days and the walking distance to paddocks ranged from 30 to 395 m. The target pregrazing biomass (orchardgrass with 4-5 extended leaves) and postgrazing residual was 2400±200 and 1600±200, respectively.
Results from the comparative analysis of cow performance between PC, pTMR and TMR feeding systems are shown in figure 3. As expected, milk yield, milkings and body weight (BW) was higher for TMR, intermediate for pTMR and lower for PC (P < 0.001).
Interestingly, the analysis of the acceleration activity registered by the cow’s collar indicated a 43% and 68% increase of activity for PC compared to pTMR and TMR, respectively (P < 0.001). This increase in walking and grazing activity for PC is consistent with our previous finding of a reduced milking frequency when cows are exposed to extended feeding periods on pasture.
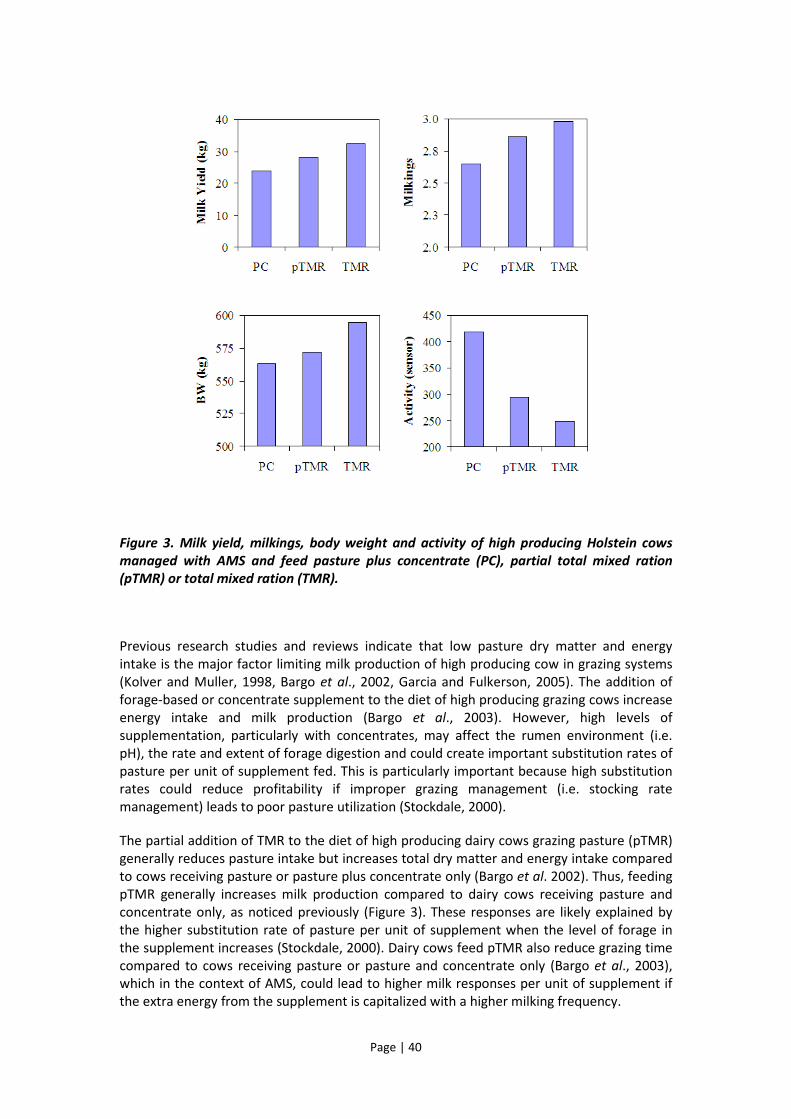
Page | 40
Figure 3. Milk yield, milkings, body weight and activity of high producing Holstein cows managed with AMS and feed pasture plus concentrate (PC), partial total mixed ration (pTMR) or total mixed ration (TMR).
Previous research studies and reviews indicate that low pasture dry matter and energy intake is the major factor limiting milk production of high producing cow in grazing systems (Kolver and Muller, 1998, Bargo et al., 2002, Garcia and Fulkerson, 2005). The addition of forage-based or concentrate supplement to the diet of high producing grazing cows increase energy intake and milk production (Bargo et al., 2003). However, high levels of supplementation, particularly with concentrates, may affect the rumen environment (i.e. pH), the rate and extent of forage digestion and could create important substitution rates of pasture per unit of supplement fed. This is particularly important because high substitution rates could reduce profitability if improper grazing management (i.e. stocking rate management) leads to poor pasture utilization (Stockdale, 2000).
The partial addition of TMR to the diet of high producing dairy cows grazing pasture (pTMR) generally reduces pasture intake but increases total dry matter and energy intake compared to cows receiving pasture or pasture plus concentrate only (Bargo et al. 2002). Thus, feeding pTMR generally increases milk production compared to dairy cows receiving pasture and concentrate only, as noticed previously (Figure 3). These responses are likely explained by the higher substitution rate of pasture per unit of supplement when the level of forage in the supplement increases (Stockdale, 2000). Dairy cows feed pTMR also reduce grazing time compared to cows receiving pasture or pasture and concentrate only (Bargo et al., 2003), which in the context of AMS, could lead to higher milk responses per unit of supplement if the extra energy from the supplement is capitalized with a higher milking frequency.

Page | 41
Figure 4. Path analysis of the direct and indirect effects of the days in milk (DIM) and voluntary visits, milkings and supplement intake in a AMS stall on the daily milk yield of high producing Holstein cows fed a) pasture and concentrate, b) partial total mixed ration or c) total mixed ration as base diet. Single arrows represent the direct effects of variables and double arrows the correlation between variables. * P < 0.10, ** P < 0.05, *** P < 0.001.
The path analysis (PROC CALIS, SAS) of the milk yield of cows reveled additional findings on the comparison between the three feeding systems (Figure 4). As expected by the use of a variable supplement feeding rate based on milk production, supplement intake by cows decreased as DIM increased in the 3 feeding systems. Visits to the AMS also decreased with DIM in the three systems. However, the value of the supplement to entice AMS visitations was significantly more important for PC and pTMR than TMR. This differential response may have occurred because the relative value of the supplement for cows is more important in PC and pTMR systems where the energy and/or feed intake is more limiting (Bargo et al., 2003). The amount of supplement eaten and AMS visits always had a moderate positive effect on milkings in the three feeding systems. There was also an important positive effect of milkings on milk yield but the effect declined from TMR to pTMR and PC. This last finding is remarkable because as discussed previously it may suggest that increases in milking frequency will not produce important positive effects on milk yield if energy and/or feed intake is limited. Conversely, the positive effect of supplement intake on milk yield decreased from PC to pTMR and TMR, supporting earlier studies indicating that the low energy and/or feed intake is the major limiting factor of milk production of high producing dairy cows in grazing systems. Therefore, findings from this section indicate that the strategic supplementation with concentrates in the AMS stall could be used to increase milk

Page | 42
production from: 1) increased feed and/or energy intake in systems were energy intake is limiting (PC), 2) from increased milking frequency in feeding systems were energy or feed intake is not limiting (TMR), or 3) from a combination of these to strategies in feeding systems were both energy intake and milking frequency could be somewhat limiting (pTMR). In all cases, strategic management of supplementation and milking frequency in AMS needs to be compatible with the level of energy and feed intake of cows.
References
Bargo, F., L. D. Muller, E. S. Kolver, and J. E. Delahoy. 2003. Invited review: Production and digestion of supplemented dairy cows on pasture. J. Dairy Sci. 86:1-42.
Bargo, F., L. D. Muller, J. E. Delahoy, and T. W. Cassidy. 2002. Performance of high producing dairy cows with three different feeding systems combining pasture and total mixed rations. J. Dairy Sci. 85:2948-2963.
De Koning, C.J.A.M. 2010. Automatic milking - common practice on dairy farms. Proceedings of the first North American conference on precision dairy management. March 2-5, Totonto, Ontario, pp 52-67.
De Koning, C.J.A.M., and J. Rodenburg. 2004. Automatic milking: State of the art in Europe and North America. In: A. Meijering, H. Hogeveen and C.J.A.M. De Koning (Eds). Proceedings of the international symposium on automatic milking, a better understanding, Wageningen Academic Publishers, Wageningen, The Netherlands, pp 311-320.
Dooren, H.J.C. van. 2004. Results of partner 1. In: Automatic milkings and grazing. Final report. Deliverable D27 within the EU-project: Implications of the introduction of automatic milking on dairy farms (QLK5-2000-31006)
Ferster, C. B., and B.F. Skinner. 1957. Schedules of reinforcement. Appleton-Century-Crofts Inc., NY.
Garcia, S. C., and W. J. Fulkerson. 2005. Opportunities for future Australian dairy systems: a review. Aust J Exp Agr., 45: 1041-1055.
Greenall, R., M. Warren and E. Warren. 2004. Integrating AMIs into grazing systems – lessons from Australia. In: A. Meijering, H. Hogeveen and C.J.A.M. De Koning (Eds). Proceedings of the international symposium on automatic milking, a better understanding, Wageningen Academic Publishers, Wageningen, The Netherlands, pp. 3.1-5.
Jago, J.G., P. Copeman, K. Bright, D. McLean, I. Ohnstad, and I. Woolford. 2002. An innovative farm system combining automatic milking and grazing. Proceedings of the New Zealand Society of Animal Production, 62:115-119.
Ketelaar-de Lauwere C.C., A.H. Ipema, C. Lokhorst, J.H.M. Metz, J.P.T.M. Noordhuizen, W.G.P. Schouten, and A.C. Smits. 2000. Effect of sward height and distance between pasture and barn on cows visits to an automatic milking system and other behaviour. Livestock Production Science, 65: 131-143.
Ketelaar-de Lauwere C.C., A.H. Ipema, E.N.J. van Ouwerkerk, M.M.W.B. Hendriks, J.H.M. Metz, J.P.T.M. Noordhuizen & W.G.P. Schouten. 1999. Voluntary automatic milking in combination with grazing of dairy cows. Milking frequency and effects on behaviour. Applied Animal Behaviour Science 64:2, 91-109.
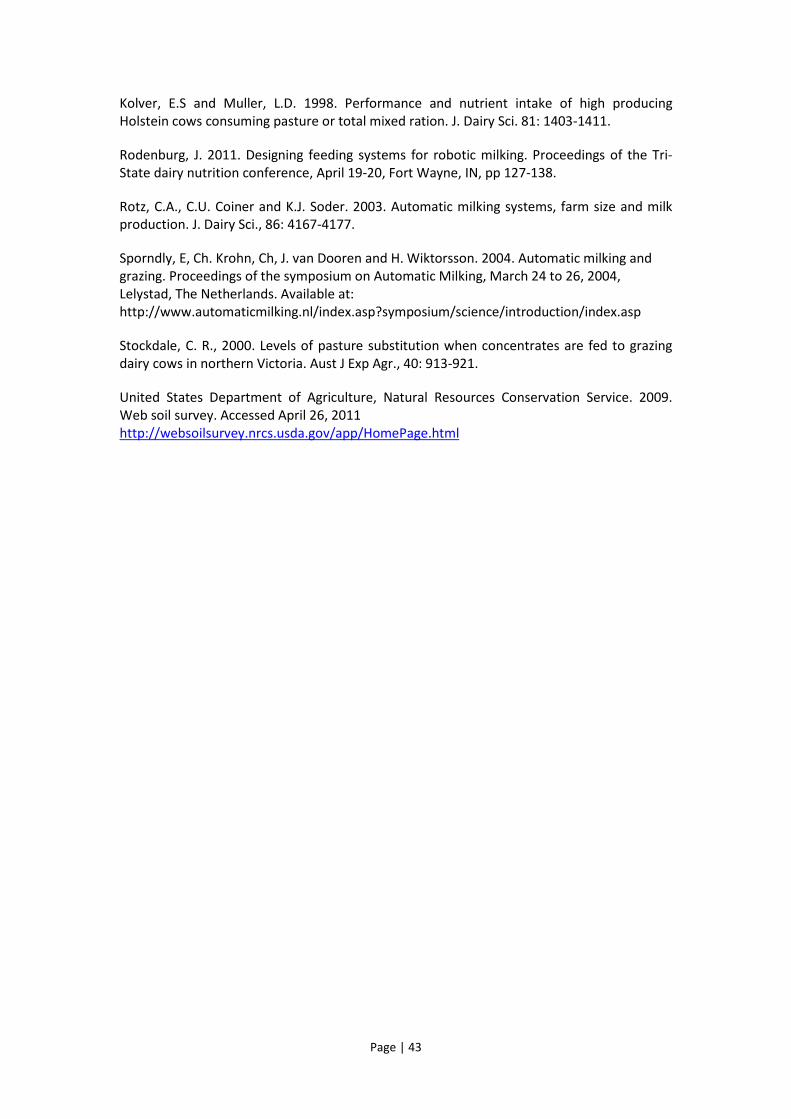
Page | 43
Kolver, E.S and Muller, L.D. 1998. Performance and nutrient intake of high producing Holstein cows consuming pasture or total mixed ration. J. Dairy Sci. 81: 1403-1411.
Rodenburg, J. 2011. Designing feeding systems for robotic milking. Proceedings of the Tri-State dairy nutrition conference, April 19-20, Fort Wayne, IN, pp 127-138.
Rotz, C.A., C.U. Coiner and K.J. Soder. 2003. Automatic milking systems, farm size and milk production. J. Dairy Sci., 86: 4167-4177.
Sporndly, E, Ch. Krohn, Ch, J. van Dooren and H. Wiktorsson. 2004. Automatic milking and grazing. Proceedings of the symposium on Automatic Milking, March 24 to 26, 2004, Lelystad, The Netherlands. Available at: http://www.automaticmilking.nl/index.asp?symposium/science/introduction/index.asp
Stockdale, C. R., 2000. Levels of pasture substitution when concentrates are fed to grazing dairy cows in northern Victoria. Aust J Exp Agr., 40: 913-921.
United States Department of Agriculture, Natural Resources Conservation Service. 2009. Web soil survey. Accessed April 26, 2011 http://websoilsurvey.nrcs.usda.gov/app/HomePage.html

Page | 44
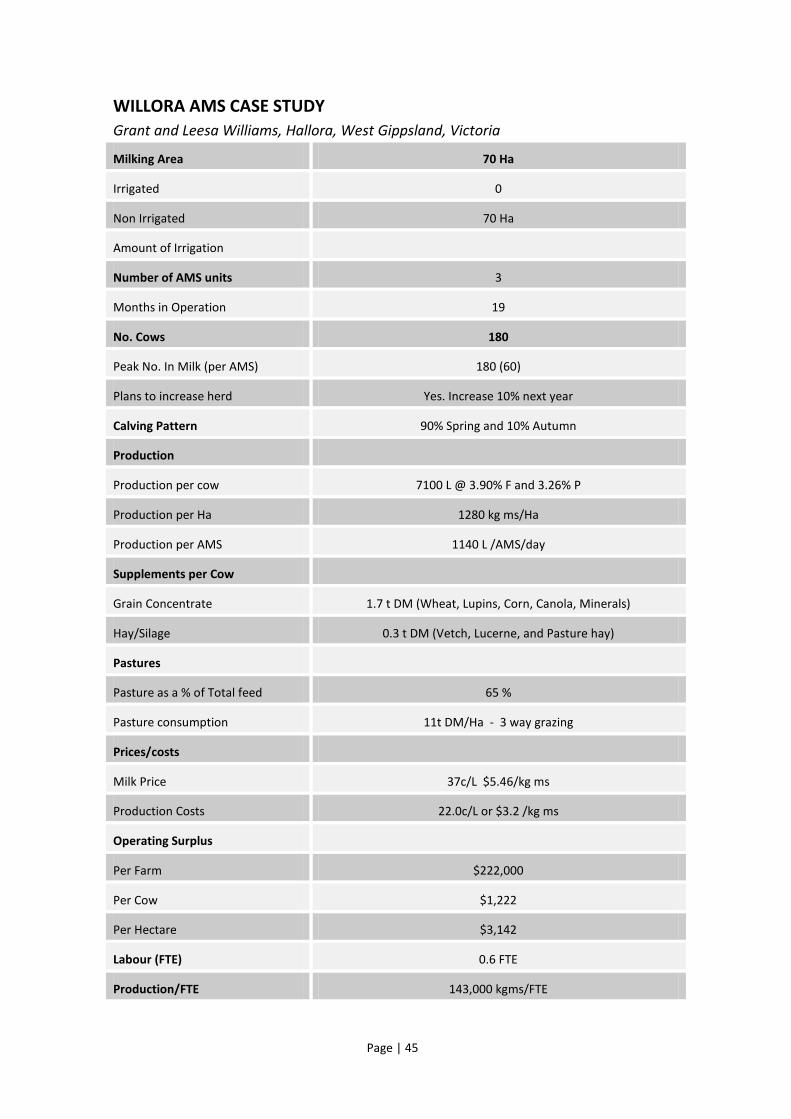
Page | 45
WILLORA AMS CASE STUDY Grant and Leesa Williams, Hallora, West Gippsland, Victoria
Milking Area 70 Ha
Irrigated 0
Non Irrigated 70 Ha
Amount of Irrigation
Number of AMS units 3
Months in Operation 19
No. Cows 180
Peak No. In Milk (per AMS) 180 (60)
Plans to increase herd Yes. Increase 10% next year
Calving Pattern 90% Spring and 10% Autumn
Production
Production per cow 7100 L @ 3.90% F and 3.26% P
Production per Ha 1280 kg ms/Ha
Production per AMS 1140 L /AMS/day
Supplements per Cow
Grain Concentrate 1.7 t DM (Wheat, Lupins, Corn, Canola, Minerals)
Hay/Silage 0.3 t DM (Vetch, Lucerne, and Pasture hay)
Pastures
Pasture as a % of Total feed 65 %
Pasture consumption 11t DM/Ha - 3 way grazing
Prices/costs
Milk Price 37c/L $5.46/kg ms
Production Costs 22.0c/L or $3.2 /kg ms
Operating Surplus
Per Farm $222,000
Per Cow $1,222
Per Hectare $3,142
Labour (FTE) 0.6 FTE
Production/FTE 143,000 kgms/FTE

Page | 46
MANUKA HEIGHTS AMS CASE STUDY Simon Scowen, Kongorong, Mount Gambier S.E. SA
Milking Area 128 Ha
Irrigated 68 Ha with 2 centre pivots
Non Irrigated 60 Ha (production is about 40% of an irrigated hectare)
Amount of Irrigation 76 Ha IE (Area metric irrigation licence for 76 Ha of irrigation equivalent)
Number of AMS units 5
Months in Operation 18
No. Cows 307
Peak No. In Milk (per AMS) 296 (59)
Plans to increase herd No
Calving Pattern 30% Spring, 20% Summer, 30% Autumn and 20% Winter
Production
Production per cow 8911 L @ 3.92% F and 3.28% P (642kgs MS)
Production per Ha 2138 kgMS/Ha
Production per AMS 1503 L /AMS/day
Supplements per Cow
Grain Concentrate 2.7t DM (Wheat, Lupins, Corn, Canola, Minerals)
Hay/Silage 0.7t DM (Vetch, Lucerne, and Pasture hay)
Pastures
Pasture as a % of Total feed 50 %
Pasture consumption 11.5t DM/Ha
Prices/costs
Milk Price 41.7c/L $5.78/kg ms
Production Costs 29.5c/L or $4.10 /kg ms
Operating Surplus
Per Farm $332,815
Per Cow $1,084
Per Hectare $3,617
Assets Land = $1,800,000 and Dairy = $1,600,000
Operating Return on Asset 9.8%
Labour (FTE) 1.125 FTE
Production/FTE 2,431,733 lts or 175,194 kgMS
Page | 47
MATANDAL PASTORAL -AMS CASE STUDY Matthew & Allison Cahill, Hillview, south-east Queensland
Farm size 350 ha
Milking Area 80 ha
Remaining area 100 ha open grassland used for dry stock
170 ha steep forest country with limited productivity
Irrigated 80 ha
Non Irrigated (milking area) 0 ha
Amount of Irrigation 2 creek licences not metred but restricted in low flows
3 small bores unrestricted and pumped to turkeys nest
27 ha pivot and remainder irrigated by 3 travellers
Number of AMS units 3
Months in Operation 12
No. Cows 300
Peak No. In Milk (per AMS) 230 (77)
Plans to increase herd Yes, 300 cows in 5 robots.
Calving Pattern All year round
Production
Production per cow 7500 lts @ 3.75% F and 3.4% P
520 kg MS / cow
Production per Ha 1950 kg MS/ha
Production per AMS 1500 lts/AMS/day
Supplements per Cow
Grain Concentrate 5 kg / cow / day corn wheat pellet with minerals
TMR 23 kg / cow / day
0.5 kg / cow / day
14 kg / cow / day
1.7 kg / cow / day
2 kg / cow / day
Pastures
Pasture as a % of Total feed 0 %
Price /costs
Milk Price 55 c / lt
Feed costs 27 c / lt
Labour (FTE) 2.5 FTE
Production/FTE 62400 kgms/fte
Page | 48
DAIRY FARM PERFORMANCE AND PROFIT: SOME LESSONS FROM THE TASMILK60 STUDY STEVE LITTLE Grains2Milk program leader for Dairy Australia
This paper puts forward a series of eight statements on some important aspects of dairy farm performance and profit, asking the reader to consider whether each statement is True or False. A response to each statement is then provided, with supporting evidence from the TasMilk60 study recently undertaken by Dairy Australia’s Grains2Milk program.
About the TasMilk60 study
This observational study was done to better understand the interaction between grain/concentrate input, risk, management skills and profit in pasture-based dairying systems. It involved collection and analysis of a comprehensive dataset of farm physical and financial performance over three years (2006/07, 2007/08, and 2008/09) across a spectrum of farms using different grain/concentrate feeding rates in the same climatic and market context.
We chose to do the study in Tasmania for two main reasons. Firstly, it has been less impacted on by drought than mainland dairying regions in recent years. Secondly, Tasmania enabled Grains2Milk to collect physical and financial performance data across a wide range of feeding approaches, extending to more extreme ends of the performance spectrum than would be available in any other dairying region of Australia.
The study enrolled:
• 20 farms that were low grain feeders (<1 t / cow / year)
• 20 farms that were moderate grain feeders (1 to <2 t / cow / year)
• 20 farms that were high grain feeders (>=2 t / cow / year)
This was to maximize precision when analysing data within each of these three concentrate feeding categories. (The study did not aim to enrol farms in proportion to the distributions of Tasmanian or Australian farms by concentrate feeding category).
Data were collected from managers of selected farms by either Agrilink FarmStats P/L (AGFS) or Tasmanian Institute of Agricultural Research (TIAR), and from relevant milk supply companies, accountants, and stockfeed and fertilizer suppliers with the manager’s permission. Data collection was managed by Agrilink FarmStats P/L (AGFS). All statistical analyses were performed by epidemiologist Dr. John Morton (Jemora P/L).
The three years of the TasMilk60 study - 2006/07, 2007/08, and 2008/09 - were one of the most volatile periods in terms of trade seen for many, many years, and in times of less favourable climatic conditions.

Page | 49
As such, the findings of how well farmers using different feeding approaches responded and reacted to the challenges thrown at them, particularly over the full 3 year timeframe rather than just a single year, provide a telling testament to what worked and what didn’t, and provide lessons relevant for dairy farmers and advisers managing pasture-based production systems across Australia.
Statement 1:
“Farms that feed high levels of concentrates per cow per year achieve poorer pasture utilisation (tonnes pasture removed / hectare / year).”
True or False?
Answer: False
Despite fears of substitution, there is no simple relationship between amount of concentrates fed per cow and pasture utilised per hectare. Both good and poor pasture utilisation is seen at all levels of concentrate feeding.
Supporting evidence from TasMilk60:
Figure 1: Distribution of pasture utilised per hectare from the milking area by concentrate feeding category and year

Page | 50
Statement 2:
“Feed conversion efficiency (FCE) is generally better in farms where higher amounts of concentrates per cow are fed.”
True or False?
Answer: True
FCE is generally higher in farms where higher amounts of concentrates were fed. This is largely due to the higher total intakes in high concentrate-feeding farms, and hence, the greater proportion of nutrients that are used for milk production versus maintenance.
However, FCE is highly variable at all concentrate feeding levels.
Total feed intake per cow explains much of the variability in feed conversion efficiency. However, there are also several other important factors.
Supporting evidence fromTasMilk60:
Figure 2: Distribution of feed conversion efficiency (FCE) by concentrate feeding category and year for farms with predominantly Holstein-Friesian cows (Annual milker FCE was calculated using the DPIV Pasture Consumption & Feed Conversion Efficiency Calculator as litres of energy-corrected milk per cow divided by total kgs annual feed dry matter intake)

Page | 51
Figure 3: Association between total feed intake per cow and feed conversion efficiency
In addition to optimizing total daily feed intake, other things which will help optimize FCE are to:
• Maintain high feed quality
• Maintain good rumen function
• Minimise feed gaps throughout the year
• Minimise feed wastage
• Minimise energy losses
Statement 3:
“At a given total feed intake per cow, feed conversion efficiency is a powerful lever for increasing farm profit.”
True or False?
Answer: True
FCE offers significant potential to increase farm profit through reducing feed costs for the same milk yield. This is particularly so in higher milk price years, when every 0.1 increase in litres milk / kg feed Dry Matter may be worth up to $300 extra milk profit per cow per year.
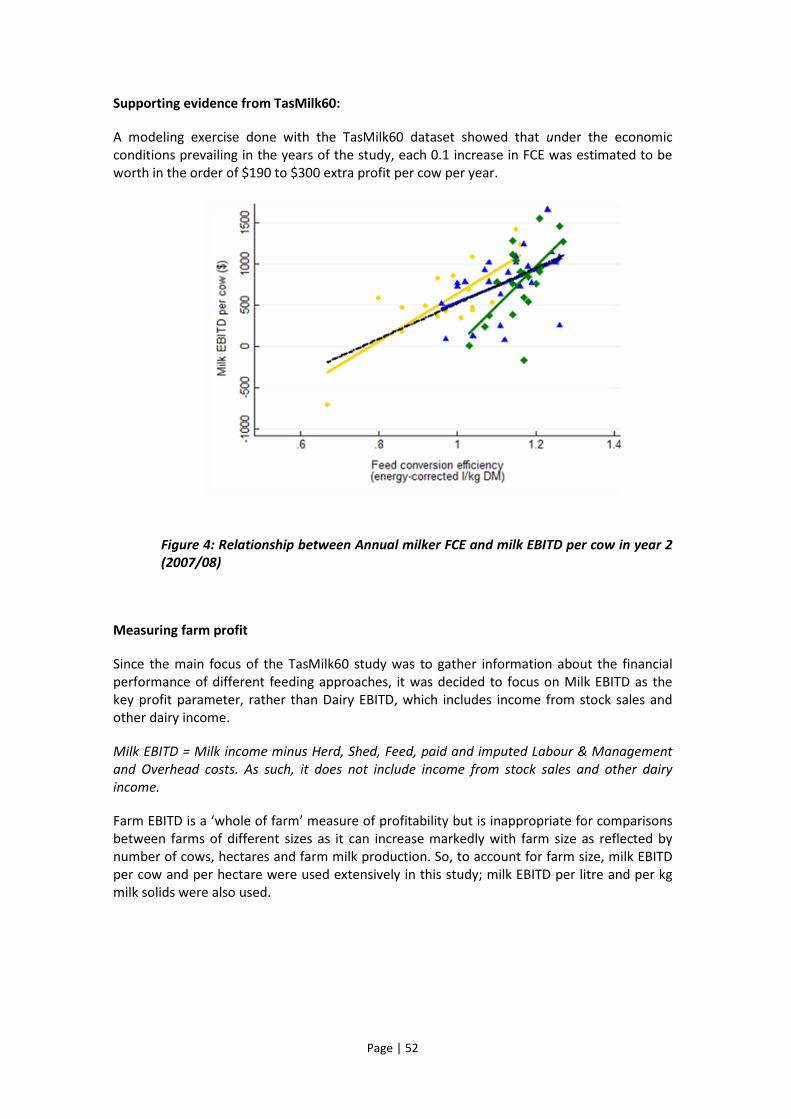
Page | 52
Supporting evidence from TasMilk60:
A modeling exercise done with the TasMilk60 dataset showed that under the economic conditions prevailing in the years of the study, each 0.1 increase in FCE was estimated to be worth in the order of $190 to $300 extra profit per cow per year.
Figure 4: Relationship between Annual milker FCE and milk EBITD per cow in year 2 (2007/08)
Measuring farm profit
Since the main focus of the TasMilk60 study was to gather information about the financial performance of different feeding approaches, it was decided to focus on Milk EBITD as the key profit parameter, rather than Dairy EBITD, which includes income from stock sales and other dairy income.
Milk EBITD = Milk income minus Herd, Shed, Feed, paid and imputed Labour & Management and Overhead costs. As such, it does not include income from stock sales and other dairy income.
Farm EBITD is a ‘whole of farm’ measure of profitability but is inappropriate for comparisons between farms of different sizes as it can increase markedly with farm size as reflected by number of cows, hectares and farm milk production. So, to account for farm size, milk EBITD per cow and per hectare were used extensively in this study; milk EBITD per litre and per kg milk solids were also used.

Page | 53
Statement 4:
“With feed being the greatest operating input cost on any dairy farm, low feed costs per cow are essential to achieve consistently high farm profitability.”
True or False?
Answer: False
Dairy farms are complex systems, and there are many ways to make a profit (or a loss). Determinants of profit should be assessed collectively, not separately, when analysing farm performance. Revenue from milk sales is as important a component of profit as are costs - higher feed costs may be justified if they generate extra profit by lifting milk revenue.
Supporting evidence from TasMilk60:
Direct and indirect determinants of profitability were modelled using path analysis. Some of the results of these analyses are in the table below. These show the values for selected profit determinants of milk EBITD per cow for the 5 most profitable farm years where 1 to < 2 t of concentrates were fed per cow.
Within each of the three concentrate feeding categories, for all profit determinants other than milk price, some of the 5 highest profitability farm-years had values worse than median and/or some of the 5 lowest profitability farm-years had values better than median.
Farms that had consistently higher profits usually had a relatively higher milk price, higher milk yield per cow, lower fodder costs and lower labour and management costs. However, they tended not to be outstanding performers for each particular determinants of profit - they tended to be consistent “all-rounders” whose efforts for these profit determinants collectively were superior.
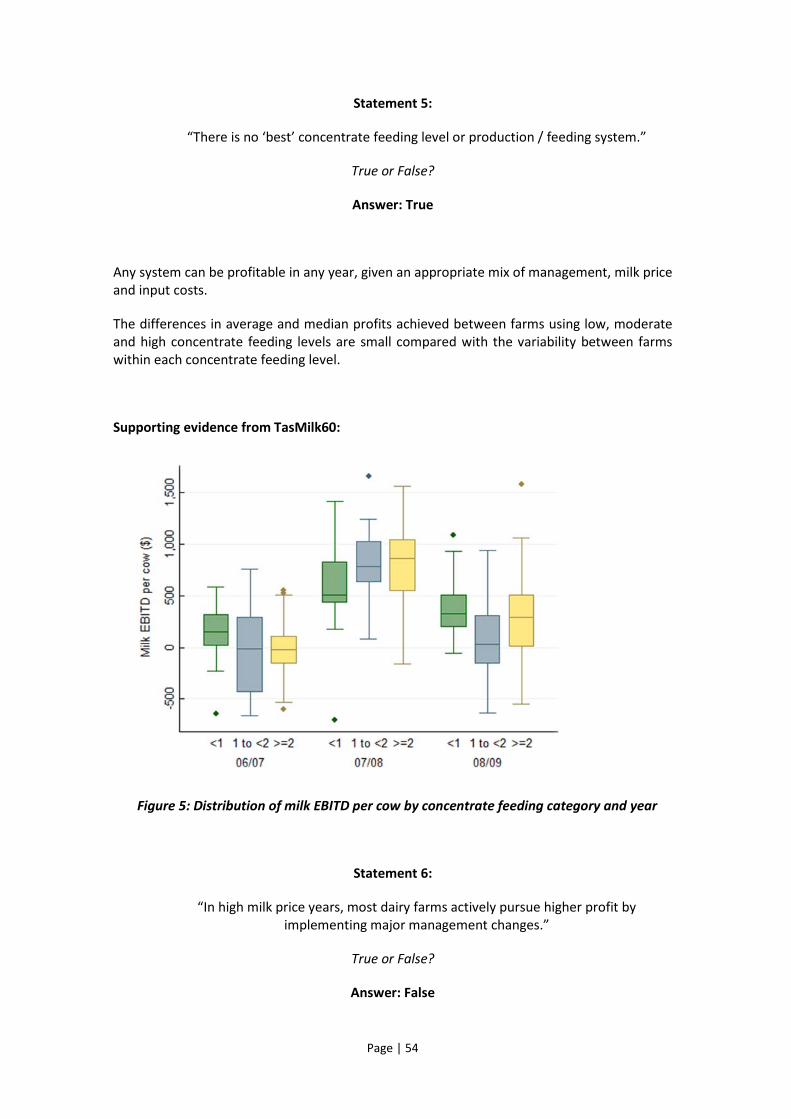
Page | 54
Statement 5:
“There is no ‘best’ concentrate feeding level or production / feeding system.”
True or False?
Answer: True
Any system can be profitable in any year, given an appropriate mix of management, milk price and input costs.
The differences in average and median profits achieved between farms using low, moderate and high concentrate feeding levels are small compared with the variability between farms within each concentrate feeding level.
Supporting evidence from TasMilk60:
Figure 5: Distribution of milk EBITD per cow by concentrate feeding category and year
Statement 6:
“In high milk price years, most dairy farms actively pursue higher profit by implementing major management changes.”
True or False?
Answer: False
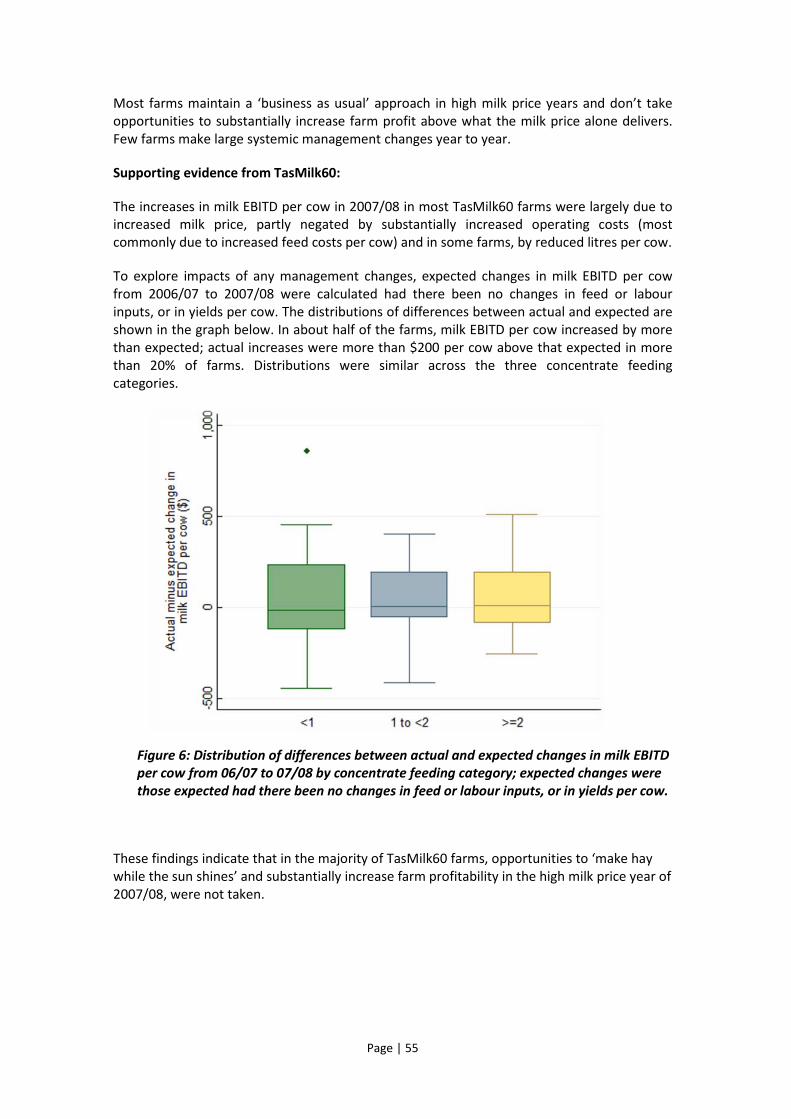
Page | 55
Most farms maintain a ‘business as usual’ approach in high milk price years and don’t take opportunities to substantially increase farm profit above what the milk price alone delivers. Few farms make large systemic management changes year to year.
Supporting evidence from TasMilk60:
The increases in milk EBITD per cow in 2007/08 in most TasMilk60 farms were largely due to increased milk price, partly negated by substantially increased operating costs (most commonly due to increased feed costs per cow) and in some farms, by reduced litres per cow.
To explore impacts of any management changes, expected changes in milk EBITD per cow from 2006/07 to 2007/08 were calculated had there been no changes in feed or labour inputs, or in yields per cow. The distributions of differences between actual and expected are shown in the graph below. In about half of the farms, milk EBITD per cow increased by more than expected; actual increases were more than $200 per cow above that expected in more than 20% of farms. Distributions were similar across the three concentrate feeding categories.
Figure 6: Distribution of differences between actual and expected changes in milk EBITD per cow from 06/07 to 07/08 by concentrate feeding category; expected changes were those expected had there been no changes in feed or labour inputs, or in yields per cow.
These findings indicate that in the majority of TasMilk60 farms, opportunities to ‘make hay while the sun shines’ and substantially increase farm profitability in the high milk price year of 2007/08, were not taken.

Page | 56
Statement 7:
“The most profitable farms are consistently profitable year after year.”
True or False?
Answer: False
Relative farm profitability is not very repeatable from year to year, so results in a single year may not reflect profit performance over the longer term. To effectively monitor farm financial performance, profitability should be assessed each year, especially when milk price is fluctuating markedly between years.
Supporting evidence from TasMilk60:
Consistency of farm profitability year to year was assessed by two means:
• Looking at each farm’s absolute profitability across the three years
• Using deviation from within-year medians and tertile within year
Both absolute and relative farm profitability were markedly inconsistent between years, as illustrated in the ‘fiddle-stick’ chart below.
Statement 8:
“Farmers with a wide range of management styles and sets of attitudes and beliefs run successful farm businesses.”
True or False?
Answer: True
Farmers don’t require a certain management style or set of attitudes and beliefs to be highly profitable.
Supporting evidence from TasMilk60:
60 decision makers from 39 TasMilk60 farms completed a survey and were segmented into 6 distinct groups based on their attitudes and beliefs using the Derived Attitudinal Farmer Segmentation (DAFS) method. Neither DAFS group nor attitudinal indices varied markedly by concentrate feeding category, indicating that high profitability occurred on farms with primary decision-makers with diverse attitudes and farming styles.
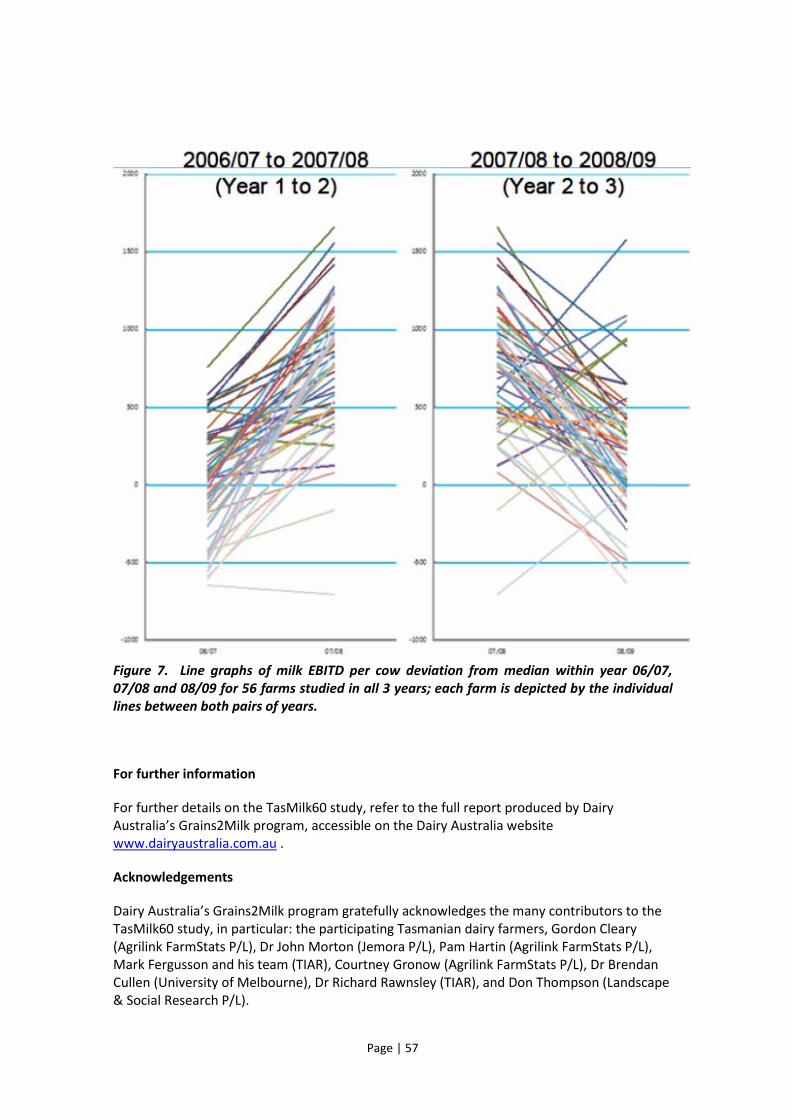
Page | 57
Figure 7. Line graphs of milk EBITD per cow deviation from median within year 06/07, 07/08 and 08/09 for 56 farms studied in all 3 years; each farm is depicted by the individual lines between both pairs of years.
For further information
For further details on the TasMilk60 study, refer to the full report produced by Dairy Australia’s Grains2Milk program, accessible on the Dairy Australia website www.dairyaustralia.com.au .
Acknowledgements
Dairy Australia’s Grains2Milk program gratefully acknowledges the many contributors to the TasMilk60 study, in particular: the participating Tasmanian dairy farmers, Gordon Cleary (Agrilink FarmStats P/L), Dr John Morton (Jemora P/L), Pam Hartin (Agrilink FarmStats P/L), Mark Fergusson and his team (TIAR), Courtney Gronow (Agrilink FarmStats P/L), Dr Brendan Cullen (University of Melbourne), Dr Richard Rawnsley (TIAR), and Don Thompson (Landscape & Social Research P/L).

Page | 58
NEW WAYS OF SELECTING FOR IMPROVED FEED CONVERSION EFFICIENCY USING GENOMIC TECHNOLOGIES
JENNIE PRYCE
J. Pryce1,2, Y. Williams3 and B. Hayes1,2
1Biosciences Research Division, Department of Primary Industries Victoria, 1 Park Drive, Bundoora 3083, Australia
2Dairy Futures Cooperative Research Centre, 1 Park Drive, Bundoora Victoria, 3083, Australia
3Department of Primary Industries, 255 Ferguson Rd, Tatura, Victoria
Introduction
The Australian Profit Ranking (APR), aims to improve the profitability of dairy farming through selection of bulls and heifers. The APR weights milk, fat and protein yield, daughter survival, daughter fertility, somatic cell count, liveweight, temperament and likeability according to their contribution to profit and correlations among the traits. Given that the cost of feed in a dairy production system accounts for between 43-67% of total farming expenses (Ho et al., 2005), a key component of this index is efficiency. APR does capture some variation in gross efficiency, as the index includes body weight with an economic weight based on the energetic requirements for maintenance and production. However gross efficiency calculated in this way does not allow comparisons of cattle at different levels of production, and makes no attempt to distinguish between energy used for production, maintenance, lactation and body tissue metabolism, which may have quite different efficiencies. A measure of feed efficiency which is independent of an animal’s body size, production level and captures variation in maintenance efficiency is residual feed intake (RFI). Here, RFI is defined as the difference between an animal’s actual feed intake and its expected feed intake based on its production, size and growth.
To be able to genetically improve RFI, we need accurate estimates of genetic parameters and this requires very large numbers of animals (>2000). Unfortunately testing so many cows is likely to be both very expensive and logistically difficult. A possible alternative approach is to measure a large number of growing heifers for RFI, select the extremes and then confirm the ranking of these extreme animals for RFI in a lactating cow test.
Genomic Selection
Genomic selection means selection decisions that are based on breeding values derived from genetic marker data. RFI is an excellent target trait for this new technology because it is expensive to measure. If a panel of genetic markers can be found for this trait, these could be assayed for a much lower cost than measuring the trait itself, facilitating industry wide selection for RFI. Although the idea of using DNA markers to improve the rate of genetic gain in dairy cattle has been around for decades, adoption of marker-assisted selection by the dairy industry has been limited (with a few notable exceptions). The widespread use of

Page | 59
genomic selection occurred following two developments. The first was the recent sequencing of the bovine genome, which led to the discovery of many thousands of DNA markers, in the form of single nucleotide polymorphisms (SNP). Concurrent with the discovery of numerous SNP markers throughout the livestock genomes has been a dramatic reduction in the cost of genotyping. The latest commercially available “SNP Chip” used in this project, genotypes an individual for >625,000 SNP markers. The second development was the demonstration that it was possible to make very accurate selection decisions when breeding values were predicted from dense marker data alone.
Genomic selection involves assembling a reference population of individuals with phenotypic measurements for the target trait (in this case RFI), genotyping these individuals for a panel of genome wide single nucleotide polymorphisms (SNPs), then using this information to derive a prediction equation of the effects of the markers on the trait. The prediction equation can then be used to predict breeding values for RFI in any genotyped animal which is a candidate for selection (Meuwissen et al. 2001).
With a collaborative effort between research organisations in Australia and New Zealand, resources were available to take measurements required to calculate RFI on 1,782 calves, around half from each country. For the Australian component 903 calves were screened in three cohorts over 1.5 years
Accuracy of predicting RFI
The heritability of RFI in this trial was estimated to be 0.26 (Williams et al., 2011). Therefore, substantial genetic variation in RFI does exist and that selection to improve this trait may be feasible in Holstein dairy heifers.
Using around 625,000 SNPs per heifer and a dataset of 1,782 growing dairy heifers (from Australia and New Zealand) we have demonstrated that it is possible to predict RFI with an accuracy of 0.41 in Australian heifers (Table 1). This is encouraging and means that genomic selection for RFI is feasible.
Table 1. Accuracy of genomic predictions in 3 Australian cohorts of Holstein heifers
Trial Accuracy
Trial 1 0.40
Trial 2 0.42
Trial 3 0.40
Average 0.41 +/- 0.01
Ideally, RFI will one day be included in a selection index such as the Australian Profit Ranking (APR). However, before we can do this we need to know the genetic correlations between RFI and other traits of importance. A preliminary investigation of genetic relationships of RFI with key traits was performed by regressing RFI and on sire breeding values of milk, fat and protein yields and fertility (Hayes et al., 2011), using an analysis method called genetic regression. None of the genetic regressions were significant which is encouraging, as it may mean that selecting for RFI will not lead to detrimental consequences for other traits. In a

Page | 60
preliminary analysis of the impact of including RFI as an additional trait in the APR index, Hayes et al. (2011) found that if the accuracy of genomic breeding values was 0.41 the rate of annual gain for profitability could increase by 3.8%. Further research using records collected on lactating heifers that were calves in this trial may help us understand whether this really is the case. The next phase of this trial is to establish whether RFI is the same trait in lactating cows (as growing heifers). This will be achieved by evaluating RFI of the 60 highest (in Australia) and the equivalent number of lowest performing heifers in a lactation trial. We will also closely examine the genetic relationship of RFI with other traits of importance, especially health and fertility traits.
Acknowledgements
We would like to thank the Gardiner Foundation, Department of Primary Industries (Victoria), FRST, DairyNZ, LIC and Trade and Enterprise (NZ) for funding this trial. Colleagues involved in this trial in both Australia and New Zealand are acknowledged.
References
Hayes, B.J. J.H.J. van der Werf and J.E. Pryce 2011. Economic benefit of genomic selection for residual feed intake (as a measure of feed conversion efficiency) in Australian dairy cattle (submitted)
Ho, C., R. Nessler, P. Doyle, and B. Malcolm. 2005. Future dairy farming systems in irrigation regions. Aust. Farm Bus. Man. J. 2:65-74.
Meuwissen, T. H. E., B.J. Hayes and M.E. Goddard 2001. Prediction of total genetic value using genome-wide dense marker maps. Genetics 157:1819–1829.
Williams Y.J., J.E. Pryce, C. Grainger, W.J. Wales, N. Linden, M. Porker, B.J. Hayes 2011. Variation in residual feed intake in Holstein Friesian dairy heifers in southern Australia. J. Dairy Sci.

Page | 61
IT’S ALL IN THE TIMING CARL HOCKEY
RuralVet Supplies and Services M: 0433 345 741 E: [email protected] W: ruralvet.com.au
Getting cows pregnant can be hard work and requires many things to go right for success. Despite the never ending list of factors that can affect the chance of an insemination resulting in a pregnancy, at the very core of utilising AI to get cows pregnant is the need to decide which cows to inseminate and when to inseminate them.
Without this, no cow can get pregnant to AI. Since in order to get a cow pregnant, a viable sperm must meet with a viable egg, the ultimate goal of AI should be to closely co-ordinate the time of insemination with a pending ovulation. Thus to achieve a pregnancy through AI one requires knowledge of which cows are about to ovulate and when ovulation is likely to occur.
The logical questions that follow this are how do we know which cows are about to ovulate and when the ovulation will occur? And if we do know this, then when is the best time to inseminate?
How do we know which cows are about to ovulate and when ovulation will occur?
There is no practical way to directly observe an ovulation so we have to rely on other observations that are associated with ovulation. The most practical of these has been to observe oestrous behaviour. The most definitive sign is if the cow stands when mounted by a herd mate. When this behaviour is observed, you can be reasonably confident that the standing cow is about to ovulate. However, over time this has become less practical to observe.
A combination of increased herd sizes, reduced labour availability and decreased expression of oestrus has made it increasingly difficult to detect oestrus behaviour in ovulating cows. Some studies suggest that as much as 50% of ovulating cows fail to show any standing oestrus at all. Even when standing oestrus is observed it may not be known when it first began and thus the ability to accurately predict when ovulation will occur is reduced. Now days, advancements in modern technology has resulted in a range of commercially available fully automated methods to detect ovulating cows. Included in these are electronic mount detectors, activity meters and the latest on the list, in-line milk progesterone monitoring. Each has their pros and cons and varying ability to detect ovulating cows and predict when ovulation will occur. This is a complete topic of discussion on its own.
The point to make here is that since the majority of previous research into optimal insemination timing has been related to the time from onset of standing oestrus, new technologies that are not based on standing oestrus behaviour require further research to determine the optimal insemination time. However, instead of trying to determine the best time to AI relative to every indicator of ovulation it makes most sense to determine the optimal insemination time relative to the time of ovulation. Then an optimal insemination
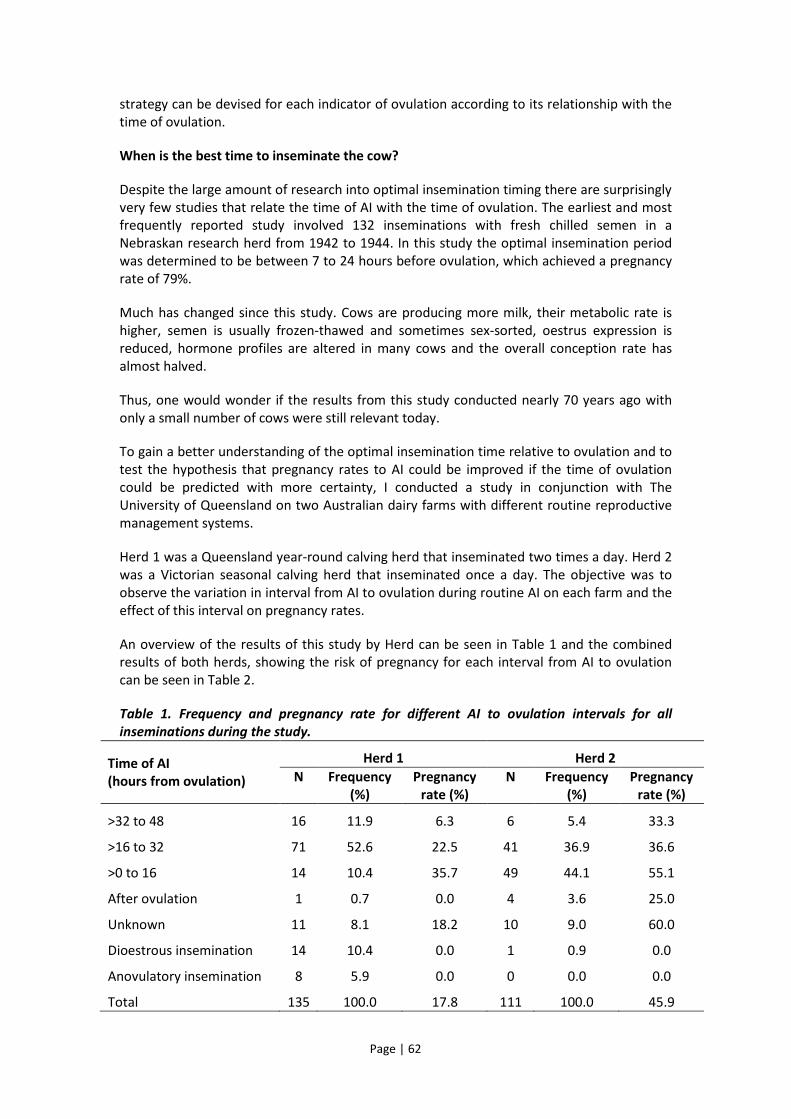
Page | 62
strategy can be devised for each indicator of ovulation according to its relationship with the time of ovulation.
When is the best time to inseminate the cow?
Despite the large amount of research into optimal insemination timing there are surprisingly very few studies that relate the time of AI with the time of ovulation. The earliest and most frequently reported study involved 132 inseminations with fresh chilled semen in a Nebraskan research herd from 1942 to 1944. In this study the optimal insemination period was determined to be between 7 to 24 hours before ovulation, which achieved a pregnancy rate of 79%.
Much has changed since this study. Cows are producing more milk, their metabolic rate is higher, semen is usually frozen-thawed and sometimes sex-sorted, oestrus expression is reduced, hormone profiles are altered in many cows and the overall conception rate has almost halved.
Thus, one would wonder if the results from this study conducted nearly 70 years ago with only a small number of cows were still relevant today.
To gain a better understanding of the optimal insemination time relative to ovulation and to test the hypothesis that pregnancy rates to AI could be improved if the time of ovulation could be predicted with more certainty, I conducted a study in conjunction with The University of Queensland on two Australian dairy farms with different routine reproductive management systems.
Herd 1 was a Queensland year-round calving herd that inseminated two times a day. Herd 2 was a Victorian seasonal calving herd that inseminated once a day. The objective was to observe the variation in interval from AI to ovulation during routine AI on each farm and the effect of this interval on pregnancy rates.
An overview of the results of this study by Herd can be seen in Table 1 and the combined results of both herds, showing the risk of pregnancy for each interval from AI to ovulation can be seen in Table 2.
Table 1. Frequency and pregnancy rate for different AI to ovulation intervals for all inseminations during the study.
Time of AI (hours from ovulation)
Herd 1 Herd 2 N Frequency
(%) Pregnancy
rate (%) N Frequency
(%) Pregnancy
rate (%)
>32 to 48 16 11.9 6.3 6 5.4 33.3
>16 to 32 71 52.6 22.5 41 36.9 36.6
>0 to 16 14 10.4 35.7 49 44.1 55.1
After ovulation 1 0.7 0.0 4 3.6 25.0
Unknown 11 8.1 18.2 10 9.0 60.0
Dioestrous insemination 14 10.4 0.0 1 0.9 0.0
Anovulatory insemination 8 5.9 0.0 0 0.0 0.0
Total 135 100.0 17.8 111 100.0 45.9
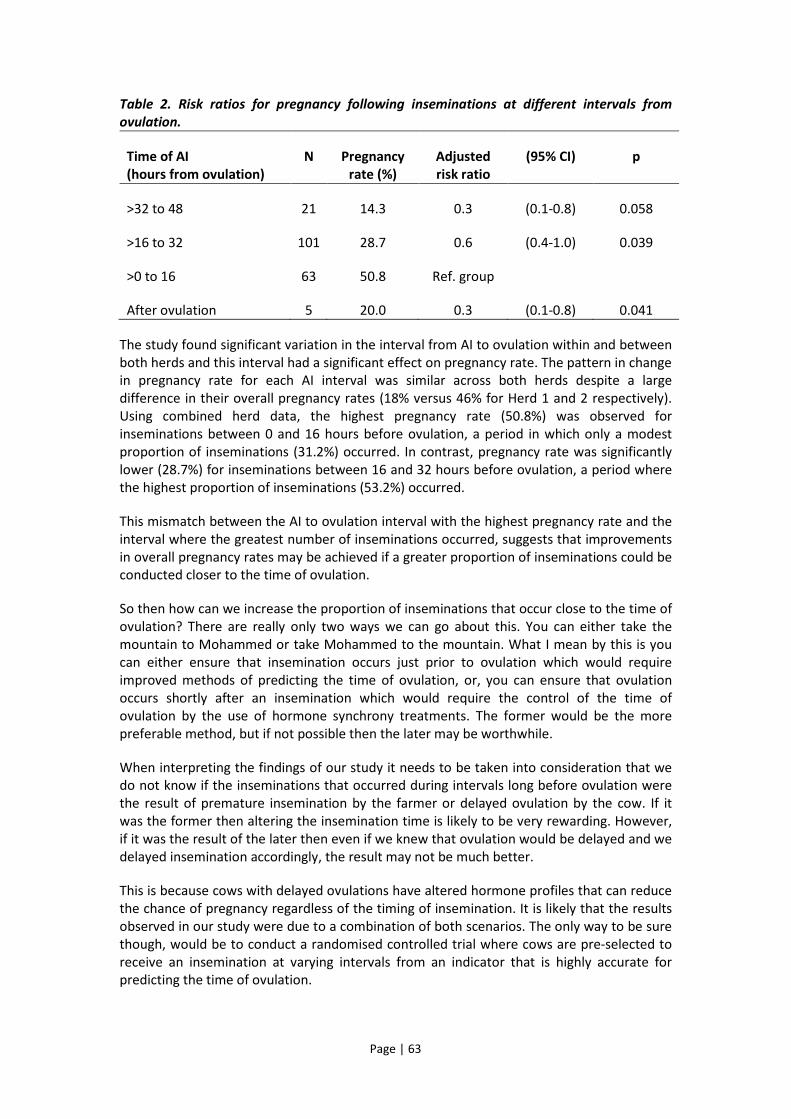
Page | 63
Table 2. Risk ratios for pregnancy following inseminations at different intervals from ovulation.
Time of AI (hours from ovulation)
N Pregnancy rate (%)
Adjusted risk ratio
(95% CI) p
>32 to 48 21 14.3 0.3 (0.1-0.8) 0.058
>16 to 32 101 28.7 0.6 (0.4-1.0) 0.039
>0 to 16 63 50.8 Ref. group
After ovulation 5 20.0 0.3 (0.1-0.8) 0.041
The study found significant variation in the interval from AI to ovulation within and between both herds and this interval had a significant effect on pregnancy rate. The pattern in change in pregnancy rate for each AI interval was similar across both herds despite a large difference in their overall pregnancy rates (18% versus 46% for Herd 1 and 2 respectively). Using combined herd data, the highest pregnancy rate (50.8%) was observed for inseminations between 0 and 16 hours before ovulation, a period in which only a modest proportion of inseminations (31.2%) occurred. In contrast, pregnancy rate was significantly lower (28.7%) for inseminations between 16 and 32 hours before ovulation, a period where the highest proportion of inseminations (53.2%) occurred.
This mismatch between the AI to ovulation interval with the highest pregnancy rate and the interval where the greatest number of inseminations occurred, suggests that improvements in overall pregnancy rates may be achieved if a greater proportion of inseminations could be conducted closer to the time of ovulation.
So then how can we increase the proportion of inseminations that occur close to the time of ovulation? There are really only two ways we can go about this. You can either take the mountain to Mohammed or take Mohammed to the mountain. What I mean by this is you can either ensure that insemination occurs just prior to ovulation which would require improved methods of predicting the time of ovulation, or, you can ensure that ovulation occurs shortly after an insemination which would require the control of the time of ovulation by the use of hormone synchrony treatments. The former would be the more preferable method, but if not possible then the later may be worthwhile.
When interpreting the findings of our study it needs to be taken into consideration that we do not know if the inseminations that occurred during intervals long before ovulation were the result of premature insemination by the farmer or delayed ovulation by the cow. If it was the former then altering the insemination time is likely to be very rewarding. However, if it was the result of the later then even if we knew that ovulation would be delayed and we delayed insemination accordingly, the result may not be much better.
This is because cows with delayed ovulations have altered hormone profiles that can reduce the chance of pregnancy regardless of the timing of insemination. It is likely that the results observed in our study were due to a combination of both scenarios. The only way to be sure though, would be to conduct a randomised controlled trial where cows are pre-selected to receive an insemination at varying intervals from an indicator that is highly accurate for predicting the time of ovulation.

Page | 64
Currently the most practical way to do this would be to base insemination timing on the onset of increased cow activity as monitored by cow activity meters. In a previous study we found that the time of onset of increased cow activity as monitored by neck mounted 2-hourly activity meters, had a close association with the time of ovulation in paddock based dairy cows. The distribution from onset of increased activity to time of ovulation can be seen in Figure 1.
In addition the interval from onset of increased cow activity to AI had a significant effect on the observed pregnancy rate (Figure 2). Thus insemination strategies based on cow activity measurements are likely to be highly rewarding and in many cases could be better than inseminations based on observations for standing oestrus. However, that would depend on the frequency and accuracy of the observations for standing oestrus.
Figure 1. Distribution of intervals from start (black bars) and end (white bars) of increased cow activity to time of ovulation (all data is from Herd 2, n=94 ovulations).
Figure 2. Pregnancy rate (proportion of inseminations resulting in pregnancy) for inseminations at different intervals from onset of cow activity (n=104).
0
5
10
15
20
25
30
35
40
45
≤0≤6>0≤12>6≤18>12≤24>18≤30>24≤36>30≤42>36≤48>42≤54>48≤60>54>60
Hours from ovulation
Freq
uenc
y di
strib
utio
n (%
)
40.0p=0.150
42.4p=0.019
67.9Ref. group
Pregnancy rate, > 40, 0.0
Pre
gnan
cy ra
te (%
)
Interval from onset of increased pedometer activity to AI (hours)

Page | 65
Some practical take home messages
Timing of insemination is important and can have a significant effect on the proportion of pregnancies per AI. The importance of correct timing is likely to be even greater with use of inferior quality semen such as sex-sorted semen.
Inseminations strategies based on highly accurate predictors of ovulation time are likely to have the most success.
Inseminations close to but before ovulation have the greatest chance of resulting in a pregnancy. There is a period of at least 36 to 48 hours before ovulation where inseminations can result in a pregnancy but the probability slowly declines for intervals greater than 24 hours before ovulation. The probability of pregnancy declines dramatically for inseminations that occur after ovulation. Thus the consequences of inseminating too late are worse than inseminating too early.
The optimal insemination strategy for a given herd will depend on the frequency and accuracy of observations for detecting ovulating cows. If the time of onset of heat or other indicator of ovulation is known with a reasonable degree of accuracy due to frequent accurate observations then the interval from first observation to insemination should be slightly longer. If you have little idea when onset of heat occurred then the interval from first observation to insemination should be shorter.
Well-managed once daily insemination programs can achieve similar results to twice daily insemination programs. The only proviso for this is if further studies based on highly accurate indicators of ovulation time suggest otherwise. Until such studies exist and unless you are using very frequent cow observations or continuous automated monitoring then there is unlikely to be great benefit to change from a once daily to a twice daily insemination protocol.
If inseminating twice daily based on twice daily cow observations then stick to the old AM/PM rule. There was a study a few years ago that suggested inseminating cows at the very next opportunity could be better than the AM/PM rule (e.g. If the cow was seen on heat for the first time just before milking then you may inseminate following that milking rather than waiting until the next). This recommendation was based on the chance that the first observation of heat will for many cows be at least 4 hours after the actual onset of heat. The findings from our study do not support this strategy (particularly if frequent observations for heat are used), as it is likely to result in many inseminations being conducted too early.

Page | 66
CALF REARING CASE STUDY: GUNDAGAI DAIRY – SCOTT FAMILY, BOYANUP WA
PETER ROSHER
P. Rosher1 and W. Scott2 1Veterinarian, Cattle Veterinary Services, Busselton WA E: [email protected] 2Dairy Farmer, Gundagai Dairy, Boyanup WA E: [email protected]
Introduction
The importance of raising young stock well is true for all farm animals. Getting the calf off to a good start is an integral part of a successful replacement program on all dairy farms. The challenge is to achieve excellent performance whilst balancing the demands on infrastructure and labour. Many variations of calf raising systems exist to achieve successful calf rearing – there is no “one size that fits all”. The purpose of this presentation is to look closely at the calf rearing system in operation at Gundagai Dairy. The presentation covers a brief description of the farm, an assessment of the performance of replacement heifers, an in-depth assessment of the calf rearing performance (including labour use) and then a detailed description of the actual calf rearing program that has achieved this level of performance.
Gundagai Dairy
• Family farm situated in Boyanup WA • Dry land farm (Mediterranean climate) • Pasture with parlour grain during the growing season, PMR with parlour grain during
the non growing season (November through to May this year) • 650 milkers (Holsteins) • Milking platform area 300 Ha. Total farm area 950 Ha and total cattle up to 2000
head. • Rotary dairy – 50 stand (commissioned in 1994) • Production: Herd average – 8700 litres @ 3.8% fat & 3.1% protein. Annual
production – 5.3 million litres (grade 1 milk SCC < 150,000). • Bi seasonal calving pattern – transitioning to tri-seasonal due to milk price shifts • Raise all calves - replacement heifers and steers • Labour (FTE) - 5
Replacement heifer performance
• Heifer (1st calver) milk production o 82% of mature cows (7700l vs. 9400) - note that the InCalf benchmark is to
aim above 83%. • Heifer (1st calver) retention rate
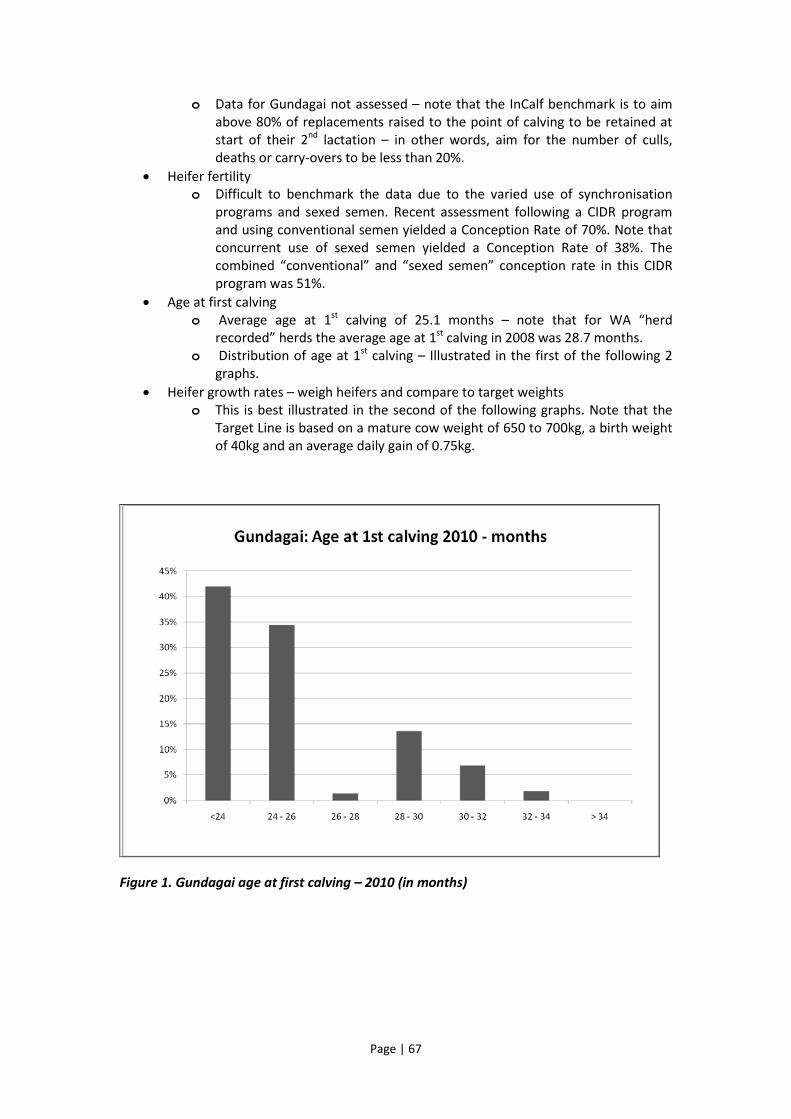
Page | 67
o Data for Gundagai not assessed – note that the InCalf benchmark is to aim above 80% of replacements raised to the point of calving to be retained at start of their 2nd lactation – in other words, aim for the number of culls, deaths or carry-overs to be less than 20%.
• Heifer fertility o Difficult to benchmark the data due to the varied use of synchronisation
programs and sexed semen. Recent assessment following a CIDR program and using conventional semen yielded a Conception Rate of 70%. Note that concurrent use of sexed semen yielded a Conception Rate of 38%. The combined “conventional” and “sexed semen” conception rate in this CIDR program was 51%.
• Age at first calving o Average age at 1st calving of 25.1 months – note that for WA “herd
recorded” herds the average age at 1st calving in 2008 was 28.7 months. o Distribution of age at 1st calving – Illustrated in the first of the following 2
graphs. • Heifer growth rates – weigh heifers and compare to target weights
o This is best illustrated in the second of the following graphs. Note that the Target Line is based on a mature cow weight of 650 to 700kg, a birth weight of 40kg and an average daily gain of 0.75kg.
Figure 1. Gundagai age at first calving – 2010 (in months)
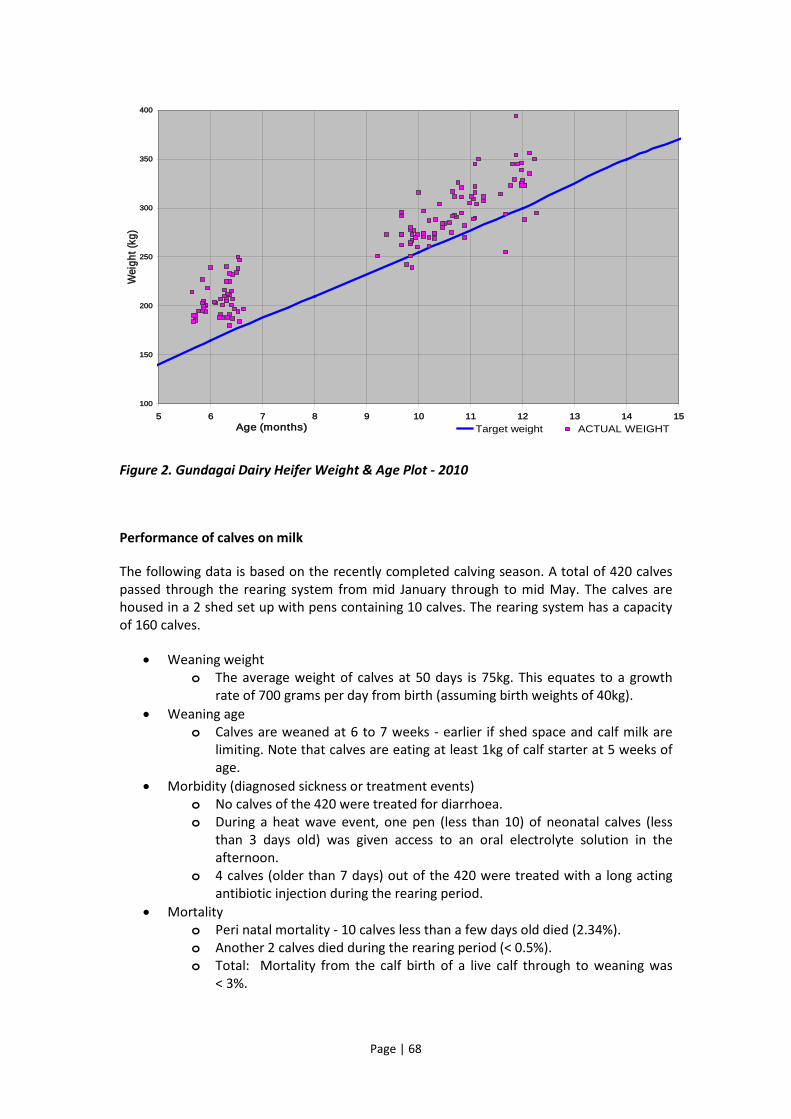
Page | 68
Figure 2. Gundagai Dairy Heifer Weight & Age Plot - 2010
Performance of calves on milk
The following data is based on the recently completed calving season. A total of 420 calves passed through the rearing system from mid January through to mid May. The calves are housed in a 2 shed set up with pens containing 10 calves. The rearing system has a capacity of 160 calves.
• Weaning weight o The average weight of calves at 50 days is 75kg. This equates to a growth
rate of 700 grams per day from birth (assuming birth weights of 40kg). • Weaning age
o Calves are weaned at 6 to 7 weeks - earlier if shed space and calf milk are limiting. Note that calves are eating at least 1kg of calf starter at 5 weeks of age.
• Morbidity (diagnosed sickness or treatment events) o No calves of the 420 were treated for diarrhoea. o During a heat wave event, one pen (less than 10) of neonatal calves (less
than 3 days old) was given access to an oral electrolyte solution in the afternoon.
o 4 calves (older than 7 days) out of the 420 were treated with a long acting antibiotic injection during the rearing period.
• Mortality o Peri natal mortality - 10 calves less than a few days old died (2.34%). o Another 2 calves died during the rearing period (< 0.5%). o Total: Mortality from the calf birth of a live calf through to weaning was
< 3%.
100
150
200
250
300
350
400
5 6 7 8 9 10 11 12 13 14 15Age (months)
Wei
ght (
kg)
Target weight ACTUAL WEIGHT

Page | 69
• Labour o Labour used for calf rearing includes movement of calves, feeding
(preparation, delivery & cleanup), treatments, monitoring, and bedding & housing management.
o The labour usage at Gundagai is a remarkable 1 hour per day to feed 160 calves plus no more than an additional 1 hour per week for calf movements, monitoring and bedding & housing management.
o This equates to 8 hours of a labour unit per week per 160 calves fed or just under 45 minutes per 100 calves fed per day.
Calf housing, feeding and management
Given the above performance we will take a close look at the system used at Gundagai. The details are described cover the following areas:
• Housing system & management – 2 sheds with group pens – total capacity 160 calves
• Newborn calf management (including colostrum management) • Feeding system (details of - milk, water, calf starter, and hay) • Weaning management
Page | 70
ROBOTIC ROTARY: REVOLUTIONISING MILK HARVESTING AS WE KNOW IT?
KENDRA KERRISK
K. Kerrisk and S. Garcia University of Sydney, Camden, N.S.W., 2570 Email: [email protected]
Introduction
Automatic milking systems (AMS) or single boxes as they are often referred to have been used commercially overseas since the early 1990’s. They were developed for the traditional European market which has small, indoor herds. FutureDairy research has proven single boxes can operate effectively in Australia’s pasture-based system, achieving both high pasture utilisation and acceptable AMS unit utilisation. However, single boxes are best suited to herds of less than 300-400 cows, due to the capacity (number of cows that can be milked by each unit in a 24-hour period) and the cost.
FutureDairy’s founders and investors recognised that the Australian dairy industry needed an affordable automatic milking system capable of milking herds with more than 300 cows. Such a development would allow the potential of automatic milking to be realised in moderate to large herd sizes where the uptake of the single-box robots would likely be limited.
The concept of the robotic rotary (RR) had the potential to meet these needs. The RR was co-developed between DeLaval engineers in Sweden and FutureDairy researchers in Australia. The initial concept development began in 2005, with the first prototype built at DeLaval’s research facility in Sweden in 2008. The Camden prototype was installed in 2009 for testing under Australian conditions and to allow the co-development to be conducted. The system has been progressively developed and refined as a result.
The Pilot Robotic Rotary at Camden
A pilot of the RR is operating at the Elizabeth Macarthur Agricultural Institute, Camden, NSW. While the Camden pilot is fully operational, it is not as ‘fully developed’ as the commercial product and it doesn’t have all of the functionality that the commercial versions will have. The prototype was installed for research, development and testing purposes but will need to retired in the coming years as it was not built with the intention of a long-life commercial product.
In February 2011 operation of the prototype RR had progressed to a point that the research and farm staff team took the decision to decommission the single-box robots on the site and operate 100% with the RR. One of the key challenges for the FutureDairy team is to determine the feasibility of operating the RR with full voluntary and distributed cow traffic i.e. cows bringing themselves to the dairy and milking themselves in a distributed pattern so that milkings occur throughout the day and the night.

Page | 71
The FutureDairy team believes that the greatest benefits of the RR will only be realised with full voluntary cow traffic. Testing the technology’s ability to cope with intermittent cow traffic is extremely important if the equipment is to be promoted as having the ability to be adopted in this manner.
The robotic rotary automates most milking tasks, enabling milk harvesting to be conducted as a background activity, without the presence of a human operator.
As with any automatic milking system, there are certain milking-related tasks that require operator input. In the case of the robotic rotary, these include (but are not limited to):
• activating the washing system; • changing filter socks and rubber-ware; • attending alarms; • managing a separate herd of cows whose milk is not destined for the factory (e.g
antibiotic and colostrum cows); and • monitoring individual cow performance
However, the timing of some of these tasks is very flexible and the labour associated with conducting the tasks is much lower than that required to milk an entire herd or 300-800 cows.
Benefits of AMS
The benefits of automatic milking have been well recognised overseas where single unit (and multi-unit) robotic boxes have been widely adopted in herds up to about 300 cows. The RR has the potential to make these benefits available to operators with larger dairy herds. While there are significant savings in labour (time and/or cost), overseas experience shows that the most-valued benefits of AMS are in terms of flexible working conditions and the associated lifestyle improvements.
Automatic milking removes the twice-a-day labour intensive milking task from the daily routine, allowing greater flexibility for the working day on a dairy farm. The impact of this flexibility reaches far beyond the dairy, potentially changing the whole approach to the dairy business. Automatic milking frees up dairy farmers’ time and energy to use on their priorities, whether they be farming, business, family or lifestyle just to name a few.
Design
The robotic rotary has an internal, rotary herringbone platform, with cows facing outwards and the robots housed in the centre.
While the Camden pilot has only 16 milking points or bails, the commercial product will have 24 with the option of two to five robots, depending on the required capacity of cow throughput. The system will perform the tasks of teat washing and drying, applying the milking cups, cup removal, teat disinfection and cup flushing. It also monitors milk yield and quality.
The two-robot system has a robot for teat washing and drying (teat preparation) and another to apply the cups.
The five-robot system has two robots dedicated to teat preparation, two for cup attachment and a fifth for post-milking teat sanitation. The teat-spray robot locates each teat

Page | 72
independently using a camera that locates teat in real time 3D, thereby ensuring good coverage on all teats whilst minimising wastage of teat spray.
On the RR, cows stand at approximately a 30 degree angle which allows the robotic arms to approach the cow from the side. This is very different to a conventional parallel rotary where the operator applies the cups through the cow’s back legs.
Cows wear electronic identification collars. The system uses historical records to determine expected milk yields per quarter and regularly updates the co-ordinates of each teat. This speeds up the process of locating the teat. A sensor located above the platform detects the cow’s precise position, enabling the laser guided cups to be attached. The electronic ID also ensures that the RR only attachs cups to cows deemed accepted for milking into the bulk milk vat, thereby eliminating the risk of antibiotic milk entering the vat.
The design enables the cups to be attached to cows of varying sizes with equal ease.
At this stage, the commercial robotic rotary does not have feeding stalls. Out-of-parlour automatic feeding stations can be installed to allow for controlled feeding of concentrates to individual cows.
The robotic rotary arm cannot be retrofitted to a conventional rotary dairy, a key reason being that a conventional rotary involves accessing the udder from between the back legs and this is beyond the capability of the current robot and laser technology.
Milking approach
The robotic rotary is suited to either batch milking, voluntary milking or a combination of the two.
With a voluntary milking system, cows walk to the dairy on their own as individuals or in small groups. This results in cows being milked throughout most of the day and night. It also allows the system to be operated with a small waiting yard (doesn’t need to accommodate the entire herd at any one time) and minimal waiting time for individual cows.
A batch milking system involves bringing the cows to the dairy in groups throughout the day (and potentially night). During the milking session, the operator can leave the dairy and conduct other tasks.
It is not feasible to bring a whole herd (say 400 cows) to the yard and leave for automatic milking while the operator does other farm tasks. This is because the throughput rates of 50-90 cows per hour would involve cows waiting too long at the dairy.
Whilst batch milking with the RR will suit some operations and management systems the impact of fetching 2-4 groups of cows (say 200 cows at a time) for milking 2-3 times a day will reduce the labour and lifestyle advantages that may be realised with full voluntary milking.
Capacity
The first commercial robotic rotaries will be able to milk up to 90 cows per hour, depending on the number of robots installed.

Page | 73
This capacity can be used in different ways under different management approaches. For example, it could be feasible to milk up to 800 cows twice a day; or up to 540 cows three times a day.
The design of the RR allows for a modular approach, so capacity can be expanded as the dairy business grows. For example, an initial installation could start with two robots – one for teat preparation and one for milking cup attachment – with the capacity to milk up to 50 cows per hour. Subsequent expansion could be accommodated by installing extra robots.
In contrast, the single box automatic milking units can milk only 6-10 cows per hour. This is because each robot is idle for almost the entire time the cow is being milked.
The moving platform on the RR frees the robots up as soon as the cups have been attached to the cow allowing the “attention time” per cow to be minimised and throughput per robot to be maximised. When the cow has been completely milked and the milking cups have all been removed, the cow continues to rotate around the platform and passes the teat spray robot for post-milking sanitation prior to exiting the platform.
Where to from here?
The next step in Australia will be the installation of the DeLaval AMRTM on a commercial farm in Tasmania as a pilot installation. The pilot installation will be closely monitored and supported by DeLaval and the FutureDairy team. The experience provides the opportunity to identify issues and continue development of the system in the ‘real life’ situation. The involvement of the FutureDairy team has been identified as being important to ensure that the commercial farmer will have direct links to the expertise and skills that have been developed in the FutureDairy project whilst. The involvement will also ensure that FutureDairy is aware of the key challenges associated with commercial and large-scale operation of the RR to ensure that future research directions are well justified.
FutureDairy is not solely focussed on the RR with activities also being conducted in the farm system area (feeding and forages), understanding the impact of AMS on commercial farms in Australia and supporting early adopters and pilot installations of the RR. The key focuses for the research program of FutureDairy around the RR now focuses on understanding the challenges and limitations of the RR and the impact of the technology on working routines and farm operations. The research program will also investigate research into principles that will address the challenges associated with large scale, pasture-based voluntary cow traffic. Some of these will be in the area of maximising the amount of feed grown in close vicinity to the dairy to allow the average walking distance of the herd to be minimised. In addition our research will be involved in investigating the impact of management practices on the herd and in particular on individuals within the herd to ensure that the range in performance between cows is minimised (i.e. some cows don’t underperform whilst other hold the herd averages high).
The collaboration
The development of the robotic rotary involved unusually close and large scale collaboration between scientists, commerce and industry. Achieving a revolutionary product in such a short time was made possible by the combined contribution of DeLaval’s engineering and product development expertise, FutureDairy’s scientists and the industry context from Dairy Australia and the Department of Primary Industries, NSW. It has been a testimony of what can be achieved by a private-public-industry partnership of both intellect and funding. For

Page | 74
some years, Australian dairy farmers have asked for a robotic rotary. The collaboration allowed Dairy Australia to invest farmers’ levy funds in a project that attracted the additional investment and expertise needed to develop a system to meet Australian farmers’ needs. The size of the return on the investment is fully attributed to the collaboration of the four organisations and the expertise they have contributed to the project.
The true advantage of the investment by the Australian investors will ensure that Australian farmers are amongst the first in the world to have the opportunity to consider the technology for the farming operations whilst also being confident of knowing the true challenges and limitations of the technology within pasture-based farming systems.
The authors would like to acknowledge the support of all sponsors of the FutureDairy project, particularly Dairy Australia, Department of Primary Industries, NSW, University of Sydney, and DeLaval.

Page | 75

Page | 76
UNDERSTANDING THE EFFECT OF FEED vs. NO FEED ON COW QUEUING BEHAVIOUR WITHIN THE NEW ROBOTIC ROTARY SYSTEM
TORI SCOTT
V. ScottAB, K.KerriskA and S.GarciaA
AUniversity of Sydney, Faculty of Veterinary Science, Camden, NSW, 2570 BCorresponding author. Email: [email protected]
Abstract
Understanding cow behaviour within a pasture-based automatic milking system (AMS) will facilitate a higher level of farm and herd management. In March and April 2011, a study was conducted using a prototype Automatic Milking Rotary (AMR™) to investigate the voluntary pre-milking waiting time of 160 pastured dairy cows, with and without feed provided on the platform. Voluntary waiting time was calculated as the time from entry into the holding yard until the cow presented on the rotary platform and milking commenced. Whilst it is recognised that many external factors affect a cow’s willingness and ability to voluntarily present for milking, the key factors that were recorded were; all sorting and drafting activities, human encouragement/intervention and equipment downtime. This enabled classification of waiting times as portions of “voluntary” and “forced” waiting. Preliminary investigations into results indicated that when feed was provided on the platform, the voluntary waiting time was reduced by 55% compared to when feed was not provided. Results also indicated that late lactation cows had shorter average voluntary waiting times than early and mid lactation cows. Further analysis will include investigation into the impact of production traits including parity, days in milk and yield on voluntary waiting time. This will help us to understand the factors that drive voluntary traffic and motivation for milking. Through discerning why some cows voluntarily wait for long periods of time prior to milking, management procedures to reduce waiting times for cows in certain classification groups can be investigated, further enhancing the potential benefits of a voluntary milking system.
Key words: automatic milking, behaviour, voluntary waiting time
Introduction
Automatic milking systems (AMS) are becoming an increasingly popular alternative to conventional milking in the Australian dairy industry. Currently, in excess of 14 farms are operating with AMS, and it is likely that this number will continue to rise in the future, as was the case overseas.
The behaviour of cows milked in an AMS differs to that of cows milked in a
conventional system (Wendl, Harms and Schon 2000). Automatic milking systems enable cows to voluntarily traffic around the farm system, and cows can set their own daily routine moving to and from the dairy (Ketelaar de Lauwere and Ipema 2000b; Halachmi et al. 2003). Therefore, a more comprehensive herd and pasture management system is required to ensure that voluntary cow traffic maintains the desired milking frequency targeted by the individual farmer.

Page | 77
In November 2010, a prototype Automatic Milking Rotary (AMR™) was unveiled in Australia, with the capacity for higher cow throughput than single box AMS units, and the subsequent ability to milk larger herds (with lower capital investment per cow than single box AMS). In a voluntary system, cows present at an automatic drafting gate and are either denied or granted milking permission. If they are granted milking permission they are drafted to enter the pre-milking holding yard; they are not forced to be milked as is the case in a conventional system. Instead cows must volunteer to be milked. As a result, cows can potentially wait for several hours before volunteering onto the milking platform either through a forced (system in cleaning mode or shut down for maintenance or repairs) or voluntary waiting.
One of the challenges associated with this voluntary movement is reducing prolonged waiting times in the pre-milking holding yard. Through reducing unnecessary waiting time, cows could have more time to feed and rest, maximising the time in the paddock, and would also have less risk of developing lameness and disease (Ketelaar de Lauwere and Ipema 2000a). Therefore, it is necessary to quantify and understand a cow’s voluntary decision to wait in the pre-milking holding yard before being milked, and whether there are any clear indicators for identifying cows most likely to have long waiting times.
The current study aimed to investigate the voluntary waiting time of cows in an AMR™, and to identify potential production and management factors that can result in reduced waiting times. This is of importance since the increased milking capacity of AMR™ will allow for larger herd numbers, and when operated at higher levels of capacity, the potential for increased queuing times will be higher. As queuing results in system inefficiencies, it is important that cow behaviour in this system is understood in order to create
improvements in management that will lead to increased production, overall system performance and viability, and potentially improved welfare.
Materials and methods
Research was conducted at the automatic milking research farm at the Elizabeth Macarthur Agricultural Institute, Camden, New South Wales. Ethics approval was granted through the Elizabeth Macarthur Agricultural Institute Animal Ethics Committee (Industry and Investment, New South Wales, project number MO4/07) prior to the commencement of this project.
The trial herd, consisting of 160 mixed breed (Holstein x Illawarra, Holstein Friesian and Illawarra) and mixed age (parity range 1-10), 30% primiparous and 70% multiparous, dairy cows, had prior AMR™ experience. Animals were managed as one herd, with voluntary access to a day pasture break from 08:30-18:00 and a night pasture break from 18:00-08:30. An allocation of 20Kg DM/day.cow was provided, with 6Kg DM/cow.day supplied as partial mixed ration (PMR) on the post-milking feedpad. The PMR consisted of 62% maize silage, 21.4% pelleted concentrate (18% protein), 8.5% oaten hay, 7.3% lucerne silage and 1.2% oaten silage. Water was available ad libitum.
The 16-bail prototype AMR™ operated 24 hours a day, with voluntary cow access denied during batch milking of abnormal milk cows and subsequent machine washing twice-a-day (approximately 2.5hr total). Day and night voluntary sessions started at approximately 07:00 and 19:00 respectively, and lasted for approximately 10-11 hours each.
To maintain high quality bulk milk, any bail that remained idle/vacant for 1 hour after a milking was automatically deactivated to prevent high bacteria counts before transferral to the bulk milk

Page | 78
vat. To ensure that some bails remained available to the queuing cows throughout the 24-hour period, the system was started up with only 8 bails active after each wash with an additional 4 bails activated at 11:00 and 14:00 during the day and 23:00 and 02:00 during the night.
The configuration of active bails vs. inactive bails was randomised daily (some days had intermittent active and de-active bails; some had up to 8 consecutive bails active and many configurations in between). It is possible that the configuration of active bails impacts on the predictability for the cows and the resultant voluntary traffic onto the platform. Randomisation of the active bail configuration was carried out for daily milking sessions and the impact of this on cow traffic was investigated by another researcher.
Data was recorded over a 16 day (24 hr) period throughout March and April 2011, where feed on the platform was offered for 8 of the 16 days (Table 1). The feed offered was a small, unmeasured volume (approximately 100g/cow.milking) of pelleted concentrate that acted as a reward for the cows but was unlikely to impact significantly on milk production. An adjustment period of 12 days from the time of stopping feed on the platform to recording voluntary traffic was given to accustom the cows to expecting no feed, while a 2 day adjustment period was given when feed was offered after the non-feeding treatment. The cows in this trial were trained and accustomed to receive feed on the platform, and so a long adjustment period once feed was offered again was deemed unnecessary.
The voluntary waiting time of individual cows in the pre-milking holding yard was recorded as the time from entry into the holding yard until the cow presented on the rotary platform and milking commenced, and this data was recorded for each cow milking. Machine downtime due to plant washing, milking of abnormal
milk cows, maintenance and breakdown was also recorded to allow waiting time to be defined as proportions of forced vs. voluntary waiting.
Table 1. – Indication of feeding treatment by trial day
Day Feed
1 On
2 On
3 On
4 Off
5 Off
6 Off
7 Off
8 Off
9 Off
10 Off
11 Off
12 On
13 On
14 On
15 On
16 On
Animals entering the dairy passed through a selection gate at the entrance to the pre-milking holding yard. They were electronically identified and given access to the rotary if they had milking permission or sent back to the paddock if they did not. Milking permission was granted based on the time that had elapsed since the last milking and differed

Page | 79
between animals (range from 4-8 hours) based on yield and days in milk (DIM). The entrance to the rotary was located at the end of the pre-milking holding yard. Once milked, animals were directed along a laneway to a second selection gate, where incompletely milked individuals were separated from the main herd. All animals were given access to the feedpad after milking, and completely milked animals could return to the paddock voluntarily from the feedpad.
At the commencement of the day, any remaining animals in the previous day paddock were recorded, fetched, and brought to the dairy. Disruptions within the dairy were kept to a minimum to encourage voluntary traffic onto the platform. Throughout the day, animals could voluntarily walk to the dairy for milking. In the evening, any remaining animals in the previous night paddock were recorded, fetched and brought to the dairy.
Prior to the afternoon machine cleaning, any animals remaining in the pre-milking holding yard were encouraged onto the platform and recorded. Animals with incomplete milkings were recorded and milked a second time to ensure they were milked fully. Colostrum and waste milk animals were batch milked before machine cleaning in the afternoon and morning.
All sorting and drafting activities were recorded. Animals forced to wait before milking (such as during a machine wash, routine maintenance or breakdown) were recorded and given a waiting time classified as either “forced” or “voluntary”. Lactation, DIM and yield for each animal was also recorded each day.
Simple descriptive statistics using Microsoft Excel 2007 were used to provide a preliminary investigation into voluntary waiting time in the pre-milking holding yard.
Results
All animals in this study were trained in using the on-farm gating systems and had sufficient experience to achieve an unassisted milking on the AMR™.
Preliminary analysis showed that when feed was provided on the platform, voluntary waiting time was shorter than when no feed was provided (Table 2). Whilst it appears that there may be some impact of stage of lactation on waiting time, there is no clear trend that waiting time increases or decreases with stage of lactation and it is likely that the differences seen in Table 2 are not significant (yet to be analysed statistically).
Table 2. – Average voluntary waiting time (minutes) per milking session, and the count of visits to the holding yard over a 16 day period (SOL = stage of lactation)
Feed on Feed off
Lactation Count Time Count Time
Early 711 88.52 510 197.50
Mid 681 87.86 532 179.45
Late 593 77.25 505 188.41
Whole herd
1985 84.93 1547 188.33
When feed was provided on the platform, 20.71% of visits had a voluntary waiting time greater than 2 hours, but when feed was not provided 54.56% of visits had a voluntary waiting time greater than 2 hours (Figure 1).

Page | 80
Figure 1. – Number of milkings in each 30 minute category of voluntary waiting time (hours) prior to milking (0 = 0-29 minutes, 1 = 30-59 minutes etc.)
The total average waiting time of any cow milking includes any forced waiting time and the voluntary waiting time. The total average waiting times are presented in Table 3 and show that the forced portion resulted in an average increase of 12 and 20 minutes/cow milking for feed and no feed respectively. Further investigation into the forced vs. voluntary waiting times will help us to determine whether there was any relationship between being forced to wait and subsequent voluntary waiting times. There was no clear trend of stage of lactation on the total waiting time (Table 3).
Table 3. – Average total waiting time (minutes) per milking session, and the count of visits to the holding yard over a 16 day period (SOL = stage of lactation)
Feed on Feed off
Lactation Count Time Count Time
Early 711 97.57 510 220.63
Mid 681 100.35 532 197.26
Late 593 90.27 505 209.07
Whole herd
1985 96.34 1547 208.82
Discussion
The data presented here indicates that the provision of a small portion of feed on the platform appeared to have a significant impact on pre-milking voluntary waiting time. When feed was not provided, the average voluntary waiting time was 117% longer than when feed was available. This result is not surprising and supports previous research which described feed as a primary motivator for voluntary movement (Ketelaar de Lauwere and Ipema 2000b), however the scale of the impact is more dramatic than expected. These results suggest that in a voluntary cow traffic system whereby cows are accustomed to receiving feed during milking, care should be taken to ensure that feed silos do not run out of feed and that regular maintenance of the feeding system should be conducted to minimise any chance of feeding equipment failure.
It was not possible to have separate control (feed off) and treatment (feed on) groups for this investigation due to the nature of the feeding system. In the current feeding system, there is a lack of ability to ensure that an individual cow consumes all of her allocated feed. As a result, there is no assurance that a “no feed” cow does not receive any feed that is remaining by a previous “feed” cow.
Over 50% of all visits to the dairy for milking resulted in waiting times greater than 2 hours when feed was not provided. This could create increased risk of lameness and disease, and subsequent animal welfare concerns, with cows standing on concrete flooring for prolonged periods of time (Ketelaar de Lauwere and Ipema 2000a). Cows will choose to rest for a number of hours per day, and extended times at the dairy will likely impact on the cows time spent grazing rather than resting and has potential to significantly impact daily feed intakes.
0 100 200 300 400 500 600 700 800 900
0 1 2 3 4 5 6 7 8 9 10 11 12.5
Number of case s
Waiting time categories (Hrs)
Summary of voluntary waiting time
Feed on Feed off

Page | 81
It is possible that a “no feed” system may display dramatically different voluntary cow traffic for cows that have never received feed on the platform. Further analysis of the data will indicate whether cow traffic improved over the “feed off” treatment period, and whether a longer adjustment period should be used in this trial and incorporated into any future trials to further ensure that cows are not expecting feed to be offered on the platform. Out-of-parlour feeders (OOPF) where not used in this study, however the impact on voluntary cow traffic of feed on the platform vs. feed available in post-milking OOPF could be an interesting comparison for future research.
Interestingly, there was no consistent trend to suggest that late lactation (>200 DIM) cows were slower to move through the waiting yard than early lactation cows. The late lactation group of cows tends to be less motivated to move around the farm system and generally will have a lower average milking frequency than early lactation cows. However, this was not evident in the speed at which these cows moved through the dairy and volunteered onto the platform.
A comprehensive analysis of these results will provide a more detailed understanding into what factors motivate cows to volunteer for milking, whether any particular groups of cows should be targeted with different management routines to reduce waiting times and whether there are factors (in particular parity, DIM and yield) that can be used to reliably and accurately predict a cow’s expected waiting time. With a greater understanding of cow behaviour in AMR™, management practices could be implemented to further improve the efficiency and success of the system.
The authors would like to acknowledge the support of all the sponsors of FutureDairy, particularly Dairy Australia, Industry and Investment NSW, University of Sydney and DeLaval. The support and
assistance of staff at the automatic milking research farm, Camden was also greatly appreciated.
References
Halachmi I., Adan I., van der Wald J., van Beek P. and Heesterbeek J.A.P. (2003). Agr. Sys, 76, 681.
Ketelaar de Lauwere C.C. and Ipema A.H. (2000a). Wageningen Academic Publishers, Wageningen, 289.
Ketelaar de Lauwere C.C. and Ipema A.H. (2000b). Wageningen Academic Publishers, Wageningen, 181.
Wendl G., Harms J. and Schon H. (2000). Wageningen Academic Publishers, Wageningen, 143.

Page | 82
MANAGEMENT STRATEGY TO IMPACT ON MILKING INTERVALS AND TOTAL DAILY YIELD OF DAIRY COWS IN AN AUTOMATIC MILKING SYSTEM, UNDER TYPICAL AUSTRALIAN PASTURE-BASED CONDITIONS
NICOLAS LYONS N. Lyons, K. Kerrisk and S. Garcia University of Sydney, Camden, N.S.W., 2570 Email: [email protected]
Abstract
A trial was conducted at the AMS farm in Camden, in late November – early December 2010, to evaluate the impact of 2 grazing management options on the occurrence of extended milking intervals and overall cow and system performance. For this purpose, two treatments (2 [2WG] vs. 3 [3WG] allocations of feed per 24h period), were compared as a pilot trial. The trial involved the entire milking herd of 158 cows, with average days in milk = 135 ± 8 days, average milking frequency = 1.49 ± 0.03 milkings/day, and average 7-day milk production = 20.5 ± 0.6 Kgs/c.d (Mean ± SEM). Cows were milked using 2 DeLaval VMS milking units.
Preliminary results indicated that cows in the 3WG treatment had lower incidence of extended milking intervals, a 29% lower average milking interval, a 42% higher average milking frequency and a 20% higher average milk production. The increase in milking frequency and milk production for 3WG also resulted in a higher level of utilisation of the milking units during the day.
Results presented here are encouraging and support the message that farmers installing AMS should try to allow for capability to incorporate three way grazing due to the additional flexibility that it provides with managing extremely long (and short) milking intervals.
Additional keywords: Milking interval, feed allocation, automatic milking system, pasture-based.
Introduction
With the introduction of automatic milking systems (AMS) in the early 1990’s, as a solution for labour constraints in small family farms, the possibility of milking cows more frequently and consequently obtaining higher yields, became attractive to many people involved with this new farming concept. In 2001 they were introduced in pasture-based systems, first with a commercial
installation in Victoria and the establishment of the Greenfield Project in New Zealand (Jago et al 2002) and then in 2006 with the FutureDairy Project in Australia (Garcia et al 2007).
Under pasture-based conditions, target milking frequency and total daily milk yield/cow, are usually lower than in indoor loose housing systems (García and Fulkerson

Page | 83
2005). In addition cows tend to have more cyclical routines with reduced visitation to the dairy in early hours of the morning (2 – 6am). These two factors together result in reduced daily average milk harvested/milking station, and therefore economic viability of the systems. Low utilisation levels can indicate the potential to increase the number of cows in the system or the milking frequency of them, with the aim of maximising litres harvested per AMS (Davis et al 2005).
Previous studies under pasture-based conditions have addressed the effect of supplementary feeding (Jago et al 2007), water (Jago et al), minimum milking interval (Jago et al 2004), stage of lactation (Jago et al 2006a), and premilking teat preparation (Davis et al 2008) on the general performance and throughput of AMS. Some initial reports (Jago et al 2004; Jago et al 2006b; Jago et al 2007) have depicted the potential importance and/or the effect of a higher number of incentives put in place per day. Yet to date no research has been published from pasture-based systems regarding the actual impact of number of feed allocations, on animal and system performance.
It was hypothesised that more frequent allocations of feed had the potential to increase cow traffic around the system. This would in turn impact positively on milking frequency, by reducing milking interval, especially in cows in early lactation which are in a higher energy demand and more willing to move around the system, in comparison with late lactation cows (García and Fulkerson 2005; Jago et al 2006a). However, it is important that this increase in milking frequency translates into a higher milk yield (per cow and per milking unit), otherwise general efficiency would decline.
Materials and methods
A pilot trial was conducted between November 23rd and December 8th 2010, at the FutureDairy Automatic Milking Dairy (Elizabeth Macarthur Agricultural Institute, Camden, Australia) to investigate the impact of two different grazing treatments (2 [2WG] vs. 3 [3WG] allocations of feed per 24h period).
The trial herd consisted of 158 cows (mix of Holstein and Illawara), 28% primiparous and 72% multiparous. At the commencement of the trial average days in milk was 135 ± 8 days, average milking frequency was 1.49 ± 0.03 milkings/day and average 7-day milk production was 20.5 ± 0.6 kg/c.d (Mean ± SEM). Cows were milked through 2 DeLaval VMS milking units, and all records were collected electronically using VMS Client (the support software).
Cows were offered their daily feed requirements in equal portions according to the established treatments. Cows were allocated to achieve target intakes of 18 kg DM/cow.day pasture and 4 kg/cow.day concentrates in the milking station (Dairy Ellite Pellet – Weston Mills. In the 2WG treatment cows were allocated 9 kg DM/cow in each break whilst during the 3WG treatment the 18 kg DM was split equally into the three pasture allocations (6 kg DM/cow in each break).
Grazing management plans were developed weekly, using measured pasture covers as per normal farm practice. Individual breaks were temporarily fenced and remeasured within 24hs of cows going into a paddock and coming out the paddock. In order to accurately allocate the amount of pasture cows should require in each break, pre grazing cover was assessed using the CDAX Pasture Meter, with calibration equations developed in the Camden, NSW area.

Page | 84
Cows “actively accessed” each pasture break for a consistent period of time within treatment (active access hours = 24 hours/number of allocations per 24 h period). In the 2WG, cows had an active access time of 12 h, whereas in the 3WG this was reduced to 8 h. After this, the following break became available. In addition to this time, cows then had a period of time in which they could voluntarily exit the break until they were fetched. Fetching was conducted 2 h prior to the subsequent allocation closing for access. This was set up in this way, aiming to have cows move across all the daily paddocks and ideally not “skip” some allocations. Fetched cows were encouraged from the paddock to the dairy.
As cows trafficked around the farm system they arrived at automatic drafting gates and were either granted milking permission and drafted to the dairy, or denied milking permission and drafted to grazing based on the criteria in Table 1.
Table 1. Milking permission criteria
Days in milk < 70
First lactation animals
> 240 min since last milking
Expected yield > 4 kg
Older animals
> 240 min since last milking
Expected yield > 6.5 kg
Days in milk > 70
First lactation animals
> 480 min since last milking
Expected yield > 4.5 kg
Older animals
> 480 min since last milking
Expected yield > 6.5 kg
Cows were granted milking permission after an incomplete milking session, but only up to 2 consecutive times.
Treatments, sorting, dry offs and calving occurred throughout this experimental period, and were treated as per normal routine, in order not to affect the treatment nor the outcome of the trial
Statistical Analysis
All data was analysed under a linear mix model methodology using residual maximum likelihood (REML) as in GenStat 13th. Edition. Significant effects were declared at p < 0.05.
The model for cow variates included treatment (2WG vs 3WG) and stage of lactation (Early <100 days in milk, Mid 101 – 200 days in milk and Late > 201 days in milk) as fixed effects, and cow as random effect. The model used to analyse system variates included treatment and time of day as fixed effects, and milking unit as random effects. In both models, day was analysed as a fixed effect, but removed due to the fact that it was not significant.
Results and discussion
The impact of treatment on milking interval is shown in Figure 1. The 3WG treatment significantly reduced the frequency of milkings with intervals above 18 hours (58.5% and 11.5% of milkings for 2WG and 3WG respectively).
Figure 1. Distribution of milking intervals resulting from 2-way (2WG) and 3-way (3WG) grazing treatments
0.00%
5.00%
10.00%
15.00%
20.00%
25.00%
30.00%
<4 4-6
6-8
8-10
10-1
2
12-1
4
14-1
6
16-1
8
18-2
0
20-2
2
22-2
4
>24
Prop
orti
on o
f m
ilkin
gs (
%)
Milking Interval (Hours)
2WG
3WG

Page | 85
The reduction in milking interval for cows in 3WG was greater in late than in early lactation (Figure 2), which resulted in an interaction (p<0.05) .
Figure 2. Effect of treatment on milking interval for each stage of lactation category (error bars = average standard error of the difference)
In line with the reduced milking interval of the 3WG treatment, the milking frequency was increased as observed in Figure 3, with a similar level for all stages of lactation under 3WG.
Figure 3. Effect of treatment on milking frequency for each stage of lactation category
The lower milking interval of the 3WG treatment was associated with a reduced milk yield per milking (kg), but an increase in milk yield per day (kg) as observed in Figures 4 and 5 respectively. This also resulted in a lower milking duration (time in crate) for 3WG than 2WG (data not shown).
Figure 4. Effect of treatment on milk yield per milking (Kgs) for each stage of lactation category (error bars = average standard error of the difference)
Figure 5. Effect of treatment on milk yield per day (Kgs) (error bars = average standard error of the difference)
Cows managed with the 3WG treatment reduced their milking interval, and increased their milking frequency. The 3WG also reduced the variability amongst cows in different stages of lactation. These effects resulted in more milk sessions per hour, and a more evenly distributed cow flow throughout the day (Figure 6). The low throughput levels at 02:00 and 14:00 were due to automated system washes being conducted during these hours. Interestingly and contrary to general observations the throughput through the early hours of the mornings was not significantly reduced in either treatment. However, a reduction in cow throughput can be seen in the 2WG treatment during the hours 14:00-17:00. The fresh pasture breaks in the 2WG treatment were made available at 08:00 and 20:00 coinciding with the peak throughput rates. The 3WG pasture
0:00
6:00
12:00
18:00
24:00
Early Mid Late
Ave
rage
Milk
ing
Inte
rval
(hh:
mm
)
Stage of Lactation
2WG
3WG
0.00
0.50
1.00
1.50
2.00
Early Mid Late
Ave
rage
Milk
ing
Freq
uenc
y
Stage of Lactation
2WG
3WG
0
2
4
6
8
10
12
14
16
18
Early Mid Late
Yiel
d pe
r M
ilkin
g (K
gs)
Stage of Lactation
2WG
3WG
0
5
10
15
20
25
2WG 3WG
Dai
ly Y
ield
(Kgs
/cow
/day
)
Treatment

Page | 86
allocations became available at 00:00, 08:00 and 16:00 hours.
Figure 6. Effect of treatment on distribution of milkings per hour
The increased number of average daily milkings conducted per milking station in the 3WG treatment resulted in a significant increase in the machine utilisation rate (Figure 7). The combined effect of this with the additional milk harvested per machine resulted in a large increase in operational efficiency with the 3WG treatment.
Figure 7. Effect of treatment on system utilisation (%) (error bars = average standard error of the difference).
Conclusions
Our results would indicate that in a system in which cows were offered more allocations of feed per day, they moved around the system more, creating a 42% increase in milking frequency. This in turn
reduced the frequency of extended milking intervals, producing a 29% lower average milking interval, which resulted in a 20% increase in milk production. The impacts of SOL on milking frequency and milking intervals with 2WG, dissipated with the 3WG treatment. This makes the management put in place particularly attractive, because it would not only increase the milking frequency and milk yield in early lactation cows, but also in late lactation, in which we could observe a clear decline of visiting to the dairy. Overall the 3WG treatment was associated with a higher utilisation of the system, with the consequent potential benefit on profitability.
Results from this pilot study are encouraging and support the message that 3WG is beneficial for pasture-based AMS. Thus it is important that farmers installing this new technology should include capability to incorporate three way grazing in their systems.
Nevertheless, the applicability of these results are limited due to the relatively low performance levels of the 2WG treatment , as we know that higher milking frequencies can be achieved with 2WG. Whether or not the same proportional impact of 3WG would have been observed had the initial milking frequency of the 2WG been more typical (i.e. >1.5-1.7 times/day), remains to be proved. Future research should focus on evaluating 2WG vs 3WG under more typical milking frequencies.
The authors would like to acknowledge the support of all sponsors of the FutureDairy project, particularly Dairy Australia, Industry and Investment NSW, University of Sydney, and DeLaval.
References
Davis K.L., Fulkerson W.J., Garcia S.C., Dickeson D., Barchia I.M. (2008). J. of D. Sc., 91, 2604.
0
1
2
3
4
5
6
7
0 2 4 6 8 10 12 14 16 18 20 22
Milk
ings
per
hou
r
Hours of the Day
2WG
3WG
0%
25%
50%
75%
100%
2WG 3WG
Syst
em U
tilis
atio
n (%
)
Treatment

Page | 87
Davis K.L., Jago J.G., Wieliczko R., Copeman P.J.A., Bright K., Woolford M.W. (2005), Proc. of the N. Z. Soc. of An. Prod., 65, 271.
Garcia S.C., Fulkerson W.J., Nettle R., Kenny S., Armstrong D. (2007). Aust. J. of Exp. Agr., 47, 1025.
García S.C., Fulkerson W.J. (2005). Aust. J. of Exp. Agr., 45, 1041.
Jago J., Jackson A., Woolford M. (2003), N. Z. Soc. of An. Prod.,63, 120.
Jago J., Copeman P., Bright K., McLean D., Ohnstad I., Woolford M. (2002). Proc. of the N. Z. Soc. of An. Prod., 62, 115.
Jago J., Bright K., Copeman P., Davis K., Jackson A., Ohnstad I., Wieliczko R., Woolford M.J. (2004), Proc. of the N. Z. Soc. of An. Prod., 64, 241.
Jago J.G., Davis K.L., Woolford M.W. (2006), Proc. of the N. Z. Soc. of An. Prod., 66, 258.
Jago J.G., Davis K.L., Newman M., Woolford M.W. (2006), Proc. of the N. Z. Soc. of An. Prod., 66, 263.
Jago J.G., Davis K.L., Copeman P.J., Ohnstad I., Woolford M.M. (2007). J. of D. Res., 74, 492.
Page | 88
INVESTIGATION INTO THE EFFECT OF DIFFERENT BAIL ACTIVATION SEQUENCES WITH A ROBOTIC ROTARY
RENE KOLBACH R.Kolbach, K. Kerrisk and S. Garcia The University of Sydney, Camden, NSW, 2570 Corresponding Email: [email protected]
Abstract
During 2009 and early 2010 FutureDairy has been testing a prototype, 16 bail, robotic rotary (Delaval Automatic Milking Rotary, AMR™). This Robotic Rotary (RR) is capable of carrying out in the order of 50 cow milkings per hour (system with 2 robots). It is recognized that challenges arise when pushing the upper limit of the capacity and when the system is operated at a low utilisation level. At this stage, the RR does not have any auto cleaning functions. A small herd increases the possibility that bails that have harvested milk since the previous wash then remain idle for a period of time resulting in an unsustainable increase in bacteria growth within the cups and milk hoses. A potential solution to the challenge is to activate only a set number of bails after a system wash and have additional bails activated at set times until the next system wash. The effect of different bail activation sequences on the throughput capacity and animal behaviour is studied by activating 50% of the bails after a system wash, in 4 different sequences, with and without a feed reward on the platform. There was no difference observed on the cow trafficking with the different bail configurations but the teaser feed did create a significant impact. The bail activation sequence did impact on the system level milk harvesting efficiency with consecutive bail activation resulting in more robot operations being conducted simultaneously and more milk harvested per minute of operation time.
Keywords: Automatic Milking, Automatic Milking Rotary (AMR™), Robotic Rotary (RR), bail activation sequence
Introduction
In 1992 the first Automatic Milking System (AMS) was implemented in The Netherlands. The first systems were installed on family farms, with 50-150 dairy cows as a response to the high labour cost (Svennersten-Sjaunja and Pettersson 2008). At the end of 2003, worldwide some 2,200 commercial farms were using one or more AMS to milk their cows (de Koning, C.J.A.M. and Rodenburg 2004). Currently, there are approximately 8,000 farms worldwide milking automatically (de Koning, C.J.A.M
2010). This shows the rapid increase in the number of farms with AMS. During 2009 and 2010 there were a number of new AMS farms commissioned in Australia with installations occurring in Queensland, Victoria, South Australia and Tasmania leading to a total of 14 AMS farms (Kerrisk 2010).
Whilst AMS was initially designed for small family farms, with continuous technological advancement and increased management skills of AMS, larger farms with more than 500 cows are now adopting the system

Page | 89
(Svennersten-Sjaunja and Pettersson 2008). It is known that a greater investment is needed when installing AMS on farm (Bijl, Kooistra and Hogeveen 2007; Andre et al. 2010). From the economic efficiency point of view, optimising the milk production per cow and per AMS unit would make the system more viable (Davis et al. 2008; Andre et al. 2010).
During 2009 and 2010, a prototype Robotic Rotary (RR; DeLaval Automatic Milking Rotary – AMR™, Tumba, Sweden) was installed, developed and tested at the Elizabeth MacArthur Agricultural Institute (EMAI, Camden NSW). The RR is expected to be capable of carrying out in the order of 50 cow milkings per hour with the installation of two robots (one teat preparation robot, TPM teat preparation module, and one teat cup attachment robot, ACA automatic cup attacher). With commercial installations the option for even higher throughput, in the order of 90 cow milkings per hour will also exist with four robots in use (two TPM’s and two ACA’s). Extrapolating the expected potential throughput rates to a potential milking period of 18 hours per day (allowing for some idle time and system washing), it is anticipated that up to 450 or 800 cows could be milked twice daily (with either two or four robots). It is anticipated that the RR will be priced comparably with conventional milk harvesting equipment which should make it more economically viable for herds of cows exceeding about 400 cows.
It is recognized that challenges arise when pushing the upper limit of capacity of the RR and when the system is operated at a low utilisation level (particularly likely prior to peak in a seasonal calving system). At this stage, the RR does not have any auto cleaning functions. This has implications for bails that have been used for milking and have been idle for a period of time – these deactivate automatically to minimise negative impacts on bulk milk quality. A potential solution to the challenge is to activate only a set number of bails after a
system wash and have additional bails activated at set times so the system can keep operating until the next system wash. The potential effect of different bail activation sequences on the throughput capacity and animal behaviour was studied and is reported here.
Materials and methods
The trial was conducted over a one month period (21 March to 21 April, 2011) at the EMAI site (Camden, New South Wales). In this period 16 observation sessions were conducted in four separate blocks. During the trial 160 mixed breed (Holstein x Illawarra, Holstein Friesian and Illawarra) dairy cows were managed and voluntary milked with a prototype RR as one herd. The herd consisted of 30% primiparous and 70% multiparous (parity range 1 – 10) animals. All the cows had experience with the RR prior to the start of the trial. The cows had access to a day pasture break from 08:30 – 18:00 and a night pasture break from 18:00 – 8:30. The total feed allocation was 20 kg DM/cow.day, with 6 kg DM/cow.day supplied as partial mixed ration (PMR) on the post-milking feedpad. The PMR consisted of (in kg DM/cow.day) 3.7 kg maize silage, 1.3 kg pelleted concentrate (18% protein), 0.5 kg oaten hay, 0.4 kg lucerne silage and 0.1 kg oaten silage. During the feed period in the trial, the cows were fed an extra approximately 0.3 kg pelleted concentrates in the first two bails of the RR as teaser feed.
To test the impact of the different bail activation sequences in the 16 bail prototype RR on cow behavior and throughput capacity, four different bail activation/deactivation sequence settings were tested. In treatment one eight consecutive bails were activated (50-50). Treatment two had two sets of four consecutive active bails and four disabled bails (25-25). The third treatment was set up as every second bail deactivated (1-1) and the fourth treatment had every third and fourth bail deactivated (2-2). All four treatment groups had eight bails active

Page | 90
during the entire 4-hour observation session. Bails remained idle for one hour after a milking were for the purpose of this study not disabled. This decision was made so not to impact on the bail activation sequence during the observation period.
To determine the impact of the use of teaser feed (pelleted concentrates available to cows on entry of the RR) on cow entry motivation levels, a period without teaser feed has been tested in combination with the four different treatments. A 5-day adjustment period was implemented when the teaser feed was turned off prior to starting observations and a two day adjustment period was given when feed was reoffered after the non-feeding treatment. Each treatment was randomly selected per block and was repeated and observed twice, with and without teaser feed. In total 16 observation sessions were conducted starting in the morning after a system wash at approximately 07:00.
During the visual observation ‘idle time’ was recorded manually. Idle time is defined as any time that occurred when the system was expected/capable of conducting a certain action (e.g. teat cleaning/attaching or platform rotation) but that action was delayed as a result of cow traffic, milking speed or bail activation sequence. All idle time caused a reduction in efficiency and a decline in the system utilization or throughput capacity. For example, if a cow does not traffic onto the platform whilst the robots are conducting their tasks the cow did not use the ‘buffer time’. The system then waited for a cow to enter the platform for up to 90 seconds before a Step Time Out occurred and was recorded (STO; the maximum time the system allows a cow to enter the system before a rotation is made was set at 90 seconds, this ensures that cows standing on the platform with a completed milking will continue to be rotated so that they can exit the platform). A cow hesitating to walk onto the platform had the potential to stand in the entry gate for an extended period of time and hold up
the system, this was recorded as cow in gate. A cow hesitating but not standing in the gate, and walking on the platform prior to a STO occurring was recorded as a cow delay. If the entry gates do not allow a cow to enter the system in the buffer period (period when teats are cleaned or cups are attached) then it will result in reduced throughput potential with a technical cause (rather than being caused by cow traffic) and was termed no buffer. With any bail sequence settings it is possible that a cow is still being milked when she reaches the exit point of the platform. Platform rotations were prevented until the cow was milked completely. This prevented system operations and was termed cows still being milked.
Time observations (time needed for the robots to finish a task per cow) of the TPM and ACA as well as production and milking time per cows was recorded electronically in the VMS Client management program. A key outcome of this data was the harvesting rate per minute (L/min) calculated as the total yield per observation period, divided by the real milking time, (real milking time = the total time of the 4 hour observation period minus the idle time).
Descriptive data analyses presented in this paper were carried out using Microsoft Excel 2007.
Results
The results of the study showed that the sequence of bails enabled/disabled with the RR did not significantly impact on cows’ willingness to traffic onto the platform (Table 1). In the 1-1 treatment there was a higher incidence of STO’s, which resulted on average in a greater STO time per milked cow of 10.5 seconds. However the cow delay time (cow entering the system without STO occurs) was on average 2 seconds per milking shorter. It is important to note that, when analysing only the data of the teaser feed period, the 1-1

Page | 91
treatment did not vary from the other three bail activation sequence treatments.
Table 1: Percentage of available bails per treatment utilized by cows for milking with or without teaser feed
Treatment No feed (%)
Feed (%) Total (%)
50-50 60.0 87.8 74.4 25-25 59.0 94.3 76.5 2-2 64.6 89.2 76.0 1-1 53.7 89.0 70.5
When the data was explored for the period with and without teaser feed, there was a consistent impact on cow traffic and machine utilisation (Figure 1 and Table 1). When teaser feed was available 20% more bails where used across the four different treatments compared to the period in which the cows did not receive any teaser feed. Figure 1 also shows that the percentage of time used for a STO decreased from 20.5% to 4.8% with the use of teaser feed.
The efficiency of the robots is reported in this paper in relation to harvesting rate per minutes (Litres per minute operational time; L/min; Table 2). The results of the combined data set shows that, when taking all the non-system related time losses into account, the 50-50 treatment resulted in the highest harvesting rate at 3.93 L/min. The least efficient was the 1-1 treatment at 3.25 L/min. Extrapolating the data to an 18 hour day (assuming a generous 6 hours per day for system washes and idle time), the 50-50 treatment has the potential to result in an additional 585L harvested (compared to the 1-1 treatment). A similar trend was evident during the feed period but not in the no feed period. The 2-2 treatment efficiency decreased slightly when teaser feed was available.
Figure 1: Percentage of utilized available bails (solid bars) and time used for STO (step time out) per treatment (dashed line)
Table 2: Systems efficiency in harvested milk per utilized minute (L/min; total time minus non system performance related time loss, e.g. STO) with potential harvesting loss on a 18hr day between brackets (with used bail sequences)
Treatment No feed Feed Total
50-50 3.47
(-190)
4.28
(0)
3.93
(0)
25-25 3.60
(-95)
4.00
(-261)
3.83
(-77)
2-2 3.73
(0)
3.66
(-633)
3.69
(-208)
1-1 3.09
(-481)
3.37
(-918)
3.25
(-585)
Discussion
It first needs to be concluded that the efficiency data shown in this study are based at a prototype 16 bail RR. Due to ongoing upgrades of the system towards a commercial product, it is anticipated that the efficiency of the technology will improve. This means that the shown harvesting rates in this study may become
0
5
10
15
20
25
0
20
40
60
80
100
No feed Feed
% ti
me
used
for S
TO
% o
f util
ized
bai
ls
% bail fill % STO time

Page | 92
inaccurate and might possibly be higher as improvements are recognised. The harvesting rates are calculated with only 50% of the bails activated and can as a result not be interpreted as the maximum capacity of the system.
The data presented in this study did not show a big impact of bail activating/deactivating sequence on the likelihood of cows entering an active bail. However cows tended to wait longer with entering the system with the 1-1 treatment compared to the other treatments with an increased incidence of STO as a result. It is possible that the intermittent bail availability impacted on the predictability of access for the cows. It is not known what the impact of feed or no feed would be for inexperienced cows adapting to the system. Nor can the authors be sure of the impact of no feed on cows that have never received feed on the platform i.e. if the expectation of feed has never been created. The impact of providing cows a small amount of pelleted concentrate upon entry of the system as teaser feed on cow entry motivation levels was significant. A early study already suggested that feeding in AMS is likely to be necessary to motivate cows to visit an AMS (Prescott, Mottram and Webster 1998). This research with 12 cows volunteering around an AMS showed that food was significantly more rewarding for a cow then milking itself. A more recent study of Melin et al. (2006) with 24 cows concluded that both milking and feeding acted as rewards for cows encouraging them to present themselves to the AMS, however the motivation to access feed had a higher priority than the motivation of being milked. As the results presented above show, the impact of no feed available in this study was dramatic. It could be advised that it is important to make sure teaser feed is available to the cows at all times, to prevent any negative impact on milking frequency and potentially production. This is particularly specific to cows that have an expectation to receive feed on the platform if this reward is removed from the system.
It was found that whilst the cow traffic was largely unaffected, the system efficiency was impacted by the bail activation/deactivation sequence. The RR is the most efficient when consecutive bails are active. This is due to the fact that, when at least two cows are lined up behind each other, the two robots (TPM and ACA) can operate simultaneously, which reduces the handling time. With the increased cow flow achieved with teaser feed it was evident that the efficiency of treatment 50-50 was the highest, followed by treatment 25-25. Logically a smaller number of STO in these treatments resulted in a larger amount of actions carried out simultaneously, which result in a higher efficiency. The effect of better cow flow on treatment 1-1 is smaller because with this bail configuration setting ACA and TPM are carrying out actions after, each other, rather than simultaneously. Surprisingly without teaser feed, treatment 2-2 had the highest harvesting rate of all four treatments. This treatment decreased in efficiency with the use of teaser feed. This was somewhat unexpected because the milk yields per milking were similar across the treatments. But it was found that the average time used per milking by the ACA for cup attachment was up to 20 seconds faster than the slowest average treatment, which could explain the higher efficiency of this treatment.
The low harvesting rate of treatment 1-1 can be explained because none of the robot actions are carried out simultaneously. Every milked cow uses time to being pre-milked and being attached with cups, before the following cow is pre-milked and attached. The other treatments however combine TPM and ACA actions and be become more efficient. That explains why the 50-50 treatment with a good cow flow in the teaser feed period, with many cows entering consecutive bails, resulted in the highest level of efficiency. More consecutive bails active means more robot actions are carried out simultaneously and more milk is harvested per minute of operation time.
Page | 93
This work was carried out within the FutureDairy program. We wish to acknowledge the investors Dairy Australia, DeLaval, Industry and Investment NSW and The University of Sydney. We would also like to thank Mikael Karttunen for his technical support of the AMR™ and the FutureDairy team for their assistance.
References
Andre, G, Berentsen, PBM, Engel, B, de Koning, C & Lansink, A (2010), J. Dairy Sci., 93, 942.
Bijl, R, Kooistra, SR & Hogeveen, H (2007), J. Dairy Sci., 90, 239.
Davis, KL, Fulkerson, WJ, Garcia, SC, Dickeson, D & Barchia, IM (2008), J. Dairy Sci., 91, 2604.
de Koning, CJAM 2010, 52.
de Koning, CJAM & Rodenburg, J 2004, Wageningen Academic Publishers, 27.
Kerrisk, KL 2010, Robotics still going strong, viewed February 18 2011
Melin, M, Hermans, GGN, Pettersson, G & Wiktorsson, H (2006), 96, 201.
Prescott, NB, Mottram, TT & Webster, AJF (1998), Appl. Anim. Behav. Sci., 57, 23.
Svennersten-Sjaunja, KM & Pettersson, G (2008), J. Anim Sci., 86, 37.

Page | 94
MANAGE LAMENESS FOR INCREASED PROFITS
KARL BURGI Dairyland Hoof Care Institute Inc
Throughout the world, lameness in dairy cows has a huge impact on a dairy farm’s bottom line. It is a known fact that, depending on farming style and management, up to 60% of cows are affected by lameness annually.
As the Australian dairy production is transitioning from a grazing to a semi-confinement or confinement system, lameness prevention presents a new set of challenges. Drs. Malmo and Chesterton estimate lameness in Oceana’s grazing herds’ averages at roughly 8% per year. Much of the lameness (66%) in grazing herds today is due to trauma, with primarily white line lesions (38%) and toe ulcers (28%) according to Chesterton.
Confinement herds also have a high occurrence of lameness. An investigation (M.I.Endres 2006) into the lameness incidence in 50 confinement dairies in the state of Minnesota, U.S.A. found the average lameness to be 24.5%. In confinement, sole ulcers and white line lesions are the dominant claw horn lesions. Additionally, many cows are infected with digital dermatitis lesions. When we look at the economic loss that occurs from lameness it can range from merely $50 per incidence to over $500 with an average loss per case of about $257. An additional factor is temperature. Research conducted by Dr. Nigel Cook confirms that claw horn lesions are more prevalent following hot weather. Graph 1 shows the association between claw horn lesions and temperature.
Figure 2. Association between rate of Claw Horn Lesions (All) and Temperature (°F)
Copyright © 2008, Dairyland Hoof Care Institute Inc. All rights reserved.
0.00 0.05 0.10 0.15 0.20 0.25 0.30 0.35 0.40 0.45
Jan '02 Mar '02 May '02 Jul '02 Sep '02 Nov '02 Jan '03 Mar '03 May '03 Jul '03 Sep '03 Nov '03 Jan '04 Mar '04 May '04 Jul '04 Sep '04 Nov '04 Jan '05 Mar '05 May '05 Jul '05 Sep '05 Nov '05 Month/Year
Proportion of Feet Trimmed
0.0 10.0 20.0 30.0 40.0 50.0 60.0 70.0 80.0
Mean Temperature ( o F)
% All Claw Mean Temp in degrees F
Association between rate of Claw Horn Lesions (All) and Temperature ( o F )
Cook 2006

Page | 95
Dr. Cook found cows would stand up to 3 hours longer per day during hot weather. His work showed the extra standing resulted in more claw horn lesions.
In warmer climates, the significance of bringing cattle together for prolonged periods cannot be overlooked. This is a critical control point for the management of heat stress.
Cattle that over heat during milking will experience an elevated body temperature for a number of hours. These cows prefer to stand in order to dissipate the heat through thermal panting, rather than lie down. Provision of adequate shade and space in the yard (Target 20 sq ft [1.8 sq m] per Holstein cow) are an essential part. The use of recirculation fans (20,000 CFM per cow) to improve airflow is critical. These measures should be coupled with water soaking in the hottest climates.
Dairy cows have a strong behavioral need to rest. According to Grant 2006, cows require 12 to 14hours per day of lying time. Reduced resting time decreases feed consumption and increases claw horn lesions.
As dairy environments and management practices change, much more attention must be paid to a high producing dairy cow’s daily time budget in order to reduce lameness. According to research and observations at the Miner Agriculture Research Institute such a time budget would look as follows:
Figure 2. Examples of Time Budget for Freestall and Grazing cows
Page | 96
Changes in management of grazing systems will impact the time budget of cows and their hoof health. In larger herds, where cattle must spend longer in transit to and from the milking center, there will be reduced time available for grazing and rest. As herd sizes increase, the whole herd is often still milked as one group and standing times may exceed 3 h per milking in the milking shed. Some consideration to splitting groups for milking must be given in order to reduce the impact of this forced standing on the cow’s time budget.
Many farms are changing form a strictly grazing production systems, toward a modified grazing system. Pasture rations are supplemented with a TMR that includes grains and harvested forages. This ration is presented to the cows in feedlot type systems. While consuming this ration, cows are forced to stand for extended hours. With no place to lie down around the feed pads forced standing will result in higher lameness.
Animal welfare and consumer attitudes call for an ethical obligation to accommodate natural behavior of dairy cows with management strategies. Change is absolutely vital to correct management practices and reduce lameness. This requires a commitment from dairy herd owners along with the implementation of a hoof health management plan, which is composed of the following points.
1. Give every cow the opportunity to comfortably rest or lie down for 8 to 14 hours per day depending on the management system.
2. Cows must be observed daily for signs of lameness and immediate attention should be given through functional and therapeutic hoof trimming. It is essential that blocks be used as an aid in healing claw horn lesions. Neglected lameness will lead to permanent damage to the claws making claw horn lesions reoccur again.
3. Cows provided with a proper, functional trim before stresses such as calving, ration changes, and hot weather are far less likely to become lame following these periods. Functional hoof trimming adjusts claw length, leading to proper claw balance and correcting the toe angle while leaving enough horn to protect the vulnerable corium. Functional trimming should be learned through a qualified instructor.
4. Locomotion scores all cows bi-weekly or monthly to assess overall hoof health.
5. Assess, and functionally trim if needed, every 1st calf heifer and every cow prior to parturition to ensure the best possible hoof condition the day of calving.
6. If heifers are raised on a yielding surface (pasture or dry-lots), introduce them to concrete, a non-yielding surface, 6 weeks to 4 weeks before parturition. This allows the lamina to adjust to the concussion from this non-yielding surface.
7. Minimize time 1st calf heifers stand in milking sheds for the first 3 to 4 weeks following calving to allow them to rest more hours per day.
Page | 97
8. Introduce heifers at 7-months pregnant to dry cows, to allow them socially adjust. Waiting longer may adversely affect heifers’ hoof health.
9. Practice excellent herdsmanship by moving cows calmly and quietly. Minimize the use of backing gates (crowd gates) and dogs.
10. Maintain all walking surfaces including tracks, milking, and feeding areas for smoothness, proper traction, and cleanliness.
11. Manage nutrition so cows have access to a consistent diet every hour of the day, 365 days a year.
12. Put in place a heat abatement system to keep cows cool during hot periods.
13. Design and construct dairy facilities that are optimal for high-producing cows. Putting cows first improves longevity, reduces lameness, and increases yields.
14. In case of infectious diseases, a footbath should be used for prevention and treatment.
Implementing an aggressive lameness-prevention program is essential to maintain healthy hooves. Producers, managers, and other dairy professionals must work closely together to identify problems and determine solutions that will improve the productivity of today’s dairy cows. This team approach yields results and keeps cows on solid footing.

Page | 98
REDUCING NITROGEN LOSSES ON DAIRYFARMS IN SOUTH-WESTERN VICTORIA
TIM HUGGINS T. J. HugginsAC, H.C. SuterA, K.B. KellyB & R.J. EckardAB
AUniversity of Melbourne, Parkville, Victoria BDepartment of Primary Industries, Tatura, Victoria CCorresponding author. Email: [email protected]
Abstract
The nitrogen requirement for perennial ryegrass is reasonably well understood. Nutrient budgeting shows a substantial proportion of the available nitrogen can potentially be lost either as nitrous oxide gas, other oxides of nitrogen, volatolised as ammonia, or leached out of the soil in nitrate form. The use of the nitrification inhibitor, dicyandiamide (DCD), is one strategy that could help to reclaim this lost nitrogen, potentially resulting in increased pasture dry matter production. Use of DCD to reduce nitrogen losses has been well researched in New Zealand with excellent results in terms of additional pasture growth (ranging from no response to as high as a 30% increase), mostly in response to a reduction in nitrate leaching. However there hasn’t been any work completed under Australian conditions to see if the responses are the same.This study looked at the use of DCD on 6 commercial dairyfarms in south-western Victoria and the focused on the effect of DCD on dry matter production in urine patches in small plots in spring 2009 and autumn 2010. Results were inconsistent and showed an increase in pasture growth of 0-15% within the urine patch. The additional pasture dry matter was not enough to justify the use of DCD, with DCD costing $180 per hectare for two applications – requiring 420 kg dry matter per hectare (5.7%) additional pasture yield across the entire paddock to break-even.
Key words: Dicyandiamide, nitrogen, pasture production, nitrification inhibitor
Introduction
The major sources of nitrogen (N) on a dairy farm include nitrogen fertilizers, animal dung and urine, and nitrogen fixation. Two of the biggest forms of nitrogen loss include leaching and gaseous losses - including nitrous oxide (a potent greenhouse gas). Given that nitrogen is frequently the most limiting fertilizer nutrient for ryegrass dominant pastures (Whitehead, 1995), it is important to minimize the losses in order to maximize
pasture production and overall profitability of the farm enterprise.
The Farm Monitor Project Report (DPIV, 2010) noted that nitrogen fertilizer use was 106 kg per hectare on average for south-western Victorian dairy farms in 2009/10, with a range from 25 kg to 203 kg N per hectare. In addition to the applied nitrogen, animal urine with a nitrogen concentration of approximately 1000 kg N/ha, may have contributed as much as 200 kg per hectare with a typical grazing intensity (Snow et al, 2009). In a 3

Page | 99
year pasture trial, Eckard et al (2007) found that without nitrogen fertilizer application, there was still a nitrogen surplus, even after nitrogen losses and exports (in meat and milk) had been accounted for. This suggests that depending on the targeted pasture dry matter yield for an individual farm, the grazing intensity, and the application rate of nitrogen fertilizer, there can potentially be a moderate excess of nitrogen in the soil – and therefore a large potential for nitrate leaching and gaseous nitrogen loss. Aside from environmental concerns, this loss also represents a reduction in nitrogen available for uptake by perennial pasture plants, thereby potentially limiting growth.
So what can be done about it? The nitrification inhibitor, dicyandiamide (DCD), is a nitrogen-based compound that acts on soil microbes that are involved in the nitrification process for up to 3 months after application (Amberger, 1989). Nitrification is the name of the process that sees the conversion of ammonium-nitrogen to nitrate-nitrogen in the soil. Nitrate-nitrogen is more readily leached or lost as nitrous oxide or nitrogen gas, than ammonium-nitrogen; however both forms can be taken up by the plant. Therefore it is highly desirable to prevent or reduce the amount of nitrification, particularly during the main drainage period (saturated soil) in the pasture growing season – the time of year most prone to leaching and gaseous losses.
The aim of this project was to determine if dicyandiamide (DCD), a nitrification inhibitor, could increase pasture production on a dairy farm in south-western Victoria by saving nitrogen that would otherwise have been lost.
Materials and methods
Six experimental sites (Allansford, Barongarook, Simpson, Terang, Timboon, and Weerite) were established on
commercial dairy farms across a range of soil types and rainfall distribution in South-western Victoria. All sites had perennial ryegrass (Lolium perenne) dominant pastures and used varying amounts of nitrogen fertiliser.
A small-plot experiment was set-up where synthetic cow urine (equivalent to 1000 kg N/ha) was applied both with and without DCD either at the start of the trial or one month after the trial started. Dicyandiamide was applied at 10 kg of active ingredient per hectare. The small-plots were fenced off from grazing and pasture dry matter was harvested using a rotary mower approximately every 28 days or 2.5-3 leaf stage. The treatments were applied in late winter 2009 and then again in autumn 2010 but on adjacent pasture areas (not the same area for each experiment). Within an experiment, time 1 was when the experiment commenced and time 2 was about 28 days after time 1. Pasture DM harvests continued until there was no longer any difference between treatments.
The treatments were as follows:
T1. Nil urine applied (nnn)
T2. Nil urine applied + DCD applied at time1 (nDn)
T3. Urine applied time 2 (nnU)
T4. DCD applied time 1, Urine applied time 2 (nDU)
T5. Urine applied time 1 (Unn)
T6. Urine + DCD applied time 1 (UDn)
Results
Experiment 1 – Late Winter 2009
Four of the six sites showed an increase in pasture dry matter (DM) production from the application of urine, ranging from 30% to 160% increases in DM production (Figure 1). The addition of DCD to the

Page | 100
control (treatment 2) showed no significant increase compared to treatment 1. However, there were 3 sites that showed a significant increase in pasture dry matter in response to the application of DCD on the urine treatments. These responses were mostly seen when the urine was applied at the beginning of the experiment at the same time as the DCD application. It is important to remember that these increases are within the urine patch and then only 10-30% of a paddock over a 12 month period. Under rotational grazing systems an average stocking rate of 4 cows/ha, urine patches have been shown to cover about 2% of the total area at each grazing (Moir et al, 2011)
Experiment 2 - Autumn 2010
The data shows inconsistent performances from the six experimental sites of 0-15% increase in pasture dry matter. One of the six experimental sites did show a significant increase from DCD when comparing the two treatments without urine. This farm applied 266 kg N per hectare in this year so it is possible the DCD went to work on the nitrogen coming from the fertiliser, that was in the soil, or that was fixed, or mineralised. There were again three out of the six experimental sites that showed a significant increase in response to the application of DCD, but only one of these was in the three that showed a significant result in the first season.
Discussion
The responses in pasture production achieved in this experiment are lower than experienced in the New Zealand work, possibly due to the timing of application, the lack of a follow-up application within 3 months (the second treatment was applied to an adjacent site,
not the original site), soil moisture levels (some of the sites were waterlogged for extended periods of time in both treatments), and farm fertilizer history and use.
The literature suggests pasture production improvements of anywhere from 0-35% with 2 applications of DCD per year (deKlein and Eckard, 2008). A 20% increase in production from within the urine patches would translate into 560 kg DM for the average south-western Victorian dairyfarm (across the whole paddock). Without wastage this 560 kg DM (7.6% increase across the whole paddock) would translate into an additional 48 kg milk solids (MS) per hectare per year. At $4.50 per kg MS, this is worth $216 per hectare, a net gain over the cost of around $50 per hectare. If we also consider some additional production costs that might be associated with harvesting the extra pasture (eg. Higher stocking rate or extra labour costs) or increased milking costs (electricity, labour etc.) this return may be smaller.
The break-even point on the cost of DCD is an additional 420 kg DM per hectare, which represents an increase of 5.7% across the whole paddock. This assumes that 100% of additional pasture is utilised and that no additional harvesting or milk producing costs are incurred. In reality the nett benefit per kg of milk solids is likely to be around $3 per kg extra MS, rather than the full $4.95 per kg. This increase also needs to be consistent across a range of soil types and rainfall patterns (as represented by the six sites) - and the data do not support this at this stage.
The results from this experiment translate into an additional 180-270 kg DM per hectare. Using the same formula to

Page | 101
Simpson
n n n n D n n n U n D U U n n U D n0
4
8
12
Simpson
n n n n D n n n U n D U U n n U D n
4
8
12
Terang
n n n n D n n n U n D U U n n U D n0
4
8
12
Terang
n n n n D n n n U n D U U n n U D n
4
8
12
Weerite
n n n n D n n n U n D U U n n U D n0
4
8
12
Weerite
n n n n D n n n U n D U U n n U D n
DM
yie
ld (t
DM
ha-
1 )
0
4
8
12
Allansford
n n n n D n n n U n D U U n n U D n0
4
8
12
Allansford
n n n n D n n n U n D U U n n U D n0
4
8
12
Barongarook
n n n n D n n n U n D U U n n U D n0
4
8
12
Barongarook
n n n n D n n n U n D U U n n U D n0
4
8
12
Timboon
n n n n D n n n U n D U U n n U D n0
4
8
12Timboon
n n n n D n n n U n D U U n n U D n0
4
8
12
Figure 1. DM production at the six experimental sites for 2009 (left) and 2010 (right). Vertical bars are l.s.d. (P=0.05). Treatment sequences refer to treatments T1 to T6 as described in methods.

Page | 102
determine the value of the achieved additional pasture dry matter from DCD provides a range of $69-$103 per hectare.
While the added pasture dry matter production isn’t currently adequate to justify the commercial use of DCD in south-western Victoria, further studies are required to test DCD at a whole paddock scale, under grazing conditions with various timings of application, particularly relevant to nitrogen fertilizer applications.
Acknowledgements
This project is additional to the main study on the impact of the nitrification inhibitor DCD on nitrous oxide emissions from urinary deposition at Demo Dairy (Terang), led by Kevin Kelly. It is made possible with the assistance of Graeme Ward and James Hollier, DPI, Victoria. The project is funded by the Department of Agriculture, Fisheries and Forestry’s Climate Change Research Program, Dairy Australia and the University of Melbourne.
References
Amberger A. (1989). Communications in Soil Science and Plant Analysis. 20, 1933.
Department of Primary Industries Victoria. 2010. Farm Monitor Project Report. http://new.dpi.vic.gov.au/agriculture/business--and--trade/dairy-industry-farm-mon
Eckard R. J., Chapman D. F., and White R. E. (2007). Australian Journal of Agricultural Research. 58, 1167.
Moir J. L., Cameron K. C., Di H. J., Fertsak U. (2011) Journal of Agricultural Science.
Snow V. O., Lieffering M., Cullen B. R., Johnson I. R. (2009). Crop and Pasture Science. 60, 691.
Whitehead D. C. (2005). Grassland nitrogen. CAB International: Wallingford, UK.

Page | 103
MONITORING AND MANAGING SPATIAL VARIABILITY IN PASTURES: DEVELOPING ACTIVE OPTICAL SENSORS TO INCREASE NITROGEN USE EFFICIENCY AND GPS TRACKING TO UNDERSTAND LIVESTOCK PASTURE UTILISATION AND NUTRIENT REDISTRIBUTION
MARK TROTTER Precision Agriculture Research Group, School of Science and Technology, University of New England, Armidale NSW 2351
Abstract
Spatial variability is an inherent characteristic of agricultural landscapes. There is an increasing awareness amongst producers that monitoring and managing this variability could lead to increases in production. This paper reviews two recent advances in technology, Active Optical Sensors for site specific nutrient management and Autonomous Spatial Livestock Monitoring systems which seek to exploit spatial variability and enable producers to increase the efficiency and sustainability of their grazing systems
Spatial variability in grazing systems
Spatial variability in the soil, plant and animal components of grazing systems has long been considered problem for producers seeking to manage their landscape at a paddock scale. However, more graziers are realising the potential benefits that can be gleaned from managing the variability that exists within these systems (Trotter, 2010). Intensively managed dairy grazing systems in particular stand to benefit greatly from technologies being developed to manage spatial variability. This paper reviews two key technologies being developed to monitor and manage variability in the plant and nutrient system (Active Optical Sensors) and animal system (Autonomous Spatial Livestock Monitoring Systems).
Active Optical Sensors
Active Optical Sensors (AOS) are a key technology that have been developed and applied within precision cropping for several years, they are used to map biomass (Lamb et al., 2010), for site specific management of weeds in pasture (Young et al., 2008) and in the variable rate application of nutrients, particularly nitrogen (Holland et al., 2004). These sensors work by emitting light in the red and near-infrared (NIR) wavebands and measure the reflectance back from the target vegetation. The relationship between the red and NIR light provides an estimate of the amount of photo-synthetically active biomass (PAB) being measured (Holland et al., 2004). In more recent years there has been a realisation that AOS may have a role to play in pasture management with applications including pasture biomass estimation and pasture mapping being examined (Flynn et al., 2008; Trotter et al., 2008; Trotter et al., 2010a). AOS are currently being used in a rudimentary fashion by graziers to provide biomass estimates for pasture management in both Australia and New Zealand.

Page | 104
Of particular interest to the dairy industry is the development of real-time nutrient application using AOS. Similar to the applications developed in precision cropping systems, this technology offers the potential to deliver Nitrogen (N) to those areas of the paddock that require it (low PAB areas as measured by AOS) whilst reducing or completely omitting the application to areas not limited by N (high PAB as measured by AOS). This technique has been extensively applied to increase N use efficiency in US and some Australian cropping systems.
In the case of dairy pastures the same concept can be applied to limit the application of N to areas where N may be deemed unnecessary, in particular urine and dung patches. This technology offers potential benefits in terms of reduced costs through reduced N application and environmental benefits through reduced N leaching. A New Zealand based company Agri Optics NZ Ltd has modified an N-tech WeedseekerTM fallow spray system to undertake this process and trials are currently underway to quantify the benefits of this site specific N application using this technology.
Autonomous Spatial Livestock Monitoring
Autonomous Spatial Livestock Monitoring (ASLM) technologies have been in development as a research tool for several years (Swain et al., 2011). In recent years there has been significant private sector investment in systems focussed on delivering this technology to the commercial livestock grazier (Stassen, 2009; Andrews, 2010). Real-time ASLM will provide producers with the geo-location of their animal remotely delivered on a computer or mobile device (Trotter et al., 2010c); however the applications extend well beyond simply knowing where the cows are. This positional data could also be interpreted to deliver information on animal behaviour (Roberts et al., 2010) or integrated with spatial landscape data to provide measures of pasture utilisation (Trotter et al., 2009).
Of particular interest to the pasture industry is the potential to use the spatial data generated by ASLM to examine spatial grazing activity (nutrient uptake) and urination and defecation events (nutrient redistribution).
By understanding how nutrients are moved around a farm by animals producers can start to explore site specific fertiliser management strategies (Trotter et al., 2010b) or even targeted application of nitrification inhibitors (Betteridge and Costall, 2010).
Researchers at Massey University New Zealand are currently exploring the potential for ASLM technologies to provide an understanding of the pasture utilisation and nutrient redistribution in intensively managed dairy systems (Draganova et al., 2009). Initial results from trials linking ALSM with urine sensors suggest that there can be significant spatial variability in the deposition of urine onto dairy pastures during grazing events, the extent of which may warrant consideration of site specific nutrient management strategies (Draganova et al., 2010).
Conclusions
The monitoring and management of spatial variability in dairy grazing systems offers potential to increase efficiency in nutrient management at the same time as addressing ever increasing environmental concerns. Whilst we can borrow from the technologies developed through precision agriculture in other industries, significant investments need to be made into pasture specific tools if the grazing industry is to take advantage of these opportunities.
Page | 105
References
Andrews, C., 2010. 1st Australian and New Zealand Symposium on Spatially Enabled Livestock Management Precision Agriculture Research Group, University of New England, Armidale, NSW, Australia.
Betteridge, K., Costall, D., 2010. 1st Australian and New Zealand Spatially Enabled Livestock Management Symposium. Precision Agriculture Research Group University of New Engand Armidale, p. 1.
Draganova, I., Yule, I.J., Betteridge, K., Hedley, M., Stafford, K., 2009. 13th Annual Symposium on Precision Agriculture in Australasia, GPS Tracking Workshop. Precision Agriculture Research Group, University of New England Armidlae, p. 65.
Draganova, I., Yule, I.J., Hedley, M., Betteridge, K., Stafford, K., 2010. 10th International Conference on Precision Agriculture. Colorado State University, Denver USA.
Flynn, E.S., Dougherty, C.T., Wendroth, O., 2008. Agronomy Journal 100, 114-121.
Holland, K.H., Schepers, J.S., Shanahan, J.F., Horst, G.L., 2004. 7th International Conference on Precision Agriculture and Other Precision Resources Management, University of Minnesota, Department of Soil, Water and Climate.
Lamb, D.W., Trotter, M.G., Schneider, D.A., 2010. 10th International Conference on Precision Agriculture. Colorado State University, Denver, Colorado, USA.
Roberts, J., Trotter, M.G., Lamb, D.W., Hinch, G.N., Schneider, D.A., 2010. 15th Australian Society of Agronomy Conference. Australian Society of Agronomy, Lincoln, New Zealand.
Stassen, G., 2009. Precision Agriculture Research Group The University of New England, Armidale, Australia, pp. 68-70.
Swain, D., Friend, M., Bishop-Hurley, G., Handcock, R., Wark, T., 2011. Animal Production Science 51, 167-175.
Trotter, M.G., 2010. 15th Australian Agronomy Conference. Australian Society of Agronomy, Lincoln, New Zealand.
Trotter, M.G., Lamb, D.W., Donald, G.E., Schneider, D.A., 2010a. Crop and Pasture Science 61, 389-398.
Trotter, M.G., Lamb, D.W., Hinch, G.N., 2009. News South Wales Grasslands Society Conference. New South Wales Department of Primary Industries, Taree, Australia, pp. 124-125.
Trotter, M.G., Lamb, D.W., Hinch, G.N., Guppy, C., 2010b. 10th International Conference on Precision Agriculture. Colorado State University, Denver, Colorado USA.
Trotter, M.G., Lamb, D.W., Hinch, G.N., Guppy, C.N., 2010c. Animal Production Science 50, 616–623.
Trotter, T.F., Frazier, P.F., Trotter, M.T., Lamb, D.W., 2008. 9th International Conference on Precision Agriculture. Colorado State University, Denver, Colorado.
Young, F.L., Yenish, J.P., Launchbaugh, G.K., McGrew, L.L., Richard Alldredge, J., 2008. Weed Technology 22, 156-159.
Page | 106
BREEDING FOR EXTENDED LACTATION IN AUSTRALIAN DAIRY COWS: A REVIEW
MARY ABDELSAYAD M. AbdelsayedABC, H.W. RaadsmaABC and P.C. ThomsonABC
AReprogen Animal BioScience group, Faculty of Veterinary Science, University of Sydney, Camden, NSW, 2570 BDairy Futures CRC Victorian AgriBiosciences Centre, 1 Park Drive, Bundoora, VIC, 3083 CEmail: [email protected] [email protected] [email protected]
Abstract
The Australian dairy industry is slowly moving from a seasonal calving system to bi-annual and all year round calving systems, extending lactation beyond the traditional 305 days of the seasonal system. Extended lactation in the context of this study may be defined as the ratio of expected milk yield from day 305 to day 610 (given that cattle are in lactation for 2 years) relative to the cumulative yield up to day 305. In order to have cows lactating beyond a 305 day lactation, it is important to identify and utilise cows which have a high lactation persistency. In the context of this study persistency may be defined as the ratio of milk yield at day 305 to milk yield at peak. Extending lactation by utilising cows which have a high lactation persistency is likely to lead to increasing production, lactation efficiency, increased reproductive performance, and decreased health problems with increased productive life of the cow. However, to date there is very limited data, thus further research is needed to quantify the gains in profitability and define genetic relationships between extended lactation traits, persistency traits after day 305 of lactation and other cow traits such as fertility and survival. Extended lactation as a trait on its own does not need to be included as a breeding objective but may be included in a selection index with persistency, calving interval and survival but more research is essential before widespread recommendations can be made, such studies are currently in progress for Australian dairy cattle.
Additional keywords: Extended lactation, persistency, efficiency, genetic relationships
Introduction
Conventional dairy farming systems in Australia are characterised by seasonal calving patterns, where cows are milked for about 300 days and are dried off at a
pre-arranged date for 2 months and subsequently required to calve and be re- mated within a short time period of 6 to 15 weeks. Such patterns are often adopted to maximise labour efficiency and take advantage of pasture growth and high nutritive content (Haile-Mariam and
Page | 107
Goddard 2008). Seasonal calving has frequently been adopted in low-cost, pasture-based milk production systems throughout countries such as Australia, New Zealand and Ireland. With the advent of new technologies such as robotic milking systems and high output production systems, the seasonal dairy production system is being phased out to year round calving and milking (Borman et al 2004). Furthermore, welfare concerns such as induced calving and metabolic stresses around calving and early lactation may lead to associated infertility under seasonal calving systems (Knight 2001). These limitations have led to producers to search for alternative systems optimal for milk production and sustaining overall health of the dairy cows. An alternative is extending the lactation period beyond the traditional 305 days of the seasonal system. Several studies conducted in various countries (Van Amburgh et al 1997; Osterman and Bertilsson 2003; Sawa and Bogucki 2009) have shown that cows are capable of extending their milk production well beyond 300 days. Considerations for extending lactation in dairy cattle Extended lactation In practical terms extending the lactation is only feasible if daily milk yield is sustained over a long period of time (Sorensen et al 2008). Extended lactation in the context of this study may be defined as the ratio of expected milk yield from day 305 to day 610 (given that cattle are in lactation for 2 years) relative to the cumulative yield up to day 305 (Jonas et al submitted). In order to have cows lactating beyond a 305 day lactation, it is important to identify and utilise cows which have a high lactation persistency (Vargas et al 2000).
Lactation persistency Cows with extended lactations tend to have lower and extended peak production whilst still maintaining a high total milk production over a longer lactation period. This often results in an alteration in the shape of the conventional lactation curve shifting to a flatter more persistent curve (Auldist et al 2007). Cows with longer flatter lactation curves tend to have fewer health and fertility problems, have a longer productive life and are more profitable than cows with a conventional lactation curve of higher peak yield and steeper rate of decline (Dekkers et al 1998; Cole and Null 2009). Persistency is usually defined in two ways independent of milk yield, according to the shape of the lactation curve, or defined relative to total yield or peak yield at a given time towards the end of lactation (Grossman and Koops 2003). In the context of this study persistency may be defined as the ratio of milk yield at day 305 to milk yield at peak (Hall 2008; Jonas et al submitted). There are large amounts of available data to calculate persistency, but very limited data are available associated with the measure of extended lactation proposed here. Further study is needed to quantify the most appropriate measures of extended lactation.
Advantages of extended lactation
There are numerous benefits for adopting an extended lactation system, which include delaying inseminations/mating of cows until after peak lactation which can lead to increased conception rates and a longer recovery period in body condition (Borman et al 2004; Auldist et al 2007), a reduction in the number of calves born to one every two years reducing the need for labour with breeding and calving (O’Brien and Cole 2004), and cows would have greater flexibility to milk until they were pregnant rather than being culled because they could not conceive in time for a 12 month calving cycle (O’Brien and Cole 2004). As a result, lactation and

Page | 108
production efficiency is likely to increase. Sorensen et al (2008) and Sawa and Bogucki (2009) demonstrated that having extended lactation periods of 15 months saw a reduction in the incidence of mastitis, lameness, metabolic and reproductive disorders, it also resulted in improved fertility later in the lactation period.
Modelling extended lactations in dairy cattle Lactation curve models are useful tools in helping define lactation characteristics of individual cows for genetic selection (VanRaden et al 2006), predicting yields of milk and milk components, analyse responses of yield to environmental and management changes, and identify opportunities for maximizing net value effectively (Dematawewa et al 2007). In the past, lack of sufficient data on extended lactations has been an impediment to modelling extended lactations. Until recently, extended lactation records of up to 999 days in lactation length have now allowed extensive examinations of the characteristics of lactation curves of dairy cows.
Lactation curve models can be divided into two classes, mechanistic models based on biological processes of lactation (e.g. mammary gland growth) and empirical models, more favoured due to their simplicity which give a general quantitative description of the lactation process (e.g. test day records) (Vargas et al 2000). The Wood model was conceived to model whole lactations and is a widely used empirical model for modelling dairy lactation curves. However, it may not necessarily be able to describe the shape of the lactation curve past 305 days of lactation (Grossman and Koops 2003). Recently, empirical models such as random regression models (RRM) have been extensively used to model lactation curves (Miglior et al 2007; Stoop et al 2007), and currently have been more
popular than the Wood model in modelling extended lactations (Haile-Mariam and Goddard 2008; Pryce et al 2010; Yazgan et al 2010). RRM are advantageous over mechanistic models in that they provide a flexible data-driven method of fitting the cow-specific lactation curves and allow persistency across and within lactations to be genetically evaluated (Yazgan et al 2010). However, RRM are computationally more demanding than the Wood model. Further research is required to identify which of the two models is best to model extended lactation. Only a limited number of studies (Vargas et al 2000; Grossman and Koops 2003; Dematawewa et al 2007 and Steri et al 2009) have looked at modelling extended lactations >305 days, mostly based on opportunistic data of cows that had extended lactations as a result of failure to rebreed. No modelling has been done on planned extended lactations beyond 305 days. This may lead to misleading and biased results which may not be applicable to management and breeding strategies of planned extended lactations, and requires further research to understand and model the biology of extended lactation.
Genetic parameters of extended lactation and persistency traits Until 2008, no estimates of genetic and phenotypic relationships were available for extended lactations beyond the standard 300 days. Since then only two studies (Haile-Mariam & Goddard 2008; Yazgan et al 2010) have detailed genetic parameter estimates for extended lactations, and the need remains for more comparative research. Heritability Heritability estimates from both the studies on extended lactation milk traits (Haile-Mariam and Goddard 2008; Yazgan et al 2010) are in general agreement. Heritabilities were moderate (0.19-0.29) for the yield traits, milk, fat, protein, and

Page | 109
lactose, which are very similar to heritabilities of 305 day lactations (Cole and VanRaden 2006; Miglior et al 2007; Stoop et al 2007). These findings suggest that extended lactation traits will respond to selection. There is a genetic component to lactation persistency where heritability estimates range up to 0.36 (Haile-Mariam and Goddard 2008), implying that genetic progress could be made on this trait through selection (Davis 2005). Genetic, phenotypic and environmental correlations of extended lactation traits Genetic, phenotypic and environmental correlations between yield traits after day 305 of lactation (extended lactation) were found to be quite high and positive (0.60-0.98), except for somatic cell scores, where genetic correlations with yield traits were negative and small (Yazgan et al 2010). These results are comparable to reports by Miglior et al (2007) which looked at genetic parameter relationships between cumulative yield traits up to day 305 of lactation. Haile-Mariam and Goddard (2008) revealed a pattern of relationships among the days of extended lactation (from day 305 up to 540 days) to be relatively similar to that observed in the first 305 days of the standard lactation due to the high genetic (0.34-0.98) and phenotypic (0.26-0.97) correlations between the two traits. This suggests that they are similar traits, regulated by the same genes (Haile-Mariam and Goddard 2008). In the Haile-Mariam and Goddard (2008) study, persistency of milk yield in the first 300 days was adjusted to have genetic correlations of zero with the mean milk yield in the first 300 days and despite this adjustment, genetic correlation was between 0.34 and 0.36. These findings suggest that selection on persistency of milk yield of the first 300 days and mean milk yield can be used to improve milk yield after 300 days (Haile-Mariam and Goddard 2008; Cole and Null 2009). However, the limitation of the two studies (Haile-Mariam and Goddard 2008; Yazgan
et al 2010) is that they did not look at relationships (covariances) between the yield traits and other milk and cow traits (fertility) in the extended lactation phase. Hence, further study in needed on the relationships between other yield traits, persistency traits and other cow traits in the extended lactation phase to assist in selection criterion decisions in a breeding program. Perhaps there needs to be a modification in the selection index in order to include extended lactation traits, persistency traits, fertility and survival as a selection index to help producers maximise their profit from breeding. Given there are no covariance estimates between such traits and extended lactation traits, more research is needed to quantify the impact and profitability of modifying the selection index. Furthermore, there are no economic analyses on the effects of persistency on feed costs, milk revenue, health and reproduction on lactation lengths beyond the standard 305 days, and more research is essential before widespread recommendations can be made. Conclusion
Adopting an extending lactation in the dairy industry has demonstrated some potential advantages of improving production and lactation efficiency. However, more research is needed to quantify the gains in profitability and define genetic relationships between extended lactation traits, persistency yield traits such as fat, protein and lactose after day 305 of lactation and other cow traits such as fertility and survival. Extended lactation as a trait on its own does not need to be included as a breeding objective but may be included in a selection index with persistency, calving interval and survival but further research is required to quantify these relationships. Such studies are currently in progress for Australian dairy cattle.

Page | 110
Acknowledgements M. Abdelsayed is a recipient of a Dairy Futures CRC and APA scholarship References Auldist M.J., O'Brien G.N., Cole D.J., Macmillan K.L. and Grainger C. (2007). J. Dairy Sci. 90, 3234. Borman J.M., Macmillan K.L. and Fahey J. (2004). Aust. J. Exp. Agri. 44, 507. Cole J.B. and Null D.J. (2009). J. Dairy Sci. 92, 2248. Cole J.B. and VanRaden P.M. (2006). J. Dairy Sci. 89, 2722. Davis S.R. (2005). NZ Vet. J. 53,400. Dekkers J.C.M., Ten Hag J.H. and Weersink A. (1998). Livest. Prod. Sci. 53, 237. Dematawewa C.M.B., Pearson R.E. and VanRaden P.M. (2007). J. Dairy Sci. 90, 3924. Grossman M. and Koops W.J. (2003). J. Dairy Sci. 86, 988. Haile-Mariam M., Goddard M.E. (2008). Animal. 2, 325.
Hall E.J.S. (2008). Ph.D Thesis, University of Sydney.
Jonas E., Thomson P.C., Hall E.J.S., McGill D., Lam M.K. and Raadsma H.W. Submitted.
Knight C.H. (2001). Proc. Nutri. Soc. 60, 527.
Miglior F., Sewalem A., Jamrozik J., Bohmanova J., Lefebvre D.M. and Moore R.K. (2007). J. Dairy Sci. 90, 2468.
O'Brien G.N. and Cole D.J. (2004). Animal Prod. Aust. 25, 128.
Osterman S. and Bertilsson J. (2003). Livest. Prod. Sci. 82, 139.
Pryce J.E., Haile-Mariam M., Verbyla K., Bowman P.J., Goddard M.E. and Hayes B.J. (2010). J. Dairy Sci. 93, 2202. Sawa A. and Bogucki M. (2009). Archiv. Tierzucht. 3, 219. Sorensen A., Muir D.D. and Knight C.H. (2008). J. Dairy Res. 75, 90. Steri R., Cappio-Borlino A. and Macciotta N.P.P. (2009). Ital.J.Anim.Sci. 8, 165.
Stoop W.M., Bovenhuis H. and van Arendok J.A.M. (2007). J. Dairy Sci. 90, 1981.
Van Amburgh M.E., Galton D.M., Bauman D.E. and Everett R.W. (1997). Livest Prod Sci. 50, 15.
VanRaden P.M., Dematawewa C.M.B., Pearson, R.E. and Tooker M.E. (2006). J. Dairy Sci. 89, 3213. Vargas B., Koops W.J., Herrero M. and Van Arendonk J.A.M. (2000). J. Dairy Sci. 83, 1371. Yazgan K., Makulska J., Weglarz A., Ptak E. and Gierdziewicz M. (2010). Czech. J. Anim. Sci. 3, 91

Page | 111
SERUM IgG CONCENTRATION IN HAND-REARED CALVES AND IT’S RELATIONSHIP TO DIARRHOEA INCIDENCE AND INCREASED RECTAL TEMPERATURE
CLAIRE KENTLER C.A. KentlerAC, B.B. BabatundeAB, C. GuzmanA and T.L. FrankelA ALa Trobe University, Bundoora, Victoria, 3086 BFiji National University, Nasinu, Fiji Islands Email: [email protected]
Abstract
Dairy calves must receive immunoglobulins (Igs) via consumption of maternal colostrum. ‘Passive transfer’ of these Igs from colostrum provides for limited specific immune protection as calves develop their own systemic responses. A large percentage of dairy calves have failure of passive transfer (FPT), due to a number of different factors and it is commonly believed that calves with FPT have a greater risk of infection leading to death. This study investigated the relationship between serum IgG concentration and the incidence of diarrhoea and high rectal temperatures in 44 hand-reared Friesian bull calves 2-3 weeks of age. Calves were reared under a high in-put management system. There was no difference in the incidence of diarrhoea in calves with FPT in comparison to those with effective passive transfer, although these FPT calves had a higher incidence of moderate diarrhoea. There was also no difference in the incidence of abnormally high rectal temperatures between the two groups of calves and no correlations were found between serum IgG concentration and diarrhoea incidence or the incidence of high temperatures. These findings may relate to the more intensive management system, with stringent cleaning protocols, under which calves were reared, or to whether or not calves mounted acquired or innate responses to pathogen. Whilst further investigation is required to establish concrete links between management practices, immune response and disease patterns, it is clear that FPT calves can be effectively managed for disease and rates of morbidity are not necessarily influenced by good colostrum management.
Additional keywords: Calf Milk Replacer (CMR), thermoregulation, innate immunity, antibody, scouring
Introduction
It is widely understood that calves are born ‘agammaglobulinemic’, with no antibodies being passed to the foetus across the placenta in utero. Instead, calves must rely on the passive transfer of immunoglobulins in the dam’s first milk (or colostrum), for
specific immune protection (Weaver et al. 2000). Adequate passive transfer has been defined as possessing serum IgG concentrations greater than 10mg/ml (Tyler et al. 1996) and up to 30% of dairy calves fail to absorb this level of IgG and suffer from failure of passive transfer (FPT) (Beam et al. 2009; Trotz-Williams, Leslie and Peregrine 2008). Reduction in passive

Page | 112
transfer status below 6.0mg/ml has been associated with an increase in mortality in dairy calves (Tyler et al. 1998).
Early literature established a finite period of 12-36 hours after birth for effective absorption of antibodies (Stott et al. 1979). A number of colostrum and non-colostrum factors are associated with effective passive transfer and these have been reviewed by Weaver et al. (2000). Coupled with this greater understanding of the complexities of FPT, research has also shown that not all calf mortalities are associated with FPT and a subsequent improvement in FPT will not necessarily reflect a decrease in mortality rates (Tyler et al. 1999). This research reflects that whilst it is vital that best practice for colostrum management is followed and that calves are fed good quality colostrum in a timely fashion and in adequate volumes, calves can still suffer from FPT. Additionally, calves with effective passive transfer may still contribute significantly to rates of morbidity and mortality (Tyler et al. 1999).
Increases in morbidity and mortality in dairy calves represent significant economic impacts on-farm (James, McGilliard and Hartman 1984) and as such, it is vital to understand the complex relationship between passive immunity and disease and any other factors that may be important.
Previous research has investigated calf management factors and their association with FPT (Trotz-Williams, Leslie and Peregrine 2008) as well as calf and herd management and associations with calf mortality (James, McGilliard and Hartman 1984). However, the impact of management of calves with FPT in terms of improving animal health and economic outcomes has not been adequately elucidated. Analysis of data from the current study, therefore, aimed to address some of the gaps in this knowledge by directly correlating common disease symptoms with concentration of IgG in serum in a relatively high in-put calf-rearing
system specifically managed to reduce infection loads.
Materials and methods
During July-September 2007-09, 44 Friesian bull calves were reared as Control animals as part of a larger study investigating nutritional supplementation and immune development. Young calves 2-5 days of age, were obtained from the Dept Primary Industries Vic. Ellinbank Centre and transported to the research site at La Trobe University in a semi-enclosed crate on the back of a utility. All calves were managed by Ellinbank staff to receive at least 4L of colostrum within the first 24 hours of life and at least 6L within the first 48 hours of life, either by nipple bottle or oesophageal feeder. Following initial colostrum feeding, calves were fed pooled colostrum or transition milk until pick up and housed in group pens.
Calves were hand-reared for 2-3 weeks in group-pens of a maximum of 3 calves/pen in a ventilated Ecoshelter (Redpath Ecoshelters®, Bendigo East, Victoria, Australia). Calves were bedded on a mixture of wood shavings and sawdust, maintained at a depth of approximately 10cm throughout the study and cleaned daily to remove faecal contamination and wet spots.
Calves were fed twice daily at approximately 0800 hours and 1600 hours with one of 3 commercial CMR products in individual ‘Milkmaid’ feeders (Polymaster Pty Ltd, Swan Hill, Victoria, Australia), fitted with single Peach Teats™ (Skellerup Industries, Christchurch, New Zealand). Venavite Full Cream (Rivalea Australia, Corowa, N.S.W.) or Barastoc Calf Milk Replacer (Ridley AgriProducts, Melbourne, Australia) CMRs were fed in 2007 and Venavite Full Cream Extra (Rivalea Australia, Corowa, N.S.W.) used in 2008-09. Dry CMR powder was fed at 10% of liveweight, blended with warm water to feed at body temperature. Clean, fresh water and clean, dry roughage, fed from a

Page | 113
hay net, were available ad libitum. Following each milk feeding, all utensils used to prepare and feed milk were washed with detergent and disinfected with a dilute solution of sodium hypochlorite. Water buckets were cleaned daily and hay nets were disinfected as required.
Rectal temperatures of individual calves were taken daily with a digital veterinary thermometer, cleaned between each calf with 30-70% ethyl, or isopropyl alcohol. Rectal temperatures were considered ‘moderately high’ between 39.6oC – 39.9oC inclusive and were considered ‘high’ at 40.0oC or above. The incidence of moderately high, or high, temperatures was calculated as a percentage of study days.
Faecal consistency was also observed daily. Calves were assessed throughout the study periods with either normal, thin, or watery faeces and the percentage of study days on which they presented with each faecal consistency were calculated. Abnormal faecal scores were combined to give a total percentage of days on which calves presented with diarrhoea.
Calves with abnormal rectal temperatures were treated with Neomycin Penicillin (Intervet Australia Pty Limited, Bendigo East, Victoria), according to manufacturer’s directions. Calves were treated with antibiotics when showing moderately high temperatures when these temperatures were combined with depressed behaviour, lack of appetite, other symptoms of infection, or if other calves in the pen were being treated. Calves presenting with high temperatures were immediately treated with a course of antibiotics. In 2008-09, calves presenting with abnormal temperatures were rugged with woollen or polar fleece rugs.
Blood samples were taken by jugular venipuncture at 3-5 days of age, before commencement of the study. These were allowed to clot before centrifugation at
3000 x g for 15 minutes for serum collection. Serum IgG levels were measured by conjugate-ELISA with a Bovine IgG ELISA Quantitation Kit (Bethyl Laboratories Inc., Montgomery, TX, USA).
For statistical analysis, calves were divided into two groups: FPT, (those with serum IgG concentrations below 10mg/ml) and EPT, (those with effective passive transfer and serum IgG concentrations greater than 10mg/ml). Data was analysed using IBM SPSS Statistics 19.0 (IBM Corporation, Somers, NY). Between-group data was analysed with non-parametric Mann-Whitney U Tests and non-parametric Spearman’s Correlations were used to assess relationships between serum IgG concentrations and rectal temperatures or faecal consistency.
Results
Seventeen of the 44 calves involved in the trial were assessed as having FPT, with a mean serum IgG concentration (± SEM) of 5.05 ± 0.86mg/ml, (range: 0 – 9.79mg/ml). Mean serum IgG concentration (± SEM) of the EPT group (N = 27), in contrast, was 22.22 ± 2.56mg/ml, (range: 10.82 – 65.30mg/ml).
The incidence of abnormal faeces as a percentage of study days, as well as the incidence of watery faeces, was not different between FPT and EPT calves (Table 1). Additionally, no significant differences were identified between FPT and EPT calves in terms of the persistence of abnormal - (moderately high or high) - temperatures as a percentage of study days. In contrast, FPT calves presented with thin faeces on twice the percentage of study days (11.51 ± 3.08%) than EPT calves (5.19 ± 1.70%), p = 0.044. (Data expressed as means ± SEM).
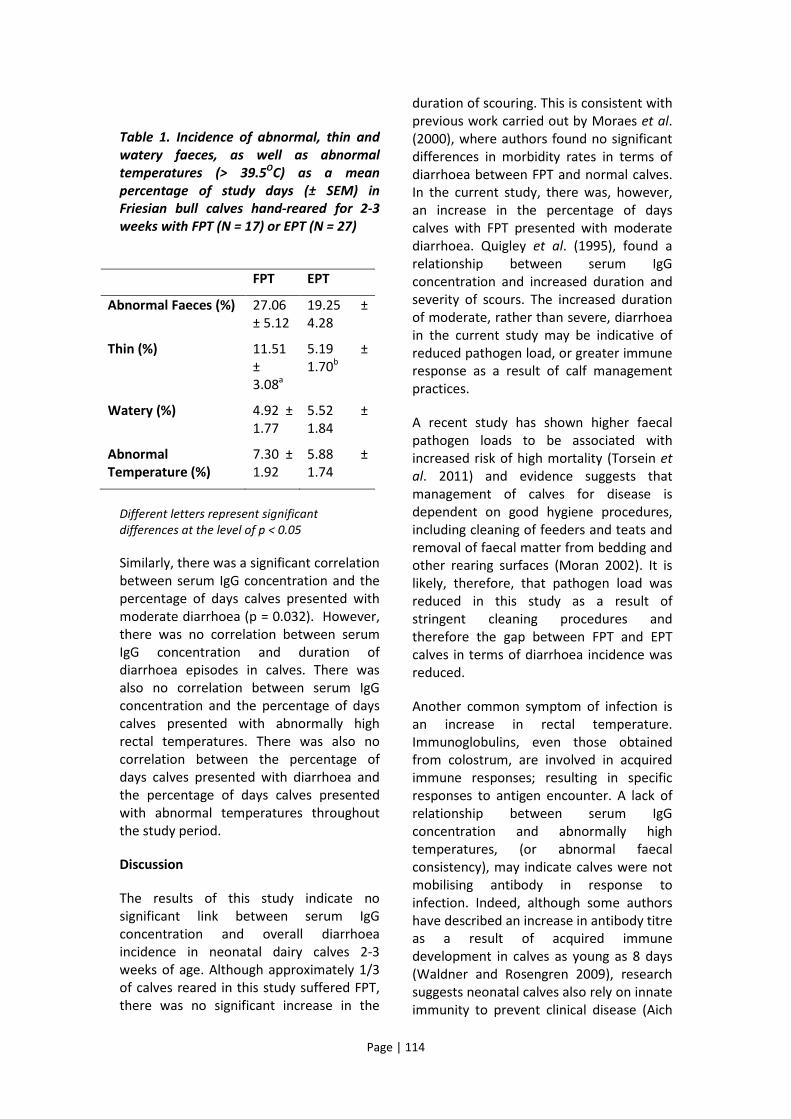
Page | 114
Table 1. Incidence of abnormal, thin and watery faeces, as well as abnormal temperatures (> 39.5OC) as a mean percentage of study days (± SEM) in Friesian bull calves hand-reared for 2-3 weeks with FPT (N = 17) or EPT (N = 27)
FPT EPT
Abnormal Faeces (%) 27.06 ± 5.12
19.25 ± 4.28
Thin (%) 11.51 ± 3.08a
5.19 ± 1.70b
Watery (%) 4.92 ± 1.77
5.52 ± 1.84
Abnormal Temperature (%)
7.30 ± 1.92
5.88 ± 1.74
Different letters represent significant differences at the level of p < 0.05
Similarly, there was a significant correlation between serum IgG concentration and the percentage of days calves presented with moderate diarrhoea (p = 0.032). However, there was no correlation between serum IgG concentration and duration of diarrhoea episodes in calves. There was also no correlation between serum IgG concentration and the percentage of days calves presented with abnormally high rectal temperatures. There was also no correlation between the percentage of days calves presented with diarrhoea and the percentage of days calves presented with abnormal temperatures throughout the study period.
Discussion
The results of this study indicate no significant link between serum IgG concentration and overall diarrhoea incidence in neonatal dairy calves 2-3 weeks of age. Although approximately 1/3 of calves reared in this study suffered FPT, there was no significant increase in the
duration of scouring. This is consistent with previous work carried out by Moraes et al. (2000), where authors found no significant differences in morbidity rates in terms of diarrhoea between FPT and normal calves. In the current study, there was, however, an increase in the percentage of days calves with FPT presented with moderate diarrhoea. Quigley et al. (1995), found a relationship between serum IgG concentration and increased duration and severity of scours. The increased duration of moderate, rather than severe, diarrhoea in the current study may be indicative of reduced pathogen load, or greater immune response as a result of calf management practices.
A recent study has shown higher faecal pathogen loads to be associated with increased risk of high mortality (Torsein et al. 2011) and evidence suggests that management of calves for disease is dependent on good hygiene procedures, including cleaning of feeders and teats and removal of faecal matter from bedding and other rearing surfaces (Moran 2002). It is likely, therefore, that pathogen load was reduced in this study as a result of stringent cleaning procedures and therefore the gap between FPT and EPT calves in terms of diarrhoea incidence was reduced.
Another common symptom of infection is an increase in rectal temperature. Immunoglobulins, even those obtained from colostrum, are involved in acquired immune responses; resulting in specific responses to antigen encounter. A lack of relationship between serum IgG concentration and abnormally high temperatures, (or abnormal faecal consistency), may indicate calves were not mobilising antibody in response to infection. Indeed, although some authors have described an increase in antibody titre as a result of acquired immune development in calves as young as 8 days (Waldner and Rosengren 2009), research suggests neonatal calves also rely on innate immunity to prevent clinical disease (Aich
Page | 115
et al. 2007). It is likely, therefore, that although passive immunity plays an important role in immune protection in early life, that the results of the current study reflect the action of innate immune systems in early life. The importance of such systems warrants further investigation in order to understand how calves may be better managed for immune protection in early life.
In addition to a reduced ability to fight disease, young calves are particularly susceptible to cold stress as a result of lower tolerance for cold temperatures (Collier et al. 1982). Calves in thermo-stress are at greater risk of developing disease as they partition nutrients for thermo-regulation instead of immune response (Lammogolia et al. 1999). Maintaining shed temperatures and keeping calves warm through episodes of disease may therefore increase the calf’s ability to mount immune responses and reduce disease duration. Although this may represent an increased rearing cost, management of thermo-regulation may be considered a one-time cost that will likely benefit many generations of calves reared in the same facilities.
Increased labour costs have also been cited as a reason for reduced frequency of washing and sterilisation of equipment and cleaning of rearing facilities, (Moran 2002), but it is important for farmers and calf rearers to consider these in comparison to long-term losses in terms of calf health, mortality and value as a production animal at maturity. A small increase in labour costs may result in a large reduction in calf losses and costs associated with sick calves and this must be considered when managing rearing facilities.
Finally, although a number of calves in this study suffered from FPT, they were not necessarily more susceptible to disease. Further study into the understanding of innate immunity, FPT and management interactions are vital to more fully
understand the calf’s complex response to disease.
The authors wish to acknowledge the financial support of Meat & Livestock Australia and the invaluable assistance and provision of calves from Mr J Laidlaw and the staff of the DPI Ellinbank Dairy, as well the assistance in carrying out daily duties of Mr R Evans at the La Trobe University Agricultural Reserve and the calf rearing assistance of Ms D Rayment, Ms J Norrie, Ms N Hellyer, Ms E Young, Ms M Merrett, Ms R Smith, Ms O Tabing, Mrs J Arnold and Mr W Kentler.
References
Aich P., Wilson H.L., Kaushik R.S., Potter A.A., Babiuk L.A. and Griebel P. (2007). J. Gen. Virol. 88, 2749
Beam A.L., Lombard J.E., Kopral C.A., Garber L.P., Winter A.L., Hicks J.A. and Schlater J.L. (2009). J. Dairy Sci. 92, 3973
Collier R.J., Beede D.K., Thatcher W.W., Israel L.A. and Wilcox C.J. (1982). J. Dairy Sci. 65, 2213
James R.E., McGilliard M.L. and Hartman D.A. (1984). J. Dairy Sci. 67, 908
Lammogolia M.A., Bellows R.A., Grings E.E., Bergman J.W., Short R.E. and MacNeil M.D. (1999). J. Anim. Sci. 77, 824
Moraes M.P., Weiblen R., Rebelatto M.C. and da Silva A.M. (2000). Ciên. Rur. Santa Mar. 30, 299
Moran J. (2002). “Calf Rearing: A Practical Guide”, 2nd ed. (CSIRO Publishing: Collingwood)
Quigley J.D., Martin K.R., Bemis D.A., Potgieter L.N.D., Reinemeyer C.R., Rohrbach B.W., Dowlen H.H. and Lamar K.C. (1995). J. Dairy Sci. 78, 893
Stott G.H., Marx D.B., Menefee B.E. and Nightengale G.T. (1979). J. Dairy Sci. 62, 1632

Page | 116
Torsein M., Lindberg A., Hallén Sandgren C., Persson Waller K., Törnquist M. and Svensson C. (2011). Pre. Vet. Med. 99, 136
Trotz-Williams L.A., Leslie K.E. and Peregrine A.S. (2008). J. Dairy Sci. 91, 3840
Tyler J.W., Hancock D.D., Parish S.M., Rea D.E., Besser T.E., Sanders S.G. and Wilson L.K. (1996). J. Vet. Intern. Med. 10, 304
Tyler J.W., Hancock D.D., Wiksie S.E., Holler S.L., Gay J.M. and Gay C.C. (1998). J. Vet. Intern. Med. 12, 79
Tyler J.W., Hancock D.D., Thorne J.G., Gay C.C. and Gay J.M. (1999) J. Vet. Intern. Med. 13, 335
Waldner C.L. and Rosengren L.B. (2009). Can. Vet. J. 50, 275
Weaver D.M., Tyler J.W., VanMetre D.C., Hostetler D.E. and Barrington G.M. (2000). J. Vet. Intern. Med. 14, 569

Page | 117
GENOMIC SELECTION IN DAIRY CATTLE: AN OVERVIEW AND DISCUSSION ON SOME POSSIBLE APPLICATIONS DAVID MCGILL
D. M. McGillA*, and J.J. LievaartA
AEH Graham Centre for Agricultural Innovation, Wagga Wagga, NSW, 2650 (a collaborative initiative between Charles Sturt University and Industry & Investment, NSW) *Corresponding author. Email: [email protected]
Abstract
The use of genomic information to aid in the calculation of breeding values is something that has developed quickly in the last decade and will continue to progress in the near future. With the advent of estimated breeding values incorporating genomic information it is difficult to keep up to date with progress, let alone understand the calculations and science behind the tool that helps farmers make so many crucial decisions with their herd.
This paper will give a concise overview of the methods used to calculate estimated breeding values (EBV) and how genomic evaluations are being incorporated within them. Furthermore, it will discuss briefly some possible applications and benefits of this technology with particular attention to the Australian dairy industry and its progress so far with the uptake of this new tool for selection.
Lastly, this paper will give a realistic picture on the applications of genomic selection in developing dairy herds and dairy sectors using Pakistan as a case study. Although breed improvement programs are being implemented in the country, the current level of progeny testing and evaluation might restrict the practical use of incorporating genomic selection into breeding values for some time.
Additional keywords: genomic selection, breeding values
Introduction
Selection of animals has been a process undertaken by humans for over 12,000 years dating back to the domestication of cattle and other species (FAO, 1995). Current breeding programs utilize selection to increase the production quantity or quality of a product and hence a lower cost of production per unit of return. Breeding is a method used to improve or develop
livestock by the selection of superior animals within a population. This is done by selective breeding, to obtain desired phenotypes superior to that of the previous generation (Hammond et al., 1992; Seidel, 2010).
The phenotype of an animal is what it looks like and how it performs. For some traits (eg hair colour), phenotype is determined entirely by the animals genetic make-up, that is, its genotype (Seidel, 2010).

Page | 118
However, for most traits of economic importance it is an interaction between the genotype and the environment the animal is in (Falconer & Mackay, 1996; Hammond et al., 1992; Willis, 1998; Seidel, 2010). An example of this is a dairy cow which has been selected genetically for high milk production, but fed optimally or sub optimally (Hammond et al., 1992; Seidel, 2010).
The genotype of an animal is made of genes, which are lengths of DNA (deoxyribonucleic acid) that contain information which influence the building and regulation of proteins. In cattle, there are approximately 22,000 such genes, many of which specify processes that influence production (Seidel, 2010; Falconer & Mackay, 1996). Genetic variation between animals is dependent on which genes are inherited from which parent (Falconer & Mackay, 1996; Hammond et al., 1992; Willis, 1998). Genes from one parent are often different in small but important ways from those inherited from the other (Seidel, 2010). These small differences between genes are the basis of genetic variation and are termed alleles (Seidel, 2010; Nicholas, 2003).
For selective breeding, it would be ideal if we knew all the specific genes and the corresponding desirable alleles which are responsible for influencing important production traits. However, with our current knowledge base this is not possible and hence, we have to look at other means of selecting animals with the information about the animal’s genotype that we can determine or decipher from the performance traits that we measure.
Traditional Breeding Value Estimation
Producers and breeders can select animals based on observable phenotypic traits such as production records, weight or the general look of the animals. However, this may not be the most accurate method as it does not incorporate all the available
information about that particular animal. A better approach is to look at the animal’s performance in comparison with the other animals in the population whilst also incorporating information we know from the individuals relatives. By doing this we can gauge the likely genetic worth of an animal based on the phenotype it is expressing, as well as the effect of genes that it is likely to have received from its parents and has subsequently passed onto its own progeny. A measurement of the genetic worth of an animal is called the animals breeding value.
The true breeding value can be determined for an individual by judging the mean value of all its offspring for the particular trait or traits of interest (Falconer & Mackay, 1996). However, in a practical sense we are not able to calculate this value, instead we can look at performance measurements of the individual, its offspring and relatives (or a combination of any) to provide an indication of what the true breeding value is (Nicholas, 2003). This is known as an estimated breeding value (EBV). EBVs can be used by producers as an unbiased selection tool for determining which sires or dams to breed from within their herd (Goddard & Wiggans, 1999). The more information and performance measurements we have on an individual, the more accurate the EBV will be to the true breeding value and hence, the more efficient the selection and breeding program will be (Nicholas, 2003).
Breeding values have been developed to help producers make informed decisions about the possible animals that are available to breed from. This is in an effort to allow increases in the genetic gain of the herd. There are three ways of increasing the genetic progress of a population or herd, these are:
1. Increasing the accuracy of selection
2. Increasing the selection of intensity
3. Decreasing the generation interval

Page | 119
Over the last fifty years the methods of implementing and estimating breeding values has developed significantly. Initial methods of estimation involved simple averages of daughters and dams to calculate the breeding value of sires. Now, methods of estimation in developed dairy sectors involve complex methods of modeling test-day records to account for lactation shape, environmental effects, herd effects, parity and so on, in order to determine the likely effect the genes of the animals are having on the production trait. These methods have increased the accuracy of selection and thus made increases in the rate of genetic progress where they are implemented.
Other means of affecting the genetic gain is by combining selection on EBVs with reproductive technologies, such as embryo transfer so that the generation interval can be reduced. Alternatively, a farmer can alter the number of elite animals that are used in the herd breeding program to change the selection intensity. These advances have greatly enhanced genetic gain over the last 20 years, but there is a relatively new and exciting science which is starting to be incorporated into the process of genetic selection. This is called genomic selection and can affect each of the three methods of improving genetic progress which can lead to even greater rates of genetic gain.
Genomic Selection
Genomic selection is not all that different from traditional breeding value estimation. Instead, genomic selection is merely an extension of this knowledge to make it more accurate. Subsequently, this greater accuracy, can lead to a greater rate of genetic gain.
EBVs are calculated by looking at phenotypes to determine the likely genotypes of an animal by associating its pedigree with its observable traits. In EBV calculation the only guidance we have on the genotype of an animal is its parents
and grandparents and so on. Genomic selection incorporates relatively new information relating to the genetic code of the animal to get a more precise indication its genotype.
A little explanation of the process
The genotype of an animal is basically made up of genes that code for the various functions that take place in the body. These genes are made up of four building blocks; adenosine (A), thymidine (T), guanine (G) and cytosine (C) which are called bases. Bases are paired together (C with G, A with T) as base pairs (bp) in different combinations to form a sequence called DNA which codes for every process in the organism (Figure 1).
As mentioned earlier, the alleles of genes differ between individuals, and so the corresponding genomes of parents will similarly differ, hence creating genetic variation. Any one of these differences is referred to as a polymorphism which can be as minor as a single base pair change (Figure 1). These are called single base pair (nucleotide) polymorphisms or SNPs (Seidel, 2010).
Figure 1. A simplified illustration of a section of DNA highlighting an example of a SNP difference.
If we were to sequence the entire bovine genome, we could theoretically link each of the estimated 22,000 genes (Seidel, 2010) and their different alleles with phenotypic measurements that we have recorded. However, in the case of cattle there are two sets of 2.8 billion bases, one from the mother and one from the father (Seidel,
... A A C G T C G ...
... T T G C A G C ...
... A A C A T C G ...
... T T G T A G C ...
A SNP difference
Page | 120
2010). With such a large number of bases this would be difficult, expensive and time consuming.
Instead a more practical approach is to select a portion of known SNPs (say 50,000) and use them as markers along the genome to create a map. Then by taking a sample of genetic material from each individual (eg hair, blood) we can create a SNP map for each animal in the population. This SNP map can then be used with the animal’s pedigree information as the clues for its genotype. Following this we can then calculate more accurately what the predicted effects of each animal’s genotype will have on the animal’s production performance. This is just another method of matching unknown alleles with phenotypes, but now DNA sequence information, is used in the process (Seidel, 2010).
Discussion - Applications
As mentioned, genomic selection has the potential to be able to affect the rate of genetic gain by increasing accuracy, intensity and by decreasing generation interval. This is an exciting development and is likely to revolutionize breeding and genetic improvement in all animal industries throughout the world. However, it is important not to get too far ahead of ourselves and to be aware of what practical applications we can expect from this new technology in the immediate future. Below are some examples of where this new technology can and can’t be used in the dairy industry.
Developed Dairy Sectors
Decreasing the generation interval is one of the ways in which we can enhance genetic progress. So, there are advantages in selecting animals based on their phenotype or genotype as early as possible. The genotype of an animal is fixed at fertilization (Seidel, 2010). Commonly in animal breeding, we carry out the selection process at the adult stage when we can
observe production traits like milk production, but theoretically selection could take place anytime after the fertilization stage. Now, with the advent of genomic selection we can take advantage of this. We can do this by taking a sample of genetic material from the animal and send it away for SNP analysis and subsequent breeding value calculation. So, with this in mind, we can take a sample at birth (or even earlier) which will allow the farmer to make decisions about that calf much earlier.
The traditional progeny testing system in Australia is like many other developed countries. It involves bulls being born, assessed for health, purchased and grown to puberty before semen is then collected and distributed to farms for insemination so that the offspring can be progeny tested. In the past this process has taken approximately 6 years. Now, when young bulls reach puberty a breeding value can already be available and hence their semen can be sold based on this information. This allows for a decrease in the generation interval of around 4 years which can lead to a dramatic increase in the rate of genetic gain.
ADHIS has recently released its April ABVs (Australian Breeding Values) which is their first release of breeding values incorporating genomic information (ADHIS, 2011). With this release, Australia has now joined the already growing number of developed sectors utilizing genomic selection including the United States, Canada, New Zealand, the Netherlands and other European countries (Hayes et al., 2009a; van Raden et al., 2009)
It is important to note that although genomic selection allows for the selection of animals prior to progeny testing, it will not eliminate the need for performance recording. This is because these records are needed to continually re-estimate the effects the genes associated with the SNP markers to maintain and increase the

Page | 121
accuracy of the breeding value estimations (Hayes et al., 2009a).
Developing Dairy Sectors
Livestock is extremely important to the livelihood of people in developing nations and it has been estimated that it contributes to approximately one third of their total value of agricultural output (Bruinsma, 2003). Hence, the use of marker-based selection has been seen as a possible method of genetic improvement to aid in mitigating food security issues in these areas. This is a widely debated issue as developing countries are challenging environments where many other constraints are likely to cause problems with any type of genetic improvement scheme (Marshall et al., 2011).
In many developing dairy sectors smallholder farmers are working with small herd sizes and have a very low input system. This generally leads to health problems, high mortalities and vast nutritional, reproductive and management differences (Marshall et al., 2011). Farmers do tend to have a breeding plan and select animals based on some criteria, but typically fail to record any pedigree or production related traits (Marshall et al., 2011).
With these problems in mind, it would be a major shortcut to selection if genetic samples could be taken from animals in the developing country populations and put into the breeding value prediction equations already determined in places like Australia. This would immediately increase their accuracy of selection and decrease their current generation interval dramatically. However, literature has demonstrated that prediction equations derived in one breed do not do well in estimating breeding values for other breeds. Furthermore, estimations on animals using prediction equations from individuals in different environments are also very inaccurate (Hayes et al., 2009b; Marshall et al., 2011).
Following this, it would then be necessary for each population of dairy animals to have its own performance records to be able to develop their own genomic breeding values. Looking at the reference populations in countries already using this technology, this would have to be in the order of at least 650 progeny tested bulls with highly accurate estimated breeding values (Hayes et al., 2009a).
For example, if we look at Pakistan and its developing dairy sector. It is one of the largest milk producing countries in the world with over 50 million cattle and buffalo. The Sahiwal cow is the primary indigenous milking breed of cattle in the country, but there are many other local, exotic and cross bred cattle. Currently there is one major Sahiwal cow progeny testing system being run in Pakistan and this is by the Research Centre for the Conservation of Sahiwal Cattle. Their records show that presently there are approximately 790 milking animals being recorded coming from 90 different sires. This number could be increased by adding historical records but, problems will then arise from obtaining genetic samples from them. This is a very low number and a typical example of a developing dairy sector and hence the need for a very large reference population will be a major barrier to implementation of this technology in developing countries (Marshall et al., 2011).
Despite the challenges discussed, it does not mean that developing nations should give up on genomics altogether. The future holds many possibilities where marker based selection can aid in genetic improvement. Similar to already developed dairy sectors, genomic selection, when combined with reproductive technologies can have a great effect on genetic gain (van der Werf & Marshall, 2005). This is not going to happen immediately. Instead developing nations should be prepared by starting to increase their reference population and recording progeny testing information as well as starting to take and

Page | 122
store genetic samples where possible. This will enable them to capitalize in the future and take advantage of genomic selection when the costs are reduced and the science is developed enough to overcome some of the challenges that they are currently faced.
Conclusions
Genomic selection is an exciting development which is likely to revolutionize the world of breeding and genetic improvement. It provides farmers with an additional tool to increase their accuracy of selection and as well as providing an opportunity to drastically decrease the generation interval of their herd. It has recently been implemented in Australia with the first release of genomic selected dairy bulls being tested through ADHIS.
This technology also provides an opportunity for some benefits in developing nations. However, it is likely that this will require accurate performance recording within their own countries before genomic selection with will be of any use.
References
ADHIS (2011) Australian Dairy Herd Improvement Scheme. Melbourne, Victoria.
Bruinsma, J. (2003) World Agriculture: Towards 2015/2030. Earthscan, London: An FAO Perspective.
Falconer, D.S. & Mackay, T.F.C. (Eds.) (1996) Introduction to Quantitative Genetics. Harlow, England: Pearson Education Limited.
FAO (Ed.) (1995) World Watch List for Domestic Animal Diversity. Rome.
Goddard, M.E. & Wiggans, G.R. (Eds.) (1999) Genetic improvement of dairy cattle. Oxon, UK: CAB International.
Hammond, K., Graser, H. & McDonald, C.A. (Eds.) (1992) Animal Breeding: The Modern Approach. Sydney, Australia: Post Graduate Foundation in Veterinary Science.
Hayes, B.J., Bowman, P., Chamberlain, A.C. & Goddard, M.E. (2009a) Invited review: Genomic selection in dairy cattle: Progress and challenges. Journal of Dairy Science 92, 433-443.
Hayes, B.J., Bowman, P.J., Chamberlain, A.C., Verbyla, K. & Goddard, M.E. (2009b) Accuracy of genomic breeding values in multi-breed dairy cattle populations. Genetics, Selection, Evolution 41(51).
Marshall, K., Quiros-Campos, C., van der Werf, J. & Kinghorn, B. (2011) Marker-based selection within smallholder production systems in developing countries. Livestock Science 136, 45-54.
Nicholas, F.W. (Ed.) (2003) Introduction to veterinary genetics. Melbourne: Blackwell Publishing Ltd.
Seidel, J.G.E. (2010) Breif introduction to whole-genome selection in cattle using single nucleotide polymorphisms. Reproduction, Fertility and Development 22, 138-144.
van der Werf, J. & Marshall, K. (Eds.) (2005) Combining gene-based methods an reproductive technologies to enhance genetic improvement of livestock in developing countries. Netherlands: Springer.
van Raden, P.M., van Tassell, C.P., Wiggans, G.R., Sonstegard, T.S., Schnabel, R.D., Taylor, J.F. & Schenkel, F.S. (2009) Invited Review: Reliability of genomic predictions for Noth American Holstein bulls. Journal of Dairy Science 92, 16-24.
Willis, M.B. (Ed.) (1998) Dalton's Introduction to Practical Animal Breeding. Oxford: Blackwell Science.

Page | 123
THE HUNTER PROJECT: USING FUTURE DAIRY RESEARCH ON COMMERCIAL DAIRY FARMS ANTHEA LISLE AND KERRY KEMPTON Anthea Lisle – Livestock Officer Dairy, NSW DPI, Scone Kerry Kempton – Technical Specialist Dairy, NSW DPI, Tocal Neil Griffiths – Acting Technical specialist, Coastal Pastures, NSW DPI, Tocal Greg Mills – Livestock Officer - Industry Development, NSW DPI, Moree
Executive Summary
Six farmers in the Hunter region have been central in a project monitoring the decision making processes and efficiency outcomes of implementing Complementary Forage Systems (CFS) on their farms as demonstrated through FutureDairy research. Five farms implemented various pieces of information from the FutureDairy research results in ways that fitted with their existing farm management goals, and one farm was monitored as a control comparison. All six farms increased their home grown feed utilisation throughout the two years of monitoring; all six farms reported increased confidence in making feed-based decisions, and farmers reported that use of the CFS principles had placed their businesses in a lower risk position due to the planning processes inherently involved. The farms achieved the results without significant capital expenditure or increased infrastructure. There have been a number of benefits to farms identified, both in technical areas and in social or learning benefits to farmers.
Overview of Future Dairy Research
FutureDairy is an industry-driven national project investigating alternative systems to increase on-farm productivity and innovations that have the greatest potential to impact on farmers' economic well-being and lifestyle. FutureDairy’s primary investors are Dairy Australia, NSW Department of Primary Industries, The University of Sydney and DeLaval. In addition, the project receives support from Dairy NSW and The Dairy Research Foundation.
The logic behind FutureDairy’s research is based on the need for increasing:
• Labour efficiency and lifestyle to make the industry a more attractive one in which to work to encourage future generations of farmers to remain on-farm;
• On-farm productivity to counteract the adverse effects of increasing cost of resource inputs.
Specifically, the feed base goal of the FutureDairy project is to sustainably intensify home grown feed on farm, to enable more efficient use of land, water and grain. The main investigation has been a Complementary Forage System (CFS), involving triple cropping up to 35% of the farm area, with pasture covering the remaining 65%. Trial results on the University of Sydney’s research farms have resulted in yields of 40tDM/ha on the area dedicated to the Complementary Forage Rotation (CFR), and an average of 25tDM/ha across the whole farm area.

Page | 124
The progress to date of the Hunter Project
A key component of taking research findings such as CFS into the market for the target audience (farmers) is to show that research will still work when applied to commercial farms, and as such, the Hunter Farm Project was launched in July 2009. Six farmers were enlisted to work together with the research and extension teams (Future Dairy’s research team and NSW DPI Extension Officers Kerry Kempton, Anthea Lisle and Neil Griffiths) to ground truth the research.
According to the Dairy Australia’s definition of Feeding Systems, four of the farms could be described as System 2 (Pasture plus other forages with moderate to high concentrate feeding in bail), and two farms could be described as System 3 (Partial mixed ration with or without concentrate feeding in bail). These two feeding systems are by far the most common within the Hunter Valley dairy industry. Only two of the farms had grown maize for silage in the past, and the other four had no experience with bulk crop silage. All of the farmers were keen to increase home grown feed and reduce their reliance on purchased feed where possible; they also had the resources and desire to try new approaches to forage production and were prepared to provide farm data
Throughout the two years of the project, feed budgets and production targets were set, and an action plan put into place to guide the farmers in achieving their goals. A monthly monitoring and reporting process was put into place, tracking feed utilisation, feed quality and intake, and calculating feeding costs and returns. A photographic diary of pastures and crops on farm was kept across the two years, and farm walks and group discussion of short- to medium- term challenges occurred regularly. Special attention was paid to the cost and productivity of the CFR area, to monitor what contribution that area made to whole farm production.
The first 12 months of the collaborative process for Future Dairy Stage 2 has been successful in farms moving towards their individual goals. All of the six increased forage production significantly on the part of the farm targeted for applying the CFS principles. For most this translated into extra home grown forage over the whole milking area, and decreased their costs of home grown feed as well. However, two of the farms did not make significant increases, mainly due to other factors outside of the scope of the project. Whilst it is too early at the time of writing this paper to have measured the home grown fodder for the 2010/11 year, early indications show that most farmers have improved home grown feed and reduced reliance on purchased feeds overall.
Technical outcomes
Maize production/CFR area production over 12 month periods
Table 1 shows the production of the CFR areas for four of the farms, all of whom grew bulk silage in both of the summer periods of the project life. The data shown is that of 2 rolling 12 month time periods, the first being from the sowing of the bulk crop in late spring 2009 to the preparation for the next bulk crop in late spring 2010; the second time period is from the sowing of the winter forage crop in March 2010 to the harvest of the bulk summer crop in February 2011.

Page | 125
Table 1: Dry matter yield from the CFR area on four of the Hunter farms over two rolling 12 month periods.
Yield (tDM/ha) from the CFR focus area of each farm
Farm (Crop cycle on the CFR area from November 2009 – Feb 2011)
CFR area
Nov 09 –Oct 10
CFR area
Mar 10 – Feb 11
Farm 1
(Maize - brassica and ryegrass - maize)
35.78 34.88
Farm 2
(Maize – ryegrass – maize)
27.20 27.70
Farm 4
(Maize – volunteer maize, brassica and ryegrass – maize)
33.87 34.57
Farm 6
(Two crops of maize – triticale and maple peas – single maize crop)
32.2 22.90
As can be seen in Table 1, the yields varied greatly between the 4 farms. All of the farms had high goals for their own farming systems, and all four growing bulk crops for silage two seasons in a row have identified management of the bulk crop as their major focus challenge for the next season.
Soil moisture monitoring
After the first summer crops were harvested from the CFR areas, there was discussion around the possible reasons for maize yields being lower than expected. Nutrient status and sowing rates and other management seemed adequate to achieve higher yields, and the most obvious area for investigation was soil moisture. As such, soil moisture monitoring equipment was installed on all 6 farms – 4 systems included a Hansen data logger and 6 Watermark gypsum block sensors buried at 2 depths (20 cm bellow surface and 50cm below surface) across the CFS area allowing analysis of the soil moisture at different depths. The other 2 soil moisture monitoring systems were GDot systems from MEA, giving the farmer a visual indication of soil moisture tension, with a “traffic light” system to alert farmers of times when soil was drying out, but did not log the data. For the soil types on which the 6 Hunter farms are growing bulk crops and pastures, the general recommendations for soil moisture tension are between 10 centibars and 60 centibars. If the soil in root zone is measuring moisture tension of 60 centibars, pasture and forage plants are likely to be experiencing moisture stress. Farmers in the Hunter group with the data loggers installed on farm were aiming to maintain soil moisture tension between 10 and 45 centibars.
Page | 126
The logged data across the growth period of the 2010/2011 maize crops reflected the variation of moisture management (irrigation scheduling) across the three farms that grew maize on a CFR area. Farm 1’s soil moisture sensors placed at 20cm below the surface recorded soil moisture tension of less than 10 centibars for a significant period across the growth of the crop, indicating that the plant roots may have been experiencing water logging during these times. Farm 2 showed a very regular pattern of wetting up, gradually drying out only to a point where the plants were not likely to be experiencing severe moisture stress, before wetting up again. However towards the end of the growing period, the lower sensors were under much higher soil moisture tension – the farmer recorded a mechanical breakdown at this time, and consequently the soil profile at 50cm depth dried out. Farm 3’s logger recorded large variations in soil moisture tension on the sensors placed at 20cm, and similarly to Farm 1, showed a large percentage of time with soil moisture tension less than 10 centibars ( very wet soil).
Those farmers with the non-data-logging GDot monitoring systems reported that the visual “traffic light” indicator confirmed that their planned irrigation scheduling was appropriate on any given day, and in one case gave the irrigation manager a much clearer indicator of when the soil was beginning to dry out, well before the plants were experiencing moisture stress. In the words of one farmer, “Moisture monitoring has been really useful to better match crop demand”.
Focus on home grown feed
One of the key drivers of profit on Australian dairy farms is the efficiency of home grown feed use. A major outcome for this group of 6 Hunter farmers has been the increased level of planning, resulting in them all growing and utilising more home grown feed, and less “reactionary” feed buying. Figure 1 shows the percentage of milk being produced from home grown feed, both grazed and fed back after conservation, across the 12 month period of 2010. In general, all farms follow a trend of relatively slow changes to the ratio of home grown to purchased feeds, resulting in a more consistent ration formulation and less sudden changes to the rumen. Although there are two points on the graph in which milk from home grown feed decrease dramatically, these are isolated points and have been highlighted to the farmers as management focuses for the coming year.
An interesting feature of this graph is the similarity in the shape of the curve across all farms, as shown in the “average” data series; in a region with similar water security and climatic conditions, this similarity is to be expected, but also noticeable is the range of actual percentages between the farms each month. This is a reflection of the range of intensity (stocking rates and per cow production) of production systems in the group.
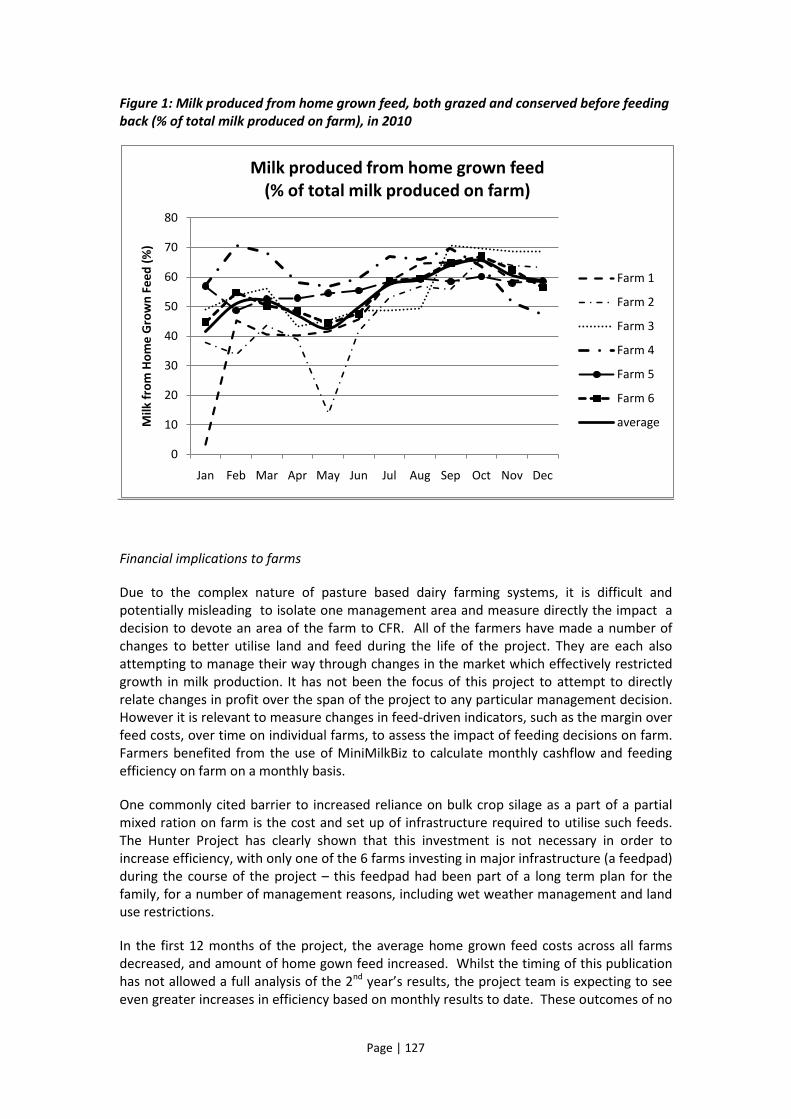
Page | 127
Figure 1: Milk produced from home grown feed, both grazed and conserved before feeding back (% of total milk produced on farm), in 2010
Financial implications to farms
Due to the complex nature of pasture based dairy farming systems, it is difficult and potentially misleading to isolate one management area and measure directly the impact a decision to devote an area of the farm to CFR. All of the farmers have made a number of changes to better utilise land and feed during the life of the project. They are each also attempting to manage their way through changes in the market which effectively restricted growth in milk production. It has not been the focus of this project to attempt to directly relate changes in profit over the span of the project to any particular management decision. However it is relevant to measure changes in feed-driven indicators, such as the margin over feed costs, over time on individual farms, to assess the impact of feeding decisions on farm. Farmers benefited from the use of MiniMilkBiz to calculate monthly cashflow and feeding efficiency on farm on a monthly basis.
One commonly cited barrier to increased reliance on bulk crop silage as a part of a partial mixed ration on farm is the cost and set up of infrastructure required to utilise such feeds. The Hunter Project has clearly shown that this investment is not necessary in order to increase efficiency, with only one of the 6 farms investing in major infrastructure (a feedpad) during the course of the project – this feedpad had been part of a long term plan for the family, for a number of management reasons, including wet weather management and land use restrictions.
In the first 12 months of the project, the average home grown feed costs across all farms decreased, and amount of home gown feed increased. Whilst the timing of this publication has not allowed a full analysis of the 2nd year’s results, the project team is expecting to see even greater increases in efficiency based on monthly results to date. These outcomes of no
0
10
20
30
40
50
60
70
80
Jan Feb Mar Apr May Jun Jul Aug Sep Oct Nov Dec
Milk
from
Hom
e G
row
n Fe
ed (%
)
Milk produced from home grown feed (% of total milk produced on farm)
Farm 1
Farm 2
Farm 3
Farm 4
Farm 5
Farm 6
average

Page | 128
necessary investment in infrastructure, and a probable increase in home grown feed utilisation and decrease in home grown feed costs, have shown that the use of a CFS system has not placed this group of farmers in a higher risk profile, as discussed later, farmers actually feel that they are now in a lower risk environment than prior to implementing the CFS.
CFS as a part of whole farming system
The intensity and production goals of the farming system are important considerations when implementing the CFS principles, and each of the six Hunter farms took elements of the CFS that suited them and implemented the principles in different ways that suited their farm resources, business goals and preferred mode of farming. The growing and utilisation of home grown feed is one factor of the CFS, but another is the integration of the CFS principles into a whole farm context. For example, a sustainable utilisation rate of pastures is an important principle within the CFS guidelines, rather than a maximum utilisation. This goal of sustainable utilisation should influence management decisions around calving pattern, species choice, and the types of feed imported onto the farm.
Managing the whole farm in the context of the CFS principles has implications for the management of non-feed areas as well - as one farmer commented, “Implementing the CFS approach throws up more options for managing the farm. But just growing more feed and putting it in front of the cows doesn’t mean you’ll make more money. You also have to be better with your herd management, monitoring cow fertility, and better at conserving fodder. Otherwise you won’t get the benefits. ” Planning for all areas of management on each individual farm is vital.
In year 2 of the project, each of the farmers has made up his own version of CFS, some similar to year 1 and some quite different. The decisions have been made in the whole farm context and for various reasons. The drive to grow more dry matter per hectare has been tempered by the need for higher quality forage as well.
The full impact of the second year implementation will not be fully understood until after the next whole farm review and Milk Biz analysis at the end of the 2010/11 year. However, indications are that most of the six farms will have again increased home grown feed productions over the previous year.
Feed test data
Nutrient testing was carried out on feed tests from each farm on a fortnightly basis, testing whatever feed type the miking herd was offered on that day. This information was fed back to the farmers on a regular basis, in the form of an easily manipulated Excel spreadsheet, from which the farmers were able to select the farm sampled, the species type or the date harvested for comparison.
This feed data was used to increase the accuracy of feed efficiency analysis using the MilkBiz and MiniMilkBiz programs for each farm, and all of the farmers gained knowledge of the shift in feed quality across the seasons and between varieties. This knowledge was then used in further farm planning. The analysis has also added greatly to the DPI dairy team’s knowledge of feeds quality, and the potential use of mixes such as brassica and pastures of brassica and forage sorghums.

Page | 129
Refinement of MiniMilkBiz
MiniMilkBiz is a simple-to-use, yet powerful decision support tool, designed to calculate the feed use efficiency of a farm along with the daily cash flow implications of feeding decisions. In its early stages of use, MiniMilkBiz reported simply on the cash flow performance indicators of the business, along with a very basic set of physical performance indicators such as total pasture production per hectare. The Excel®-based program was initially thought to be adequate for the purposes of the FutureDairy project; however a number of features that would be of additional benefit were soon identified. For example, the contribution of each feedstuff to the milk production on farm; the nutrient density of the diet; the average cost of purchased and home grown feeds. Perhaps the greatest addition has been the description of the milking area being grazed in each reporting period (in this project, a monthly period) – this distinction has led to a much more accurate calculation each month of home grown feed utilisation, verified by a direct comparison to the annual figure calculated in MilkBiz – this annual figure for all six farms was very similar to the addition of the twelve monthly data sets form MiniMilkBiz.
Social outcomes
Less risk perceived by farmers
Confidence in a technology or the likelihood of its positive impact on farm is often cited as a barrier to implementation/change on farm. In the case of implementing CFS on commercial farms, a major consideration in the setup phase is the allocation of a portion of the farm – up to 30% in this group of farmers – to growing a bulk crop, effectively reducing the grazing area available to cows in that period. The group of Hunter farmers all managed to successfully negotiate this potential feed gap in the first summer, and gained confidence from the experience. Taking the risk of growing a maize crop paid off by lowering the reliance of buying in hay or silage in the winter, when the farmers are price takers and quality and supply can be variable. All of the Hunter farmers feel that there is less risk involved when using the CFS principles, due to the increase in good and effective planning that comes with the increase in crop production.
Whole farm management
Three of the farms involved have had challenges in managing all aspects of the farm business while focussing on a relatively large intensively farmed area. Other (non-feed) areas such as herd health and reproduction can have large implications on farm productivity and profitability if not monitored and maintained. These challenges are reflective of the multi-faceted business of dairy farming, where focussing intently on one aspect of management can result in great improvements. However, taking focus off the rest of the business can have severe implications too.
Co- learning
Apart from the principles of CFS being implemented on the farms, the farmers reported great benefit from being involved in a group of farmers who were co-learning and being supported both by advisers and other farmers. This is an important factor of the project, and one that should be considered as a part of the implementation of any management-changing technology such as CFS. Any of these farms could have implemented CFS on their farms and may have experience different degrees of success in different years. However the co-learning experience of the group has allowed each farm to learn from others why success

Page | 130
or failures have occurred and what changes have been made to improve production in the next year. Being involved in a group that is focussed on growing more feed has given the farmers involved confidence to experiment with species and mixes that they may not have otherwise considered. A degree of trust and respect has been built up between the members of the project team, which then fosters robust discussion and challenging of decisions during the farm walks.
Maturity of conversations/internalisation of terminology
The project team has observed an increase in understanding by the farmers of the CFS principles, and feed production systems in general, shown by a maturing in the levels of discussion between the group members. At the beginning of the FutureDairy process, most discussion was centred around specific crop choices and management. Towards the end of the second year, discussion with farmers is focussed on planned crops choices for the coming 12 (or more) months, and the potential implications across the whole farm business.
Future directions
For the six Hunter farms
Each of the farms will once again have a MilkBiz analysis performed on the farm’s 12 months production, and will compare the last two Milk Biz analyses to fully assess the overall impacts of decisions made on farm since 2009. All farmers have expressed a desire to continue functioning as a focus group, and are interested in exploring further interpretations of CFS principles. All farmers plan to make further use of the soil moisture monitoring devices in the coming seasons, and plan to use the logged data more proactively for scheduling than in the future. One farmer plans to upgrade the equipment further to make even better use of the technology, with direct feedback from the logger to the farm computer.
The yield from bulk crops in particular was highlighted as a limiting factor on the CFS area for at least two of the Hunter farms, and in the coming 12 months extra agronomic and irrigation planning will be the focus for those farms. The management issues highlighted on each farm were all different, and consequently the planning to increase production will also be individual and unique to each farm. One farmer summarised the intentions of all when he commented, “This system has made the transition between seasons so much smoother – we will be continuing with our focus”.
For the other aspects of the project
From the feed test data, NSW DPI plans to expand the existing feed quality library that is currently in use in the dairy feeding decision support tools. The expanded library will allow users to link to example photographs of each feed type and quality, allowing a more informed use of the quality data in farm business management.
The refinement and modification of the MiniMilkBiz program has led to the development of a simple, user friendly, yet powerful ready reckoner for use by dairy farmers and advisers. The latest version of MiniMilkBiz is in its final stages of preparation for publication on the internet. Access to a decision support tool of this level of sophistication, along with its ease of use, has great potential benefit to industry.
Page | 131
Acknowledgement of the project team
The collaborative process has functioned with the following support:
Future Dairy Research Team: Assoc Prof Yani Garcia (Project Leader)
Ajantha Horadagoda (Laboratory Manager)
NSW DPI: Anthea Lisle (Livestock Officer – Dairy)
Kerry Kempton (Technical Specialist – Dairy)
Neil Griffiths (Acting Technical Specialist – Coastal Pastures)
David Deane (Technical Officer)
Michael Ison (Livestock Officer – Dairy)
Greg Mills (Livestock Officer -Industry Development)
Private industry: Andrew Farr (technical support)
Dr Neil Moss (consultant to 3 of 6 farms)
Page | 132
AN INVESTIGATION INTO THE FLEXIBLE USE OF FORAGE SYSTEMS IN NORTHERN VICTORIA: THE FORAGE PLANNING EXERCISE
MICHAEL CAMPBELL
S.C. GarciaA, P.W. WynnB and M.A. CampbellAC
AUniversity of Sydney, Camden, NSW, Postcode BCharles Sturt University, Wagga Wagga, NSW, 2650 CCorresponding author. Email: [email protected]
Abstract
The use of forage planning is commonly used in dairy production systems in Australia to varying degrees. The value of forage planning is in determining the optimal feedbase system to produce the nutrients to match the requirements of the milking herd. The use of a forage plan can allow the farmer to make decisions on how to achieve production goals and herd expansion goals. This paper explores the use of a simple spreadsheet model to develop a forage plan that allows an increase in milking cow number on a case study farm. The results of using the model show that it is possible to increase the number of milking cows on the same area of land by utilising forage crops and that this scenario is profitable.
Additional keywords: feedbase, forages, dairy systems.
Introduction
This paper explores the use of a forage plan on a case study dairy farm located in Northern Victoria. The case study farm is one of four farms that are participating in a monitoring project being conducted through Future Dairy.
The project is investigating how different forages are being utilised by farmers in the Northern Victoria irrigation region. The main limiting factor to production in this region is the availability of irrigation water and so one of the important measurements from any of the systems is the efficiency of converting irrigation water into litres of milk.
Previous Future Dairy work investigated the use of complementary forage rotations
at The University of Sydney Farms at Camden. In this project it was determined that it is possible to grow over 40tDM/ha using s triple crop program (Garcia et al. 2008). The results from this trial were then incorporated into a farmlet trial and further modelling to investigate how the use of this complementary forage rotation would fit into a commercial farm.
The Future Dairy project in Northern Victoria aims to investigate how these forage rotations might apply to a commercial farm in this region through the use of case study analysis and modelling.
An economic analysis of the CFR in Northern Victoria was conducted by Armstrong (2007). In this analysis a clear message was that yields of the CFR needed to be over 28-30tDM/ha to be a profitable

Page | 133
option for two case study farms. There is potential in the Northern Victoria region of achieving this target yield depending on the seasonal weather conditions and management of the production of forages.
It is accepted that there are three main types of feed plans required for successful grazing management (Herd et al. 2004).
i) A feed profile – a long-term strategic plan for making decisions on carrying capacity, calving periods and the need for supplementary feeding or conservation.
ii) A feed budget - a medium term tactical plan (weekly to 3 monthly) involving decisions on pasture deficits and surpluses at a certain time during the year.
iii) A grazing plan – the day to day operational decision on allocating pasture to cows.
All of these types of plans require the nutrient requirements of the cow and the nutrient availability of the different feeds to be determined. There is an availability of different models and decisions support tools that enable the supply and demand of nutrients to be analysed.
The forage planning exercise that was undertaken as part of the project is at the level of a feed profile of the farm but also provides useful information for the feed budget level.
The use of forage planning in the dairy industry is a helpful tool for managing the feedbase of a dairy farm. It can have a significant positive effect on the planning of what forages to grow in a dairy farm system. The use of a forage plan allows the farmer to plan the purchase of inputs such as fertiliser and feed supplements more accurately while also showing how different forages may better meet the requirements of the cow.
With the use of a forage planning model the farm can see the opportunities to utilise more home-grown feed (HGF) through the increase utilisation or production of the current feedbase or through using alternative forages.
Materials and methods
The four case study farms were selected based on their willingness to work with the Future Dairy project and having the common objective of increasing the amount of feed grown at home. The farms have been monitored on a fortnightly basis with feed samples collected and analysed. Milk production and water use for the farms has been collated during the monitoring period.
The forage plans were established using a spreadsheet model that captures feedbase information and cow production data. The model then uses a back calculation to provide an estimate of the forages and graphically shows the fit of the feedbase with the production requirements of the herd. The model also shows the required areas of silage and hay production based on inputted yield estimates. The final output of the model is a financial analysis of margin over feed costs (MoFC).
The forage planning process was undertaken with the farmer. They provided the plan as to what areas of the farm were to be planted to different forages and then this was put into the model. The physical farm milk production was obtained from the farmers.
Case Study Description
The case study farm is located near Katunga with 450mm annual rainfall with winter dominance. It is owner operated with one full-time staff member who assists with all operations. The farm has 110ha of milking area and currently milks 250cows at peak with 60% calving in autumn and 40% in spring. The irrigation water allocation is 405ML from the system

Page | 134
and 284ML of bore allocation, totalling 689ML.
The feedbase of the farm consists of 90% ryegrass pasture (both annual and perennial) and 10% lucerne. The surplus pasture in spring is conserved as silage and hay and fed back to the milking herd from January to early April. The average quality of the silage harvested in spring 2010 was 9MJ/ME and 12%CP.
The milk production is averaging 5000L/cow with 250kg butterfat/cow.
The farmer has the goal to maintain a pasture based dairy while increasing to 320milking cows. The farmer also does not want to increase the amount of grain being fed per cow.
The feed planning process involved setting up a base year for the farm. The farmer provided a plan of the feedbase as he proposed and it was matched to the actual cow production data. An alternative feed plan that included growing maize to be fed as a substitute for some of the concentrate was developed. A third feed plan was developed to address the goal of the farmer to want to increase the peak number of milking cows to 320. Maize yield was estimated at 18tDM/ha.
Results
The composition of the diet for the base year was calculated using farm data and is shown in Figure 1. It shows that HGF contributes 74% of the dry matter in the diet. Purchased concentrates contribute 26% of the dry matter in the diet.
Figure 1. Percentage dry matter contribution to the diet in the base year.
The composition of the diet when maize silage was included in the feedbase is shown in figure 2. The contribution of HGF has risen to 86% and pasture still makes up the majority of feed in the diet.
Figure 2. Percentage dry matter contribution to the diet when maize silage is used.
Figure 3 shows the composition of the diet with an increase to 320cows and the inclusion of maize as a forage crop. The percentage contribution to the total diet from purchase concentrate is 25% while the HGF contributes 75%.

Page | 135
Figure 3. Percentage dry matter contribution to the diet when maize is included and milking 320cows.
The results in table 1 outline the key differences between the 3 scenarios. The inclusion of maize in the feedbase results in an increase of $19,022 in supplementary
feed costs. The MoFC has increased by $101/ha, along with an increase in total milk production but the efficiency of converting to irrigation water to litres of milk has dropped by 289L/ML.
The comparison of the base year with the 320cows scenario shows an increase of $521 in MoFC which is a 14%increase on the base year with total milk yield increasing by 365,959 litres.
The total supplementary feed cost increases from a base year of $96027 to $182,408 when milking 320cows. The irrigation water use efficiency increases by 176L/ML with an increase in milking cow numbers and the inclusion of maize in the feedbase.
Table 1. Comparison of base year, using maize silage and increasing to 320 cows.
Base Year -250Cows Base Year + Maize Silage 320 Cows + Maize
MoFC ($/ha) $3653 $3754 $4174
Total Irrigation Water (ML)
439 519 535
Total Litres of Milk
1,243,543 1,319,940 1,609,502
Litres of milk/ML water (l/ML)
2832 2543 3008
Supplementary Feed Cost
$96,027 $115,049 $182,408
Discussion
The results of the three forage plans show that it would be possible for the farm to increase to milking 320cows on the same area of land with a change in the forages grown and without increasing the amount of concentrate fed per cow.
The results also indicate that the MoFC would be greater at the higher milking cow number even with the increase in
supplementary feed cost (which includes the cost of growing and harvesting the maize). While it is noted that MoFC is not an absolute measure of profitability it is an performance indicator for the business.
The model used estimated maize yields of 18tDM/ha which is considered by other farmers in the area to be achievable. There is published evidence of maize yielding in excess of 20tDM/ha (Pritchard, 1987) in the Northern Victoria Irrigation region but this

Page | 136
requires favourable seasonal conditions and also a longer growing period.
In the forage plan Maize was followed with an annual cereal that grew from May to October to allow for the Maize to be planted and harvested. The utilised yield of the winter cereal was only 3.5tDM/ha which is considerably lower than would be expected. There would be other higher yielding options that could increase the total yield from the same area. The use of forage brassica may have potential to provide a high quality and yielding forage during the autumn and early winter period.
The increase in efficiency of converting irrigation water into litres of milk requires more analysis. While the results of the model show the potential to measure irrigation water use in terms of product output it does not capture the risk of using water during varying times of the year or to complement rainfall during winter and spring. With water being a major limiting factor to dairy production in Northern Victoria it needs to be considered in all feedbase analysis and measured in relation to the product output not just total water used.
Further analysis of the capital improvements required on the farm would need to be conducted if the maize option was adopted. There are various low cost options to store and feed maize without having to invest in a concrete fed pad or a mixer wagon. These capital improvements would need to be considered in a full business analysis to fully understand the impact on the long-term profitability of the business.
The case study described above shows that the use of a forage plan may help farmers to be more profitable. The use of alternate forage crops compared to traditional pastures has the potential to reduce the reliance on off-farm feed such as concentrates.
Acknowledgements
This work was supported by Dairy Australia through the funding of Future Dairy and a PhD scholarship.
References
Garcia S.C., Fulkerson W.J., Brookes S.U. (2008) Grass & Forage Sci. 63, 284-300.
Heard J.W., Doyle P.T., Wales W.J., Stockdale C.R. (2004) Anim. Prod in Aust. 25, 89-92.
Pritchard K.E. (1987) Aust J. Exp. Agric. 27, 817-823.
Page | 137

Page | 138
APPLICATION OF FUTUREDAIRY AND 3030 PROJECT KEY FINDINGS ON FARMING SYSTEMS IN VICTORIA
SANTIAGO FARIÑA Intelact Australia Pty. Ltd. Correspondence: [email protected]
THE FUTUREDAIRY AND 3030 PROJECTS
This article summarises some of the outcomes and on-farm application of research findings from two feedbase research projects in Australia: the FutureDairy Project (FD) and the 3030 Project (3030). The author has both completed his doctoral thesis and worked as a research officer within the Feedbase area of FD and is currently working in the extension phase of 3030.
FD and 3030 common grounds
Both FD and 3030 are research and extension projects that have been running for more than 6 years with a common objective: “the development of systems aimed at increasing dairy farm profitability by increasing the consumption per ha of home-grown feed”.
In both projects the long-term vision was to provide solutions going “beyond” what is achievable from best possible management of perennial ryegrass. In this way, rather than replacing perennial ryegrass, which has been the mainstay species of pasture-based dairy farms, the aim of these projects was to evaluate the use of forages that can complement perennial ryegrass in terms of the seasonal pattern of feed production and nutritive value. The “complementarity” principle was a common target of all the feedbase research conducted in both FD and 3030.
Both FD and 3030 have a comprehensive approach for the evaluation of feedbase research questions which included, in most cases, the following phases:
1. Plot and paddock scale studies: to evaluate a range of forage options (species and management alternatives).
2. Agronomic modelling: to estimate the impact of the forage options on farm systems.
3. Farmlet studies: as the initial assessment of the feasibility of the forage systems for their implementation on-farm (milk production and economic returns). In both FD and 3030 farmlets were run for at least 2 years.
4. Economic modelling: to test profitability and assess the business risk of forage systems under changing scenarios (climate and price variability).
5. Partner farms implementation: to evaluate the impact and practical implications of adopting some of the developed forage systems principles on commercial dairy farms of different regions.

Page | 139
FD and 3030 differences
The main difference between these two projects is related to the access to irrigation of dairy farms chosen as the main target of the research. Whereas FD has a focus on pasture-based dairy farms with access to irrigation water, 3030 targets pasture-based dairy farms on dryland.
There are also differences in terms of projects location, since most of the experimentation within these projects is being conducted in different regions of Australia.
FutureDairy has its base in Camden, NSW and has carried out on-farm experimentation in Gippsland, South Australia, the North Coast of NSW and more recently in the Hunter Valley region in NSW and the Northern Irrigation region in Victoria. The research work was led by a team from the University of Sydney.
The 3030 project, on the other hand, is mainly based in Terang, South-West VIC and has different partner farms spread from South-East SA to Gippsland and North-East VIC. The research work was led by a team from the University of Melbourne and the Department of Primary Industries of Warrnambool.
FD and 3030 areas of work
The diagram below details some of the key areas of work covered by the FD and 3030 projects within the feedbase “umbrella”:
Future Dairy
Double and triple forage crop rotations to achieve 40 t DM utilised/ha
Integration of crop rotations on pasture-based systems to achieve 30,000 L/ha from home-grown feed.
Business risk analysis of intensification alternatives
Water and N use efficiency of forage crops
Comparison of strategies to increase milk/ha: stocking rate vs milk per cow
Palatability and ruminal nutrition of forages and their combinations
3030
Double forage crop rotations (e.g. brassica + cereal species)
Comparison of pasture only vs. pasture+forage crops system (forage yield, milk yield and profit)
Grazable species adaptable to summer drought andand soil conditions (e.g. tall fescue, chicory)
Modellling pasture yield long-term variability. and business risk of forage systems
Modellling business risk of pasture-based systems

Page | 140
FUTUREDAIRY AND 3030: WHAT IS APPLIED ON-FARM TODAY
The transference of knowledge from the research base to dairy farms in Australia is normally a slow process and, more often than not, the research outcomes fail to reach farmers and have an impact in the way they run their businesses.
There are several findings and innovations arising from the 6 years of work in the FD and 3030 projects which led to a range of research and industry publications. Not all of these findings have effectively reached the dairy industry. However, there are some of the key outcomes and learnings that have been adopted by farmers in Victoria and impacted their businesses to a range of different degree. A few examples of research outcomes and how they have shown to fit particular issues and necessities of some dairy farm systems are provided in this article. The experiences described below are the result of the individual analysis of several dairy farm businesses either under direct consultancy or as members of business discussion groups in Gippsland and Northern Victoria, together with some 3030 project partner farms.
Summer forage crops to reduce business risk
Research outcome (Future Dairy)
The FD project carried out a 3-year farmlet study to evaluate the integration of double and triple crop forage crop rotations (Garcia et al., 2008) on 35% of the milking platform of a pasture-based farm stocked at 4.7 cows/ha. As a result 25 t DM/ha/year of home-grown feed was consumed on average across the whole farm leading to a milk production of 28,000 L/ha/year from home-grown feed (Fariña et al., 2011). This concept was defined as the Complementary Forages System (CFS).
The CFS was compared to other intensification strategies that could achieve the same level of total milk production/ha but using a higher level of bought-in feed instead of a implementing a forage-crop rotation. This was done using long-term modelling of profit probability based on the variability of pasture and forage crops DM yields, prices of milk, concentrates, urea and irrigation water.
It was found that the CFS led to a lower level of risk (measured as probability of profit) than the system with increased bought-in feed. This was due to two reasons:
1. The forage crops allowed to diversify risk since their yields did not depend on the same variables as the yield of pasture.
2. The CFS had a lower exposure to concentrates and hay price risk than the system with increased bought-in feed.
Note: For more information on the CFS and risk analysis of forage systems see the next article by Fariña et al. on these proceedings.
Application on dairy farms (Northern Victoria)
The use of forage crops as part of renovation program is a common practice in Victorian dairy farms, with one of the most common options being the use of millet (Echinocloa utilis) as a summer crop. Although this crop is relatively cheap and easy to establish and graze, the DM yields are limited to 7-10 t DM/ha and the energy content rarely exceeds 9 MJ ME/kg DM.

Page | 141
In some high stocking rate irrigated dairy farms of Northern Victoria alternative summer crops to millet are being sought. This is because these systems need to increase DM yield/ha and quality of home-grown feed in order to reduce the use of bough-in feed in the diet of milking cows.
These farmers acknowledge that the reliance on bought-in feed during the periods of low pasture production (autumn-winter and sometimes summer) increases the exposure of the business to feed prices, and this can have a great impact on the cost of production.
The results of the FD studies and related experiences have led some farmers who are running high stocking rate systems to consider the inclusion of higher yielding summer crops with higher energy content such as maize. In most cases farmers aiming to use maize acknowledge that a strict irrigation regime should be followed to obtain the desired yields as they are aware of the fact that when a high DM yield (~20 t DM/ha) is reached, the cost per t DM may not be competitive.
Grazing management of “regrowth forage brassicas”
Research outcome (Future Dairy)
Autumn-sown forage brassicas (forage rape) within the triple crop rotation evaluated in the farmlet studies shown high DM yields (7-10 t DM/ha/year) under grazing conditions.
One of the key management aspects necessary to achieve the target yield was an accurate grazing allocation in order to leave a post-grazing residual of approximately 2,000 kg DM/ha. This level of residual allowed enough remnants for a quick recovery of the brassica plant and a rate of regrowth to achieve up to 3 grazings between April and August.
Application on dairy farms (Southern Victoria)
In southern Victorian dairy farms there is extensive experience in the management of summer brassicas, particularly turnips. This is related to the use of turnips as a break crop for the renovation of permanent pastures. The more recent implementation of double cropping (summer crops followed by autumn/winter crops) for the renovation of pastures and the ever increasing number of farms with a proportion of the herd calving in the autumn period has renovated the interest on annual forage crops that can provide feed in the autumn.
Since the normal practice with turnip is to graze only once and consume the bulbs, some dairy farmers have adopted the same practice with “regrowth forage brassicas” such as forage rape or leafy turnips with very poor or non-existing regrowth observed as a consequence. The FD recommendation to adjust allocation in order to allow for a post-grazing residual of approximately 2,000 kg DM/ha has allowed for the achievement of an increased regrowth, higher DM yields and , more importantly, more confidence among dairy farmers to manage “regrowth forage brassicas” in general. These brassicas do not offer higher yields than turnips but they can provide a more “spread” supply of grazable feed throughout the summer (or autumn in some cases).
For more information on forage brassicas management see the FuturDairy technical notes at www.futuredairy.com.au/technicalnotes.php

Page | 142
Grazing chicory in dry environments
Research outcome (3030)
Forage alternatives to complement pasture in the summer period have been extensively sought by the 3030 project. This is due to the typical decline in growth and reducing quality of pasture associated to high temperatures and risk of soil water deficits during the summer.
One of the alternatives being tested is chicory (Cichorium intybus) which is a summer-active short-term perennial herb of high nutritive value (+12 MJ ME/kg DM and +20 % crude protein) under grazing conditions.
One of the key features of chicory is its reliable summer growth, even under low rainfall conditions, due to its deep taproot system. The 3030 plot studies and implementation on partner farms highlighted that grazing frequency and intensity should be strictly observed to achieve potential nutritive value and persist beyond the 2nd year. The main objective of the grazing frequency control is to manage the proportion of leaf to stem in the DM available. This is because in the spring, after the winter vernalisation, the chicory plant will produce a reproductive stem of low nutritive value.
Another relevant feature of chicory is that is not affected by pests of significant negative effects on the crop. Only some pests such as lucerne flea, slugs and red legged earth mite can have some impact during early establishment.
Several plot studies showed its potential role as 2 to 4-year perennial crop (or more if allowed to self-seed), that can be sown together with annual or perennial grasses.
Application on dairy farms (Gippsland)
Although the use of chicory by dairy farmers is not a novelty, the lack of greater adoption of this species in the past has been associated with the loss of nutritive value and difficulty in its management. This was also probably related to the lack of knowledge on the cycle of chicory and how it can fit particular environments.
Led by the evaluation by the 3030 project and adoption on partner farms an increasing number of dairy farmers in the Gippsland region have been including chicory in their milking platforms. In most cases well drained paddocks typically on hilly country (see Fig. 1) are chosen, where perennial ryegrass was greatly affected by the lack of moisture during summer.
Figure 1. Chicory paddock in a farm near Warragul, VIC (December, 2010).

Page | 143
By maintaining a strict grazing rotation of chicory in spring and summer, some Gippsland farmers have achieved estimated yields between 7 and 10 t DM/ha, and more importantly of high nutritive value. They consider chicory a “forage concentrate” in terms of its feeding value.
Some farms in East Gippsland have adopted chicory in response to severe attacks of “redheaded cockchafers” which had consumed the roots of most grass species. Chicory plants are not affected by this insect.
For additional information on chicory see Jacobs et al. (2008).
Tall fescue: waterlogging risk and summer growth
Research outcome (3030)
Dairy farmers have normally associated tall fescue with low nutritive value and palatability issues. However, with the development of new cultivars and an increased understanding of the principles for an optimum management of this species, 3030 identified the need to re-assess the potential role of this forage option for southern Australian dairy farms. Tall fescue was subject to several plot, modelling, farmlet and partner farm evaluations by the 3030 project.
Plot and modelling studies showed a clearly greater summer growth than perennial ryegrass with at least similar nutritive value (summer grazing trials showed similar milk production from both species).
The adoption of tall fescue by partner farms showed evidence of the species being able to grow in less fertile soils (tolerant to a wider range of pH) and in waterlogging conditions, achieving higher persistency than perennial ryegrass (up to 7 years under adequate grazing management).
The higher temperature ceiling and deeper root system (up to 1.2 mt) of tall fescue allowed for a greater potential than perennial ryegrass to grow in hot and dry conditions. This potential was expressed only in paddocks where there was enough sub-soil moisture to be accessed by the plants.
A more strict grazing management than for perennial ryegrass is a necessary condition to achieve tall fescue’s potential nutritive value.
For more information on milk response to tall fescue see Tharmaraj et al. (2008).
Application on dairy farms (Gippsland)
Led by the 3030 experiences, some dairy farms in Gippsland are using tall fescue on a section of their milking platform. In most cases the areas chosen for tall fescue are paddocks with a high susceptibility to water logging or “flood plains” (see Figure 2). The density of the fescue pasture has shown not to be affected by the extensive periods (more than 3 weeks) of water logging conditions where ryegrass and chicory did not survive.
In addition, in those environments where the water tables can be accessed, fescue seemed to hold growth rates for an extended period beyond the peak of ryegrass.

Page | 144
Interestingly, the best anecdotal results were observed when the grazing frequency (i.e. “rotation length”) of fescue was set to be similar to the one for perennial ryegrass (except for an increased frequency in early spring to stop the negative effect of the start of the reproductive stage on nutritive value).
Figure 2. Tall fescue paddock in a farm near Gormandale, VIC (May, 2011).
Conclusions
Both FD and 3030 have developed forage options and strategies to increase the consumption per ha of home-grown feed beyond the potential of perennial ryegrass. Largely, they have targeted different environments where dairy farm systems face diverse issues in relation to the feedbase and the business risk related to these issues.
This article has shown brief examples of how particular principles and practices developed in FD and 3030 were identified and adopted by farmers of different dairy regions of Victoria with the purpose of improving the profitability of their business.
References
Chapman, D.F., Tharmaraj, J., Nie, Z.N. (2008). Milk production potential of different pasture types in a temperate southern Australia environment. Grass and Forage Science 63, 221-233.
Fariña, S. R., Garcia, S. C., Fulkerson, W. J. (2011) A complementary forage system whole farm study: forage utilisation and milk production. Animal Production Science 51, 460-470.
Garcia, S. C., Fulkerson, W. J., Brookes, S. U. (2008) Dry matter production, nutritive value and efficiency of nutrient utilization of a complementary forage rotation compared to a grass pasture system. Grass and Forage Science, 63, 284-300.
Page | 145
Jacobs, J. L., Ward, G. N., Kearney, G. (2008). The effect of dairy effluent on dry matter yields, nutritive characteristics, and mineral content of summer-active regrowth forage crops in southern Australia. Australian Journal of Agricultural Research 59(6) 578–588.
Tharmaraj, J., Chapman, D.F., Nie, Z.N., Lane, A.P. (2008). Herbage accumulation, botanical composition and nutritive value of five pasture types for dairy production in southern Australian. Australian Journal of Agricultural Research 59, 127-138.
For more information on the FutureDairy project go to: http://www.futuredairy.com.au
For more info on the 3030 Project go to: http://www.demodairy.org.au
Note: a new 3030 website is soon to be developed.
Page | 146
BUSINESS RISK OF PASTURE-BASED DAIRY INTENSIFICATION: INCREASING CONCENTRATES VS. ADOPTING A COMPLEMENTARY FORAGE SYSTEM
SANTIAGO FARIÑA
S. Fariña A. Alford, S. Garcia and W. Fulkerson *Correspondence: [email protected]
Introduction
Dairy farmers in Australia are under increasing cost/price pressures that undermine the profitability of their business including rising costs of land and water, volatility of international milk price and increasing cost of grain. In this context, systems to produce and utilise more home-grown feed/ha are being sought (Chapman, et al., 2008a). With this background, Garcia and Fulkerson developed the innovative concept of a complementary forage rotation (CFR). The CFR comprised an annual sequence of forage crops [maize (Zea mays L.), forage rape (Brassica napus L.) and Persian clover (Trifolium resupinatum L.)] that achieved high water and nitrogen use efficiency, and a utilised forage yield of more than 40 t DM/ha.year (Garcia, et al., 2008), double the on-farm potential of most pasture species.
In a recent whole farm study, Fariña et al. (2011) evaluated the integration of the CFR into a pasture-based dairy farm, introducing the concept of the Complementary Forages System (CFS). The CFS under study comprised an area of 35% CFR and 65% pasture. This resulted in over 25 t DM/ha.year of home-grown forage utilised and converted into 27,800 L of milk/ha.year, a level of production not previously achieved in pasture-based whole farm studies.
However, before the CFS will be considered by farmers, the economic performance and risk of implementing such an innovative system should be assessed and compared to alternative intensification options.
Business risk is the aggregate effect of uncertainty on the operating profit of a farm, independently of how the operation is financed (financial risk). A common method to assess the impact of risk on a farm business is stochastic simulation analysis (Antle, 1983; Cacho, et al., 1999). For this purpose, dynamic models are used to simulate the impact of inter-annual climate variability on a variable of production (such as forage yield) and, in turn, the effects of this variable on profit. To simulate price risk, the probability distribution of prices from a historical series can be used.
The objective of this work was to evaluate the profitability and business risk for a pasture-based farm intensified through the use of CFS, in comparison to another intensification alternative with increased use of concentrates.

Page | 147
Materials and methods
CFS field study
A 2 year whole farm study was conducted at Costorphine Dairy, The University of Sydney, Camden, NSW between May 2007 and May 2009. Of the total area of 21.5 ha, 65% was allocated to kikuyu pasture oversown to short rotation ryegrass (Lolium multiflorum) each autumn and 35% to CFR. Half the CFR area comprised a triple crop rotation of maize, forage rape and Persian clover, and the other half on a double crop rotation of maize and Persian clover. The herd comprised 105 Holstein-Friesian; half of them calved in spring and half in autumn. Cows were offered approximately 1 t DM concentrates /lactation as the only bought-in supplement with the rest of the feed grown on the 21.5ha area. A more complete description of the farmlet study and results presented by Fariña et. al (2011).
Scenarios
The physical results of the CFS study were used as a basis for the definition of the intensification scenarios. The scenarios were modelled as commercial-sized farms with a milking platform of 140 hectares. Dry cows and replacement heifers were considered not to graze on the milking platform.
The three scenarios established were: Base, CFS, and Pasture plus Grain (PG).
The Base scenario represented the original situation before the process of the farm intensification took place. All the effective area of the farm (140 ha) was in pasture. Only grazed pasture, home-grown pasture silage and concentrate pellets were fed to the herd. The total amount of concentrates fed was the same as in the CFS study (1.1 t DM/lactation).
The CFS scenario represents the performance recorded at the CFS study, scaled up to 140 ha.
The PG scenario represents a situation of equal intensification as the CFS. In this case, all the effective area of the farm (140 ha) is in pasture and instead of implementing forage crop rotations, the use of concentrates is increased to reach the same level of annual milk production per ha and per cow as the CFS scenario.
Simulation models utilised
a. Dairy production model
The Farmax Dairy-Pro decision support model (Bryant, et al., 2010) was used to model milk production of the farm system, as a platform for the development of commercial scale farm scenarios.
b. Pasture growth model
The DairyMod biophysical simulation model (Johnson, et al., 2008) was used as a pasture growth simulator, adopting the parameters for the physiology of the kikuyu grass and annual ryegrass, and the climate and soil characteristics of the site of the CFS field study, in order to obtain the inter-annual variability for 100 years of climate at Camden.

Page | 148
c. Forage crops growth model
The Agricultural Production Systems Simulator (APSIM) (Keating, et al., 2003) was used as a simulator of forage crops growth and final yield in an annual rotation based on 100 years of climate at Camden.
Note: with both DairyMod and APSIM the effect of inter-annual climate variability was tested at a water allocations of 4.5 megalitres (ML)/ha.year for both pasture and forage crops. Irrigation water was allocated at a rate of 4.5 ML/ha each year from the 1st of October to the 30th of September. Once the water allocated was used, no further irrigation water could be applied.
d. Whole farm budget model
The NSW DPI Milk Biz Whole-Farm Budgeting Program© version 3.2.1 (NSW DPI, Kempsey, Australia) software was used for the economic analysis of the different scenarios, and as a platform for the risk analysis. This program is an Excel spreadsheet that allows a complete economic analysis of a farm business.
Assumptions for the economic analysis
All costs related to pasture production and management were obtained from commercial prices paid to local suppliers in the year 2007/08 for the CFS field study and were equal for the simulated farms.
The major variable costs were classified as herd, shed and feed costs. The average herd costs for the top 25% dairy farms of the industry ranked by return on assets, was AU$ 75.2 /milking cow (converted to 2007/08 dollar value using the Consumers Price Index) was used for all modelled farms. In terms of shed costs, the MilkBiz program’s benchmark of 2 c/L of milk was used. The MilkBiz programs benchmark of 5 % of total dairy income was used for common fixed costs, which include various repairs and maintenance, vehicles, accounting, insurance and administration costs.
All labour was considered as paid labour at $60,000 per annum including on-costs and based on a ratio of 73.6 cows per labour unit.
A milk price of 37.6 cents per litre was used for the initial whole farm budgeting, which was the average price paid to Australian dairy producers over the past 15 years.
Operating profit was calculated as gross income minus variable and overhead costs, before interest and tax. Results are expressed in 2007/08 dollar values.
Incorporation of inputs-outputs price variability
It was found that price of milk (AU$/L), price of concentrates (AU$/t DM), price of irrigation water (AU$/ML) and price of Urea fertiliser (AU$/t) were the price variables with the largest impact on operating profit for all farm scenarios modelled. Hence, these price variables were selected. The distribution of each key price variable was determined using a 15-year time frame (1991 to 2006) in order to avoid significant structural changes.

Page | 149
Risk analysis
A stochastic budgeting technique was applied, using the software @Risk Version 4.0.5 (Palisade Corporation, Newfield, New York) to evaluate the risk of the different farm systems in relation to variation in prices and forage yields.
The aim of this technique is to assess a probability distribution of operating profit based on the probability distribution of uncertain coefficients such as prices and yields (Dillon and Hardaker, 1993). As obtaining such distribution from the direct analysis of all the possible parameters is impracticable, a Monte Carlo sampling is conducted involving a random sampling of the distribution of the uncertain parameters (Dillon and Hardaker, 1993).
The output obtained is a cumulative distribution function (CDF) of operating profit. This is a function that gives the probability (%, in ‘y’ axis) that the operating profit (AU$, in ‘x’ axis) will be less than, or equal to, x.
Results
Physical and economic performance of farm scenarios
Table 2 shows the key physical and economic performance indicators for the Base, CFS and PG scenarios. A milk price of 0.376 AU$/L, a urea price of 500 AU$/t and a concentrate price of 350 AU$/t was assumed for all farm scenarios.
Table 2 - Mean forage and milk yields (per ha and per cow) and economic indicators (AU$/ha.year) for the 2 year farmlet study at Costorphine Dairy, Camden.
Base CFS PG
Year 1 Year 2 Year 1 Year 2 Year 1 Year 2
Pasture (t DM/ha.year) 21.6 17.3 21.5 18.9 23.3 18.8
Forage crops (t DM/ha.year) - - 29.7 36.7 - -
Concentrate (t DM/cow.year) 1.20 1.33 1.26 1.35 2.89 2.27
Stocking rate (Cows/ha) 3.41 4.01 3.69 4.02 3.41 4.01
Milk production (L /cow.year) 8,284 7,459 9,051 8481 9,325 8,833
(L/ha.year) 28,875 30,226 32,245 36,144 32,219 36,132
Dairy Income (AU$/ha.year) 11,573 12,286 13,261 14,747 13,058 14,514
Variable costs (AU$/ha.year) 5,390 5,901 5,954 6,752 7,042 7,319
Overhead costs (AU$/ha.year) 3,457 4,058 3,917 4,280 3,674 4,249
Operating profit (AU$/ha.year) 2,636 2,326 3,390 3,715 2,341 2,946

Page | 150
The PG scenario, even though reaching a similar dairy income as the CFS, had higher variable costs (13% more) due to higher concentrate use.
Even though all the area of the Base scenario was in pasture and achieving a very high yield, the variable costs were only 11% lower than the CFS. This is mainly due to the large proportion of pasture that had to be cut to be conserved as silage and fed out in the Base scenario (more than 10% of total utilised pasture each year). This surplus is the consequence of having all the area of the farm growing the same species. The cost of conserved pasture (including baling, storing and feeding out) was more than three times higher than grazed pasture.
Effect of climate variability on forage yield
The long term (1910-2009) mean (± sd) rainfall, maximum mean temperature, and minimum mean temperature for Camden was 763 ± 240, 23.4 ± 0.6 and 10.7 ± 0.6, respectively. The mean (± sd) utilised yields were 15.5 ± 4.2, 24.6 ± 1.8, 6.9 ± 0.7 and 1.6 ± 1.8 t DM/ha.year, for pasture, maize, forage rape and field peas, respectively.
There was a higher inter-annual variability in the yields of pasture than in the sum of the forage crops in the rotation. There was no correlation between the utilised yield of pasture and the total of the three forage crops (R2 = 0.005). The yield of utilised pasture was closely associated with the rainfall received during the year, whereas the yield of forage crops was not (Figure 3).
Figure 3 - Relationship between simulated total utilised forage yield (t DM/ha.year) and annual rainfall (mm) for forage crops (■) and pasture (▲) of the CFS.
y = 0.0002x + 33.0136R2 = 0.0003
y = 10.45Ln(x) - 53.45R2 = 0.59
0
5
10
15
20
25
30
35
40
0 200 400 600 800 1000 1200 1400 1600 1800 2000
Rainfall (mm)
Fora
ge u
tilis
ed (t
DM
/ha.
year
)

Page | 151
Stochastic budgeting
Milk price was the factor with the highest impact on operating profit for all farm scenarios, showing a range from -801 to 4401 AU$/ha, whilst urea fertiliser price showed the lowest impact on profit. The variation in forage yields due to climate was the second main factor in terms of impact on operating profit for all scenarios. Concentrates price and water price were positioned third and fourth in terms of impact on profit, respectively, for the Base and CFS scenarios, and the reverse order was true for the PG scenario.
The sensitivity of the operating profit to the stochastic variation in each factors evaluated was similar for all farm scenarios, except for PG, which showed a higher sensitivity to concentrate price variation and CFS appearing more robust to changes in forage yields than the other two farm scenarios. If all prices of inputs and outputs are held constant, the CFS would only have a 3% probability of making a loss due to climate variability, whereas the probability of loss for the Base and PG scenarios would be 48% and 34%, respectively.
When the stochastic variation of all factors was integrated (Figure 2), the PG scenario showed the highest variability, expressed by its range (-1959 to 4614 AU$/ha), followed by the CFS (-1105 to 4854 AU$/ha) and the Base scenarios (-2489 to 3193 AU$/ha) considering a 0.9 probability confidence interval.
The CDF curve of the CFS was to the right of the PG for any given level of cumulative probability (risk), and the latter was to the right of the Base from 0.1% of cumulative probability onwards. This means that, for any probable combination of inputs and outputs prices and forage yields simulated, the CFS scenario was able to reach a higher operating profit than the two other options.
Figure 4 – Cumulative probability distribution of operating profit (AU$/year) for Base ( ∙∙∙∙∙), CFS (―) and PG (---) scenarios when price of milk , urea fertiliser, concentrates, irrigation water or yield of forages are simulated to vary stochastically.
Discussion
While both intensification options evaluated showed a higher operating profit than the Base scenario, the one based on pasture and forage crops, with low use of concentrates (CFS),
0
0.1
0.2
0.3
0.4
0.5
0.6
0.7
0.8
0.9
1
-5000 -3000 -1000 1000 3000 5000 7000 9000 11000
Operating Profit (AU$/ha.year)
Cum
ulat
ive
prob
abilit
y

Page | 152
showed a lower business risk (range of cumulative probable profit with 90% confidence) than the option based on only pasture and higher use of concentrates (PG).
The lower risk of the CFS was associated with the higher degree of diversification of the forage base in that system. A similar outcome was obtained by Chapman et al.(2008b) who modelled the business risk of dryland farms in southern Australia using different forage crops integrated into a typical perennial pasture. They found that these farm systems were less subject to “boom and bust” years as it was the case with perennial ryegrass, known by its great decline in productivity during hot and dry seasons.
The dynamic biophysical models run for the climatic conditions of 100 showed a relatively low variability (10% variation coefficient) in the total utilised yield of the forage crops. Even though this outcome is only valid for the soil and climate conditions in which this study was carried out, it suggests that when secure irrigation is provided and management is held constant, the extent of the impact of the changes in the environment is smaller than commonly believed.
The use of maize in the rotation played a central role achieving stability of yields against rainfall variability. This crop it is characterised by its very high water use efficiency and, by being prioritized in the use of irrigation water, provided on average 74% of the total utilised DM/ha.year.
On the other hand, the impact of the variation in climatic conditions on pasture utilised yield, assuming the same amount of irrigation water per year, was considerably larger (27% variation coefficient). Interestingly, changes in annual yields of pasture were not correlated to changes in forage crops yields. This is a consequence of the differences in the distribution of requirements for the growth of forage crops and pasture, respectively, both in time and quantity, throughout the year.
The CFS system was able to compensate “bad years” in terms of amount of pasture utilised per ha with the feed produced by the forage crops area (35% of the farm) and vice versa. Chapman et al. (2008b) modelled the impact of inter-annual variation in forage supply due to climate on the profit of dryland dairy farm systems and found that the systems involving alternative forage crops showed a lower inter-annual variation in feed consumption.
As expected, milk price was the factor with the largest effect on operating profit. Changes in forage yields were the factor with the second highest impact on profit for all farm systems. In contrast to milk price, forage yields can be controlled to some extent by the farm manager.
The above conclusions must be considered in the context of the assumptions adopted for this modelling study. The scenario adopted as Base had a higher stocking rate, pasture utilisation and milk production than the average dairy farm in Australia. This is because the purpose of this study was to evaluate future options of intensification for a dairy farmer who is already at a ceiling level of milk production from home-grown feed on a system based solely on pasture, and limited in terms of land available.
An additional key assumption of the study was that the management level, achieved for the implementation of the CFS field study conducted previously, was being reached in all scenarios. Some of the systems evaluated involve agronomic skills for intensive cropping, high level of grazing management skills and efficient allocation of grazed forages and
Page | 153
supplements to produce milk. Nevertheless, this assumption was necessary to allow for a fair comparison between alternatives.
Conclusions
This study has shown how an integrative approach, using currently available dynamic analytical tools and biophysical data from a whole farm study, can lead to a better understanding of the production and price risk of intensification alternatives at the whole farm system level.
The findings of this analysis provide evidence for the potential beneficial effects of adopting intensification alternatives that involve a diversified home-grown forage base, in terms of reducing the business risk compared to intensification pathways based on more purchased feed.
References
Antle J. M. (1983) Incorporating Risk in Production Analysis. American Journal of Agricultural Economics, 65, 1099-1106.
Bryant J. R., Ogle G., Marshall P. R., Glassey C. B., Lancaster J. A. S., García S. C. and Holmes C. W. (2010) Description and Evaluation of the Farmax Dairy Pro Simulation Model. New Zealand Journal of Agricultural Research 53, 13-28.
Cacho O. J., Bywater A. C. and Dillon J. L. (1999) Assessment of production risk in grazing models. Agricultural Systems, 60, 87-98.
Chapman D. F., Kenny S. N., Beca D. and Johnson I. R. (2008a) Pasture and forage crop systems for non-irrigated dairy farms in southern Australia. 1. Physical production and economic performance. Agricultural Systems, 97, 108-125.
Chapman D. F., Kenny S. N., Beca D. and Johnson I. R. (2008b) Pasture and forage crop systems for non-irrigated dairy farms in southern Australia. 2. Inter-annual variation in forage supply, and business risk. Agricultural Systems, 97, 126-138.
Fariña, S. R., Garcia, S. C., Fulkerson, W. J. (2011) A complementary forage system whole farm study: forage utilisation and milk production. Animal Production Science 51, 460-470.
Garcia S. C., Fulkerson W. J. and Brookes S. U. (2008) Dry matter production, nutritive value and efficiency of nutrient utilization of a complementary forage rotation compared to a grass pasture system. Grass and Forage Science, 63, 284-300.
Johnson I. R., Chapman D. F., Snow V. O., Eckard R. J., Parsons A. J., Lambert M. G. and Cullen B. R. (2008) DairyMod and EcoMod: biophysical pasture-simulation models for Australia and New Zealand. Australian Journal of Experimental Agriculture, 48, 621-631.
Keating B. A., Carberry P. S., Hammer G. L., Probert M. E., Robertson M. J., Holzworth D., Huth N. I., Hargreaves J. N. G., Meinke H., Hochman Z., McLean G., Verburg K., Snow V., Dimes J. P., Silburn M., Wang E., Brown S., Bristow K. L., Asseng S., Chapman S., McCown R. L., Freebairn D. M. and Smith C. J. (2003) An overview of APSIM, a model designed for farming systems simulation. European Journal of Agronomy, 18, 267-288.

Page | 154
ANIONIC SALT SUPPLEMENTATION AND INTRA-RUMEN DELIVERY OF 25OHD INCREASE URINARY CALCIUM EXCRETION IN STEERS FED A FORAGE DIET
JOE MCGRATH J.J. McGrath13, D.B. Savage1, N. J. Rodgers1, J.V. Nolan1, I. Godwin1, R. Elliot2
1Environmental and Rural Science, University of New England, Armidale, NSW 2351 2DSM Nutritional Products, Princeton Court, Kenmore, Brisbane, QLD 4069 3Corresponding author. Email: [email protected]
Abstract
Hypocalcaemia occurs when plasma Ca levels cannot be maintained at normal levels. In mammals, the condition is termed parturient paresis when the mobilisation of dietary or stored Ca is not sufficient to meet the initial requirements of lactation. Parturient paresis is a consequence of a cows’ failure to activate or respond to hormonal mechanisms. Feeding anionic salts prior to parturition has been proven to initiate Ca mobilisation resulting in an increase in urinary Ca. Anionic salts have low palatability and consumption of transition feeds by preparturient dairy cows is variable. Supplementation of 25-hydroxyvitamin D3 (25OHD) increases the plasma level of 25OHD which increases active vitamin D3, potentially amplifying the Ca mobilising effect of traditional anionic transition diets. Steers (n=18) were allocated to one of two diets with different dietary cation anion differences (DCAD) with one diet being anionic (DCAD -120) and one cationic (DCAD +150). Steers were randomly allocated rumen boluses that contained either monensin or a combination of monensin and 25OHD. Blood and urine samples were taken at approximately ten days post 25OHD release. As seen in previous studies, DCAD -120 steers had greater (P < 0.05) urine Ca excretion than DCAD 150. Plasma 25OHD levels greater than 75 ng/ml increased (P < 0.05) urinary Ca excretion within treatment DCAD -120. Supplementation of DCAD 150 steers with 25OHD did not increase urine Ca excretion. The results demonstrate that Ca mobilisation mechanisms were initiated by anionic salts and enhanced when anionic salts were combined with 25OHD supplementation. The combination of 25OHD and anionic salts prior to parturition may provide greater resistance to parturient paresis and sub-clinical hypocalcaemia.
Additional keywords: Hypocalcaemia, DCAD, 25 hydroxy vitamin D, sub-clinical hypocalcaemia
Introduction
Hypocalcaemia in clinical (milk fever) or subclinical form is a common malady after calving in dairy cows. Sub clinical hypocalcaemia is defined by plasma Ca levels low enough to cause associated problems but not clinical parturient paresis
(Goff 2008). Maintenance of plasma Ca above the sub-clinical level should reduce the incidence of associated problems, such as retained placenta and mastitis, and lead to a healthier more productive cow (Block 1994).
Page | 155
Maintenance of plasma Ca during and post parturition is achieved by meeting the Ca requirements of lactation. There are two potential sources of Ca to meet this demand; dietary and skeletal. Both sources of Ca are required to play a role in meeting demand. The Ca homeostasis mechanisms that liberate Ca from both these sources are very effective as during normal lactation the Ca requirement is met easily and hypocalcaemia is rarely evident. The hormonal response required to elicit Ca production from these two sources requires a period of time to effectively generate ionized Ca entry into the extracellular pool (Block 1994). Any extension of this time period, or “lag”, may effectively cause hypocalcaemia post parturition. An effective control method for hypocalcaemia should initiate Ca entry into the extracellular pool prior to parturition thus avoiding the lag period.
Plasma Ca concentration must be maintained at a constant level in all mammals (Cunningham 1997). An increased entry of Ca into the plasma Ca pool will result in Ca being excreted in urine (Kurosaki et al 2007). Increased urinary Ca prior to calving is a direct indication that Ca homeostatic mechanisms have been initiated, permitting greater resistance to a sudden fall in plasma Ca at calving.
The DCAD of a diet is a measure of the dietary balance of strong anions and cations in the diet. An anionic diet (negative value) will increase metabolic acidity; a cationic diet will increase alkalinity (Ender et al 1962). Anionic diets increase the sensitivity of small intestinal vitamin D receptors; this increases active Ca absorption from the small intestine (Goff et al 1991). Anionic diets have been found to activate Ca mobilization mechanisms during and prior to parturition and have been effective at reducing the incidence of hypocalcaemia (Fredeen et al 1988). Diets that are anionic increase intestinal absorption of Ca, skeletal
resorption and increase urinary Ca excretion (Horst 1986).
Vitamin D is the primary hormone involved in active absorption of Ca from the small intestine (Horst 1986). Active vitamin D (1,25OH2D) is produced in the kidney from hydroxylation of 25OHD, which is itself hydroxylated from vitamin D in the kidney (DeLuca 2008). Low plasma Ca concentration triggers an increase in parathyroid hormone (PTH) production which in turn increases the rate of 25OHD hydroxylation thereby increasing the level of 1,25OH2D resulting in increased active Ca absorption (DeLuca 2008).
Vitamin D is effectively stored as the 25OHD metabolite as this metabolite has a much longer half-life than other metabolites of vitamin D (Horst and Reinhardt 1983). As 25OHD is safe to feed to animals it is a very effective method to supplement animals with high levels of vitamin D.
The combination of anionic salts and elevated levels of available 25OHD in plasma may activate Ca mobilisation from the small intestine more effectively than anionic salts alone. Optimum control of hypocalcaemia requires the activation of Ca mobilization prior to parturition. Increased levels of 25OHD and increased sensitivity of small intestine vitamin D receptors (occurring during mild metabolic acidosis; Horst 1986) may increase active transportation of Ca in the small intestine prior to the normal PTH induced up-regulation during parturition. This study was designed to determine if intra-rumen supplementation via slow release boluses containing 25OHD would increase urinary Ca excretion in steers fed positive or negative DCAD diets.
Materials and methods
Crossbred beef steers (n = 18; 395 kg ±SD 29, with rumen fistulae) were used as a model for analysis of Ca and P homeostasis in a series of experiments. Steers were
Page | 156
used due to their size and suitability for spending periods of several consecutive days in metabolism crates.
Steers were allocated to two dietary treatments, DCAD +150 and DCAD -120 mEq/kg. The forage based diet had DCAD manipulated by the addition of MgCl2. DCAD was calculated by the most common equation, originally put forward by Ender (1962).
DCAD (mEq/kg) = (mEq Na+ + mEq K+) – (mEq Cl- + mEq S--)
Twelve steers were allocated to the DCAD +150 diet and 6 steers to the DCAD -120 diet. Standard commercial monensin slow release rumen boluses that contained either monensin (n = 6, DCAD+150-D) or a combination of monensin and 45.6 mg of 25OHD (n = 12, DCAD+150+D) were randomly allocated to the steers. Boluses were allocated in a randomised double blind design. The boluses containing 25OHD were designed to release the 25OHD after approximately 10 days; boluses were designed to release approximately 4.1 mg of 25OHD per day for 11 days.
Collections were taken at two separate times to correspond with individual steers bolus degradation rates. Collection periods were aimed to correspond with initial release of 25OHD and after approximately 10 days of 25OHD release. Blood for plasma and urine spot samples were taken daily between 8 am and 11am while steers stood in a race.
Spot samples were tested for pH immediately after sampling with a pH meter (Ecoscan pH 5/6, Eutech Instruments Pte Ltd). The pH meter was calibrated daily with buffers at pH 7 and pH 10. Urine spot samples were acidified, diluted and stored in accordance with Chen (1992). Daily Ca excretion rates were determined from spot urine samples. Urine and blood plasma samples were analysed for Ca, P and creatinine with an Auto Analyser (Dade
Behring Dimension RXL Clinical Chemistry System). Urine Ca and plasma Ca were determined by colorimetric assay following a method adapted from Stern and Lewis (1957); urine P and plasma P were measured using a phosphomolybdate method introduced by Fiske and Subbarow (1925). Urine creatinine was determined using a modified kinetic Jaffe reaction reported by Larsen (1972). Plasma 25OHD concentration was measured by HPLC in accordance Lauridsen et al (2010).
Creatinine production is constant per kilogram of body weight and is effective for estimating the relative concentration of a urine sample (Chizzotti et al 2008). The formula reported by Chizzotti et al (2008) was adapted for actual creatinine production previously recorded from these steers in metabolism crates over 72 h periods.
Urine Ca excretion taken on the day of blood plasma collection were used for regression analysis. Two successive collections for each animal were used to plot the regression co-efficient for daily urine Ca and blood plasma 25OHD concentration. Results obtained from the second collection period were used for analysis of variance. Data were subjected to analysis of variance (GenStat, 2008).
Results
Urine pH was reduced (P < 0.05) by DCAD -120 diets when compared to urine of steers offered DCAD +150 diets (pH 5.8 ±SE 0.16, pH 8.3 ±SE 0.06). Consequently urine Ca excretion was higher (P < 0.05) from steers in treatment DCAD-120-D than in DCAD+150-D (Table 1). This is in agreement with previous research, which shows that compensated metabolic acidosis as a result of feeding anionic salts results in an increase in urine Ca excretion (Goff and Horst 1998, Kurosaki et al 2007).
DCAD or vitamin D supplementation had no effect on plasma Ca, P concentration or daily urine P excretion.

Page | 157
Figure 1 Daily urinary Ca excretion in steers is increased by a combination of anionic salts and 25OHD. DCAD -120 (▲), DCAD +150 (♦)
Plasma 25OHD alone had no effect on urine Ca excretion (Table 1) but had a significant effect on urine Ca excretion when combined with a negative DCAD diet. When collection period 1 and 2 were
analysed by regression (Figure 1) there was a significant interaction between plasma 25OHD concentration and urine Ca when the steers were fed an anionic diet (P < 0.05).
y = 0.065x + 1.34R² = 0.62, P < 0.05
0
2
4
6
8
10
12
14
0 50 100 150 200
Urine Ca (g/d)
Plasma Vitamin D (25OHD ng/mL)
Table 1. The effect of supplementary 25OHD and anionic salts on plasma 25OHD concentration and daily urine Ca excretion in steers
25OHD (ng/mL) Urine Ca (g/d)
Treatment Mean SE Mean SE
DCAD+150-D 34b 3.5 0.3c 0.03
DCAD+150+D 117a 8.5 0.4c 0.06
DCAD-120-D 40b 18 4.2b 0.4
DCAD-120+D 123a 4.5 9.2a 1.9
Superscripts within columns denote means that differ significantly (P < 0.05).

Page | 158
Discussion
Intra-rumen supplementation of 25OHD and negative DCAD resulted in greater Ca excretion than negative DCAD alone. Negative DCAD diets consistently increase the rate of urinary Ca excretion as a consequence of increasing the mobilization of Ca from various sources (Kurosaki et al 2007). Along with an improvement in PTH and vitamin D receptor sensitivity, this is one of the primary methods for preventing hypocalcaemia in dairy cows.
Plasma 25OHD concentrations approximately double that of the normal endogenous 25OHD concentration increased urinary Ca excretion when DCAD is negative. However, the increased concentration of 25OHD had no effect on urinary Ca excretion when DCAD was not altered by anionic salts. The apparent interaction of 25OHD and negative DCAD may be a consequence of an increase in small intestinal vitamin D receptor sensitivity coupled with increased 25OHD availability and thereby increasing the amount of Ca absorbed from the diet.
There was no change to plasma Ca and P concentration in response to diet or plasma 25OHD concentration. Previous research showed increases in both plasma Ca and P when plasma 25OHD concentrations were increased but only at much higher concentrations of 25OHD in plasma (Hollis et al 1977). Anionic salt supplementation is known to reduce the rate of Ca reabsorption in the kidney, effectively increasing Ca excretion (Gaynor et al 1989). The maintenance of plasma Ca shows that the increase in Ca entering the plasma pool is matched with an increase in urinary Ca. This Ca loss (equivalent to ca. 9 g/d in animals with both 25OHD and anionic salt supplementation) provides an almost immediately available Ca resource during times of increased Ca requirements. This provides a very effective buffer for sub clinical and clinical hypocalcaemia.
Further research on periparturient dairy cows may confirm the usefulness of both 25OHD and anionic salts in preventing clinical and subclinical hypocalcaemia.
Acknowledgements
This work was funded by DSM Nutritional Products, Pty Ltd.
References
Block, E. 1994. J. Dairy Sc., 77, 1437.
Chen, X. B. & Gomes, M. J. 1992. International Food Resources Unit, Occasional Publication, Rowett Research Institute.
Chizzotti, M. L., Valadares Filho, S. D. C., Valadares, R. F. D., Chizzotti, F. H. M. & Tedeschi, L. O. 2008. Live. Sci. 113, 218.
Cunningham, J. G. (ed.) 1997. Textbook of Veterinary Physiology, Philadelphia: W.B. Saunders Company.
Deluca, H. F. 2008. Nut. Rev. 66, S73.
Ender, F., Dishington, I. W. & Helgebostad, A. 1962. Acta Vet. Scan. 3, 1.
Fiske, C. H. & Subbarrow, Y. 1925. J. Biol. Chem. 66, 375.
Fredeen, A. H., Depeters, E. J. & Baldwin, R. L. 1988. J. An. Sci. 66, 174.
Gaynor, P. J., Mueller, F. J., Miller, J. K., Ramsey, N., Goff, J. P. & Horst, R. L. 1989. J. Dairy Sc. 72, 2525.
GENSTAT 2008. GenStat for Windows, Release 11.1, Eleventh Edition: VSN International Ltd, Oxford.
Goff, J. P. 2008. Vet. J. 176, 50.
Goff, J. P. & Horst, R. L. 1998. J. Dairy Sci. 81, 2874.
Goff, J. P., Reinhardt, T. A. & Horst, R. L. 1991. J. Dairy Sc. 74, 4022.
Page | 159
Hollis, B. W., Conrad, H. R. & Hibbs, J. W. 1977. J. Nut. 107, 606.
Horst, R. L. 1986. J. Dairy Sc. 69, 604.
Horst, R. L. & Reinhardt, T. A. 1983. J. Dairy Sc. 66, 661.
Kurosaki, N., Yamato, O., Mori, F., Imoto, S. & Maede, Y. 2007. J. Vet. Med. Sci. 69, 185.
Larsen, K. 1972. Cli. Chim. Acta. 41, 209.
Lauridsen, C., Halekoh, U., Larsen, T. & Jensen, S. K. 2010. J. Anim Sci. 88, 202.
Stern, J. & Lewis, W. H. P. 1957. Clin. Chim. Acta, 2, 576.
Page | 160
EFFECTS OF CARBOHYDRATES AND HISTIDINE ON RUMINAL PH AND FERMENTATION PRODUCTS DURING AN INDUCED ACIDOSIS PROTOCOL
HELEN GOLDER
H.M. GolderABE, P. CeliA, A.R. RabieeAB, E. BramleyC, D.W. MillerC, R. KingD and I.J. LeanAB
AUniversity of Sydney, Faculty of Veterinary Science, Camden, N.S.W BSBScibus, Camden, N.S.W. CMurdoch University, School of Veterinary and Biomedical Sciences, Murdoch, W.A., DDairy Australia, Southbank, Vic ECorresponding author. Email: [email protected]
Abstract
This study investigated the effects of grain, fructose and histidine on ruminal pH and fermentation products in dairy cattle. Thirty Holstein heifers were randomly allocated into 5 treatments; i) Control (no grain), ii) Grain (1.2% liveweight (LW) rolled triticale) (GR), iii) Grain (0.8% LW) + fructose (0.4% LW) (FR), iv) GR + histidine (6g/hd) and v) FR + histidine in an incomplete factorial design. All heifers were fed 1kg of grain daily with ad lib access to silage and lucerne hay prior to challenge date. Feed was withheld for 14 hours immediately before challenge date, on which heifers were fed 200g of lucerne hay, and immediately after their treatment in the intent of inducing a subclinical acidosis. Rumen samples were collected 5 minutes after treatment ingestion, 60 minutes later and at 3 further 50 minute intervals. Samples were analysed for ruminal pH immediately and later for ammonia, histamine, volatile fatty acids and D- and L-lactate concentrations. The substitution of fructose for some grain resulted in a marked drop in ruminal pH. Ruminal histamine and volatile fatty acid concentrations increased with the addition of grain and grain plus fructose, irrespective of the presence of histidine. D- and L-lactate concentrations were greater in the FR (9.2 and 4.9 mM) compared to the GR (0.2 and 0.1 mM) and control groups (0.1 and 0.1 mM). The addition of histidine did not have a marked affect on ruminal fermentation. In summary the substitution of some fructose for grain altered ruminal fermentation products in dairy heifers.
Additional keywords: acidosis, histidine, fructose, rumen fermentation products
Introduction
Ruminal lactic acidosis and lameness are two of the most important challenges facing the Australian dairy industry. Acidosis is commonly associated with the consumption of large amounts of readily
fermentable carbohydrates (Bramley et al 2008). The clinical form can result in rumenitis, metabolic acidosis, lameness, hepatic abscessation, pneumonia and death (Lean et al 2000). Of greater economic importance are losses that result from subclinical acidosis in dairy cattle, particularly those fed on pasture (Lean et al

Page | 161
2000). Bramley et al (2008) found that herds with a high prevalence of acidotic cows also had a high prevalence of lameness (28% of cows).
Histidine is an amino acid present in high concentrations in kikuyu and ryegrass (Reeves 1998). When ruminal pH is low, histidine is decarboxylated by the bacteria Allisonella histaminiformans, to histamine (Garner et al 2002). Ruminal histamine accumulation has long been suspected to be related to the onset of laminitis (Nocek 1997) and has been suggested to be an indicator of acidosis (Rabiee et al 2009).
Plants store excess carbohydrates as either starches or fructans. The majority of tropical (C4) pasture plants such as kikuyu store carbohydrates in the form of starch; whilst, most cool season (C3) pasture plants such as ryegrass, store carbohydrates as fructans (Pollock and Cairns 1991). Fructans are polymers of β-D-fructose (Roberfroid and Delzenne 1998) and can form up to 70% of the water soluble content of grasses (McGrath 1988). Thoefner et al (2004) showed fructan administered as an oligofructose bolus induced laminitis and acidosis in dairy cattle. The aim of this study was to provide insights into the role of forages in acidosis and laminitis, through examining the effect of the amino acid histidine, and fructose in dairy cattle in the presence of increased starch access. The hypothesis was that administered fructose and histidine concentrations representative of those of pasture would increase the risk of subclinical acidosis in dairy heifers fed a grain ration.
Materials and methods
Thirty non-pregnant Holstein heifers less than 18 months of age (359.3 ± 47.3 kg liveweight (LW)) were randomly allocated into 5 treatment groups; i) Control (no grain), ii) Grain (1.2% LW rolled triticale cv Berkshire)(GR), iii) Grain (0.8% LW) + fructose (0.4% LW)(FR), iv) GR + histidine (6g/hd) and v) FR + histidine in an
incomplete factorial design (n = 6 heifers/group). The fructose (Melbourne Food Depot, East Brunswick, Vic) was mixed through the grain; whilst, the histidine (Merck KGaA, Darmstadt, Germany) was dissolved in 50 mL of water and administered via a stomach tube. The heifers were fed 1kg of grain daily and had ad lib access to mixed silage and lucerne hay for a 10 day adaptation period. Feed was then withheld for 14 hours prior to challenge. On the day of challenge each heifer was fed and ate 200g of lucerne hay, immediately after heifers were fed their allocated treatment. Rumen samples were collected 5 minutes after treatment ingestion, 60 minutes later and at 3 subsequent 50 minute intervals via a stomach tube and assessed for saliva contamination as described by Bramley et al (2008). Rumen samples were analysed for pH immediately after collection and fermentation products following storage at -20oC within four weeks of collection. Ammonia and D- and L-lactate concentrations were analysed using a Boehringer Mannheim kit (Arrow scientific, Lane Cove, N.S.W.) and spectroscopy. Volatile fatty acid (VFA) concentrations were analysed by gas chromatograpghy. Histamine concentration was analysed using a human histamine ELISA kit (IBL International, Hamburg, Germany) modified for bovine ruminal histamine. The kit was validated for bovine ruminal histamine by comparing the slopes between human and bovine serially diluted rumen fluid standard curves, which were not significantly different (Rabiee et al 2009). A repeated measures ANOVA with heifer as a random effect was used to analyse all parameters except D- and L-lactate (Stata v11, StataCorp LP, College Station, Texas, U.S.A). Day was used as a co-variate. A generalized estimated equations (GEE) model was used to analyse D- and L-lactate data. For statistical analysis the GR and GR + histidine treatment groups were collectively termed the GR group. The FR and FR + histidine treatment groups were collectively termed the FR group. P <
Page | 162
0.05 was defined as the level of significance.
Results
Ruminal pH was significantly lower in the GR and FR groups (6.9 ± 0.0 and 6.5 ± 0.0) compared to the control group (7.1 ± 0.0) and lowest in the FR group. The effects of grain, fructose and histidine were not significant, but the interaction of grain and histidine decreased ruminal pH. The effect of time and time by grain, fructose and histidine interactions were significant for ruminal pH, decreasing ruminal pH over the total time (Figure 1A). All contrasts between the control, GR and FR groups were significant for ammonia concentrations with the GR group (13.1 ± 1.0 mM) producing the highest ammonia concentration and the control group the lowest (7.5 ± 1.1 mM). The effect of grain increased ammonia concentration. In all treatment groups ammonia concentration decreased up to 115 minutes after feed consumption before increasing to 215 minutes. Ruminal D- and L-lactate concentrations were significantly higher in the FR group (9.2 ± 1.4 and 4.9 ± 0.9 mM) in comparison to the control (0.2 ± 0.7 and 0.1 ± 0.4 mM) and GR groups (0.2 ± 0.7 and 0.1 ± 0.3 mM). The effect of fructose was highly significant (P < 0.001), increasing D- and L-lactate concentrations. Fructose decreased D-lactate concentrations over time (Figure 1B). The fructose by histidine interaction was significant for L-lactate. Ruminal histamine concentration was significantly lower in the control (61.3 ± 6.1
ng/mL) compared to the GR (117.9 ± 4.3 ng/mL) and FR (111.2 ± 4.3 ng/mL) groups; which did not differ. The interaction of fructose and histidine resulted in an increase in ruminal histamine concentration (P < 0.01). Histamine concentration increased in all treatment groups up to 65 minutes after treatment consumption before decreasing over time (Figure 1C). The time by grain interaction was significant for ruminal histamine concentrations with grain decreasing histamine concentration after 65 minutes from treatment consumption. The fructose and histidine by time interactions were not significant. All contrasts between the control, GR and FR groups were significant for the volatile fatty acids analysed which included: acetate, butyrate, caproate, iso-butyrate, iso-valerate, propionate and valerate. The lowest volatile fatty acid concentrations occurred in the control group, with the exception of iso-butyrate and iso-valerate. Grain increased propionate and valerate concentrations; while, fructose increased acetate, butyrate and propionate concentrations. Concentrations of all analysed volatile fatty acids increased over time and grain increased concentrations over time. Fructose increased butyrate (Figure 1D), caproate, propionate (Figure 1E) and valerate (Figure 1F) concentrations over time. Histidine increased iso-valerate and propionate concentrations over time.

Page | 163
0
20
40
60
80
100
120
140
160
180
5 65 115 165 215Time (minutes after feed consumption)
Rum
inal
His
tam
ine
(ng/
mL)
0
5
10
15
20
25
5 65 115 165 215Time (minutes after feed consumption)
But
yrat
e C
once
ntra
tion
(mM
)
0
5
10
15
20
25
5 65 115 165 215Time (minutes after feed consumption)
Prop
iona
te C
once
ntra
tion
(mM
)
0.0
0.5
1.0
1.5
2.0
2.5
3.0
3.5
4.0
5 65 115 165 215Time (minutes after feed consumption)
Val
erat
e C
once
ntra
tion
(mM
)
5.6
5.8
6.0
6.2
6.4
6.6
6.8
7.0
7.2
7.4
7.6
5 65 115 165 215Time (minutes after feed consumption)
Rum
inal
pH
02468
10121416182022
5 65 115 165 215Time (minutes after feed consumption)
Rum
inal
D-la
ctat
e C
once
ntra
tion
(mM
)A B C
D
F
A
Figure 1A. pH; B. D-lactate concentration; C. Histamine concentration; D. Butyrate concentration; E. Propionate concentration; F. Valerate concentration. All values are means ± SEM from ruminal fluid taken at 5, 65, 115, 165 and 215 minutes after completion of treatment consumption. GR = 1.2% LW rolled triticale; FR = Grain (0.8% LW) + fructose (0.4% LW); HIS = histidine (6g/hd) (n = 6 heifers/group).
Control GR GR + HIS FR FR + HIS
C D
E F
Page | 164
Discussion
This experiment was designed to induce subclinical acidosis as defined by Bramley et al (2008) to test if fructose and histidine concentrations increase the risk of acidosis. Despite this, rumen pH in this trial was relatively high throughout the experimental period. However, as there were significant declines in pH in the GR and FR groups it was concluded subclinical acidosis was induced. Rumen pH is largely influenced by VFA and lactic acid concentrations (Schwartzkopf-Genswein et al 2003). The observed increase in VFA concentrations in the GR and FR group was probably ascribable to the stimulation of ruminal bacteria in these groups as a result of feeding readily fermentable carbohydrates in the form of grain and fructose. Hence, this VFA increase is likely to account for the drop in pH observed in the GR group and a proportion of the pH decline in the FR group. The fructose utilisers Streptococcus bovis and lactobacilli, which are favoured as pH declines produce lactic acid as a fermentation product (Hungate 1966). As lactic acid is 10 times stronger (pKa = 3.1) than VFA (average pKa = 4.8) the accumulation of lactate in the FR group may be responsible for a large percentage of the decline in pH in this group (Schwartzkopf-Genswein et al 2003). Marked drops in pH of dairy cattle administered with 13, 17 or 21 g/kg LW of oligofructose have also been observed by Thoefner et al (2004).
Histidine did not appear to have a significant impact on any of the parameters analysed, including histamine concentration. While the clearance rates of histamine were not measured in this study, elevated histamine levels in the GR and FR group in comparison to the control group support preliminary findings by our research group that histamine concentrations may be an indicator of acidosis (Lean unpublished).
In summary the substitution of 0.4% LW fructose for grain had marked effects on ruminal fermentation products in dairy cattle induced with subclinical acidosis. The addition of histidine did not have significant effects on ruminal fermentation.
Acknowledgements
This work was supported by Dairy Australia and SBScibus.
References
Bramley E., Lean I.J., Fulkerson W.J., Stevenson M.A., Rabiee A.R. and Costa N.D. (2008). J. Dairy Sci. 91, 308
Garner M.R., Flint J.F. and Russell J.B. (2002) Syst. Appl. Microbiol. 25, 498.
Hungate R.E. (1966). “The Rumen and Its Microbes”. (Academic Press: London).
Lean I.J., Wade L.K., Curtis M.A. and Porter J. (2000) Asian-Australas. J. Anim. Sci. 13, 266.
McGrath D. (1988). Ir. J. Agric. Res. 27, 131.
Nocek J.E. (1997). J. Dairy Sci. 80, 1005.
Pollock C.J. and Cairns A.J. (1991) Annu. Rev. Plant Physiol. Plant Mol. Biol. 42, 77.
Rabiee A.R., Lean I.J., Bramley E. and Miller D. (2009) Report to Dairy Australia and DIDCO
Reeves M. (1998). Ph.D. Thesis, University of Sydney.
Roberfroid M.B. and Delzenne N.M. (1998). Annu. Rev. Nutr. 18, 117.
Schwartzkopf-Genswein K.S., Beauchemin K.A., Gibb D.J., Crews D.H., Hickman Jr. D.D., Streeter M. and McAllister T.A. (2003). J. Anim Sci. 81, E149.
Thoefner M.B., Pollitt C.C., van Eps A.W., Milinovich G.J., Trott D.J., Wattle O. and Andersen P.H. (2004). J. Dairy Sci. 87, 29.
Page | 165
THE EFFECTS OF SOME ENVIRONMENTAL AND MANAGEMENT FACTORS ON CONCEPTION RATE AT FIRST SERVICE OF THE AUSTRALIAN DAIRY HEIFERS
ANAS ALMAKHZOOMI A. Almakhzoomi*, A.Park, H. W. Raadsma, P. C. Thomson and P. Celi University of Sydney, Camden, NSW, 2570, Australia *Correspondence: [email protected]
Abstract
In the dairy industry, it is widely believed that fertility problems begin to arise when heifers enter their first lactation. The aim of this study was to describe the fertility of Australian dairy heifers in relation to their age, live weights and year at first service. Data used in this study were obtained from breeding records of 6376 Holstein-Friesian heifers born between the years 2003 and 2010 in a dairy farm located in New South Wales, Australia. In conclusion, further detailed examination of environmental and management factors and genetic effects will be investigated as possible causes for the decline of heifer fertility over the period of study.
Introduction
In the dairy industry, good reproductive performance is essential in order to maintain profitability and herd efficiency. However, fertility has been declining over the past few decades, with conception rate to first service reported to be only around 40% in lactating cows (Royal et al 2000; Mayne et al 2002). The exact cause of this decline in fertility is heavily debated in the scientific community. One school of thought is that genetic selection for high milk-yield has resulted in cows requiring more energy during early lactation, leading to a negative energy balance which compromises the cows’ subsequent ability to conceive (Pryce et al 2001). This has lead to a perception in the industry that heifer fertility is not adversely affected by selection for high milk yield, with difficulties only arising once cows are lactating. If this perception is assumed to be correct, then the genetic potential for fertility in
heifers should reach its near-maximal genetic potential for milk production. Consistent with this premise, there is a weak link between milk yield and fertility with correlations found in the range of 0.2-0.4 indicating that selection for milk yield per se could not lead to poorer fertility (Roxström et al 2001a, 2001b). Therefore, high milk production per se does not always elicit negative effects on health and fertility traits, and the effect seems to depend on the farm and production environment (Windig et al 2006). In the United States, a recent study conducted on 2,668 Holstein heifer herds have shown a variation in conception rates from 40 to 70% with an overall mean of 57% (Kuhn et al 2006). The ability of replacement heifers to reach puberty, cycle normally, conceive at the desired time, maintain the pregnancy to term, calve normally, and subsequently start their first lactation is a critical component of dairy industry. It is widely accepted that heifers is often superior to that of lactating cows.

Page | 166
However, a large number of potential replacement heifers may never reach first calving and become productive or are culled before they reach their full lactation potential because they either fail to conceive or are significantly delayed in conceiving (Wathes et al 2008; Brickell et al 2011).
An association between body weight gain and the timing of puberty has been reported in rearing heifers; high energy and protein intake resulting in increased growth is associated with the earlier puberty in rearing replacement heifers (Lammers et al 1999). Therefore, heifers with lower weights are less likely to get pregnant. Age at first calving is an important factor involved in rearing replacement heifers and can determine the length of the non-productive period of heifers and can affect the subsequent milk production capacity and survival rates (Pirlo et al 2000; Ettema and Santos 2004; Wathes et al 2008). It is widely accepted that heifers should calve for the first time at approximately 2 years, but most countries report a mean age at first calving of greater than 24 months (Pirlo et al 2000; Mayne et al 2002). Gestation length is fixed, therefore, age at first calving depends upon the age at the commencement of first service (Ettema and Santos 2004; Kuhn et al 2006). The decision on when to start breeding is a management one, but variability in growth rates within groups of heifers can lead to a large spread in the age at which these heifers are bred for the first time (Ettema and Santos 2004). The fertility of heifers at this stage may then affect the age at conception and hence the age at first calving on any particular farm (Ettema and Santos 2004; Kuhn et al 2006).
Although considerable research has now been done on cow fertility, we are not aware of any studies on heifer fertility in Australia. It is then worth considering the factors that might influence the fertility of heifers at time of first service. The objective of this study was to describe the
effects of age, live weight and year at first service on conception rate at first service of the Australian dairy heifers.
Materials and Methods
Data used in this study were obtained from breeding records of 6376 Holstein-Friesian heifers born between the years 2003 and 2010 in a dairy farm located in New South Wales, Australia. Records of heifers with no date of birth, first service date and pregnancy confirmation date were deleted. The resulting number of entries after data modifications was 5955. Live weight at first service was defined as the heifer’s recorded weight within ± 4 weeks from the time of first service. All other heifers outside of this interval were eliminated.
Results and Discussion
The overall conception rate was 59% in the study period.
Figure 1. Conception rates to first service in each year over the study period
Conception rate declined steadily from 62% in 2003 to 50% in 2008 and rose again to 63% in 2010 (Figure 1).The conception rate in the years 2008 and 2009 were the lowest over the period of study.
Over the period of study, conception rate at first service was highest (66%) at age of 19 of months and with live weights of 426 kg. However, conception rate at first service was lowest (50%) at age of 15 of months and with live weights of 396 kg (Table 1).
40
50
60
70
Con
cept
ion
rate
at f
irst
se
rvic
e/ (%
)
Year
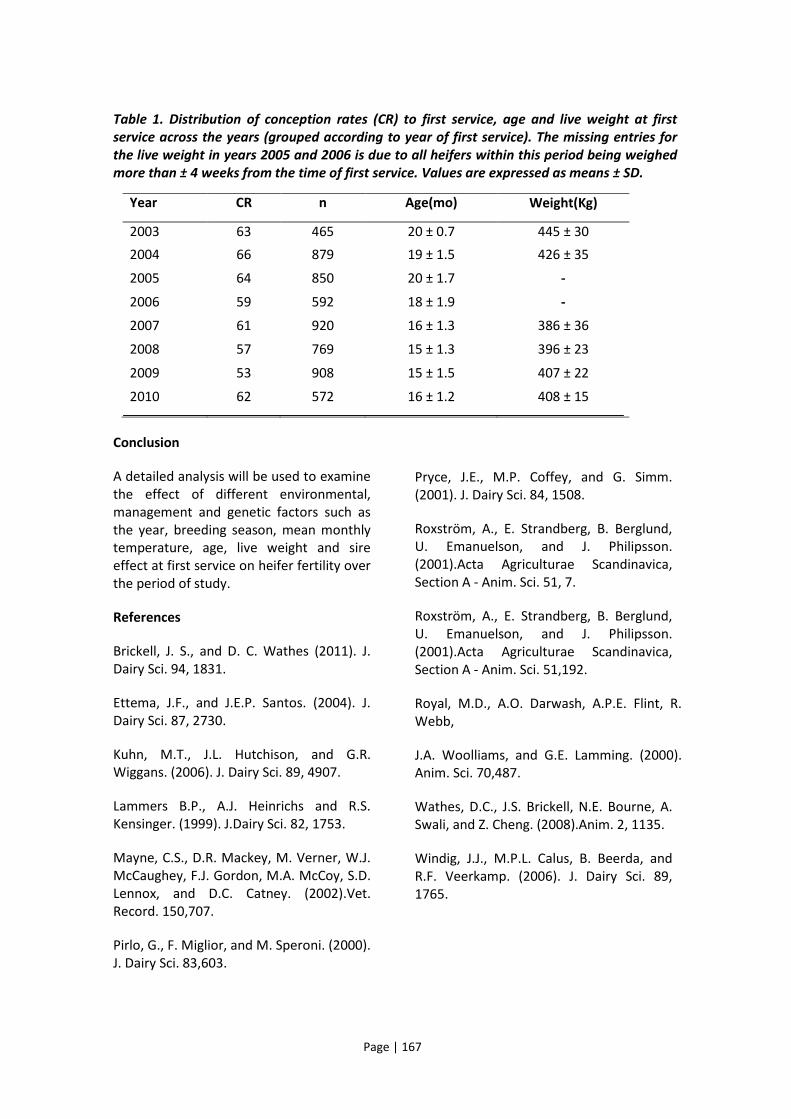
Page | 167
Table 1. Distribution of conception rates (CR) to first service, age and live weight at first service across the years (grouped according to year of first service). The missing entries for the live weight in years 2005 and 2006 is due to all heifers within this period being weighed more than ± 4 weeks from the time of first service. Values are expressed as means ± SD.
Conclusion
A detailed analysis will be used to examine the effect of different environmental, management and genetic factors such as the year, breeding season, mean monthly temperature, age, live weight and sire effect at first service on heifer fertility over the period of study.
References
Brickell, J. S., and D. C. Wathes (2011). J. Dairy Sci. 94, 1831.
Ettema, J.F., and J.E.P. Santos. (2004). J. Dairy Sci. 87, 2730.
Kuhn, M.T., J.L. Hutchison, and G.R. Wiggans. (2006). J. Dairy Sci. 89, 4907.
Lammers B.P., A.J. Heinrichs and R.S. Kensinger. (1999). J.Dairy Sci. 82, 1753.
Mayne, C.S., D.R. Mackey, M. Verner, W.J. McCaughey, F.J. Gordon, M.A. McCoy, S.D. Lennox, and D.C. Catney. (2002).Vet. Record. 150,707.
Pirlo, G., F. Miglior, and M. Speroni. (2000). J. Dairy Sci. 83,603.
Pryce, J.E., M.P. Coffey, and G. Simm. (2001). J. Dairy Sci. 84, 1508.
Roxström, A., E. Strandberg, B. Berglund, U. Emanuelson, and J. Philipsson. (2001).Acta Agriculturae Scandinavica, Section A - Anim. Sci. 51, 7.
Roxström, A., E. Strandberg, B. Berglund, U. Emanuelson, and J. Philipsson. (2001).Acta Agriculturae Scandinavica, Section A - Anim. Sci. 51,192.
Royal, M.D., A.O. Darwash, A.P.E. Flint, R. Webb,
J.A. Woolliams, and G.E. Lamming. (2000). Anim. Sci. 70,487.
Wathes, D.C., J.S. Brickell, N.E. Bourne, A. Swali, and Z. Cheng. (2008).Anim. 2, 1135.
Windig, J.J., M.P.L. Calus, B. Beerda, and R.F. Veerkamp. (2006). J. Dairy Sci. 89, 1765.
Year CR n Age(mo)
Weight(Kg)
2003 63 465 20 ± 0.7
445 ± 30
2004 66 879 19 ± 1.5
426 ± 35
2005 64 850 20 ± 1.7
-
2006 59 592 18 ± 1.9
-
2007 61 920 16 ± 1.3
386 ± 36
2008 57 769 15 ± 1.3
396 ± 23
2009 53 908 15 ± 1.5
407 ± 22
2010 62 572 16 ± 1.2 408 ± 15

Page | 168
THE PRESSURE OF WATER: ASSISTING HAWKESBURY NEPEAN DAIRY FARMERS TO BE WATERSMART
MATTHEW PLUNKETT
M. Plunkett1,*, D. O’Donnell2,*
1 NSW Department of Primary Industries, Locked Bag 4 Richmond NSW 2753 Australia. [email protected] 2 NSW Department of Primary Industries, PO Box 53 Bega NSW 2550 Australia. [email protected]
Introduction
Water use efficiency is a critical component of managing a profitable and sustainable dairy farm. Recent droughts, the outbreak of aquatic weeds, competition for water between various water users and the need for greater environmental flows has placed pressure on irrigators to become more efficient. For dairy farmers to remain viable in the long term, improvements in water use efficiency are essential. The NSW Department of Primary Industries (NSW DPI) & the Hawkesbury Nepean Catchment Management Authority (HNCMA) have been working with the Hawkesbury Nepean dairy industry to improve water and nutrient management ‘on farm’ through the two ‘Smart Farms’ projects - WaterSmart Farms and NutrientSmart Farms. This paper explores the WaterSmart Farms (WSF) experience.
The WSF project is part of the Hawkesbury Nepean River Recovery Program (HNRRP) which commenced in 2009 and will be completed by September 2011. The HNRRP is funded by the Australian Government through the Water for the Future program. Supplementary funding is provided by the NSW Government through its Climate Change Fund.
Methods
Information days have been held ‘on farm’ to discuss farm improvement opportunities and demonstrate practical water use efficiency interventions.
In addition, fully subsidised irrigation system assessments by accredited assessors have been offered to dairy farmers in the lower Hawkesbury Nepean catchment, along with grant funding to implement the water use efficiency improvements recommended in the irrigation system assessments.
The irrigation system assessments have highlighted water use efficiency issues and how much water could be saved through various interventions. These assessments build the business case for investing in ‘on ground’ irrigation infrastructure improvements.
Using this information, licensed river water irrigators are encouraged to submit a project proposal to receive grant funding to undertake some or all of the improvements identified in the irrigation system assessment.

Page | 169
In exchange for the grant, irrigators are required to transfer 75% of the water savings from their licence entitlement and receive $3,300 (GST inc) per megalitre of water transferred.
Results
All 19 dairy farmers in the Hawkesbury Nepean catchment have been engaged in the project. Since the project commenced, 7 producers representing 8 properties have participated in WSF activities and two irrigation system assessments have been undertaken.
As a result, 3 project proposals have been developed and approved to the value of $1,082,400, and 328ML of licence entitlement has been surrendered as a consequence of the water savings. It is anticipated that a further 2 projects will be submitted for funding before the WaterSmart Farms project ends.
WaterSmart Farms funded dairy projects have included:
• Conversion from travelling irrigators to a lateral move irrigator together with soil moisture monitoring and a variable frequency drive pump unit.
• Conversion from travelling irrigators to fixed solid set irrigation together with existing centre pivots, new mainlines, pumping units and soil moisture monitoring equipment.
• Installation of an integrated soil moisture monitoring system with a weather station and the installation of shut off valves on travelling irrigators.
Conclusion
The level of investment and ‘on farm’ change achieved through the WaterSmart Farms project would not have been possible without the funding of the Australian Government’s Water for the Future Program.
The project has demonstrated considerable water and labour savings, lower operating costs and crop productivity gains and will lead to improved river health.

