daimler q2/2015: corporate presentation summer
TRANSCRIPT

1
Corporate Presentation Summer 2015

Contents
2
HIGHLIGHTS AND RESULTS FOR Q2 2015
OUTLOOK FOR 2015
DIVISIONAL INFORMATION
APPENDIX
DAIMLER GROUP STRATEGY

Mercedes-Benz Cars: product highlights
3
New Mercedes-Benz GLE and GLE Coupé
New generation of Mercedes-Benz A-Class New Mercedes-Benz GLC
Mercedes-Benz Concept GLC Coupé
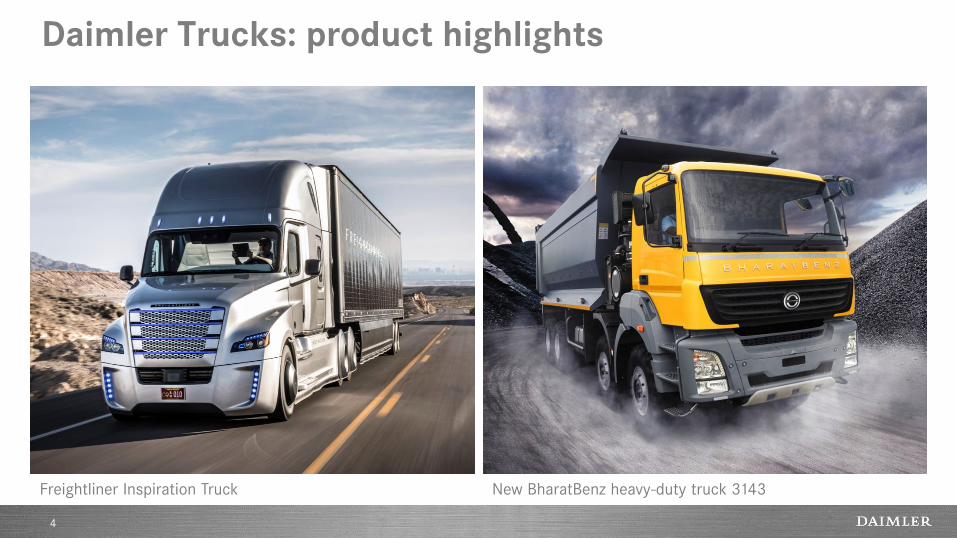
Daimler Trucks: product highlights
4
New BharatBenz heavy-duty truck 3143 Freightliner Inspiration Truck

Mercedes-Benz Vans: product highlights
5
Mercedes-Benz Vans: best in class for safety

Daimler Buses: product highlights
6
Mercedes-Benz CapaCity L Mercedes-Benz and Setra buses in annual winter tests
Daimler Buses: leading position in safety technology

Highlights of Q2 2015
7
+14%
+20%
+54%
714,800
500,700
€3.8bn
Group unit sales
Highest unit sales so far at Mercedes-Benz Cars
Increase in EBIT from ongoing business
Start of production of new GLE Coupé
World premiere of Freightliner Inspiration Truck on US highway
Presentation of new generation A-Class and new GLE as successor of M-Class
World premiere of new Mercedes-Benz GLC and Concept GLC Coupé
Opening of new bus plant in Chennai, India

Key financials
8
– in billions of euros –
Q2 2014 Q2 2015
Revenue 31.5 37.5
EBIT
as reported 3.1 3.7
from ongoing business 2.5 3.8
Net profit 2.2 2.4
Earnings per share (in euros) 1.97 2.12
Net liquidity industrial business (2014: year-end) 17.0 18.4
Free cash flow industrial business (January-June) 1.4 3.4

Key balance sheet figures
9
Daimler Group Dec. 31, 2014 June 30, 2015
Equity ratio 22.1% 23.9%
Gross liquidity 16.3 16.1
Industrial business
Equity ratio 40.8% 45.3%
Net liquidity 17.0 18.4
– in billions of euros –
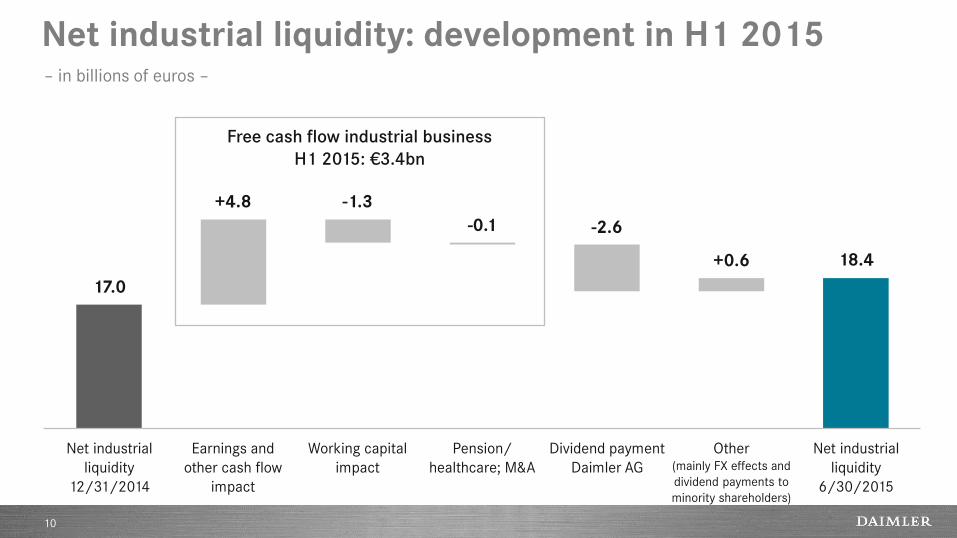
Net industrial liquidity: development in H1 2015
10
– in billions of euros –
Free cash flow industrial business
H1 2015: €3.4bn
Net industrial
liquidity
12/31/2014
Earnings and
other cash flow
impact
Working capital
impact
Other (mainly FX effects and
dividend payments to
minority shareholders)
Net industrial
liquidity
6/30/2015
-1.3
18.4 +0.6
17.0
+4.8
-0.1
Pension/
healthcare; M&A
-2.6
Dividend payment
Daimler AG

Unit sales
11
Q2 2014 Q2 2015 % change
Daimler Group 628.9 714.8 +14
of which
Mercedes-Benz Cars 418.7 500.7 +20
Daimler Trucks 126.1 125.1 -1
Mercedes-Benz Vans 76.0 81.6 +7
Daimler Buses 8.1 7.3 -9
– in thousands of units –

Revenue by division
12
Q2 2014 Q2 2015 % change
Daimler Group 31.5 37.5 +19
of which
Mercedes-Benz Cars 17.8 21.1 +19
Daimler Trucks 8.0 9.4 +19
Mercedes-Benz Vans 2.5 2.8 +13
Daimler Buses 1.0 1.0 -1
Daimler Financial Services 3.8 4.8 +25
Contract volume of
Daimler Financial Services* 99.0 110.6 +12
– in billions of euros –
* Figures as of December 31, 2014 and June 30, 2015.
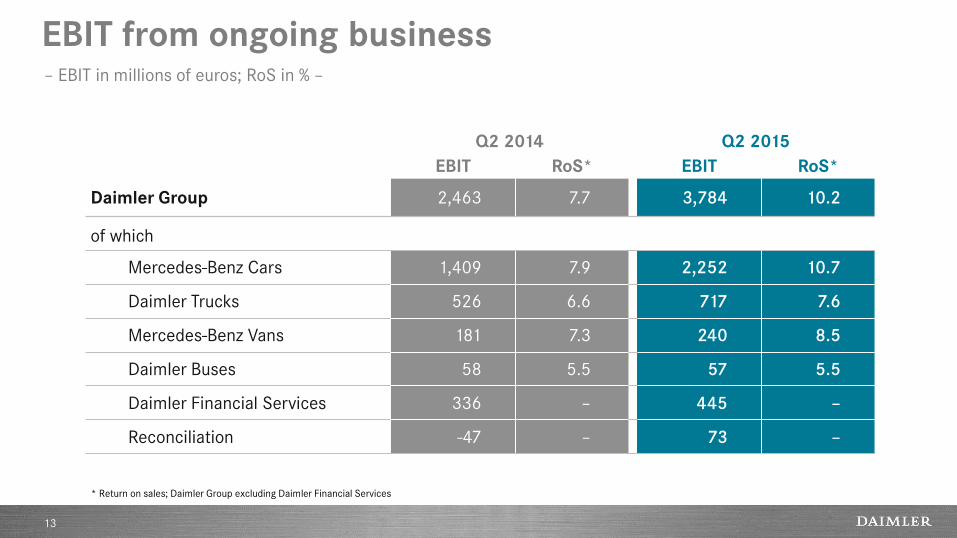
EBIT from ongoing business
13
Q2 2014 Q2 2015
EBIT RoS* EBIT RoS*
Daimler Group 2,463 7.7 3,784 10.2
of which
Mercedes-Benz Cars 1,409 7.9 2,252 10.7
Daimler Trucks 526 6.6 717 7.6
Mercedes-Benz Vans 181 7.3 240 8.5
Daimler Buses 58 5.5 57 5.5
Daimler Financial Services 336 – 445 –
Reconciliation -47 – 73 –
* Return on sales; Daimler Group excluding Daimler Financial Services
– EBIT in millions of euros; RoS in % –

Contents
14
HIGHLIGHTS AND RESULTS FOR Q2 2015
OUTLOOK FOR 2015
DIVISIONAL INFORMATION
APPENDIX
DAIMLER GROUP STRATEGY

Clear aspiration for all our divisions
15
15
Daimler Buses Daimler Trucks Mercedes-Benz
Vans Daimler Financial
Services
“Most successful
premium
manufacturer”
Mercedes-Benz Cars
“No 1 in
the global truck
business”
“Best financial
and mobility
services provider”
“No 1 in the
global bus
business”
“Most successful
player in
worldwide van
business”
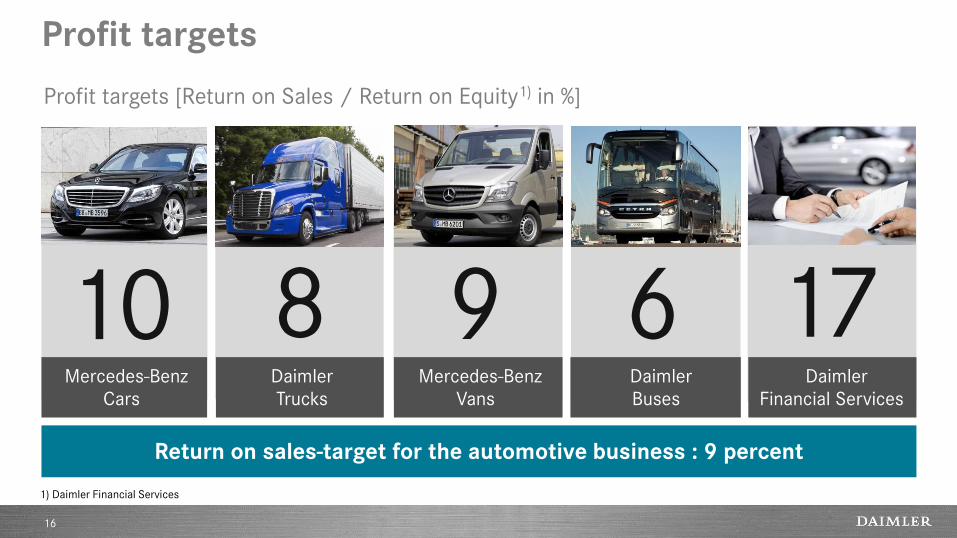
Profit targets
16
Profit targets [Return on Sales / Return on Equity1) in %]
1) Daimler Financial Services
Return on sales-target for the automotive business : 9 percent
9 6 17 10
Mercedes-Benz
Cars
8 Daimler
Trucks
Mercedes-Benz
Vans
Daimler
Buses
Daimler
Financial Services

The four strategic growth areas of Daimler
17
Core business
Clean, safe, connected Mobility concepts &
DigitalLife
New growth markets

Contents
18
HIGHLIGHTS AND RESULTS FOR Q2 2015
OUTLOOK FOR 2015
DIVISIONAL INFORMATION
APPENDIX
DAIMLER GROUP STRATEGY

19
Mercedes-Benz Cars
20
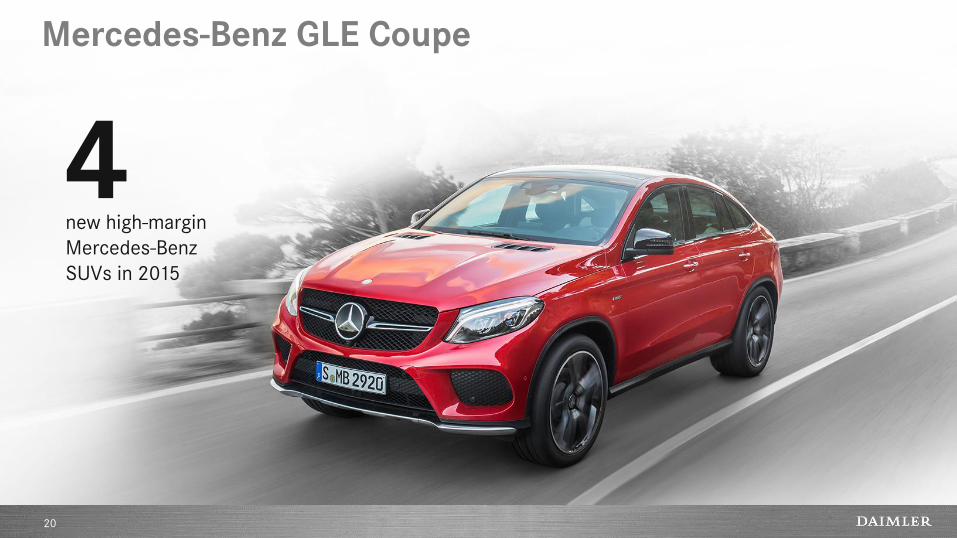
Mercedes-Benz GLE Coupe
4 new high-margin
Mercedes-Benz
SUVs in 2015

21
maximum load capacity 1,354 L
Mercedes-Benz CLA Shooting Brake
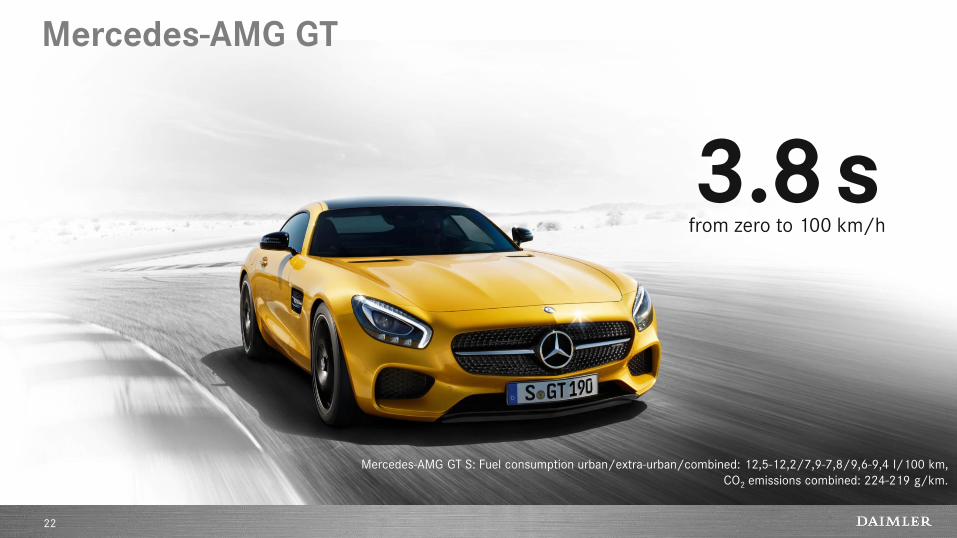
22
from zero to 100 km/h
3.8 s
Mercedes-AMG GT S: Fuel consumption urban/extra-urban/combined: 12,5-12,2/7,9-7,8/9,6-9,4 l/100 km,
CO2 emissions combined: 224-219 g/km.
Mercedes-AMG GT

23
Mercedes-AMG GT S: Fuel consumption urban/extra-urban/combined: 12,5-12,2/7,9-7,8/9,6-9,4 l/100 km,
CO2 emissions combined: 224-219 g/km.
By significantly expanding our portfolio we create the basis for further profitable growth
… +

24
Mercedes-AMG GT S: Fuel consumption urban/extra-urban/combined: 12,5-12,2/7,9-7,8/9,6-9,4 l/100 km,
CO2 emissions combined: 224-219 g/km.
Plug-In vehicles:
24
- Huge lever to improve MBC fleet consumption -
230
220
210
200
190
180
170
160
150
140
2009
173
2008
183
0 2007
158
1995
120
2011 2010
130
160
CO
2-e
mis
sio
ns
(g/
km
)
9.2 l 7.3 l 6.9 l 6.3 l 6.4 l
150
6.0 l
2012
125
5.0 l
… 2016 …
100
110
140
5.6 l
230
-40%
until 2020
95
<4.0 l
EU Legislation
2013
134
5.4 l
-7%
129
5.2 l
2014
25
Mercedes-AMG GT S: Fuel consumption urban/extra-urban/combined: 12,5-12,2/7,9-7,8/9,6-9,4 l/100 km,
CO2 emissions combined: 224-219 g/km.
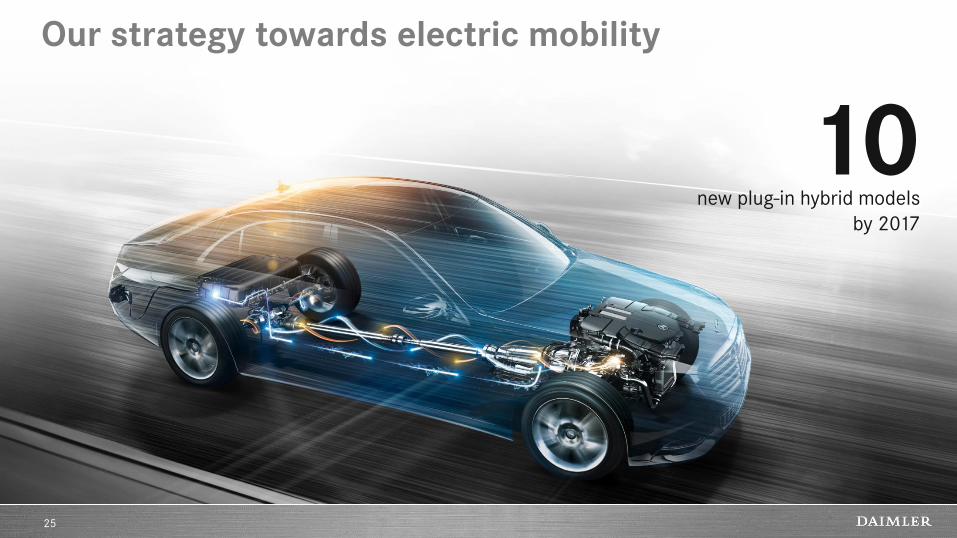
10 new plug-in hybrid models
by 2017
Our strategy towards electric mobility
25

26
Mercedes-AMG GT S: Fuel consumption urban/extra-urban/combined: 12,5-12,2/7,9-7,8/9,6-9,4 l/100 km,
CO2 emissions combined: 224-219 g/km.
C-Class 350 e
26
31 km range in all-electric mode
2.1 l fuel per 100 kilometres
48 gCO2/km

Product offensive to fuel our sales offensive
2014 1992 2025
Current Product
offensive
Mercedes-Benz sales development
First product
offensive
530 k
1.63 m
Schematic
representation
27
Current Product
offensive
First product
offensive

Mercedes-AMG GT S: Fuel consumption urban/extra-urban/combined: 12,5-12,2/7,9-7,8/9,6-9,4 l/100 km,
CO2 emissions combined: 224-219 g/km.
Efficiency increase for profitable growth
28
2020 Today
Asset and fixed cost development
Revenue growth
Our growth plan
Schematic
representation

China: key market for our growth plans
≫300,000 2015 units sales target
for Mercedes-Benz in China
29

30
15 years from now
this car could be reality
Autonomous driving goes far beyond technology

31
Connectivity as ‘enabling technology’ is the core of…
EVs
Charging Station Search
Range on Map
Remote Services
Examples
Safety
Live Traffic Information
Car-2-X Warnings
Emergency Call
Examples
Autonomous
Driving
Car-2-Car Communication
Intelligent Parking Assist
Smart Routing
Examples
Infotainment
Navigation
Radio/ Media
Internet/ Apps
Examples

32
Daimler Trucks
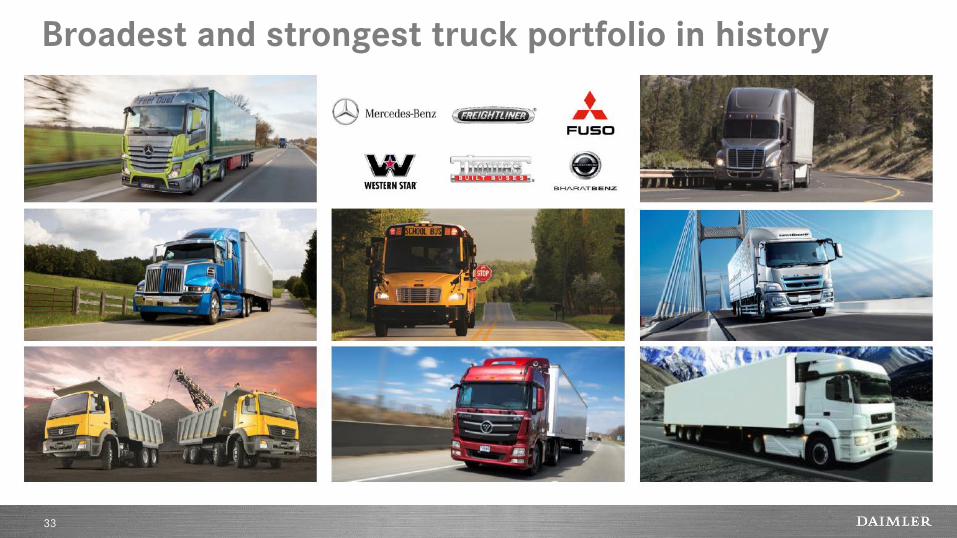
Broadest and strongest truck portfolio in history
33

We’re focusing our energy on the right issues
34
Technology leadership in efficiency, safety and
connectivity
Global Market Presence in traditional and
emerging markets
Intelligent Platforms for tailored products and
decisive economies of scale

Efficiency: the most efficient trucks are Daimler Trucks
35
~11% ~7% ~5%
*Average saving versus competitor vehicles in over 1,000 so-called “fuel duels” in European fleets in 2015.
Mercedes-Benz Actros Freightliner Cascadia Evolution Fuso Super Great V
less fuel than “fuel duel” competitors* less fuel than previous model
below Fuel Efficiency Standard in Japan

36
*Status as of July 2015: EURO-6- & EURO-5-vehicles.
1,331 Duels completed*
6,345,108 Kilometers driven*
Ø10.2% Consumption advantage*
Fuel Duel: Actros demonstrates its reliability, safety and efficiency and leaves the competition far behind
>90% Duels won*

37
Freightliner Inspiration Truck: the first licensed autonomous driving truck globally

Connectivity: the truck becomes part of an interacting environment
38
+6% uptime Driver Headquarters
Technician Service
-20% repair costs

India, Africa: product offensive continues
39
New BharatBenz trucks for India
New FUSO trucks from India for
Africa, Asia, and Latin America

Grow our strong position in core markets, develop our position in emerging markets
40
China NAFTA
Japan
Europe
Brazil
India
Southeast
Asia
Latin America
Middle
East
Africa
Asia Business Model
Russia

Even closer to our customers with new sales structure
41

NAFTA: integrated powertrain components are real game-changers
42
Heavy Duty Engines - DD15 & DD13
89% Penetration
Automated Manual Transmission – DT12
23% Penetration
Front Axle
70% Penetration
Rear Axle
50% Penetration
Status: Year end 2014

We implement our platform strategy in all key regions
43
Transmissions
Cab architecture
Electrics/ electronics
Chassis
EU LA
Medium-duty engines
Heavy-duty engines
Existing platform components Further platforms in discussion
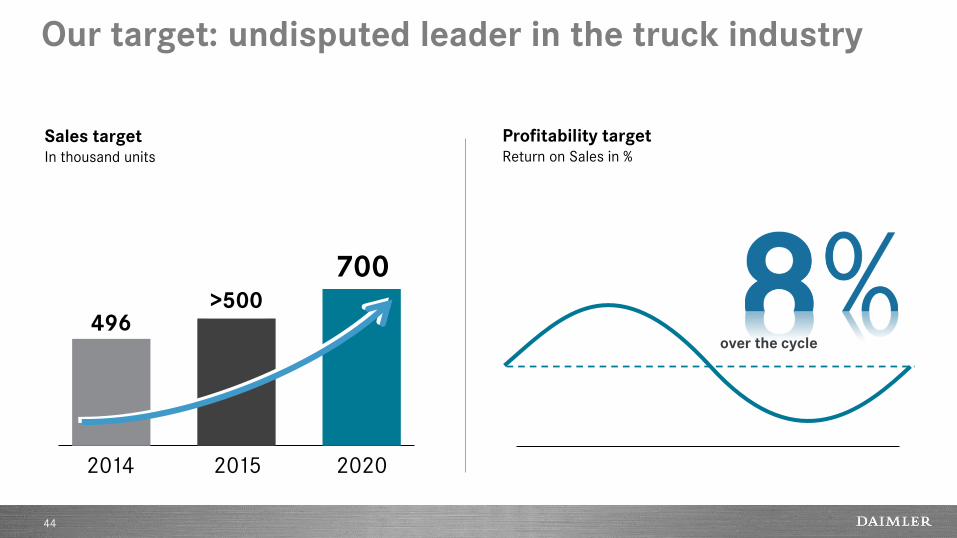
Our target: undisputed leader in the truck industry
44
Sales target In thousand units
496
2014
>500
2015
700
2020
Profitability target Return on Sales in %
over the cycle


46
Strong business growth – Contract volume [€ billion]–
56 59 63
58 64
72
2006 2007 2008 2009 2010 2011
80
2012
84
2013
99
2014

Services become an ever-more important part of our business model
47
* Global average penetration rate with regard to passenger cars and commercial vehicles
Financing
Leasing Insurance
Fleet Management
Banking Services
Mobility Services
Mercedes-Benz Rent
Nearly every second vehicle
delivered to customers worldwide
is being financed or leased*

48
>1,000,000 people use our mobility services
Mobility services on growth path
Contents
49
HIGHLIGHTS AND RESULTS FOR Q2 2015
OUTLOOK FOR 2015
DIVISIONAL INFORMATION
APPENDIX
DAIMLER GROUP STRATEGY

Our product offensive continues
50
2015
Mercedes-Benz
Vans
Daimler
Buses
Daimler
Trucks
Mercedes-Benz
Cars Mercedes-
AMG GT
Western Star 5700XE Econic NGT MB Unimog off-road
BharatBenz Buses
Arocs HAD
Setra MultiClass Low Entry 3-Axle
BharatBenz 3143
MB Citaro NGT
• 2015
Mercedes-Maybach
CLA Shooting Brake
GLE Coupé
Metris
(Vito NAFTA)
Vito
(Latin America)
Vito panel van / Vito Tourer
(Europe)
Mercedes-Benz CapaCity
GLE A-Class new generation
GLC

Assumptions for automotive markets in 2015
51
Car markets
Global
Western Europe
Medium- and
heavy-duty truck
markets
NAFTA region
Europe
Japan*
Brazil
Europe
Bus markets Europe
Brazil
around +2%
slight growth
+10 to 15%
+10 to 15%
around the prior year level
around -40%
significant growth
slight growth
at least -25%
USA slight growth
Van markets
* including light-duty trucks
Indonesia* around -20%
China significant growth

2015 sales outlook
52
• Significantly higher unit sales based on young and attractive product portfolio
• Strong momentum from full availability of new C-Class and smart models
• Launch of all-new Mercedes-Maybach, Mercedes-AMG GT, CLA Shooting Brake and GLE Coupé
• Significant decrease in unit sales
• Maintain market leadership in Western Europe and Brazil
• Stable sales development in Europe, significant sales decrease in Latin America
• Significantly higher unit sales
• Strong momentum from full availability of new Vito and V-Class
• Product expansion to North and South America
• Significantly higher unit sales due to strong product portfolio
• Continued strong sales development in NAFTA region
• Growth potential due to new Asia Business Model

2015 outlook for EBIT from ongoing business
53
This guidance is based on current outlined market expectations and current exchange-rate expectations.
Significantly above the prior-year level
Significantly above the prior-year level
Significantly above the prior-year level
Significantly below the prior-year level
Significantly above the prior-year level
We expect Group EBIT for FY 2015 to increase significantly
based on the following expectations for divisional EBIT:
Daimler Financial Services

Contents
54
HIGHLIGHTS AND RESULTS FOR Q2 2015
OUTLOOK FOR 2015
DIVISIONAL INFORMATION
APPENDIX
DAIMLER GROUP STRATEGY

Group EBIT in Q2 2015
55
Actual Q2 2014
Volume/ Structure/ Net pricing
Foreign exchange
rates
Other cost changes
Reconciliation Actual Q2 2015
Financial Services
-116 -698
3,718
+109
3,095
+279 +929
• Cars +670 • Trucks +141 • Vans +117 • Buses +1
• Cars +115 • Trucks +149 • Vans +4 • Buses +11
• Cars +57 • Trucks -99 • Vans -61 • Buses -13
of which: change in interest rates* +195
• Cars +139 • Trucks +39
of which:
• Sales organization Germany -55
• Workforce adjustments Daimler Trucks +51
• Remeasurement of Tesla shares** -718
• Hedge of Tesla share price** +68
• Reversal of impairment FBAC** -61
Special items affecting
EBIT
+120
– in millions of euros –
* Compounding of provisions and effects of increased discount rates ** in Q2 2014

EBIT by division
56
Q2 2014 Q2 2015
EBIT RoS* EBIT RoS*
Daimler Group 3,095 10.0 3,718 10.0
of which
Mercedes-Benz Cars 1,409 7.9 2,227 10.5
Daimler Trucks 455 5.7 682 7.2
Mercedes-Benz Vans 242 9.7 234 8.3
Daimler Buses 50 4.8 57 5.5
Daimler Financial Services 336 – 445 –
Reconciliation 603 – 73 –
* Return on sales; Daimler Group excluding Daimler Financial Services
– EBIT in millions of euros; RoS in % –
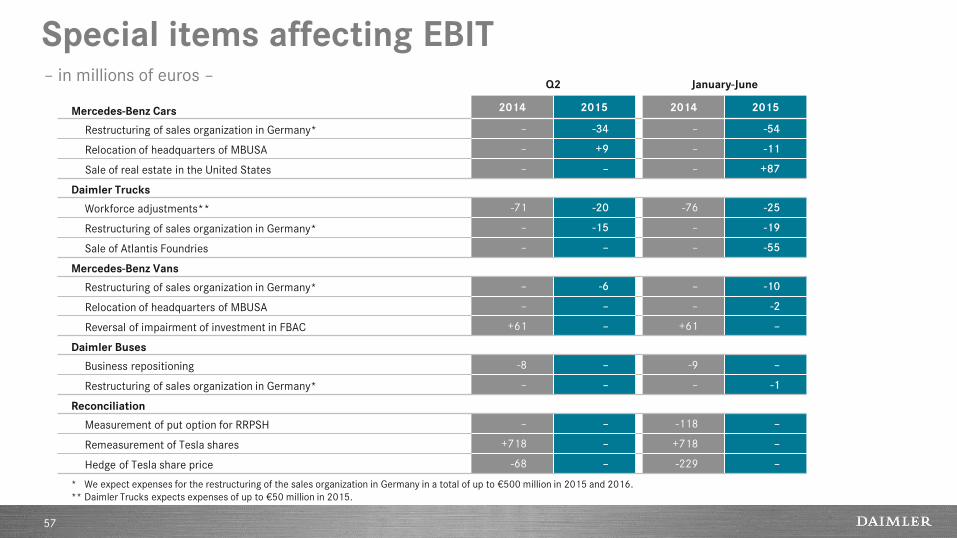
Special items affecting EBIT
57
Q2 January-June
Mercedes-Benz Cars 2014 2015 2014 2015
Restructuring of sales organization in Germany* – -34 – -54
Relocation of headquarters of MBUSA – +9 – -11
Sale of real estate in the United States – – – +87
Daimler Trucks
Workforce adjustments** -71 -20 -76 -25
Restructuring of sales organization in Germany* – -15 – -19
Sale of Atlantis Foundries – – – -55
Mercedes-Benz Vans
Restructuring of sales organization in Germany* – -6 – -10
Relocation of headquarters of MBUSA – – – -2
Reversal of impairment of investment in FBAC +61 – +61 –
Daimler Buses
Business repositioning -8 – -9 –
Restructuring of sales organization in Germany* – – – -1
Reconciliation
Measurement of put option for RRPSH – – -118 –
Remeasurement of Tesla shares +718 – +718 –
Hedge of Tesla share price -68 – -229 –
* We expect expenses for the restructuring of the sales organization in Germany in a total of up to €500 million in 2015 and 2016.
** Daimler Trucks expects expenses of up to €50 million in 2015.
– in millions of euros –

Mercedes-Benz Cars: profitable growth through success of attractive models
58
Unit sales – in thousands of units –
Q2 2014 Q2 2015
Revenue – in billions of euros –
EBIT from ongoing business – in millions of euros –
419
501
Q2 2014 Q2 2015
17.8
21.1
Q2 2014 Q2 2015
1,409
2,252
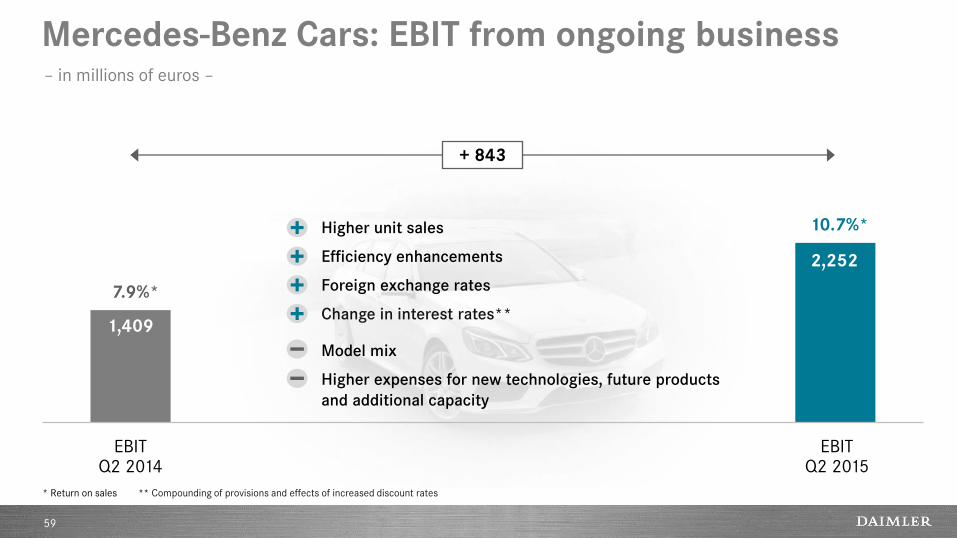
Mercedes-Benz Cars: EBIT from ongoing business
59
EBIT Q2 2014
EBIT Q2 2015
1,409
2,252
+ 843
7.9%*
10.7%* Higher unit sales
Efficiency enhancements
Foreign exchange rates
Change in interest rates**
Model mix
Higher expenses for new technologies, future products
and additional capacity
– in millions of euros –
* Return on sales ** Compounding of provisions and effects of increased discount rates
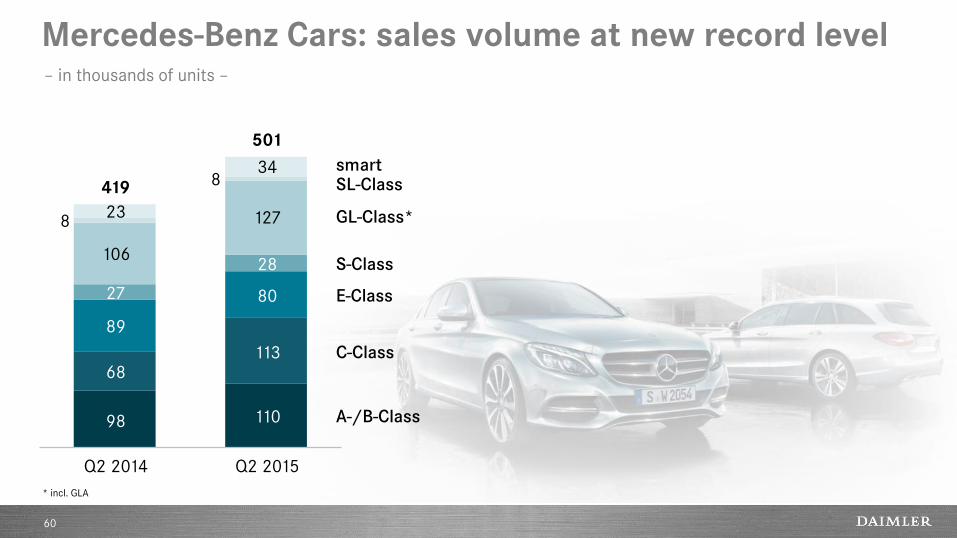
Mercedes-Benz Cars: sales volume at new record level
60
– in thousands of units –
Q2 2014
419
501
Q2 2015
110
113
80
28
8
98
68
89
27
8
smart
E-Class
C-Class
A-/B-Class
S-Class
SL-Class 34
23 GL-Class*
106
127
* incl. GLA

Mercedes-Benz Cars: balanced sales structure
61
Q2 2014
Rest of world
Germany
United States
China
419
Western Europe
excl. Germany
501
Q2 2015
91
90
79
122
119
68
82
73
99
97
– Unit sales in thousands –

Daimler Trucks: successful development in heterogeneous market environment
62
126 125
8.0
9.4
526
717
Unit sales – in thousands of units –
Revenue – in billions of euros –
EBIT from ongoing business – in millions of euros –
Q2 2014 Q2 2015 Q2 2014 Q2 2015 Q2 2014 Q2 2015

Daimler Trucks: EBIT from ongoing business
63
EBIT Q2 2014
EBIT Q2 2015
526
717
+ 191
6.6%*
7.6%*
* Return on sales ** Compounding of provisions and effects of increased discount rates
Higher unit sales in NAFTA region and Western Europe
Efficiency enhancements
Foreign exchange rates
Change in interest rates**
Lower unit sales in Latin America and Indonesia
Higher expenses for additional capacity
– in millions of euros –

Daimler Trucks: sales growth in NAFTA region and Western Europe
64
Q2 2014
Rest of world
126
Asia
125
Q2 2015
15
49
9
35
17
13
41
12
43
17
Western Europe
NAFTA region
Latin America
– in thousands of units –

Daimler Trucks: incoming orders at a high level
65
125 124
17
40
8
38
21
14
40
12
40
19
Asia
Western Europe
NAFTA region
Rest of world
Latin America
Q2 2014 Q2 2015
– in thousands of units –

Mercedes-Benz Vans: success in volatile markets
66
76.0 81.6
2.5 2.8
181
240
Unit sales – in thousands of units –
Revenue – in billions of euros –
EBIT from ongoing business – in millions of euros –
Q2 2014 Q2 2015 Q2 2014 Q2 2015 Q2 2014 Q2 2015

Mercedes-Benz Vans: EBIT from ongoing business
67
EBIT Q2 2014
EBIT Q2 2015
181
240
+ 59
7.3%*
8.5%*
* Return on sales
Higher unit sales
Model mix
– in millions of euros –

Mercedes-Benz Vans: market success of mid-size vans
68
76 82
5
20
49
6
16
49
V-Class
Sprinter
Vito
8
Citan
Q2 2014 Q2 2015
5
– in thousands of units –

Daimler Buses: strong EBIT despite significant market contraction in Latin America
69
8.1 7.3
1.0 1.0 58 57
Unit sales – in thousands of units –
Revenue – in billions of euros –
EBIT from ongoing business – in millions of euros –
Q2 2014 Q2 2015 Q2 2014 Q2 2015 Q2 2014 Q2 2015
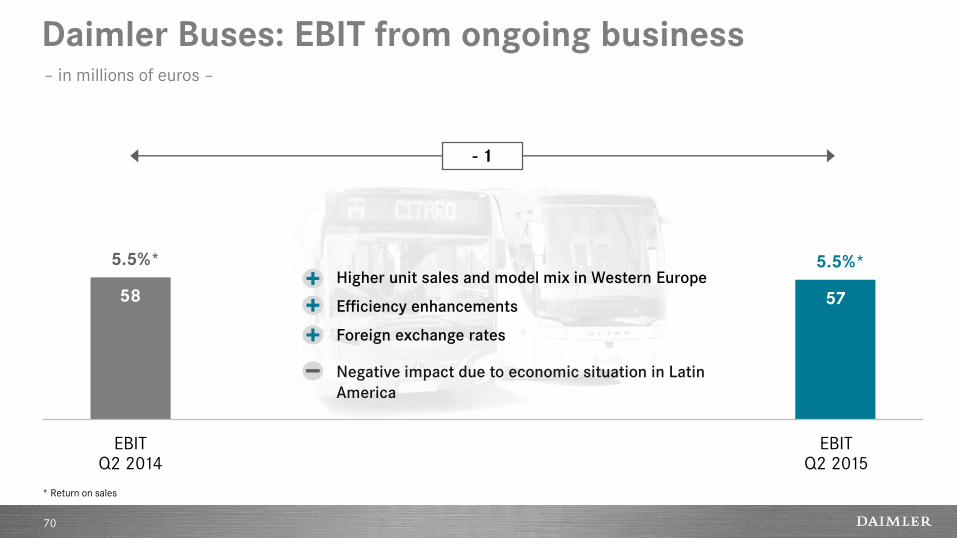
Daimler Buses: EBIT from ongoing business
70
EBIT Q2 2014
EBIT Q2 2015
58 57
- 1
5.5%* 5.5%*
* Return on sales
Higher unit sales and model mix in Western Europe
Efficiency enhancements
Foreign exchange rates
Negative impact due to economic situation in Latin
America
– in millions of euros –

Daimler Buses: higher demand for complete buses, lower demand for bus chassis
71
Europe
Mexico
Rest of world
Brazil
Latin America (excl. Brazil and Mexico)
0.6
8.1
2.2
1.0
3.5
0.8
7.3
2.4
0.9
1.9
0.7
1.4
Q2 2014 Q2 2015
– in thousands of units –

Daimler Financial Services: further business growth
72
11.5
14.8
12/31/2014 6/30/2015
99.0 110.6
336
445
New business – in billions of euros –
Contract volume – in billions of euros –
EBIT from ongoing business – in millions of euros –
Q2 2014 Q2 2015 Q2 2014 Q2 2015
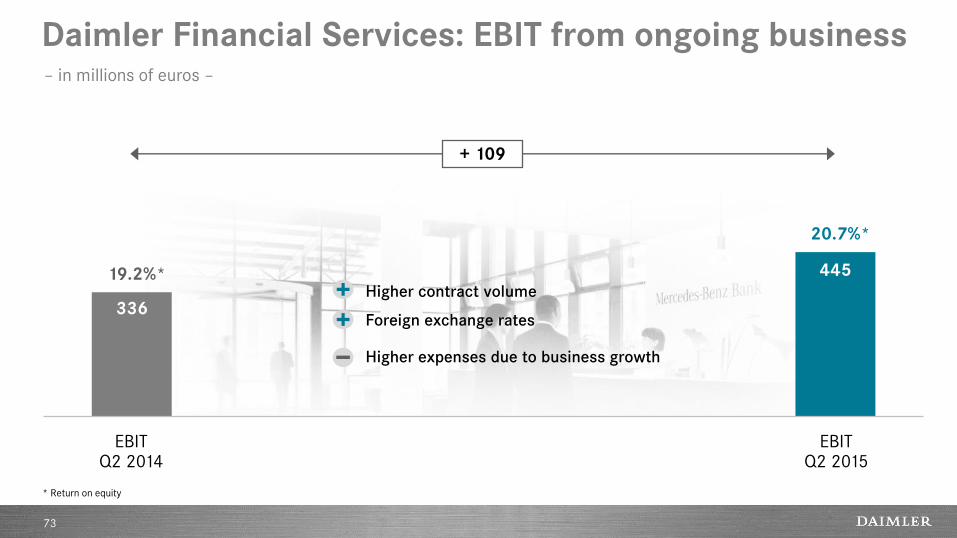
Daimler Financial Services: EBIT from ongoing business
73
EBIT Q2 2014
EBIT Q2 2015
336
445
+ 109
19.2%*
20.7%*
* Return on equity
Higher contract volume
Foreign exchange rates
Higher expenses due to business growth
– in millions of euros –

Daimler Financial Services: growth in all regions
74
12/31/2014 6/30/2015
Europe (excl. Germany)
Americas
Africa & Asia-Pacific
Germany
99.0
18.7
21.7
43.1
15.4
110.6
19.1
24.2
48.6
18.6
– in billions of euros –

Daimler Financial Services: net credit losses* at low level
75
0,69% 0,68%
0,50% 0,61%
0,36%
0,51%
0,89% 0,83%
0,43% 0,34% 0,37%
0,31%
* as a percentage of portfolio, subject to credit risk
0,20%
2003 2004 2005 2006 2007 2008 2009 2010 2011 2012 2013 2014 2015
YTD

Capital expenditure / Research and development
76
– in billions of euros –
Investment in property, plant and equipment Research and development expenditure
Actual
2013
Actual
2014
5.0
Plan
2015/2016
(average p.a.)
4.8
5.6
Actual
2013
Actual
2014
5.5 5.7
6.7
Plan
2015/2016
(average p.a.)

Development of investment and R&D expenditure
77
– in billions of euros –
11.6 11.0
12.2
8.8
10.9
Actual 2010
Actual 2011
Actual 2012
Actual 2013
Actual 2014
Research and development expenditure
Investment in property, plant and equipment
Financial investments and other intangible assets*
* excluding capitalized development costs
Plan 2015/16
(average p.a.)
13.0

Capital expenditure / Research and development
78
– in billions of euros –
Investment in property, plant
and equipment
Research and development
expenditure
Actual
2013
Actual
2014
Plan
2015-2016
Actual
2013
Actual
2014
Plan
2015-2016
Daimler Group 5.0 4.8 5.6 5.5 5.7 6.7
of which
Mercedes-Benz Cars 3.7 3.6 4.0 3.8 4.0 4.9
Daimler Trucks 0.8 0.8 1.1 1.2 1.2 1.2
Mercedes-Benz Vans 0.3 0.3 0.3 0.3 0.3 0.4
Daimler Buses 0.1 0.1 0.1 0.2 0.2 0.2
Daimler Financial Services 0.02 0.02 0.01 – – –

Disclaimer
79
This document contains forward-looking statements that reflect our current views about future events. The words “anticipate,” “assume,” “believe,”
“estimate,” “expect,” “intend,” “may,” ”can,” “could,” “plan,” “project,” “should” and similar expressions are used to identify forward-looking
statements. These statements are subject to many risks and uncertainties, including an adverse development of global economic conditions, in
particular a decline of demand in our most important markets; a worsening of the sovereign-debt crisis and increasing uncertainty in the euro zone;
an increase in political tension in Eastern Europe; a deterioration of our refinancing possibilities on the credit and financial markets; events of force
majeure including natural disasters, acts of terrorism, political unrest, industrial accidents and their effects on our sales, purchasing, production or
financial services activities; changes in currency exchange rates; a shift in consumer preferences towards smaller, lower-margin vehicles; a possible
lack of acceptance of our products or services which limits our ability to achieve prices and adequately utilize our production capacities; price
increases for fuel or raw materials; disruption of production due to shortages of materials, labor strikes or supplier insolvencies; a decline in resale
prices of used vehicles; the effective implementation of cost-reduction and efficiency-optimization measures; the business outlook for companies in
which we hold a significant equity interest; the successful implementation of strategic cooperations and joint ventures; changes in laws, regulations
and government policies, particularly those relating to vehicle emissions, fuel economy and safety; the resolution of pending government
investigations and the conclusion of pending or threatened future legal proceedings; and other risks and uncertainties, some of which we describe
under the heading “Risk and Opportunity Report” in the current Annual Report. If any of these risks and uncertainties materializes or if the
assumptions underlying any of our forward-looking statements prove to be incorrect, the actual results may be materially different from those we
express or imply by such statements. We do not intend or assume any obligation to update these forward-looking statements since they are based
solely on the circumstances at the date of publication.