d3 data visualization
TRANSCRIPT

D3 Data Visualization

USE CASES

Nation’s Report Card.govShapes: Natural EarthProjection: Albers USA

GlobalChange.govShapes: custom

BUILDING BLOCKS
Scalable Vector Graphics (SVG)
Scalable Vector Graphics (SVG) is an XML-based vector image format for two-dimensional graphics with support for interactivity and animation.
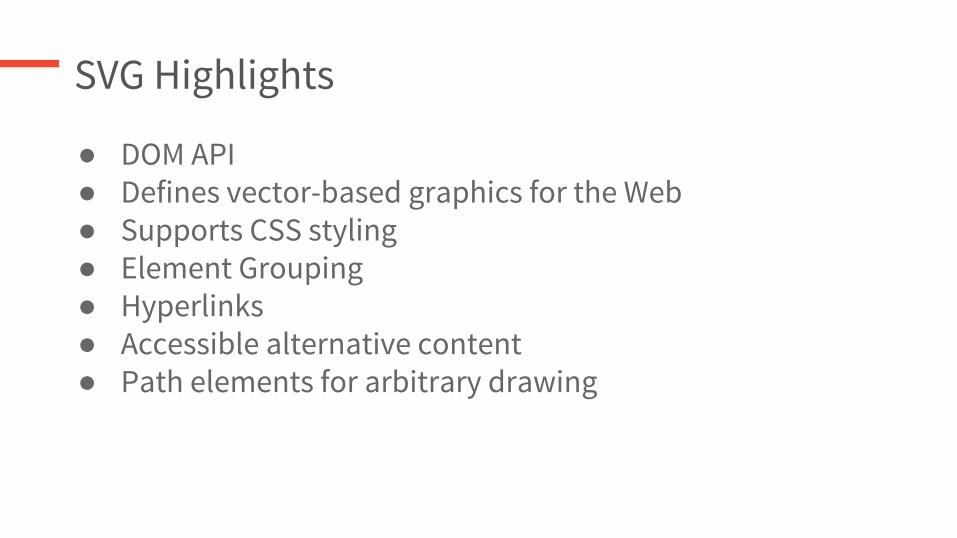
SVG Highlights
● DOM API● Defines vector-based graphics for the Web● Supports CSS styling● Element Grouping● Hyperlinks● Accessible alternative content● Path elements for arbitrary drawing

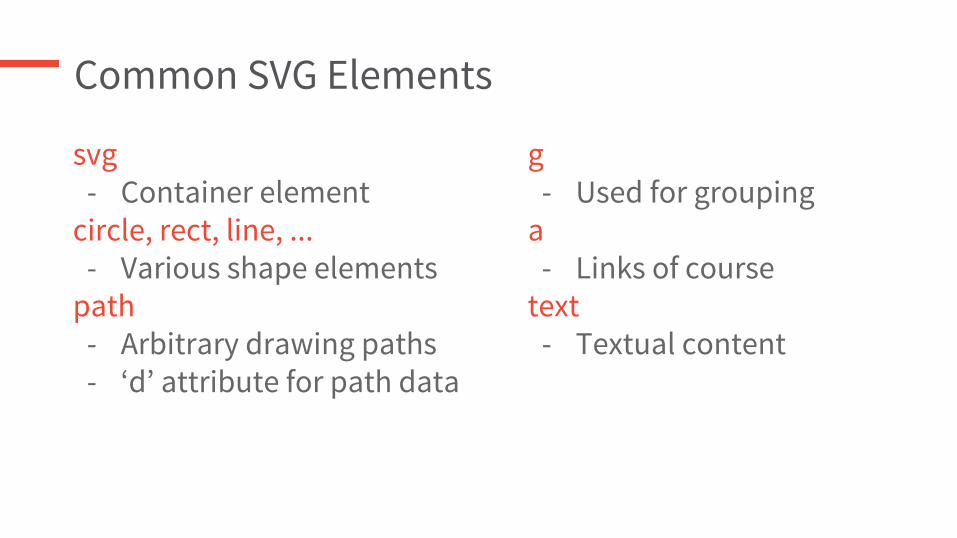
Common SVG Elements
svg- Container element
circle, rect, line, ... - Various shape elements
path- Arbitrary drawing paths- ‘d’ attribute for path data
g- Used for grouping
a- Links of course
text- Textual content
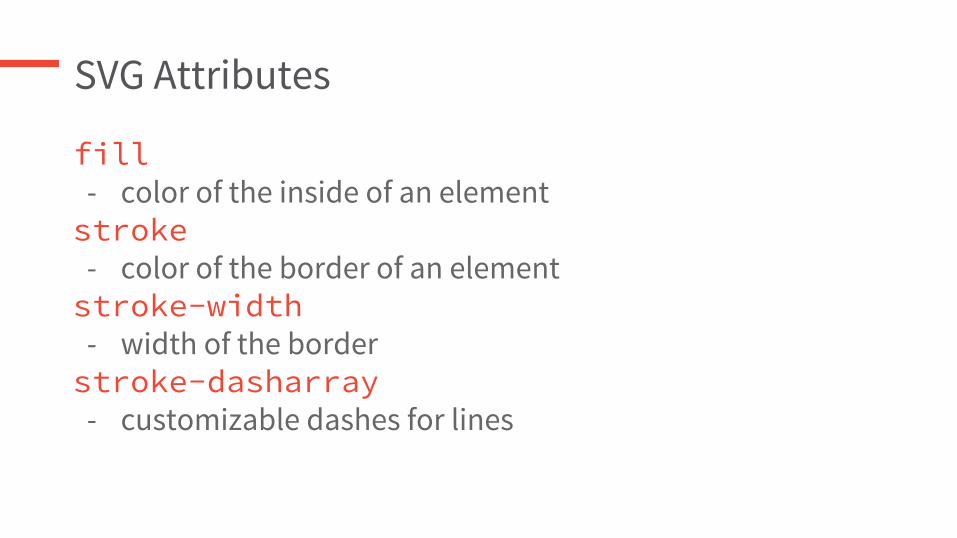
SVG Attributes
fill- color of the inside of an elementstroke
- color of the border of an elementstroke-width
- width of the borderstroke-dasharray
- customizable dashes for lines

<html><body>
<h1>My first SVG</h1>
<svg width="600" height="600"></svg> </body></html>
My first SVG
<html><body>
<h1>My first SVG</h1>
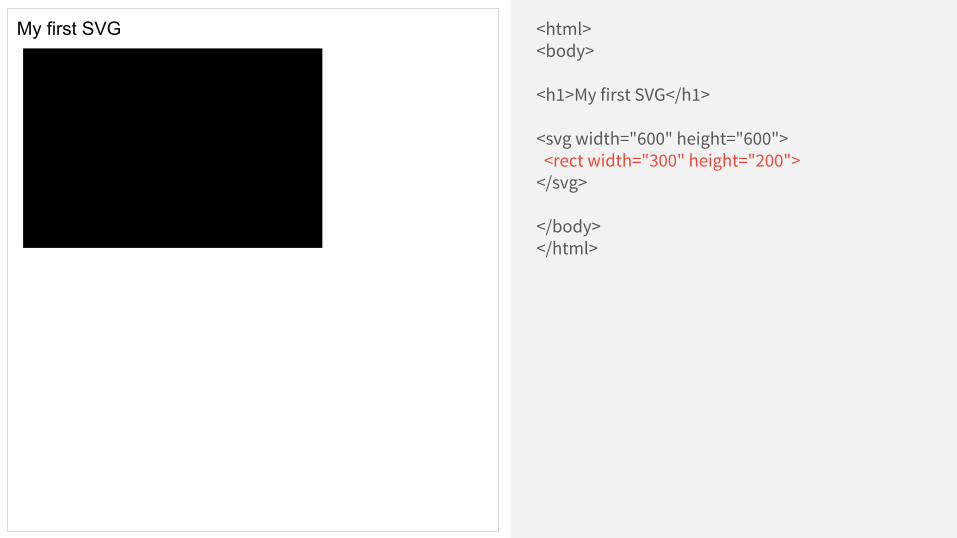
<svg width="600" height="600"> <rect width="300" height="200"></svg> </body></html>
My first SVG

<html><body>
<h1>My first SVG</h1>
<svg width="600" height="600"> <rect width="300" height="200" fill="red" stroke="black" stroke-width="4"></svg> </body></html>
My first SVG

<html><body>
<h1>My first SVG</h1>
<svg width="600" height="600"> <rect width="300" height="200" fill="red" stroke="black" stroke-width="4"> <circle r="80" fill="purple" /></svg> </body></html>
My first SVG

<html><body>
<h1>My first SVG</h1>
<svg width="600" height="600"> <rect width="300" height="200" fill="red" stroke="black" stroke-width="4" x="10" y="10" /> <circle r="80" fill="purple" cx="100" cy="100" /></svg> </body></html>
My first SVG
<html><body>
<h1>My first SVG</h1>
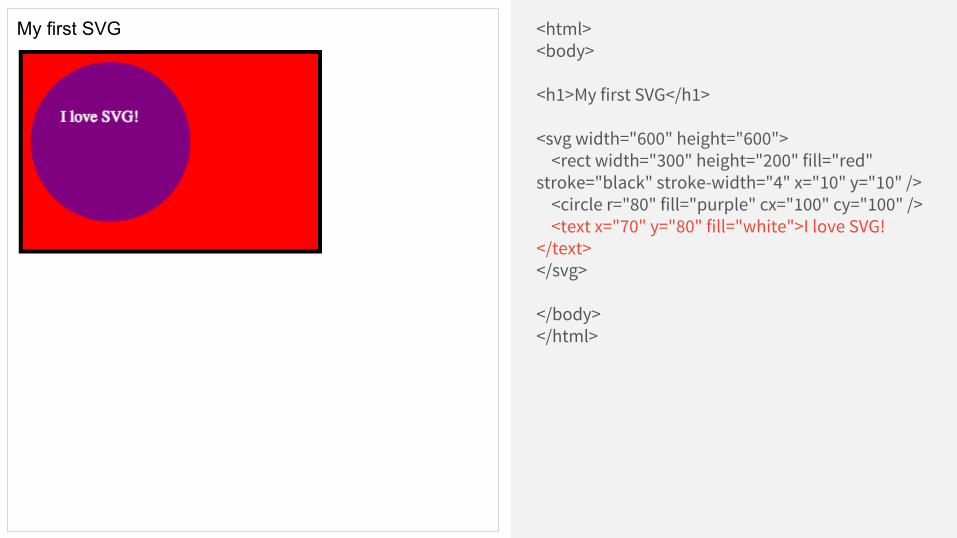
<svg width="600" height="600"> <rect width="300" height="200" fill="red" stroke="black" stroke-width="4" x="10" y="10" /> <circle r="80" fill="purple" cx="100" cy="100" /> <text x="70" y="80" fill="white">I love SVG!</text></svg> </body></html>
My first SVG

SVG Path● M = moveto● L = lineto● H = horizontal lineto● V = vertical lineto● C = curveto● S = smooth curveto● Q = quadratic Bézier curve● T = smooth quadratic Bézier curveto● A = elliptical Arc● Z = closepath

<html><body>
<h1>My first SVG</h1>
<svg width="600" height="600"> <path d="M150 0 L75 200 L225 200 Z" /></svg> </body></html>
My first SVG
SVG + CSS

<html><body>
<style>svg path { fill:red; stroke-width:4; stroke:black;}</style>
<h1>My first SVG</h1>
<svg width="600" height="600"> <path d="M150 0 L75 200 L225 200 Z" /></svg> </body></html>
My first SVG
SVG + CSS + D3

What is D3?
D3.js is a JavaScript library for manipulating documents based on data.
- D3js.org
D3js is the glue between data and SVG.
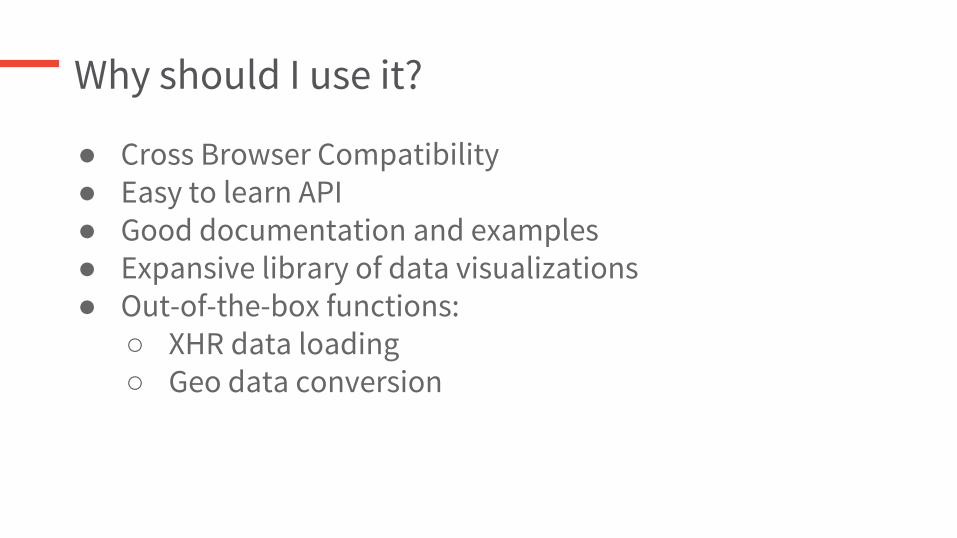
Why should I use it?
● Cross Browser Compatibility● Easy to learn API● Good documentation and examples● Expansive library of data visualizations● Out-of-the-box functions:
○ XHR data loading○ Geo data conversion

D3 Selections
d3.select(selector: string)- query one element
d3.selectAll(selector: string)- query multiple elements
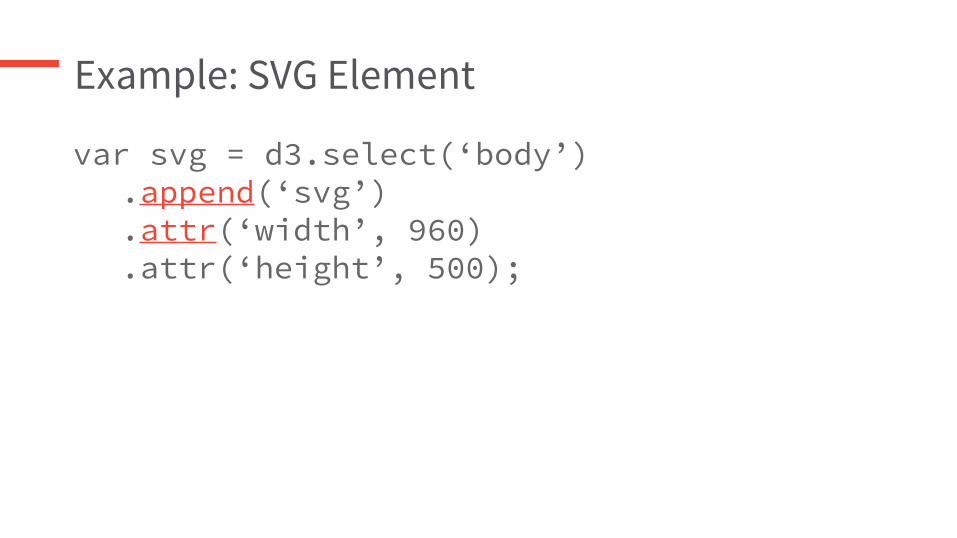
Example: SVG Element
var svg = d3.select(‘body’).append(‘svg’).attr(‘width’, 960).attr(‘height’, 500);

Adding Attributes
append("circle").attr(‘cx’, 50).attr(‘cy’, 50).attr(‘r’, 40);

<div id="viz"/>
<script> //Create a sized SVG surface within viz: var vizsvg = d3.select("#viz") .append("svg") .attr("width", 600) .attr("height", 600); //Add to the svg surface a circle var circle = vizsvg.append("circle") .attr("fill", "red") .attr("r", 40) .attr("cx", 50) .attr("cy", 50);</script>
Bring in the Data

Data Joins
update = selection.data(data)Bind array of data to selection.
update.enter()Iterates over data points that don’t have associated nodes.
update.exit()Data nodes without matching data trigger this.
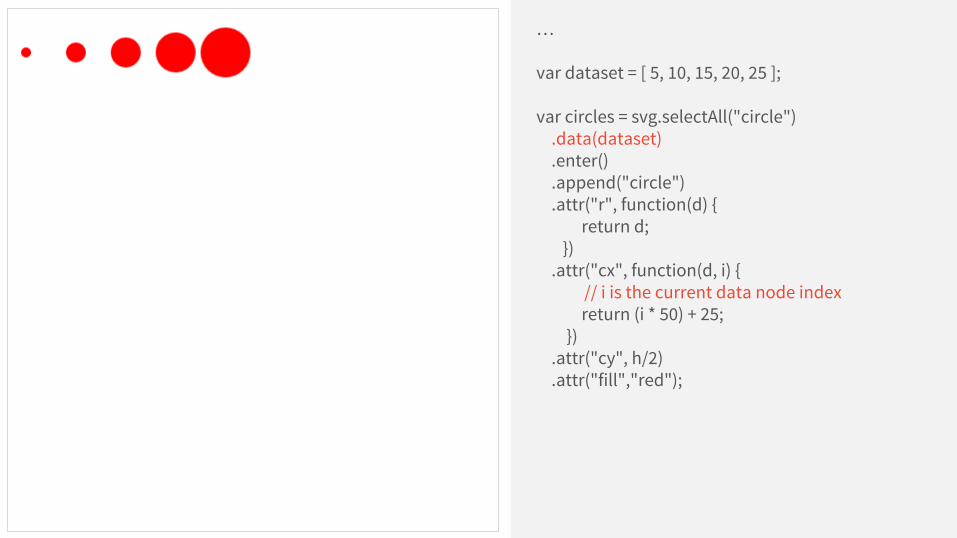
…
var dataset = [ 5, 10, 15, 20, 25 ];
var circles = svg.selectAll("circle") .data(dataset) .enter() .append("circle") .attr("r", function(d) { return d; }) .attr("cx", function(d, i) {
// i is the current data node index return (i * 50) + 25; }) .attr("cy", h/2) .attr("fill","red");


DRUPAL & D3 MODULE
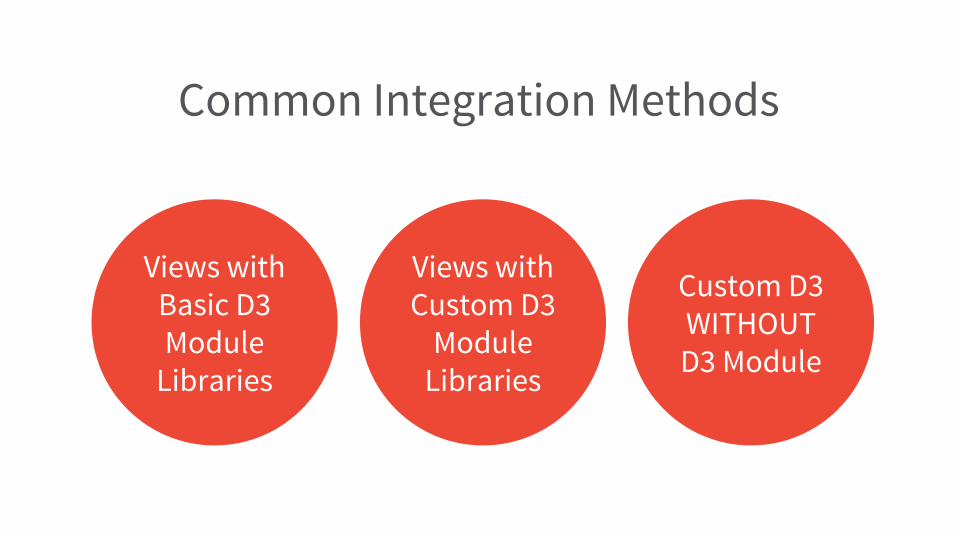
Common Integration Methods
Views with Basic D3 Module
Libraries
Views with Custom D3
Module Libraries
Custom D3 WITHOUT D3 Module
Why use the D3 module?
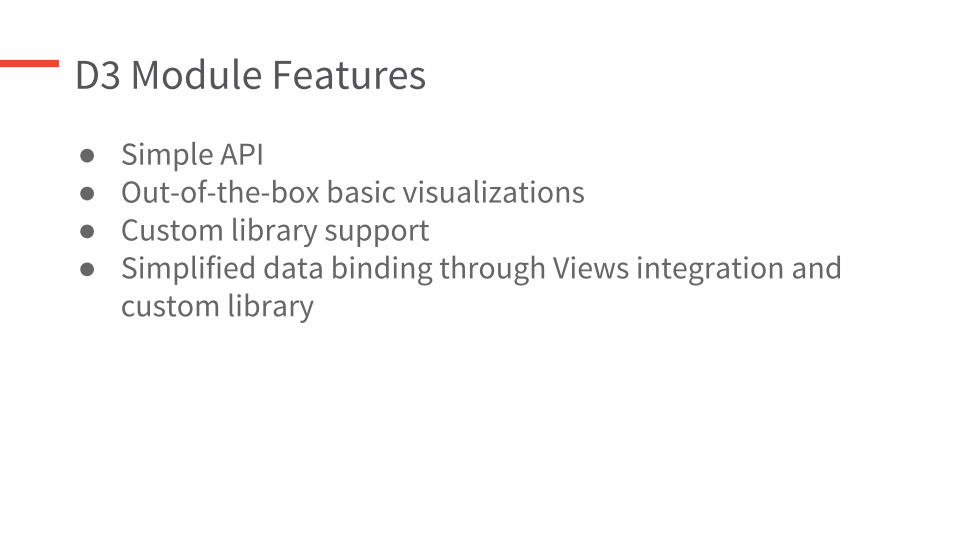
D3 Module Features
● Simple API● Out-of-the-box basic visualizations● Custom library support● Simplified data binding through Views integration and
custom library
Views with Basic D3 Libraries

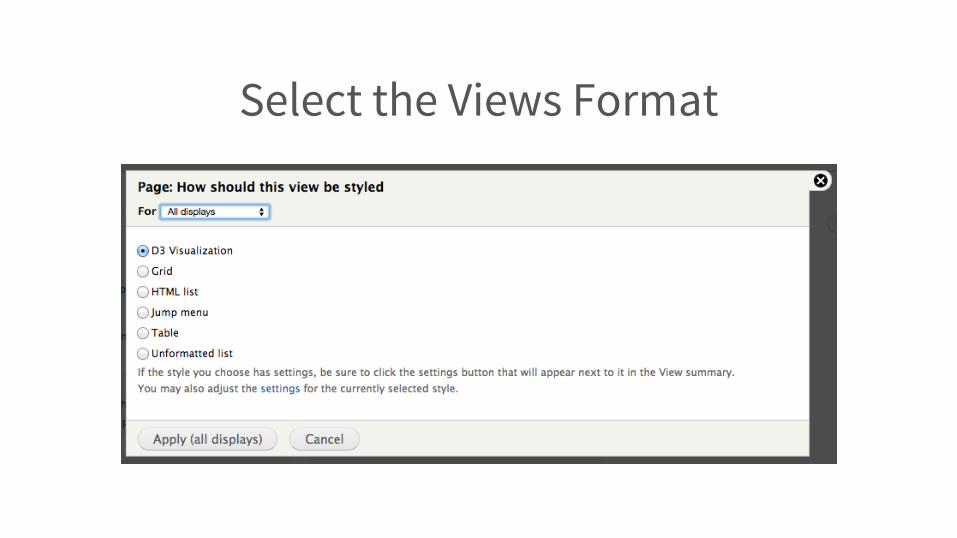
Select the Views Format
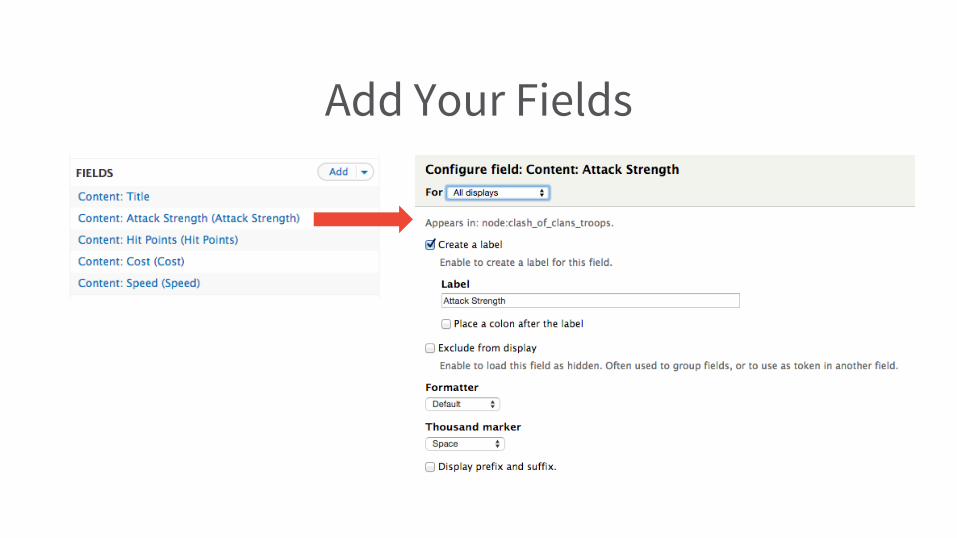
Add Your Fields

Select a D3 Library and Configure Data
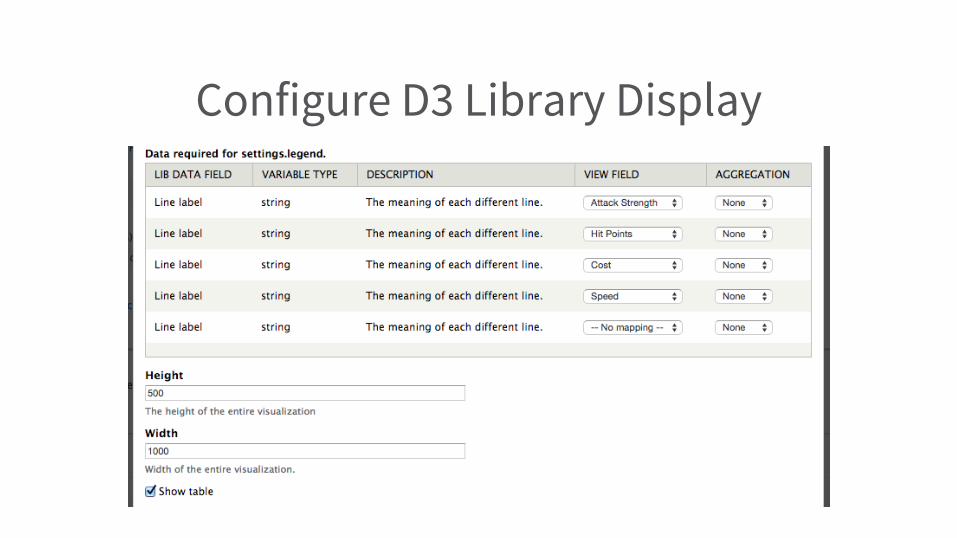
Configure D3 Library Display

Views with Custom D3 Libraries
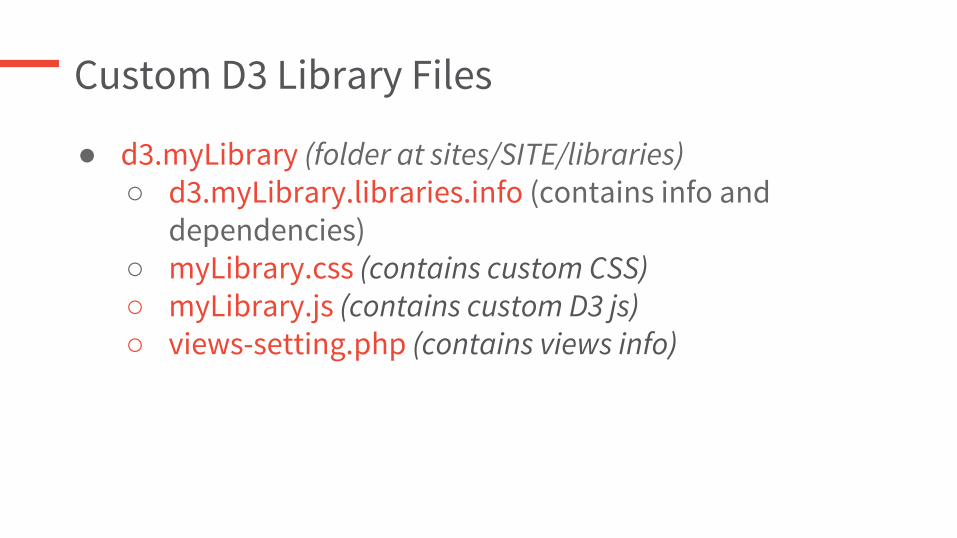
Custom D3 Library Files
● d3.myLibrary (folder at sites/SITE/libraries)○ d3.myLibrary.libraries.info (contains info and
dependencies)○ myLibrary.css (contains custom CSS)○ myLibrary.js (contains custom D3 js)○ views-setting.php (contains views info)

d3.myViz.libraries.infoname = My Visdescription = My Vis custom D3 displayfiles[js][] = myvis.jsfiles[js][] = nv.d3.min.jsfiles[css][] = myvis.cssversion = 0.1dependencies[] = d3.extenddependencies[] = d3.tooltipviews[version] = 3.0views[fields][rows][__data_type] = 2dnnvviews[fields][rows][x_label][label] = X labelviews[fields][rows][x_label][type] = stringviews[fields][rows][x_label][description] = The label that appears on the X axis.views[fields][rows][value] = { __repeated: TRUE, __cardinality: 0, label: Numeric value, type: integer, description: The numeric value that will be used to plot each dot (circle) on the line }views[fields][legend][__cardinality] = 0views[fields][legend][__data_type] = 1dn views[fields][legend][label] = Line labelviews[fields][legend][description] = The meaning of each different line.views[fields][legend][type] = stringviews[settings] = views-settings.php
● Same as out the box D3 module custom library info file with some exceptions

myViz.js(function($) {
Drupal.d3.myvis = function (select, settings) {
// Get the name of the DIV ID to place the visualization in var div = (settings.id) ? settings.id : 'visualization'; // Get the height/width from the views settings var height = (settings.height) ? settings.height : '400'; var width = (settings.width) ? settings.width : '600'; // Get the rows of content var rows = settings.rows; // Shift the yLabel names from the rows array var yLabels = rows.map(function(d) { return d.shift(); }); // Get key names for content grouping var key = settings.legend;
...
● Load data and configuration from views into JS variables for later use

myViz.js (cont.)…
var troopData = []; // Force rows array into data structure noted above for (var i in rows) { var row = rows[i]; var items = []; for (var j in row) { var item = row[j]; items.push({ "label" : key[j], "value" : item }); } troopData.push({ "key" : yLabels[i], "values" : items }); }
...
● Rearrange data structure to match the following structure:
"key": "Dragon","color": "#E80CC8","values": [ { "label" : "Cost" , "value" : 5 }, { "label" : "Strength" , "value" : 5 }]

myViz.js (cont.)…
// Render the NVD3 Multi-Bar Horizontal Chart in the proper DIV element var chart; nv.addGraph(function() { chart = nv.models.multiBarHorizontalChart() .x(function(d) { return d.label }) .y(function(d) { return d.value }) .margin({top: 30, right: 20, bottom: 50, left: 175}) .showValues(false) //Hide bar values .showControls(false) //Hide group toggle option .showYAxis(false); // Do not show yaxis values
d3.select('#' + div).append("svg") // Append SVG to views div .attr("width",width) // Set SVG width and height .attr("height",height) .datum(troopData) // Inject Data .call(chart); // Inject the chart call
nv.utils.windowResize(chart.update); // ensure proper sizing of window return chart; }); }})(jQuery);
● Create an NVD3 Multi-Bar-Horizontal-Chart data visualization with the data variables set previously
● Create an SVG element inside the Views content DIV
● NVD3 chart will be injected into the SVG element

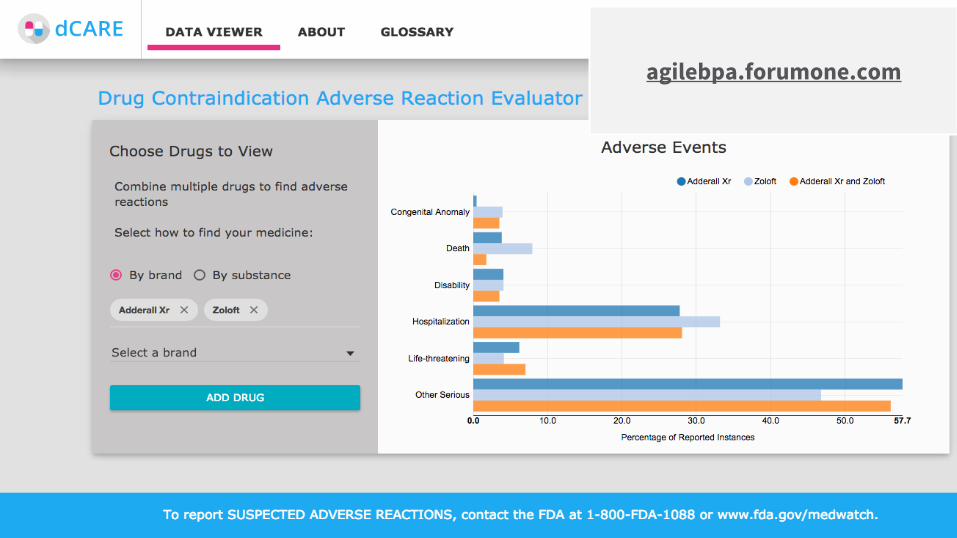
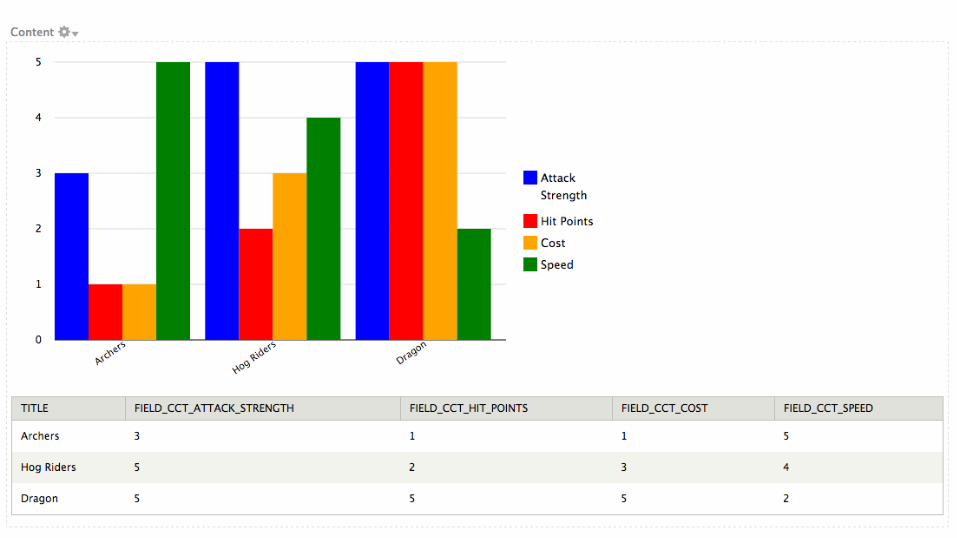
Resulting Custom Data Visualization

Custom D3 WITHOUT D3 Module

D3 Fully Custom
1. Get data in a structured format (JSON, CSV, Array, etc.)a. Views works best unless using outside data
2. Create custom D3js Drupal library3. Create custom Drupal module/hook to invoke library where
neededa. Commonly injected into the content of blocks, panes
and custom pages4. Additional theming if needed