d10.1 fresh water forecasting in urban water system
TRANSCRIPT

D10.1 Fresh water forecasting in urban water system

IMPREX has received funding from the European Union Horizon 2020 Research and Innovation Programme under Grant agreement N° 641811
2
Dissemination level of this document
X PU Public
PP Restricted to other programme participants (including the Commission Services)
RE Restricted to a group specified by the consortium (including the European Commission Services)
CO Confidential, only for members of the consortium (including the European Commission Services)
Deliverable Prototype design of drought DSS
Related Work Package: WP10: Sectorial survey: Urban Water
Deliverable lead: CETAQUA
Author(s): Laurent Pouget (Cetaqua), Sonia Fernandez (Cetaqua), Isabel Hurtado (Aquatec – third party of Cetaqua in the project), Javier Paredes (UPV), Laura Ramos (UPV)
Contact for queries [email protected]
Grant Agreement Number: n° 641811
Instrument: HORIZON 2020
Start date of the project: 01.10.2015
Duration of the project: 48 months
Website: www.IMPREX.eu
Abstract Urban water supply in Europe is vulnerable to weather extremes and their evolutions in the long term. This report D10.1 explains the current risks and the solutions that are being tested in the case studies. The water quality forecasts developed in the project will improve the actions included in the Drinking Water Treatment Plants (DWTPs) Water Safety Plans (WSPs), thus leading to safer and more resilient supply of drinking water.

3
Deliverable n° 10.1
Versioning and Contribution History The authors would like to thank the reviewers of the IMPREX project, namely Linus Magnusson (ECMWF) and Johannes Hunink (Future Water), and all the contributors of this deliverable (David Laver, Louise Arnal and Christel Prudhomme from ECMWF; Drinking Water Treatment Plants´ managers of the SUEZ group; and other partners from IMPREX).
Version Date Modified by Modification reasons
v.01 15/08/2017 First draft submitted to reviewers Linus Magnusson (ECMWF) and Johannes Hunink (Future Water)
v.02 25/08/2017 Second draft submitted to reviewers
v.03 3/10/2017 review B vd Hurk
v.04 22/11/2017 review B vd Hurk

IMPREX has received funding from the European Union Horizon 2020 Research and Innovation Programme under Grant agreement N° 641811
4
Table of Contents
EXECUTIVE SUMMARY ............................................................................................................. 10
1. Introduction ......................................................................................................................... 11 Objective of WP10 ....................................................................................................... 11 Content of this report ................................................................................................... 11 Presentation of the case study areas .......................................................................... 13
Segura River basin – Drinking treatment plant of La Contraparada ..................... 13 Llobregat river basin - urban water system of Terrassa and Barcelona ............... 13 Other case study areas ......................................................................................... 15
2. Impacts and needs concerning changes in water quality ................................................... 16 Introduction ........................................................................................................... 16 Impacts and needs in the WP10 case studies ..................................................... 16 Impacts and needs from other DWTPs ................................................................ 20 Impact and needs regarding planning and design ............................................... 21 Conclusion ............................................................................................................ 22
3. Simulation of the impacts of hydrometeorological events on urban water systems .......... 24 Processes to be simulated .......................................................................................... 24 Selection of impacts models and methodology .......................................................... 36 Generation of probabilistic forecast ............................................................................. 41
Turbidity forecast .................................................................................................. 41 Algae development ............................................................................................... 43
Conclusion ................................................................................................................... 44
4. Adaptation of the urban water system according to fresh water quality forecasts ............ 46 Analysis of the benefits of water quality forecasts on water treatment operations ..... 46
Context ................................................................................................................. 46 Case of the La Contraparada DWTP .................................................................... 46 Other DWTPs ........................................................................................................ 47
Analysis of the benefits of improving water treatment planning and proposition of structural changes .................................................................................................................. 49
Conclusion ................................................................................................................... 51
5. Preliminary market analysis ................................................................................................ 53
6. Conclusions ........................................................................................................................ 55
7. References .......................................................................................................................... 56
8. ANNEXES ............................................................................................................................ 57
Annex 1 Details on legal requirements ....................................................................................... 57
Annex 2 Other case studies ....................................................................................................... 59
Annex 3 Climate Change impact on Drinking Water Treatment Plants ..................................... 61
Annex 4 Climate Change impact on Drinking Water Networks ................................................. 64
Annex 5 Impact of Turbidity on the water supply of the Santiago Metropolitan Region of Chile.................................................................................................................................................... 65
Annex 6 Impact of Turbidity on the water supply of Lima in Peru ............................................. 68

5
Deliverable n° 10.1
Annex 7 Survey to plant operators ............................................................................................. 69
Annex 8 Managing water quality under drought conditions in the Llobregat River Basin ......... 77
Annex 9 Manzanares case: ........................................................................................................ 81
Annex 10 Turia case: .................................................................................................................. 83
Annex 11 Details on the climate data to be used ...................................................................... 84
Annex 12 Examples of statistical models use to forecast turbidity ........................................... 86
Annex 13 GESCAL model formulation ........................................................................................ 87
Annex 14 RREA model formulation ............................................................................................ 97
Annex 14 Practices in La Contraparada DWTP related to Hazard Analysis and Critical Control Points ....................................................................................................................................... 102
Annex 14 Control diagrams for the risk driven by hydrological extremes and climate events 104

IMPREX has received funding from the European Union Horizon 2020 Research and Innovation Programme under Grant agreement N° 641811
6
List of figures
Figure 1 General structure of Deliverable D10.1 11
Figure 2 Overview of the situation of La Contraparada DWTP 13
Figure 3 Overview of the Llobregat river basin(Momblanch et al., 2015) 14
Figure 4 Dam of As Forcadas 15
Figure 5 Impact of hydrological extremes on the decision making in La Contraparada DWTP 16
Figure 6. Sant Joan Despí treatment processes. Adapted from Armenter (2006) 18
Figure 7 Impact of climate change on surface water quality and water treatment plant (Delpla, Jung, Baures, Clement, & Thomas, 2009) 22
Figure 8 Impacts of meteorological and hydrological extremes on water quality and water treatment 24
Figure 9 Discharge and turbidity at Sant Joan Despi during 2010 25
Figure 10 Scatter plot of the evolution of turbidity against evolution of discharge 26
Figure 11 Maps of precipitation in the Llobregat (data provided by ECMWF) 27
Figure 13 Turbidity measurement upstream La Contraparada 28
Figure 14 Processes to be considered to simulate turbidity events 29
Figure 15 TOC and Discharge at Sant Joan Despi 30
Figure 16 Processes to be considered to simulate conductivity 33
Figure 17 Processes to be considered to simulate algal development and toxins 35
Figure 20 Type of models (Loucks & van Beek, 2017) 36
Figure 18 Data used in the model development for turbidity forecast 37
Figure 22 Soil loss in the European Union and Llobregat basin (Panagos et al., 2015) 38
Figure 19 Data used in the model development for conductivity forecast 40
Figure 21 Data used in the model development for algal development 41
Figure 23 Tree visualization 42
Figure 24 Confusion Matrix for the Tree model 42
Figure 26 False negative from the logistic regression 43
Figure 27 Measures to control the risks driven by climate 52
Figure 28 Calculation of the benefits of IMPREX project 52
Figure 30 Cause of high turbidity events in the Maipo River 66

7
Deliverable n° 10.1
List of Tables
Table 1 Result of the survey to DWTP operators 20
Table 2 Summary of methodologies used 44
Table 3. Benefits of the IMPREX project for La Contraparada DWTP 47

IMPREX has received funding from the European Union Horizon 2020 Research and Innovation Programme under Grant agreement N° 641811
8
Glossary
2-MIB: is an organic chemical with a strong odor. Its odour detection threshold is very low and it is one of the chemicals with major influence on the quality of drinking water Coagulant: a substance that produces or aids coagulation Cyanotoxins: toxins produced by bacteria called cyanobacteria Disinfection By-Products: result from chemical reactions between organic and inorganic matter in water with chemical treatment agents during the water disinfection process Floculant: chemicals that promote flocculation Geosmin: is an organic compound with a distinct earthy flavor and aroma produced by a type of Actinobacteria, and is responsible for the earthy taste of beets and a contributor to the strong scent (petrichor) that occurs in the air when rain falls after a dry spell of weather or when soil is disturbed Microcystins: toxins produced by cyanobacteria Reagent: is a substance or compound added to a system to cause a chemical reaction, or added to test if a reaction occurs Turbidity: is the cloudiness of a fluid caused by large numbers of particles

9
Deliverable n° 10.1
Abbreviations and acronyms
ACA Catalan Water Agency ANN Artificial Neural Network BP Break Point CIB Catalan Inner Basins CSOs Combined Sewer Overflows DAF Dissolved Air Flotation DBPs Disinfection By-Products DOC Dissolved Organic Carbon DWTP Drinking Water Treatment Plant EMUASA Drinking water operator of Murcia EQS Environmental Quality Standards FNU Formazin Nephelometric Unit (FNU) GAC Granular Activated Carbon HABs Harmful Algal Blooms HACCP Hazard Analysis and Critical Control Points 2-MIB 2-Methylisoborneol NOM Natural Organic Matter OM Organic Matter PAC Powdered Activated Carbon RDI Research, Development and Innovation StDM Stochastic Dynamic Methodology STELLA Systems Thinking, Experimental Learning Laboratory with Animation THMs TriHaloMethanes TOC Total Organic Carbon TSS Total Suspended Solids TSI Trophic State Indice WFD Water Framework Directive WHO World Health Organization WSP Water Safety Plan WWTP Waste Water Treatment Plant

IMPREX has received funding from the European Union Horizon 2020 Research and Innovation Programme under Grant agreement N° 641811
10
EXECUTIVE SUMMARY Rapid change in surface water quality is a big issue for drinking water treatment plant operators in Spain. Sudden increases of river turbidity due to heavy rainfall can be coped with by an operator by first using higher doses of chemicals and increasing maintenance of filters. For prolonged or very high events, the operator has to go for a more radical decision: the water intake should be cut off and alternative sources, if any at that time, should be used. As an additional challenge, the aquifers traditionally used as safeguard are not as available as they were due to overexploitation. The correct activation of measures regarding water sources and treatment is key to limit health and safety risks, reduce impact to environment and ensure financial balance of water companies. This is where IMPREX bring new improvements. Indeed, more than before rapid changes in surface water quality are linked to hydrometeorological events. Heavy rainfall events and runoff are the main drivers of sudden turbidity events, while variation in conductivity and algae development are driven by a complex combination of climatic and non-climatic factors (temperature, wind, dam management, etc.). Work Package 10 (WP10) of IMPREX will develop new tools to use the available and improved prediction products of hydrometeorological events to provide water operators a water quality forecasting system. In the context of climate change, it is expected that some of the hydrometeorological events impacting water supply will become more frequent or more intense. At one with IMPREX vision, WP10 exploits the idea that understanding and answering to present-day risks is an effective starting point for adapting to unprecedented future events. As a second step, the projections developed in IMPREX (WP3&4) will be introduced in WP10 forecast models to get a long term vision for water planners. Similar to current day application, the impact of changes in the frequency of disturbing events (flash floods leading to turbidity problems; temperature episodes with high algae formation) will be examined. Accordingly, the full water system can be made more resilient to extremes by adding new infrastructures and adapting the rules of management. These solutions would also provide more flexibility to plant operators to make a full use of water quality forecast system and thus answer better to future hydrometeorological events. This report explains the current risks, stakeholders’ needs and the solutions that are being tested in the case studies. Forecast of turbidity for the next hours and next days are highest priority to operate the treatment plant efficiently. Other parameters driven by hydrometeorological event and of interest include organic matter, conductivity, and cyanotoxins. A regression model is being developed to forecast peaks of turbidity and suspended organic matter at the intake of the treatment plants. Conductivity variation and algae development are driven by a complex combination of climatic and non-climatic factors (temperature, wind, dam management, etc.). Existing modelling systems, namely RREA and GESCAL, are being implemented to simulate and forecast these events.

11
Deliverable n° 10.1
1. Introduction
Objective of WP10 Urban water supply in Europe is very vulnerable to weather extremes events and their evolutions in the long term. These events impact on the fresh water quality and quantity, challenging treatment capacity, safety of drinking-water and reliability of supply. Some major threats to the urban water sector in Europe are the occurrence of droughts, which induce low river flow and high concentration of pollutants, intense rainfall events, which cause high levels of turbidity protecting microorganisms from disinfection effects, and rising temperatures, which reduce dissolved oxygen and increase the probability of development of communities of cyanobacteria releasing toxins into the water. WP10 is exploring solutions to manage better the risks raised by weather extremes events.
Content of this report This report D10.1 explains risk detection and risk mitigation methodologies that are being tested in the case studies (Deliverable D10.2 – M36). The content is supported by the IMPREX case studies, surveys and literature review. This deliverable “D10.1 Fresh water forecasting in urban water system” has the structure shown in Figure 1.
Figure 1 General structure of Deliverable D10.1
This deliverable D10.1 is the first deliverable of WP10 and is linked to other deliverables of IMPREX:
• Deliverable 2.1 “Sectorial summary of climate vulnerability and practice of risk management”, completed in early 2017 and that contained information about climate vulnerability and risk management practices for the drinking-water supply systems considered in WP10. In Deliverable D10.1 this information is completed and detailed further.
Impactsandneeds
(section2)
Developmentofwaterqualityforecastsdrivenbyclimateforecasts
(section3)
AdaptationofDWTPoperations,planning
anddesign(section4)
Exploitation(section5)

IMPREX has received funding from the European Union Horizon 2020 Research and Innovation Programme under Grant agreement N° 641811
12
• Deliverable D3.1 “Meteorological reforecasts” and ongoing work of WP3 and WP4 that provides the meteorological forecasts and the climate projections used to develop water quality forecasts.
• Deliverable D10.2 “Impact in Segura and Llobregat basins”, due to by the end of 2018 (M36), and that will detail the applications done in the Segura Basin and Llobregat Basin (Task 10.3). This deliverable will also presents an updated information and conclusions about the methodologies and the benefits of using the forecasts developed (update of results of Task 10.1 and Task 10.2 described in D10.1).

13
Deliverable n° 10.1
Presentation of the case study areas This section presents a general overview of the WP10 case studies, situated in the Segura River basin and in the Llobregat River basin. The specific needs in each case study are detailed in Section 2.1.2.
Segura River basin – Drinking treatment plant of La Contraparada
The Contraparada drinking water treatment plant (owned by Aguas de Murcia, EMUASA) participates in around 33% of the supply of the city of Murcia (around 445.086 inhabitants). Other sources are the Sierra de la Espada DWTP (owned by Mancomunidad de Canales del Taibilla) and desalinated water. The surface waters of La Contraparada DWTP comes from the left bank of the Tajo-Segura River Transfer, which comes from the Ojós reservoir. Firstly, water comes from Tajo River Transfer, and it crosses the channel of Tajo-Segura diversion until its arrival to the Ojós reservoir. Then there is 14 km long Tajo-Segura River Transfer. Next, water continues through a 17 km pipe, which lead to Contraparada reservoir. Finally, after a few meters pipe, water arrives to La Contraparada DWPT.
Figure 2 Overview of the situation of La Contraparada DWTP
Llobregat river basin - urban water system of Terrassa and Barcelona
The municipalities situated along the Llobregat River usually extract water directly from the Llobregat River but also have some wells that are activated when the river water quality or quantity is below thresholds. According to the water demand and the natural flow in the river, the upstream dams proceed to the release of water, which is conveyed by the river.

IMPREX has received funding from the European Union Horizon 2020 Research and Innovation Programme under Grant agreement N° 641811
14
Figure 3 Overview of the Llobregat river basin(Momblanch et al., 2015)
Aigües de Terrassa, stakeholder of the IMPREX project, takes 90% of its water from the Llobregat River (river and aquifer) and has more than one hundred thousand consumers (Terrassa and region). The river intake and the wells supplying the drinking water treatment plant are both located in Abrera. A second plant of interest for the Agbar group is the one of Sant Joan Despí, located in the downstream part of the Llobregat River. This plant treats around 60% of the water supplied to the metropolitan area of Barcelona with a population of 3.15 million inhabitants (other plants are the ones of Abrera and Cardedeu, owned by ATLL). The reservoirs located along these rivers have a total storage volume of 612 hm3 (212 hm3 for Llobregat only) and account for the 85% of the water supplied to the Barcelona area. The remaining 15% is abstracted from the underground resources on the Llobregat and the Besòs deltas. Furthermore, since 2009, the system also receives water from the desalination plant of el Prat del Llobregat, located near the Llobregat delta.

15
Deliverable n° 10.1
Other case study areas
In order to test the methodologies being developed and make them more flexible to different context, other complementary case study areas are being considered. As an example, the Dam of As Forcadas will be used as a case study to simulate algae development. This dam is situated in the Province of A Coruña, Galicia (Atlantic coast in north-western Spain). The dam is the main source for the DWTP of Valdoviño (Managed by VIAQUA, part of the AGBAR group) and supplies the city of Ferrol (70.000 inhabitants). Recurrent issues of algal bloom and presence of microcystins have been reported in the last summers.
Figure 4 Dam of As Forcadas
Source: Diario de Ferrol

IMPREX has received funding from the European Union Horizon 2020 Research and Innovation Programme under Grant agreement N° 641811
16
2. Impacts and needs concerning changes in water quality
Introduction
This section explains the consequences of the climate events driving water quality changes and details the need of the water stakeholders regarding water quality forecast to tune decision making at different timescales:
• Operational: modify doses of chemical reactive during the hours of the events, ensure sufficient reactive stocks and prepare the treatment chain in the next days
• Planning: plan maintenance period in the next months • Design: make infrastructure resilient to long term trends, including climate change
Impacts and needs in the WP10 case studies
This section introduces the impacts and needs regarding changing water quality in the case studies. Segura River basin - Urban water system of La Contraparada (Murcia)
La Contraparada DWTP is principally impacted by heavy rainfalls and droughts (Figure 5).
Figure 5 Impact of hydrological extremes on the decision making in La Contraparada
DWTP
Droughts and low flows cause problems in the quality parameters of conductivity over periods of days. In this DWTP moderate conductivity events do not directly impact in the cost of

17
Deliverable n° 10.1
treatment, but above a certain threshold no treatment can be performed, so the intake has to be closed. Heavy rainfalls cause problems in the quality parameters of turbidity and organic matter over periods of hours. The treatment that is carried out for the turbidity is to increase doses of coagulants & flocculants and increase frequency of GAC filters washing. This treatment involves a cost of 0.01€/m3 to La Contraparada DWTP. The treatment that is carried out for the organic matter consists in the increase of doses of oxidants and coagulants & flocculants, assuming a cost of 0.01€/m3 to the DWTP. Humic and fulvic acids present in organic matter react with the disinfectants applied in the treatment (chlorine and bromates) and tend to form Disinfection By-Products (DBPs), such as trihalomethanes (THMs) when ozone is used. A control of THMs and bromates is carried out in the drinking water distribution network, and the frequency of analysis is increased during events of high organic matter. One of the most relevant event occurred in December 2016, when the Tajo-Segura River Transfer had a high organic load that affected the quality of the treated water. The following measures were undertaken:
• Purchase of desalinated water (has a higher cost) to mix with the DWTP water. • Increase of chlorine dosage added in the re-chlorination of storage tanks to treat water
with higher turbidity • Increase in the analytical cost • A greater dedication of operators to the control tasks and technicians to the
supervision. As well as communication with the Sanitary Authority and preparation of all necessary documentation.
Heavy rainfalls and other climate variables (temperature, wind, etc.) also affect the production of chemicals by algae linked to eutrophication processes. Presence of geosmins and 2-Methylisoborneol (2-MIB), has been detected in the supply water purchased from another supplier. Geosmins and 2-MIB are compounds that cause musty, earthy odours in public water supply reservoirs and are mainly produced by blue-green algae (cyanobacteria) and actinomycete bacteria. Although these compounds have not been considered a health concern in public water supplies, they require removal. The odour threshold for these compounds is very low and humans can typically detect them in drinking water at 30 and 10 ng/L (ppt) for geosmin and 2-MIB, respectively. If geosmins and 2-MIB are detected in the water supplied, additional controls of to the water produced in La Contraparada DWTP are requested. These cases imply the following impact:
• Additional economic cost of the analyses • Time of dedication of the technicians to the supervision of the controls • Communication with the Sanitary Authority and preparation of documentation.
Accordingly, the needs of forecast for La Contraparada DWTP are the following:

IMPREX has received funding from the European Union Horizon 2020 Research and Innovation Programme under Grant agreement N° 641811
18
• Turbidity and organic matter for the next hours and up to the next days. There is a need to predict turbidity events superior to 50 FNU at the entrance of the plant´s dam (one or two days in advance) and predict turbidity level at the plant intake (a few hours or days in advance).
• Algae development in the next days Llobregat river basin - urban water system of Terrassa and Barcelona
Sant Joan Despí DWTP The treatment process in the DWTP in Sant Joan Despí has changed over the years, aiming at ensuring the quality of the water offered to costumers. Its maximum capacity is 5.3 m3/s. The current conventional treatment of Sant Joan Despí DWTP is composed by, as schematised in Figure 6, coagulation/flocculation, settling, sand filtration and then approximately half of the flow is treated by ozonisation and granular activated carbon (GAC) and the rest of the flow by ultrafiltration (UF), reverse osmosis (RO) and remineralisation. Wells’ water can be used and it is introduced after the sand filtration.
Figure6.SantJoanDespítreatmentprocesses.AdaptedfromArmenter(2006)
Actually, when Llobregat River flow is very low (e.g. water scarcity periods) well’s water is the only resource used in the DWTP. On the other hand, during flash flood events, in particular when turbidity is greater than 1000 NTU, well’s water is also the only resource used, since the stabilisation of the plant after the event is complicated if raw water with high turbidity is used. Heavy rainfalls, common during the end of summer or in the autumn, produce changes in the water quality (e.g. water with higher ammonia levels as a consequence of CSOs, higher levels of turbidity in river) that affect the operation of DWTP. If the DWTP is not able to cope with different water conditions, it may be necessary to stop the treatment process. In this situation, the water supplied comes from the aquifers (Figure 6). However, using the water from the aquifer requires additional human resources, more frequent controls and, thus, higher costs. The first reason for that is that when groundwater is used, the amount of reagents needs to be adjusted so that the treatment suits the quality of wells’ water. Secondly, a stricter control of the aquifer condition needs to be carried out to ensure that the abstraction is not causing salinization of the aquifer and that it will be available to be used in emergency situations in the future (short, medium and large term).

19
Deliverable n° 10.1
During drought periods, underground water is also used due to the reduce water availability (low flow and restriction for ecological flow maintenance) and degraded water quality (low dilution of upstream Wastewater Treatment Plants’ (WWTP) effluents). In all periods, the river water quality at the plant intake is greatly influenced by upstream wastewater treatment plants operation, regulation on ecosystems conservation, legal pressure on industrial spillages, etc. The construction of a homogenization and regulation pond for the raw water has been stud-ied since the 1990s but has not been implemented yet. The planned pond, with a capacity of around 720.000m3 could store enough water to supply the DWTP during a period of 48h. It could have the following benefits:
- Ensure continuity of supply in episodes of high turbidity caused by floods and accidental contamination of industrial origin.
- Regulate the flow during periods of drought - Improve the quality of raw water. - Improve the use of the river's resources. - Laminate contamination peaks in specific episodes.
As a summary, the potential benefits of the IMPREX project for Sant Joan Despí Drinking Water Treatment Plant would consist of:
• Improving the operation of the plant during high turbidity event and low flow (drought) thanks to turbidity forecast for the next hours and next days
• Understanding better turbidity events and their evolutions in the long-term (climate change) to support the construction of the homogenization and regulation pond
Terrassa DWTP The Llobregat River supplies around 90% of the input flow (remaining 10% from local wells). The flow from the Llobregat River (surface or underwater) is taken in Abrera, where there is a Drinking Water Treatment Plant (DWTP) and different collection wells. During high turbidity events the surface intake is generally not totally stopped and the water is diluted with well water, which has its treatment in the ETAP itself. Other complicated episodes are linked to the failures in the collector of brines (high conductivity in the river water) and with discharges (mainly accidental, but some also fraudulent) of hydrocarbons. Additional decantation, through a decantation pond, could be envisaged to reduce turbidity and ammonium but are not essential to supply water. Accordingly, the potential benefits of the project for Terrassa DWTP would be to optimize the current management of the turbidity events. Abrera and other DWTPs The Catalan Water Agency (ACA) is the public institution responsible of the management of the rivers localized in the hydrographic demarcation Catalan Inner Basins (CIC). In addition, it control the water quality of each water body in the CIC and design river basin plans in order to ensure the good ecological state of the aquatic ecosystems. The Llobregat basin is the study case of this project and it belonging to CIC.

IMPREX has received funding from the European Union Horizon 2020 Research and Innovation Programme under Grant agreement N° 641811
20
During the interview with the technical personal of ACA about the activities of the project, they shared the necessity to control the water quality of the basin, especially in the parts where the purification plants abstract the water to urban demand. The ACA also shows interest in studying the ecological state of the aquatic ecosystems depending of different future climate change scenarios.
Impacts and needs from other DWTPs
In order to know the impacts of changes in raw water quality and the needs of forecast for plant operators, a survey was sent to several DWTP in Spain (Agbar Group). This complements the information gathered in the two case studies of WP 10, Llobregat basin and Segura basin, both located on the Mediterranean coast. We obtained responses from 21 DWTPs, 2 of which are located in the south, 4 on the Mediterranean coast and 15 in the central and northern area of Spain. A total of 20 DWTPs were affected by extreme weather and climatic events (specifically heavy rainfalls, droughts and heat waves). None of these 20 DWTPs were affected by cold waves. A total of 56 impacts of extreme weather and climatic events on water quality parameters were mentioned in the survey. The main results are presented in Table 1. Details are presented in Annex 7. Information on other case studies is presented in Annex 1, Annex 2, Annex 5 and Annex 6
Table 1 Result of the survey to DWTP operators
Extreme weather and climatic events analyzed
Number of impacts mentioned
Number of DWTPs affected
% of DWTPs impacted (over 21 DWTPs)
Water quality parameters impacted (Number of time the parameters has been cited over a total of 56 impacts cited)
Heavy rainfall 31 16 76,2% Turbidity (15), Organic matter (6), Aluminium suspension (3), Iron and manganese (3), Microbiological parameters (2), pH (1), Colour (1)
Drought 22 15 71,4% Conductivity (5), Iron and manganese (5),Organic matter (4), pH (2), Odour (2), Nitrates (1), Taste (1), Sulphate (1), Turbidity (1)
Heat wave 3 2 9,5% Odour (2), Taste (1)
The main conclusions are:
• For most of the water systems studied, it seems that the sudden increase of turbidity due to heavy rainfall events is the main challenge for the treatment plant managers. Forecast of river water quality for the next hours and days are the most required to operate the treatment plant efficiently. Seasonal forecast are also mentioned for all the climatic event considered.
• Since the survey gathers the views of the treatment plant managers (responsible of producing “tap water” with the current infrastructures), the results concern operational

21
Deliverable n° 10.1
issues with a short-term perspective. The need of long-term information is more obvious for planning issues (design of treatment plant) but has not been gathered in this survey. Depending on the infrastructure's lifespan, the speed and magnitude of water quality changes, this information could be more or less relevant for water plant operators. In general, operation and planning will both benefit from the anticipated information provided by the water quality forecast with a daily to decadal forecast period.
• Other parameters of interest are organic matter, conductivity, iron and manganese, microbiological parameters, etc. These parameters can be driven by heavy rainfall or drought.
• Impact of cold waves are not significant and would not be studied in the project. Impact of heat waves are also linked to change in water demand so a combined approach would be required (forecast of water quality and water demand).
Impact and needs regarding planning and design
To ensure compliance with the future requirements, DWTP design should consider the evolution of water quality regulations, the correct plant capacity (which depend on the evolution of water demand), the evolution of the raw water quality and quantity in the long term and the consideration of external risks. A previous study performed within the SUEZ group in 2012 (private study) concluded that the main threats of climate change to the design and construction of DWTP are floods (for plant location and structure) and degraded water quality (for treatment technologies). The climate change impacts on surface water quality have been studied by Delpla (2009) and are summarized in Figure 7. Changing water quality and climate condition would affect the full water supply chain, and beyond the water treatment plant, the water network will also be impacted. More details are presented in Annex 3 and Annex 4. Degraded water quality result-ing from warmer temperatures and extreme events (higher turbidity, algal bloom, ammonia, organic matter, etc.) is also a risk to DWTP design and construction because it can diminish the efficiency of the suggested treatment. To date, the design of treatment technologies for DWTPs is based on the assumption that water quality will fluctuate within the experienced var-iation range. However, since climate change will probably broaden this variation range, the selection and sizing of the treatment process should consider its effects on water quality in order to ensure the treatment will be efficient under new conditions

IMPREX has received funding from the European Union Horizon 2020 Research and Innovation Programme under Grant agreement N° 641811
22
Figure 7 Impact of climate change on surface water quality and water treatment plant
(Delpla, Jung, Baures, Clement, & Thomas, 2009)
Conclusion
Climate events have a direct impact on water quality, and as a consequence, on the operation of DWTPs.
• Changing water quality result in additional cost for the operation of the plant and might jeopardize the supply guarantee. The additional costs are mainly due to an increase doses of coagulants & flocculants, increase frequency of GAC filters washing, use of alternative resources (aquifer, desalinisation), additional analyses, and extra-dedication of human resources.
A short-term water quality predictive system is needed by DWTPs for different parameters: • The sudden increase of turbidity, principally due to heavy rainfall events is the main
challenge for the treatment plant managers. Forecast of river water quality for the next hours and days are the most required to operate the treatment plant efficiently
• Other parameters of interest concern are organic matter, conductivity, iron and manganese, microbiological parameters, etc. These parameters can be driven by heavy rainfall or low flow.
• Algal development and toxin production is still an issue rarely acknowledged. Climate change could worsen this risk. Also, legal requirement are putting more pressure on this aspect.

23
Deliverable n° 10.1
Also, a long-term vision of the evolution of water quality is needed for planning of optimal investments (from Water Basin Agencies but also private companies).
• An increase in the current risk identified by DWTPs´ managers (e.g. turbidity events) may create a situation in which the treatment infrastructure in place cannot treat at an affordable cost the water to fulfil heath criteria, even with the help of the short-term water quality predictive system developed in the IMPREX project. Long-term forecast are necessary to justify adaptation measure such as sedimentation ponds.
• An increase in drought episodes and its impact on water quality would justify more global investment in the full water system (Wastewater plant efficiency, dam management rules, alternative sources of water, etc.)

IMPREX has received funding from the European Union Horizon 2020 Research and Innovation Programme under Grant agreement N° 641811
24
3. Simulation of the impacts of hydrometeorological events on urban water systems
This section contains the following information: • Definition of the processes and target variable to be considered • Definition of a methodology to use hydrometeorological variables into water quality
models
Processes to be simulated An overview of the processes to be simulated that are driven by meteorological and hydrological extremes is presented in Figure 8.
Figure 8 Impacts of meteorological and hydrological extremes on water quality and water
treatment
Considering the needs detailed in the previous sections, the following events are studied in the case studies:
� High turbidity events due to heavy rainfall and runoff � Peak in organic matter due to temperature extremes � Peak in conductivity and other parameters during low flow period due to drought and
low flow… � Algae development and production of toxins due to warm conditions and climatic
stressors such as rain event.

25
Deliverable n° 10.1
High turbidity events
Introduction There are various parameters influencing water turbidity such as phytoplankton, algae growth, sediments from erosion or landslides, re-suspended sediments from the bottom, urban stormwater runoff and wastewater discharge. The instrument used for measuring turbidity is called nephelometer or turbidimeter, which measures the intensity of light scattered at 90 degrees as a beam of light passes through a water sample. Accordingly, and depending on the properties of the particles, turbidity measurement are used to provide an estimation of the TSS (Total Suspended Solids) concentration.
In the Llobregat case study, turbidity values range from 10FNU to 10.000FNU (Formazin Nephelometric Units). The events with turbidity superior to 1.000 FNU give rise to changing the treatment procedure and thus have to be predicted. These events occur on average 10 times a year.
Turbidity is measured routinely every hour at the plant entrance. Discharge peaks and turbidity peaks occur simultaneously (Figure 9). However, Figure 10 shows that the relationship for high values of the turbidity is not linear.
Figure9DischargeandturbidityatSantJoanDespiduring2010

IMPREX has received funding from the European Union Horizon 2020 Research and Innovation Programme under Grant agreement N° 641811
26
Figure10Scatterplotoftheevolutionofturbidityagainstevolutionofdischarge
(Difference in daily values between day T and T-1; only turbidity > 1000NFU considered; in y-axis =evolutionturbidity;inx-axis=evolutiondischarge;thebiggerthesizeofthedotthehighertheturbidityvalue)
Indeed, it happens that small variation in discharge are associated with great variation in turbidity, while great variation in discharge are sometimes linked to moderate variation in turbidity. Similarly, it can be seen in Figure 11 that the relationship between the daily intensity of the precipitation and the level of turbidity is not proportional. This is something that has also been observed from the historical weather observations available in the river basin.
This suggest that the localization and the hourly intensity of the precipitation play a key role in the evolution of the turbidity. An analysis of historical radar data is currently performed to fully understand the processes.

27
Deliverable n° 10.1
12/10/2012 Turbidity peak 10000 FNU
30/10/2012 Turbidity peak 3100 FNU
Figure 11 Maps of precipitation in the Llobregat (data provided by ECMWF)
Accordingly, for the Llobregat basin, the first hypotheses are as follows:
• high turbidity events (>1.000 FNU) are mainly due to heavy rainfall that generate erosion in the basin and re-suspension of sediments from the river bed.
• intensity (daily and sub-daily) and spatial distribution of the rainfall are key factors.
• processes such as landslide and urban stormwater (combined sewer overflow) might have an influence
• other processes such as phytoplankton, algae growth, wastewater discharge are as-sumed to be negligible (since the turbidity peaks are linked to heavy rainfall)

IMPREX has received funding from the European Union Horizon 2020 Research and Innovation Programme under Grant agreement N° 641811
28
In the Segura case study, turbidity values range from 2 FNU to 60 FNU at the entrance of the plant (much lower values than in the case of the Llobregat!). There is a need to predict turbidity events exceeding 50 FNU at the entrance of the plant´s dam (one or two days in advance) and predict turbidity level at the plant intake (a few hours or days in advance). There is not any previous study available.
Measurements of turbidity are done every hour at the entrance of the plant. The identification of the drivers for the turbidity is challenging for the following reasons:
• the value of turbidity are very low and greatly differ (in relative values) between the plant intake and the points situated immediately upstream (dams and channel) ( Figure 12), and accordingly the representativeness of the sampling or presence of complex small scale processes can be questioned
• none of the measurements present a clear relationship with the rainfall or with the discharge. Some peak of turbidity in the channel correspond to rainfall events. Also the inflow to the upstream reservoir (Azud de Ojós) seems to affect the turbidity downstream.
• none of the measurements presents a clear relationship with algal development (but only a few measurements are available for Chlorophyll-a)
Figure 12 Turbidity measurement upstream La Contraparada

29
Deliverable n° 10.1
Accordingly, for the Segura basin, the first hypothesis is as follows:
• turbidity event are mainly due to a mix of factors including local rainfall (washing over the lateral of the dams), change in discharge in the upstream reservoir (Azud de Ojós), algal development in the plant dam and in the upstream reservoir.
As a consequence the simulation of the turbidity events in the Segura basin requires investigation of the drivers of turbidity variations.
In other sites, turbidity issues are primarily driven by heavy rainfall (from the survey described in section 2.1.3, 15 plants over the 16 having turbidity issues associate these issues with heavy rainfall). Conclusions Figure 13 summarizes the main processes to be considered to simulate variations of turbidity affecting a DWTP. The main driver to be considered is the intense rainfall. Other aspects such as landslide and combined overflow will be studied in the Llobregat case study; also, algal growth will be studied in the Segura case study.
Figure 13 Processes to be considered to simulate turbidity events

IMPREX has received funding from the European Union Horizon 2020 Research and Innovation Programme under Grant agreement N° 641811
30
Evolution of organic matter
Introduction Organic matter (OM) indicates the organic load carried by the water: bacteria, algae, zooplankton (copepods, rotifers, etc.), algae metabolites, biological remains in degradation, etc. The evolution of OM and turbidity are generally similar, but OM only constitutes the organic portion, while turbidity records both organic and inorganic. OM consists of a variety of substances and chemical groups that can be particulate or dissolved (if small enough, e.g. pass through a 0.45 micrometre filter). They are commonly measured as total organic carbon (TOC), dissolved organic carbon (DOC) or estimated with permanganate oxidation. Rainfall can cause an increase in OM concentration (soluble organic matter leached from the soil is carried to the river by surface runoff). Between individual rainfall events, the production of internal Natural Organic Matter (NOM) is generally reduced in winter (low algae activities), and the transport of organic matter is minimal under low flow condition. WWTP effluents can also deposit large amounts of organic matter and nutrients into receiving waterways. In the Llobregat river basin, there is a relationship between the peaks of OM and the peak of discharge (Figure 14), which suggests that the heavy rainfall cause an increase in OM concentration.
Figure 14 TOC and Discharge at Sant Joan Despi
31
Deliverable n° 10.1
In the Segura case study The OM is determined with the parameter "permanganate oxidation"; since it is a quite elabo-rated technique, it is performed by the plant analyst (not by the operators). Permanganate is an oxidant, and is used by digestion of the sample to assess the amount consumed by that sam-ple. The greater the OM, the more oxidation. The TOC has been analysed during several years but was not a good indicators of the changes occurring in the raw water (quite stable value), similar results were obtained with the DOC. Another parameter related to the organic load is the Break-Point (BP), where the necessary amount of chlorine to be added in the water is determined so that residual free chlorine ap-pears (it is the point at which there are no more compounds that react with the Chlorine and so we find the residual). Break-Point does not provide details on the organic and inorganic portion but is measured at an hourly frequency. So when there is a rise in Break-Point, comparison is done with turbidity and oxidability to permanganate measures to understand the reason of the increase:
• turbidity rises & no changes in Oxidability to Permanganate àinorganic origin • turbidity rises & Oxidability rises à organic origin • no change in turbidity & little rises in Oxidability à indicate presence of ammonium
(organic degradation product) It has been observed that the OM value does not change so fast in the Contraparada, so a dai-ly data is enough for operating the plant. The required forecast for OM in the case of La Con-traparada is for a forecast period of a few hours to a few days. Conclusions In the Llobregat basin the forecast of OM will follow the same methodology as the forecast of turbidity. For the Segura basin, the forecast of OM will be developed as a part of the forecast of turbidity, targeting only a sub-set of events according to oxidability value.

IMPREX has received funding from the European Union Horizon 2020 Research and Innovation Programme under Grant agreement N° 641811
32
Peak in conductivity and other parameters during low flow period Introduction Conductivity is a measurement of the ability of an aqueous solution to carry an electrical current. There are several factors that determine the level of conductivity. These include the concentration or number of ions, mobility of the ion, oxidation state and temperature of the water (for this reason conductivity measurement are generally corrected and reported as conductivity at a reference temperature). Conductivity is generally measured in microsiemens per centimetre (µs/cm). Conductivity in streams and rivers is affected by several factors such as
• the geology of the area through which the water flows (streams that run through areas with clay soils tend to have higher conductivity because of the presence of materials that ionize when washed into the water), groundwater flows
• Discharges to streams (e.g. failing sewage system would raise the conductivity because of the presence of chloride, phosphate, and nitrate)
In the Llobregat river basin, conductivity is higher during period of low flow. Previous studies have been performed at this site (Annex 8). The main factors causing conductivity is the diffuse pollution from agriculture, salt mining activities located in the middle reaches of the Llobregat and Cardener Rivers (produce largely contaminate waste such as primarily from chlorides and potassium; channelized to the sea), industrial wastewater discharge (principally from the Anoia and the Rubí tributaries), groundwater inflow (in the middle to lower reaches of the river), wastewater discharge. Accordingly, moderate to high concentrations of ammonium, nitrates, phosphorous and salts are found, which is problematic for the urban water supply and causes both an increase in water treatment requirements in the DWTP and environmental effects. The situation worsens during drought episodes, i.e., when the river flows are lower. Accordingly the value of conductivity and other parameters in the Llobregat is linked to the evolution of a large number of inter-dependant drivers:
• Biological transformation • Low flow
o Dam release (linked to urban water demand, dam filling and risk of deficit in supply)
o Drought • Treatment efficiency of WWTP • Other human-induced pollutions (agriculture, salt mines)
In other sites, increase in conductivity and other water quality parameters (iron and manganese, organic matter, pH, Odour, Nitrates, Sulphate, etc.) is also an issue during period of low flow. In the Segura case study the evolution of conductivity is not an issue. Conclusions Figure 16 summarizes the main processes to be considered to simulate an increase in conductivity and other water quality parameters of interest for DWTPs during period of low flow.

33
Deliverable n° 10.1
Figure 15 Processes to be considered to simulate conductivity

IMPREX has received funding from the European Union Horizon 2020 Research and Innovation Programme under Grant agreement N° 641811
34
Algae development and production of toxins
Introduction The pattern of cyanophytes in nature is not homogeneous since each species has its own ecophysiological behaviour. The main factors affecting the development, potential proliferation and the formation of blooms of cyanophytes are:
- Light: they can be developed under conditions of strong insolation thanks to the synthesis of protective pigments (phycobilins and carotenoids).
- Temperature: the maximum growth of many cyanophytes occurs at temperatures above 25 ° C. This is the reason why most of the proliferations occur in summer.
- Nutrients (phosphorus and nitrogen): most of the massive developments of cyanophytes were observed in lakes or eutrophic reservoirs, so it was assumed that large concentrations of nitrogen and phosphorus were necessary for their formation. Still, they can also develop in clean waters due to a cellular machinery that only the cyanophytes possess, and that allows them to be independent of the availability of nutrients in the water.
- Lack of natural enemies: most algal groups are consumed by different groups of zooplankton, however the effect of herbivores on cyanophytes is usually very small. Actually its main enemies are the viruses, the bacteria and actinomycetes.
- Wind: the wind destabilizes the surface layer of the water, limiting the development of algal communities. The less wind, the more eutrophication.
If a bloom of cyanophytes occurs in a reservoir, the release of toxins depending on the climatic variables can come from several situations:
• During the natural senescence of the algal community, the cells will die and release the toxins. Release of toxins into water can occur during cell death or senescence but can also be due to evolutionary-derived or environmentally-mediated circumstances such as allelopathy or relatively sudden nutrient limitation (Merel et al., 2013) • Heavy rains may be enough disturbance for some of these cells to become lysed and cause release • During a dry season, with the lack of water resources, there may be competition for nutrients and space, thus resulting in the death of a part of the population. • A significant increase in the temperature of a confined water can cause stress in the dominant algal genera, and be replaced by others more adapted to these new conditions. It would lead to death from stress and pressure from competition, with the consequent release of toxins. • A sudden drop in temperatures caused by a polar front, for example, may affect the lowering of the temperature of the water below the comfort zone of the cyanophyte population and promote its death.
In the Segura case study In La Contraparada DWTP, the maximum retention time of the plant dam is 10 days when the plant is in operation. When the plant is stopped the water is mixed with new water before the start-up of the treatment plant. Accordingly, the progressive increase in nutrients is limited. Algal development in the plant dam is driven by several factors:

35
Deliverable n° 10.1
- Wind: strong wind will destabilized the superficial layer of the dam, thus not allowing al-gal development
- Rainfall: it has been observed a decrease of algal development in period of rainfall - Temperature: catalyser of algae development - Nutrients (N,P) from agriculture and WWTP: catalyser of algae development - Retention time of the water in the dam - Entrance of algae and toxins from upstream
No issues of algal development and cyanotoxins have been identified in the other DWTPs sur-veyed (section 2.1.3). Still these issues occurred in other sites with similar characteristics than La Contraparada (intake of water from a dam). Accordingly the processes to be considered to simulate algal development and production of toxins are the one shown in Figure 13.
Figure 16 Processes to be considered to simulate algal development and toxins

IMPREX has received funding from the European Union Horizon 2020 Research and Innovation Programme under Grant agreement N° 641811
36
Selection of impacts models and methodology This part discusses the modelling methods suitable to represent the impacts of extreme weather on water quality and water treatment processes. Simulation models can be statistical or process oriented, or a mixture of both. Pure statistical models are based solely on data (field measurements). Pure process oriented models are based on knowledge of the fundamental processes that are taking place (Loucks & van Beek, 2017).
Figure 17 Type of models (Loucks & van Beek, 2017)
It is important to remark that the water quality forecasts for the DWTPs´ operators should have the following characteristics: 1/ Available quickly (real-time) 2/ Cheap (low cost of implementation) 3/ Provide information at their surface intake point (directed to one point in the full catchment) and 4/ Robust and with sufficient skill (health risk). Consequently, models that could be implemented easily and run at low cost will be preferred as the first options.

37
Deliverable n° 10.1
Turbidity and organic matter driven by heavy rainfall
The hydrometeorological data to be used for predicting peaks in turbidity and organic matter are shown in Error! Reference source not found.. These are input data for the processes to be simulated (Figure 13). A regression model is developed and trained in the Llobregat river basin. Other test sites will be used to ensure a good level of flexibility and robustness of the methodology.
Figure 18 Data used in the model development for turbidity forecast
The methodology is based on the development of a statistical model able to predict high turbidity values at the entrance of the treatment plant (target variable). Different sets of predictors are used from available observations and hindcasts for training and testing. These predictors are generated from IMPREX data (WP3-4) but other information, especially sub-daily information, are gathered from other sources. A prototype will be developed that can produce a turbidity forecast in real time (operational prototype); additionally the statistical model will be used to give a long-term outlook about the occurrence of high turbidity events. The different steps of the methodology are detailed below:
1. The river basin is divided in several sub-basins (e.g. 5 or 6 zones) according to their potential contributions to turbidity events. o The following criteria are considered
• Hydrological criteria (e.g. Llobregat main tributaries) • Upstream or downstream the dams (e.g. the sub-basins upstream the La
Baells dam would not contribute much to turbidity) • Vulnerability to erosion and risk of landslide (e.g. areas without any vegetation
cover, already identified in soil loss rate maps and landslide maps - Figure 19) • Proximity to the water treatment plant (e.g. Rubí basin is quite small but might
have a great importance in turbidity event)
IMPREX has received funding from the European Union Horizon 2020 Research and Innovation Programme under Grant agreement N° 641811
38
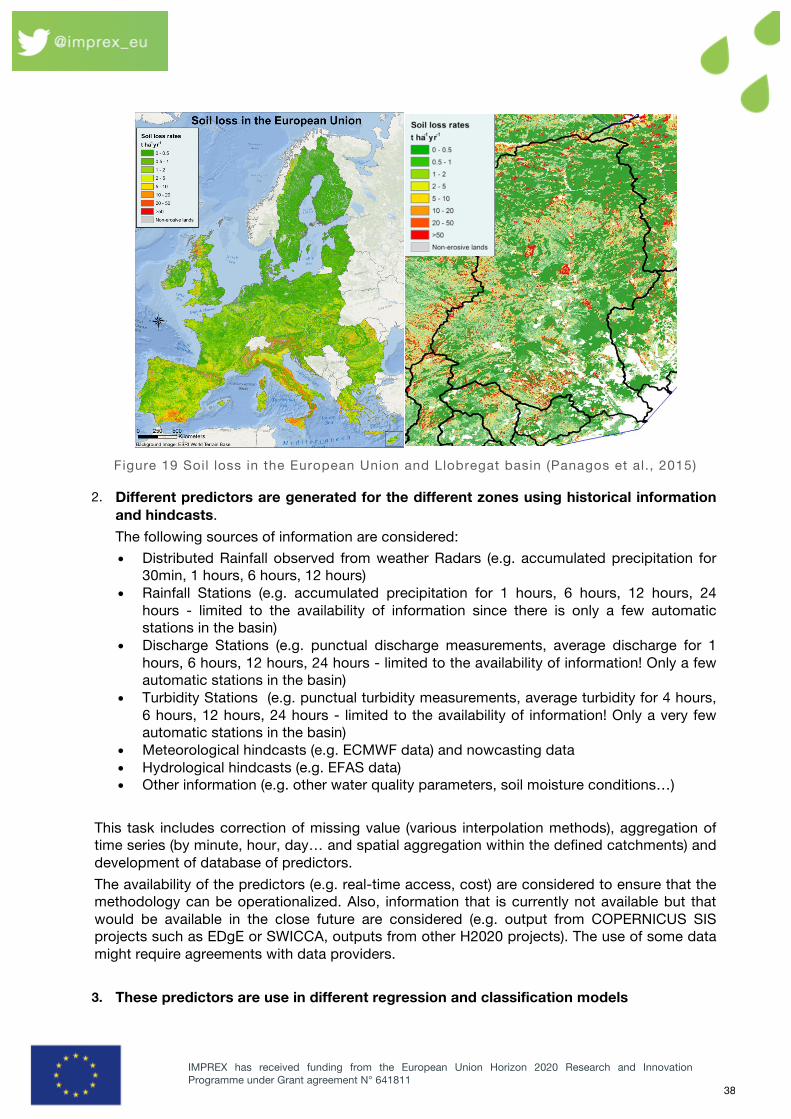
Figure 19 Soil loss in the European Union and Llobregat basin (Panagos et al., 2015)
2. Different predictors are generated for the different zones using historical information and hindcasts. The following sources of information are considered: • Distributed Rainfall observed from weather Radars (e.g. accumulated precipitation for
30min, 1 hours, 6 hours, 12 hours) • Rainfall Stations (e.g. accumulated precipitation for 1 hours, 6 hours, 12 hours, 24
hours - limited to the availability of information since there is only a few automatic stations in the basin)
• Discharge Stations (e.g. punctual discharge measurements, average discharge for 1 hours, 6 hours, 12 hours, 24 hours - limited to the availability of information! Only a few automatic stations in the basin)
• Turbidity Stations (e.g. punctual turbidity measurements, average turbidity for 4 hours, 6 hours, 12 hours, 24 hours - limited to the availability of information! Only a very few automatic stations in the basin)
• Meteorological hindcasts (e.g. ECMWF data) and nowcasting data • Hydrological hindcasts (e.g. EFAS data) • Other information (e.g. other water quality parameters, soil moisture conditions…)
This task includes correction of missing value (various interpolation methods), aggregation of time series (by minute, hour, day… and spatial aggregation within the defined catchments) and development of database of predictors. The availability of the predictors (e.g. real-time access, cost) are considered to ensure that the methodology can be operationalized. Also, information that is currently not available but that would be available in the close future are considered (e.g. output from COPERNICUS SIS projects such as EDgE or SWICCA, outputs from other H2020 projects). The use of some data might require agreements with data providers. 3. These predictors are use in different regression and classification models

39
Deliverable n° 10.1
• Different options will be considered according to the availability of the predictors in Spain (e.g. set of predictors available in most of the river basin in Spain, others more specific to the case study).
• The adequate time lag of influence between one event (e.g. high discharge peak) and turbidity measurements will be estimated using rational criteria (e.g. water travel time, time to peak) and statistical methods.
• This task includes aggregation of time series (by minute, hour, day…), analysis of time series´cycles (e.g. seasonal) and trends, calculation of autocorrelation coefficients for the selected time series, test Granger causality hypothesis and other models to be used in predictive mode (regression, decision tree learning algorithm, neural network, etc.). Some examples of application of statistical models are presented in Annex 12.
• If fully data oriented model are not sufficient to provide the required forecasts, hybrid models will be investigated. These hybrid models will incorporate simplified representation of erosion and sediment transport.
• The skill of the forecast models is assessed using different type of scoring (e.g. confusion matrix, ROC analysis, etc.)
• Different types of forecast models will be produced to provide information at different forecast times (e.g. a first model feed by meteorological forecast that provides a first alarm on the potential risk of having high turbidity event in the next days, then a second model feed by radar information that gives an alarm if there is a high probability of having a turbidity peak in the next 2 hours).
Conductivity and other parameters evolution driven by drought
A coupled approach water quality / water management model appears necessary to simulate and anticipate drought impacts and develop preventive actions at the river basin scale. This is especially necessary in the Llobregat basin, with limited natural flow in summer and therefore highly impacted by water management decisions (minimum reservoir release, WWTP perfor-mance, flow connections in the system). The climate data to be used for predicting conductivi-ty is shown in Figure 20.
IMPREX has received funding from the European Union Horizon 2020 Research and Innovation Programme under Grant agreement N° 641811
40
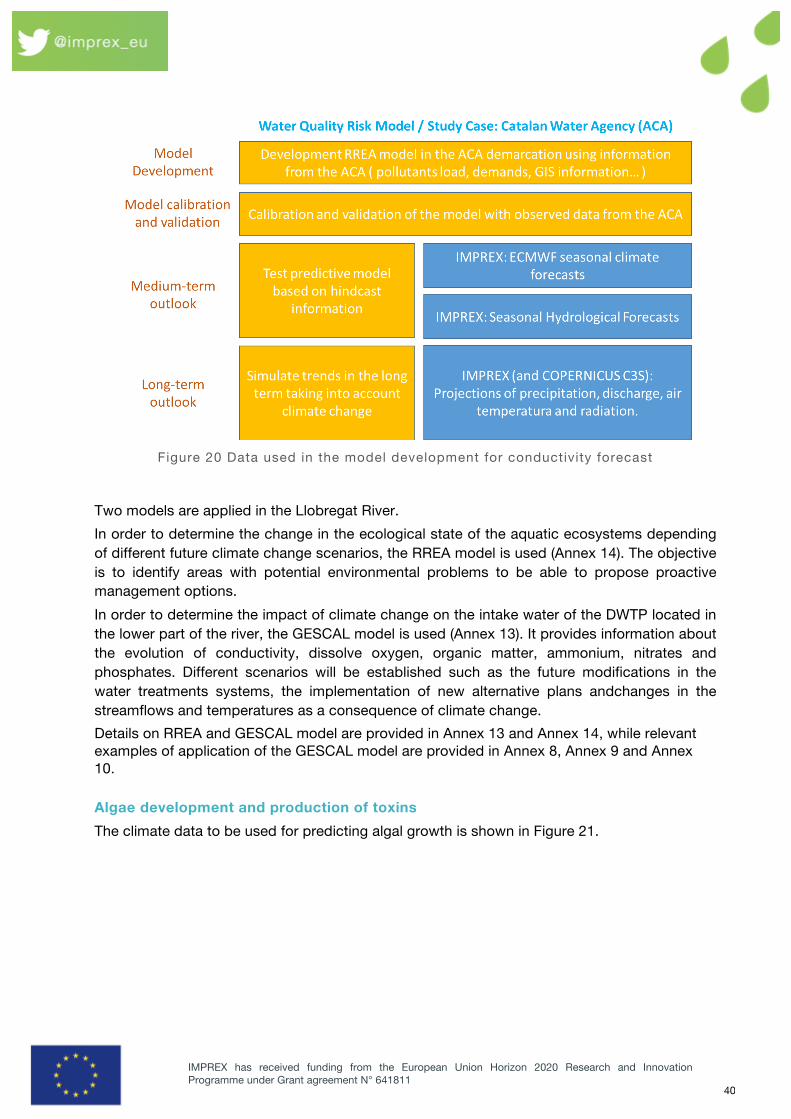
Figure 20 Data used in the model development for conductivity forecast
Two models are applied in the Llobregat River. In order to determine the change in the ecological state of the aquatic ecosystems depending of different future climate change scenarios, the RREA model is used (Annex 14). The objective is to identify areas with potential environmental problems to be able to propose proactive management options. In order to determine the impact of climate change on the intake water of the DWTP located in the lower part of the river, the GESCAL model is used (Annex 13). It provides information about the evolution of conductivity, dissolve oxygen, organic matter, ammonium, nitrates and phosphates. Different scenarios will be established such as the future modifications in the water treatments systems, the implementation of new alternative plans andchanges in the streamflows and temperatures as a consequence of climate change. Details on RREA and GESCAL model are provided in Annex 13 and Annex 14, while relevant examples of application of the GESCAL model are provided in Annex 8, Annex 9 and Annex 10. Algae development and production of toxins The climate data to be used for predicting algal growth is shown in Figure 21.

41
Deliverable n° 10.1
Figure 21 Data used in the model development for algal development
Two methodologies were initially proposed and are described below: • Use of ANN. This methodology was discarded due to the lack of data in the Segura
case study. It might be valid in other case study. • Use of GESCAL model. In reservoirs and lakes, water quality can be represented as a
continuously stirred tank or as a two-layer model that includes the epilimnion and hypolimnion. This model has been used to simulated eutrophication processes and is adapted to the data availability for the case study considered. In this case the climate data to be used and the forecasts horizons are similar than for conductivity.
Generation of probabilistic forecast
Turbidity forecast
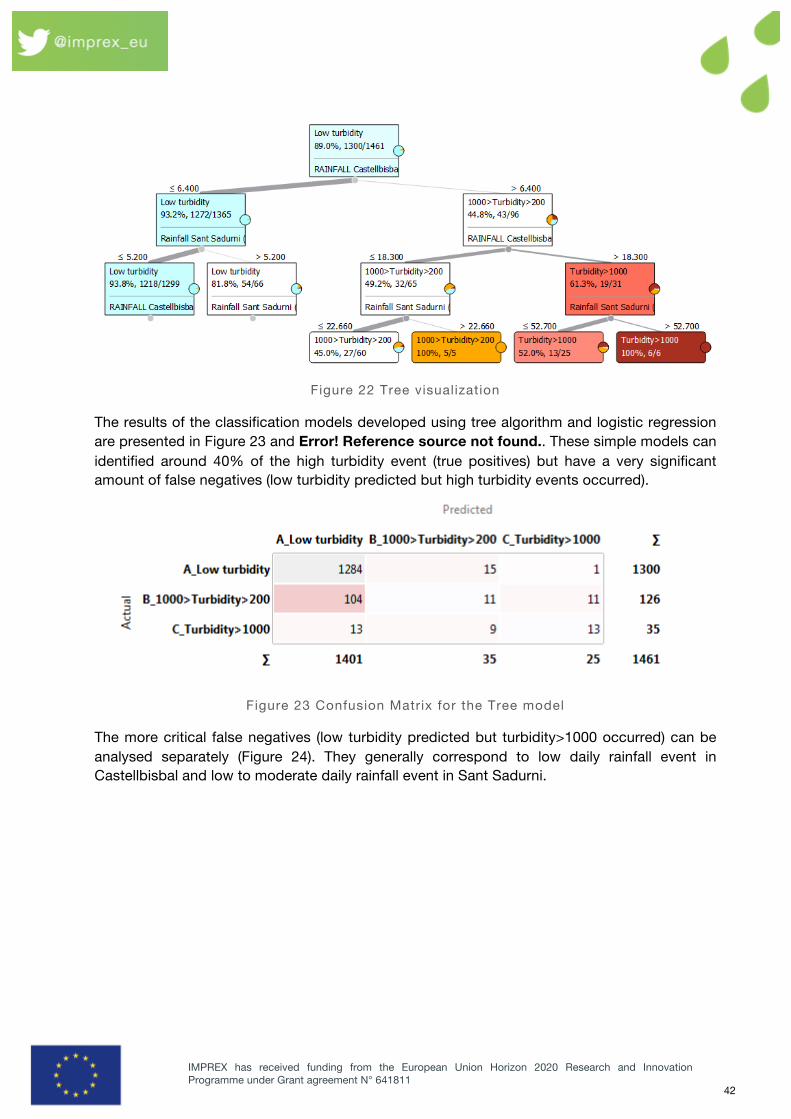
Predictive models using a tree algorithm and logistic regression have been developed for turbidity at Sant Joan Despi, based on daily rainfall in Rubi tributary (Castellbisbal station), Anoia tributary (Sant Sadurni station) and upper Llobregat and Cardener Tributary (Manresa station). The Orange machine learning and data mining suite has been used (Demšar et al., 2013). Other methods are being tested based on previous studies (Annex 12). Results of the tree classification (Figure 22) shows that 19 over the 31 high turbidity events considered (>1.000 NFU) occurred when the daily rainfall was superior to 18.3 mm in Castellbisbal; in addition when the daily rainfall in Sant Sadurni was superior to 52.7mm then the turbidity was superior to 1000 NFU 6 times over 6.
IMPREX has received funding from the European Union Horizon 2020 Research and Innovation Programme under Grant agreement N° 641811
42
Figure 22 Tree visualization
The results of the classification models developed using tree algorithm and logistic regression are presented in Figure 23 and Error! Reference source not found.. These simple models can identified around 40% of the high turbidity event (true positives) but have a very significant amount of false negatives (low turbidity predicted but high turbidity events occurred).
Figure 23 Confusion Matrix for the Tree model
The more critical false negatives (low turbidity predicted but turbidity>1000 occurred) can be analysed separately (Figure 24). They generally correspond to low daily rainfall event in Castellbisbal and low to moderate daily rainfall event in Sant Sadurni.

43
Deliverable n° 10.1
Figure 24 False negative from the logistic regression
The next steps regarding the development of predictive models are the followings:
• Analyse time series at an hourly timestep (currently the classification model work with daily rainfall and turbidity value registered at 22h00)
• Develop and add predictors that can represent the processes occurring in the basin more accurately (e.g. add 6 hours precipitation intensity)
• Develop different type of predictand (target variable) that are relevant for stakeholders (e.g. turbidity or OM peak occurring at least during 6 hours during a day; turbidity value in the next 12 hours, etc.)
• Test other types of models and tune the selected models
Algae development
Some preliminary tests were performed for the dam of the La Contraparada DWTP but due to the lack of data and the specific situation of the dam, it was decided to propose an additional

IMPREX has received funding from the European Union Horizon 2020 Research and Innovation Programme under Grant agreement N° 641811
44
case study (As Forcada dam). This would allow to simulate more robustly the effect of climate on algae development. La Contraparada DWTP dam During the last years, the Contraparada reservoir did not suffer from any eutrophic phenomenon. The good plant management and the daily control of some of the most influential variables in the phytoplankton growth has reduced the risk of eutrophication. The Contraparada reservoir is located in a geographic area characterized by high light and high temperatures. Normally these physical conditions are favourable to generate a eutrophic situation, but the low concentration of essential nutrients limited the growth of the algal community. Since the nutrient concentration is very low, it is often below the detection threshold of the analytical methods used. Accordingly the modelling of eutrophication processes would not be possible with dynamical model or ANN model. Tests will be continued with simple regression model. As Forcadas dam The Forcadas reservoir is localized in the north of Galicia and has suffered repetitive cases of cyanobacteria blooms. The objective of this project is to model the chlorophyll-a to provide information on the algal dynamic and to anticipated algal blooms. Data have already been provided by VIAQUA and the Xunta de Galicia. The chlorophyll-a model will depend on hydrometeorological criteria as the temperature, the inflow and outflow to the reservoir, the incident radiation etc. Other drivers will be the nutrients load, the intraspecific competence algal or the oxygen concentrations. First, the observed data will be used to calibrate and validate the model. VIAQUA and the Xunta de Galicia have already provided the data used. Secondly, several climate change scenarios will be simulated in which will be included hydrometeorological datasets from the WP3/WP4. The objective is to know the system response faced different future situations.
Conclusion Different methodologies using forecasts of meteorological and hydrological extremes to predict water quality parameters are being tested in the case studies. A summary is presented in Error! Reference source not found.. Additional data are being gathered from the project partners (WP3 and WP4) and external sources (e.g. stakeholders such as ACA or Xunta de Galicia) to performed all the tests.
Table 2 Summary of methodologies used
Processes Methodology Climate input Case study
High turbidity events (e.g. > 1000 NFU) and organic matter
Regression based on precipitation and other variables. Forecast based on
Meteorological forecast
Llobregat basin (principally Sant Joan Despi DWTP) One or two additional

45
Deliverable n° 10.1
meteorogical forecast. case studies will be defined.
Peak in turbidity events and organic matter (moderate value)
Regression based on multiple variable
Meteorological forecast
La Contraparada DWTP
Peak in conductivity and other parameters during low flow period
Dynamic model: RREA and GESCAL
Projections Llobregat basin (principally lower part)
High algae development and production of toxins
Dynamic model Meteorological forecast, seasonal forecast
As Forcadas dam

IMPREX has received funding from the European Union Horizon 2020 Research and Innovation Programme under Grant agreement N° 641811
46
4. Adaptation of the urban water system according to fresh water quality forecasts
Analysis of the benefits of water quality forecasts on water treatment operations
Context
The water quality forecasts developed in the project can help in updating the actions encompassed in the Water Safety Plan (WSP), thus leading to safer and more resilient supply of drinking water. A WSP is a plan to ensure the safety of drinking water through the use of a comprehensive risk assessment and risk management approach that encompasses all steps in water supply from catchment to consumer (WHO, 2006). WSPs are considered by the WHO as the most effective means of maintaining a safe supply of drinking water to the public. In addition, the understanding of the risk and the practices implemented in the project case studies will help other drinking water treatment facilities to develop adapted WSP (identification of risks, practical example of prevention, and list of operational practices to minimize the possible affection of the events).
Case of the La Contraparada DWTP
In October 2011, Aguas de Murcia passed the audit for the certification of ISO 22000 (Food safety management system). The implementation of the ISO 22000 implies operational practices and the application of the WSP to identify, evaluate and manage potential risks that may affect water quality. ISO 22000 is a certifiable international standard that integrates the principles based on Hazard Analysis and Critical Control Points (HACCP) and prerequisite programs within a management system of the ISO 9001 type. In turn, it incorporates verification elements, which allows to focus the analytical control at critical points in the drinking water supply system and enhance continuous control for real-time decision making. Through this tool, continuous improvement in the sanitary safety of water is achieved throughout the entire supply chain, from raw water catchment, production to distribution for consumption. Technologies and methodologies have been incorporated into the water quality control activity to ensure improvements in the production processes and the quality of the water distributed to the population. Practices have been developed and are continuously improved in Contraparada DWTP to manage the DWTP in operation (monitoring, retention time, water level, control of phytoplankton and fishing community in the plant dam, control of disinfection by-products) and the stops and starts of DWTP (refilling of the plant dam, monitoring). Details are provided in Annex 15. If adequate forecast of turbidity and OM are available, different actions to prevent this increase could be applied (e.g. close the plant´s dam intake) so the treatment would not suffer additional costs. Table 3 shows the expected benefits of the IMPREX project in La Contraparada DWTP.

47
Deliverable n° 10.1
This should be confirmed by analysing the hindcasts that will be produced for La Contraparada. For example, in different number of events, less flocculants could have been used thus leading to a certain costs saving. In addition, by identifying these climatic events control activities can be better planned to avoid an emergency situation in the DWTP. In this way the level of control of the process is increased and the final quality of the water distributed is improved as well. Once the forecast have been developed and tested, the control diagrams (Annex 16) for the risks driven by climate will be updated. The control of the variables that allow the forecast to be done (the “predictors”) will be ensured.
Table 3. Benefits of the IMPREX project for La Contraparada DWTP
Impacts of climate events in La Contraparada DWTP
Benefits from IMPREX project
Heavy rainfalls àTurbidity à Increase doses of coagulants & flocculants. Increase frequency of GAC filters washing
The cost of this additional treatment in the DWTP is 1c€/m3. Thanks to the IMPREX project would be 0c€/m3. Improved management of raw water.
Heavy rainfalls àOrganic matter àIncrease doses of oxidants and coagulants & flocculants
The cost of this additional treatment in the DWTP is 1c€/m3. Thanks to the IMPREX project would be 0c€/m3. Improved management of raw water.
Other DWTPs
The additional costs of treatment produced by the current changes in water quality has been gathered in the survey sent to the 21 DWTPs (see 2.1.3). The average increase is around 0.12 €/m3 for all the plants and all the events considered and up to a 0.50€/m3 increase for turbidity events in one of the plants. This is a very significant increase, comparable to the cost of producing drinking water from sea water (desalination costs are around 0.4€/m3). For plant producing 1m3/s or 2 m3/s, even little increase in the cost can lead to huge amount of money, especially if the water intake has to be cut-off during a few days. Once the characteristics and skill of the forecasting system will be known, the potential changes in the decision making and the associated benefits will be estimated. The comparison of costs between the business as usual and the IMPREX-based vision will be based on the hindcasts produced for the case studies (simulation results) and on expert judgment for the DWTPs surveyed (hypothetical cost saving considering the solutions developed in the project). For the DWTP affected by high turbidity event, the potential usefulness of the turbidity forecast is as follows:

IMPREX has received funding from the European Union Horizon 2020 Research and Innovation Programme under Grant agreement N° 641811
48
• Know in advance turbidity level (below critical threshold): decide on the opportunity to mix river water with other sources to reach water quality standard without increasing too much the cost of the water production
• Know in advance when the turbidity will go above threshold (first peak): plan the cut-off of the river intake, check availability of alternative sources, plan an increase in chemical analysis, plan an increase in filters maintenance and chemicals to reach water quality standard and avoid damaging the treatment system (which can cost up to a few millions euros in big cities).
• Know in advance for how long the turbidity will be near or above threshold: plan to empty the sand-filters, avoid re-opening the river-intake if there is a risk that the turbidity increase again (this has important consequences on the treatment chain), ensure availability of alternative resources (discussion with River Basin Agency)

49
Deliverable n° 10.1
Analysis of the benefits of improving water treatment planning and proposition of structural changes
In the situation of events of greater magnitude and more frequent, alternative or complementary treatments and control devices might be necessary to obtain safe drinking water with the highest efficiency possible (taking into account yields in water quality and economic and energy costs) Some example of these changes are detailed below.
- Implementation of sand filters The incorporation of sand filtration as a pre-filtration step in activated carbon (dual filtration) provides a reduction in the precursors of bromate formation. All of this together with the lower amount of ozone applied due to a lower presence of solids in the water subjected to ozonisation will make to limit the production of bromates at levels required. Slow sand filtration removes both cyanobacteria, including intracellular toxins and extracellular toxins (Grützmacher et al., 2002) because some bacterial strains are able to colonize the upper sand layer and biodegrade them. As an example, in the case of La Contraparada DWTP, this additional measure has been esti-mated that is not necessary yet. The benefit in water quality will not be higher than the eco-nomic cost of the improvement. The cost that would imply to implant sand filters would be su-perior to 1 million € and as of today, the DWTP has no defaults in the quality of the water they supply, so they cannot evaluate the cost of the improvement.
- Artificial destratification and aeration in the reservoir
On the one hand, the implementation of a system for forced aeration in the reservoir would help to prevent the appearance of an algal bloom, and in case of bloom success, to manage it. Forced aeration in itself is a disturbance of the water that will modify the physical-chemical conditions of the water and will make the bloom not feel comfortable. On the other hand, the algal bloom causes a sudden decrease of oxygen, and forced aeration would restore the oxic conditions of the medium, very important to avoid fermentation pro-cesses by the anaerobic bacteria with a release of hydrogen sulphide that cause bad organo-leptic characteristics. The most common approach for the artificial destratification and aeration of lakes and reservoirs include direct injection of air oxygen using diffusers, paddle wheel mixers, solar powered circulation, surface sprays, aerating weirs, and others. The main goal of these systems are to redistribute nutrients to reduce the potential for HABs, increase dissolved oxygen to mitigate the effects of hypoxia caused by algal blooms, and increase the oxygen concentration of bottom sediments to reduce nutrient release. (Reynolds et al., 1983) examined the predominance of Anabaena versus diatoms in a limnetic enclosure study. They found that artificial destratification reduced HABs since Anabaena was favoured under stagnant flow conditions, but under mixing conditions, diatoms dominated. (Visser et al.,1996) got rather similar results when they studied microcystis over flagellates, green algae and diatoms. As an example, artificial destratification and aeration in La Contraparada reservoir was already carried out in 2012 and the results were very positive. When considered necessary, this technology could be re-applied in the reservoir. It is a simple technology and does not involve a high economic cost.

IMPREX has received funding from the European Union Horizon 2020 Research and Innovation Programme under Grant agreement N° 641811
50
- Implantation of chlorophyll and phycocyanin probe in the reservoir The implantation in La Contraparada reservoir of a sensory equipment of algal pigments and/or determination of the algal groups present, would help to the water management in the reservoir:
• It would reduce the need for laboratory analysis and the time to obtain the results. Currently it is necessary with a frequency of two days a week, the composition and algal biovolume is determined. For the analysis of chlorophyll and phycocyanins minimum 2 hours should be allowed to freeze, thus, they are not normally analysed until the next day after sampling and filtration. With sensors, the results could be checked at the moment, being able to anticipate the detection of a possible algal bloom. The frequency of laboratory analyses would be reduced, which would be useful for calibration and testing of the probes.
• Analyses of algal determination and pigments in the laboratory require high specificity of knowledge, training and experience. In the case of using sensors, monitoring of the data for the management of the reservoir would not require a qualified profile in the laboratory. As an example, this improvement is not foreseen in La Contraparada DWTP, since the cost benefit is not profitable. The cost of a probe for phycocyanin measurement is approximately 4000€. - Complementary treatment for cyanotoxins
The existing treatments for the elimination of cyanotoxins are as follows: - Oxidation with ozone, pre-oxidation with chlorine dioxide and main disinfection - Coagulation/Flocculation - Sand filtration - GAC filtration - Final chlorination
Experiments in a pilot plant in La Contraparada DWTP will be carried out next months to evaluate and compare the efficiency of different treatment techniques to remove cyanotoxins (including microcystins and anatoxins). These tests will be done in the pilot plant, but on the condition that there is presence of cyanotoxins in the raw water (in La Contraparada reservoir). And the results obtained in the pilot plant will be compared with the industrial plant, so the results will be compared simultaneously.
Firstly different doses of coagulants/flocculants will be tested and when the optimal dosage is found the following steps will be tried. To control water quality, turbidity shall be measured as a central parameter and other parameters shall also be measured as pH, conductivity, organic matter, residual oxidant concentration and DBPs (bromates when ozone is used and chlorites and chlorates when chlorine dioxide is used). If there are indications that the disinfection has not been optimal, the microbiological analyses that appear in the RD 140/2003 will be performed as well.
Secondly the doses of oxidants (ozone and chlorine dioxide) will be tested. An oxidizer will be tested, then another, and finally the two oxidants will be combined using the ozone first and then the chlorine dioxide. Then the cyanotoxins in raw water and in each of the previous steps

51
Deliverable n° 10.1
will be analysed, in order to be able to calculate the percentage of elimination in each of the steps.
Sand filtration helps and will also be tested, but if there is a configuration with optimal results without sand filtration, it will be chosen that configuration, since this process does not exist in the industrial plant of La Contraparada. As an example, la Contraparada DWTP has been in operation since 1974 and oxidation with ozone has been implemented since 1996. Pre-oxidation with chlorine dioxide was implemented since 2010 in support of ozone oxidation. Coagulation/Flocculation has been underway since the beginning of the DWTP. Until 1996, La Contraparada DWTP worked with sand filters and from that date on, sand filters were replaced by GAC filters to date. Final chlorination has been implemented since the beginning of DWTP. The pilot plant in La Contraparada has been in operation intermittently since 2007 until now. Clarification tests have been carried out in the pilot plant, testing new coagulants and flocculants. Chlorine dioxide has also been implemented. Electrolysis tests. Active carbon testing and DBPs. Decrease in the pH of the treatment by application of CO2.
- Homogenization and regulation pond
Such a pond could store water to supply the DWTP during a reduced period (a few hours to a few days) when the intake is close. It could also improve the quality of raw water (decantation, laminate contamination peaks, etc.) but is also susceptible of eutrophication risk. As an example, la Contraparada reservoir was built in 1996 to avoid fluctuations in water flow from Tajo-Segura River Transfer, which could affect water quality.
Conclusion To ensure the safety and security of urban water, it is important to adapt the treatment proactively depending on the raw water quality at different timescales:
• Operational (next hours) • Planning (next months) • Design (years to decades)
The results of WP10 can bring improvement for the measures controlling the risk due to the water quality parameters affected by climatic events (Figure 25)
• Optimization in the implementation of the operational measures to manage the risk (frequency of monitoring and variable to be followed, preparation of human resources, duration of the measures, preparation in the use of alternatives sources or complementary treatments, ensure sufficient reactive and prepare treatment chain in the next days)
• Better planning: plan the maintenance, define the best month to perform certain type of maintenance
• Resilient design: make infrastructure resilient to possible changes, including climate change, implement no regret measures.

IMPREX has received funding from the European Union Horizon 2020 Research and Innovation Programme under Grant agreement N° 641811
52
Figure 25 Measures to control the risks driven by climate
The results of the projects will be used to update the current practices of the WSP in the case study and will present the best practices to be used in other sites. The economic benefits will be calculated based on the results of the tests currently performed in the case studies and the knowledge of the DWTPs´ managers involved in the study (Figure 26).
Figure 26 Calculation of the benefits of IMPREX project

53
Deliverable n° 10.1
5. Preliminary market analysis This section presents a preliminary market analysis for the services developed in WP10. Some aspects will be developed during the services development in the case studies. The methodology follows the recommendations of the work done in the EUPORIAS project (Deliverable 45.1 Report on methodology to assess business opportunities).
Industry analysis
Spain has more than 1,300 Drinking Water Treatment Plants (DWTP) that supply a total of 4,231 hm³ to the distribution networks. 67% of the water collected for supplies corresponds to surface water, 30% to groundwater and the remaining 3% comes from desalinated water. As for the quality of the water at origin, there is a decrease in the availability of excellent water and increase the percentages of water of lower quality (AEAS 2016). The distribution of the population supplied by public, private or mixed entities remains in bal-ance. 34% is supplied by public entities, 34% by private companies, 22% by joint ventures and 10% by municipal services. The employment of the urban water sector is stable and quali-fied. The number of direct jobs in the sector is 26.800. In 2015, the average price of water for domestic use is 1.77 € / m³.(AEAS 2016) In terms of investments, urban water operators allocate for supply (treatment plant and distri-bution) around 435 million euros per year to investment in new infrastructures or equipment and 375 million euros per year to investment in renovation. The inversion for sewer collection and depuration is around 566 million euros. In total, the investment made by the operators of urban water services is equivalent to the volume of investment made by all the administrations, both state and regional in terms of water. (AEAS 2016). The environmental and economic impacts of operation and maintenance of any DWTP are much larger than the one linked to construction phase (AQUENVEC, 2016). The energy re-quired for the treatment process and the chemicals used in the treatment process are respon-sible for most of the environmental impact and most of the costs. The operation and mainte-nance costs greatly depend on the quality of the raw water and the transport necessity. As an example operation cost represent around 170.000 €/year for Betanzos DWTPs (respectively 13.700 and 24.000 inhabitants).

IMPREX has received funding from the European Union Horizon 2020 Research and Innovation Programme under Grant agreement N° 641811
54
Demand analysis
The survey performed within WP10 show the priority from a private urban water operator´s per-spective. The needs of the operators have been detailed in Section 2. It is believed that a significant part of the total market (1,300 DWTP in Spain and other DWTP using surface water as main source) would be interested by the services developed by the pro-ject. As an example, the survey performed tell us that 70% of the DWTP manager were inter-ested in getting turbidity forecasts. Of course, the interest will greatly depend on the final skill of the water quality forecasts. During the development of the service, the needs and the willingness to pay will be detailed. Supply analysis
No predictive platform have been identified for water quality parameters and targeted for urban water operators. Current practice are based on empirical knowledge (e.g. interpretation of rain-fall forecast provided by meteorological agencies, interpretation of trend in measurements, etc.). Feasibility study
A socio-economic benefit study will be performed to evaluate the usefulness of the water quality forecast. This evaluation will be based on an analysis of different scenarios (e.g. busi-ness as usual vs use of the services developed). Since the costs and the environmental impacts linked to the operation of a DWTP are im-portant (e.g. 170.000 €/year for small DWTPs) and mainly due to the treatment processes (chemical reactive and energy consumption), the tuning of the treatment processes derived from the project can generate significant benefits. Business model
The exploitation of the results will be defined with the WP10 partners and the SUEZ group. A canvas model will be developed for the most promising services. Different option of exploitation are presented below and will be discussed with the group prod-uct managers
o Operational service: Insertion in Aquadvanced™. Aquadvanced™ is an innova-tive solution for efficient management of the supply network that reduces oper-ating costs, monitors water quality and optimises consumption of water and en-ergy. The software solution of SUEZ, Aquadvanced® suite, gathers and anal-yses all the data and turns it into knowledge for the decision-making process. It has been designed for operators by operators.
o Operational service: Insertion in other products of the SUEZ group for Early Warning System, Weather Forecasting and Risk management (WICAST, HI-DROMET – flood forecasting, COWAMA & iBeach- bathing water forecasting)
o Consulting services: insertion in the portfolio of offer that SUEZ provide to water stakeholders, recommendation for investment in new infrastructures or invest-ment in renovation.

55
Deliverable n° 10.1
6. Conclusions The sudden increase of turbidity in surface water, principally due to heavy rainfall events, is the main challenge for the treatment plant managers surveyed in Spain. Forecast of turbidity for the next hours and days are the most required to operate the treatment plant efficiently. Other parameters of interest identified in the survey are organic matter, conductivity, and cyanotoxins. These parameters can be driven by heavy rainfall, drought (low flow) and more complex combination of factors (temperature, wind, anthropogenic drivers, etc.). Changing water quality result in additional cost for the operation of the plant, mainly due to an increase doses of coagulants & flocculants, increase frequency of GAC filters washing, use of alternative resources (aquifer, desalinisation), additional analyses and human resources. The water quality forecast developed in the project can help in updating the actions encompassed in the water safety plan (WSP), thus leading to safer and more resilient supply of drinking water. Different methodologies are being tested in the two project case studies as well as additional sites to develop the following forecasts:
� High turbidity events due to heavy rainfall and runoff � Peak in organic matter due to temperature extremes � Peak in conductivity and other parameters during low flow period due to drought and
low flow… � Algae development and production of toxins due to warm conditions and climatic
stressors such as rain event. The current limitation is the gathering of adequate data to fully understand the process at stake (e.g. hourly data for turbidity forecast). WP10 team is working closely with ECMWF team to get the suitable data and use the latest IMPREX developments. In the coming month, the potential benefits of using the service developed will be evaluated for the case studies and the target market. Another survey to DWTP manager has been sent. The different options of exploitation are being detailed with the SUEZ group product managers.
IMPREX has received funding from the European Union Horizon 2020 Research and Innovation Programme under Grant agreement N° 641811
56
7. References Bravo Fortune, M., Flores Audibert, R., Galindo Urra, R., Ganeaud Salazar, R., Muñoz Morales,
E., Serey Amador, A., & Viale, M. (2014). ESTABLISHING THE POSSIBLE IMPACT OF CLIMATE CHANGE-RELATED PHENOMENA UPON THE SUPPLY OF WATER FOR HUMAN CONSUMPTION TO CHILE’S SANTIAGO METROPOLITAN REGION (Aqua Papers). Madrid: Aquae Foundation.
Delpla, I., Jung, A.-V., Baures, E., Clement, M., & Thomas, O. (2009). Impacts of climate change on surface water quality in relation to drinking water production. Environment International. https://doi.org/10.1016/j.envint.2009.07.001
Demšar, J., Curk, T., Erjavec, A., Hočevar, T., Milutinovič, M., Možina, M., … Zupan, B. (2013). Orange: Data Mining Toolbox in Python. Journal of Machine Learning Research, 14, 2349–2353. Retrieved from http://eprints.fri.uni-lj.si/2267/1/2013-Demsar-Orange-JMLR.pdf
Jordi Valls. (2015). Case study: Aguas Andinas Water Cycle management. In UN-Water Annual International Zaragoza Conference.
Loucks, D. P., & van Beek, E. (2017). Water Resource Systems Planning and Management. Cham: Springer International Publishing. https://doi.org/10.1007/978-3-319-44234-1
Merel, S., Walker, D., Chicana, R., Snyder, S., Baurès, E., & Thomas, O. (2013). State of knowledge and concerns on cyanobacterial blooms and cyanotoxins. Environment International. https://doi.org/10.1016/j.envint.2013.06.013
Momblanch, A., Paredes-Arquiola, J., Munné, A., Manzano, A., Arnau, J., & Andreu, J. (2015). Managing water quality under drought conditions in the Llobregat River Basin. The Science of the Total Environment. https://doi.org/10.1016/j.scitotenv.2014.06.069
Panagos, P., Borrelli, P., Poesen, J., Ballabio, C., Lugato, E., Meusburger, K., … Alewell, C. (2015). The new assessment of soil loss by water erosion in Europe. Environmental Science & Policy, 54, 438–447. https://doi.org/10.1016/j.envsci.2015.08.012
Paredes-Arquiola, J., Javier, M., Pedro-Monzonís, M., Belda, E., Momblanch, A., & Andreu, J. (2016). River water quality modelling under droights situations. The Turia River case. Proceedings of the International Association of Hydrological Sciencies, 374, 187.
Paredes, J., Andreu, J., & Solera, A. (2010). A decision support system for water quality issues in the Manzanares River (Madrid, Spain). Science of the Total Environment.
Superintendencia de Servicios Sanitarios. (2013). Contingencias Aguas Andinas – ESVAL_ Verano 2013 y Medidas adoptadas. Retrieved from http://www.siss.gob.cl/577/articles-10091_ppt1.pptx
Superintendencia multa a Aguas Andinas con $ 797 millones por cortes de agua. (n.d.). Retrieved from http://www.latercera.com/noticia/superintendencia-multa-a-aguas-andinas-con-797-millones-por-cortes-de-agua/
Turbidity Event April 2016 Santiago Chile “Storms leave three million without water in Santiago.” (2016). Business Recorder.
WHO. (2006). Guidelines for Drinking-water Quality - Volume 1 Recommendations. Retrieved from https://www.who.int/water_sanitation_health/dwq/gdwq0506.pdf

57
Deliverable n° 10.1
8. ANNEXES
Annex 1 Details on legal requirements Legal requirements applied to both the raw water used and the treated water produced. The water supply to the customers should always respect the current legislation. This legislation can be updated according to the new risks detected.
Legal requirements regarding drinking water quality in Spain
- Water catchment At European level, the Water Framework Directive (WFD) is a European Union directive which commits European Union member states to achieve good qualitative and quantitative status of all water bodies (including marine waters up to one nautical mile from shore) by 2015. At the national level, the hydrographical Confederations are responsible for compliance and monitoring of the parameters established in the Royal Decree 817/2015. The DWTPs, such as La Contraparada DWTP, conform to the Environmental Quality Standards (EQS); parametric values and analysis frequencies, established in the Royal Decree 817/2015. Royal Decree 817/2015, of 11 September, establishing the criteria for monitoring and evaluation of surface water status and environmental quality standards arises because it is considered necessary a new regulatory development that integrates all the aspects on monitoring and evaluation of water status and EQS, to comply with Directive 2000/60/EC. This Royal Decree repeals the Regulations of the Public Administration of Water and Hydrological Planning, approved by RD 927/1988 (later RD 1541/94), annexes 1 to 4 and related ministerial orders.
Watercatchment
•Europeanlegislation:TheWaterFrameworkDirective(Directive2000/60/ECoftheEuropeanParliamentandoftheCouncilof23October2000establishingaframeworkforCommunityactioninthefieldofwaterpolicy)•Nationallegislation:RoyalDecree817/2015,of11September,establishingthecriteriaformonitoringandassessingthestatusofsurfacewatersandtheenvironmentalqualitystandards.
Treatmentanddistributionof
water
•Europeanlegislation:CommissionDirective(EU)2015/1787of6October2015amendingAnnexesIIandIIItoCouncilDirective98/83/EConthequalityofwaterintendedforhumanconsumption•Nationallegislation:RoyalDecree140/2003,of7February,bywhichhealthcriteriaforthequalityofwaterintendedforhumanconsumptionareestablished

IMPREX has received funding from the European Union Horizon 2020 Research and Innovation Programme under Grant agreement N° 641811
58
This standard has legal nature of basic legislation, the established criteria are minimum requirements and leaves room for regional regulation by the Autonomous Communities with competence in environmental matters. With respect to the four quality parameters most affected by climatic events; conductivity, turbidity, organic matter and presence of algae and microcystins, the WFD takes into account the conductivity, turbidity and presence of algal (phytoplankton). The Royal Decree 817/2015 explains that the monitoring and operational control programs are complemented by the control of water intended for supply, where will be monitored water bodies that provide an average of more than 100 cubic meters per day for the population supply, such as La Contraparada reservoir. For this purpose, control over the priority substances discharged and the contaminants discharged in significant quantities will be carried out with particular attention to substances that affect the state of the body of water (ecological status and chemical status) regulated in Annex I of Royal Decree 140/2003. The periodicity of these additional controls depends on the population supplied, according to the following table:
- Treatment and distribution of water At European level, is the Commission Directive (EU) 2015/1787, which establishes the quality of water for human consumption. At the national level, is the Royal Decree 140/2003, which establishes health criteria for drinking water and water pumping facilities. It also establishes water control, guaranteeing its safety, quality and cleanliness, in order to protect the population’s health from the adverse effects of contaminated water. It also provides the analytical requirements of the methods used in the characterization of water for human consumption. With respect to the four quality parameters most affected by climatic events, the Commission Directive (EU) 2015/1787 takes into account conductivity and turbidity and the Royal Decree 140/2003 establishes for turbidity (1 NTU at the ex DWTP and/or reservoir and 5 NTU in the distribution network), for conductivity 2500 μS/cm at 20ºC, for oxidability (organic matter) 5 mg O2/l and for microcystin 1 µg/l that it shall be only measured if there is reason to suspect of eutrophication in water from the catchment. Microcystin shall be measured in the water ex DWTP or water tank.
POPULATIONSUPPLIED PERIODICITY <10.000inhabitants Quarterly
10.000-30.000inhabitants 8timesayear >30.000habitants Monthly

59
Deliverable n° 10.1
Annex 2 Other case studies This section present the most relevant example of case studies related to our research ques-tions. It presents for each case studies the impacts of different hydro-climatic events:
• Impact of heavy rainfall o Turbidity on the water supply of the Santiago Metropolitan Region of Chile
• Impact of drought o in Madrid and Valencia
• Impact of climate on algae development….
Impact of heavy rainfall • Santiago de Chile - Maipo and Mapocho Rivers (more details in Annex 5)
o In April 2016, three million people living Santiago out of a total 6.2 million inhab-itants were left without drinking water due to the "extreme turbidity" of the Maipo and Mapocho Rivers. The impact were similar than for the 2013 events and the Public administration fined the operator Aguas Andinas for more than 600.000 € since the management of the event was not as efficient as it could have been.
• Lima (more details in Annex 6) Impact of drought
• Madrid- Manzanares River o A lower dilution capacity occur during drought. This situation generally occurs in
the Manzanares River for which the effluents of WWTPs represented 90% of the flow in the middle and lower parts of the river. The derived water quality problems are related to low dissolved oxygen concentrations, a high ammonia content in the water, and conductivity that is three or four times greater than natural conditions. Furthermore, the contribution of nutrients from this area constitutes the better part of the nitrogen and phosphorous pollution source, causing eutrophication problems in the downstream reservoirs and drinking treatment plant. This case study is detailed in annex.
• Valence – Turia River o During drought condition reduction are applied on the release of water from the
upstream dam thus an increased concentration of pollutants is measured in the river. This case study is detailed in annex.
Impact of climate on algae development • Province of Vic
During 2016 the presence of geosmins occurred in several small DWTPs in the province of Vic (Barcelona, Catalonia), which are supplied with water from Ter river and are managed by the company Aigües d'Osona. Cyanobacteria generate geosmin as intracellular by products and when algal blooms occur, bacteria die and release chemicals that give off odours to soil, causing an unpleasant smell to the drinking water. Cetaqua evaluated the problem and offered the following solutions to Aigües d'Osona:
• Installation and validation of an alert system for the formation of geosmin; a probe for the detection of cyanobacteria.
• Determine the best granular activated carbon (GAC) for the removal of geosmin from the Ter river water.

IMPREX has received funding from the European Union Horizon 2020 Research and Innovation Programme under Grant agreement N° 641811
60
• Determine the optimum operating conditions for powdered activated carbon (PAC) treatment for the removal of geosmin in the DWTPs.
• Determine alternative technologies based on oxidation processes (pre-chlorination with chlorine or chlorine dioxide, pre-oxidation with ozone) for the removal of geosmin that can be incorporated into the current treatment process.
• Evaluate the possible organoleptic impact of the water served. Detection of the geosmin detection threshold for the population of Osona.
Ebro River and Ampolla DWTP The case study of the Ebro River and Ampolla DWTP, allow to identify the impact of different climatic events in long term on the characteristics of water, and to apply these data to the structural design of DWTP. The conclusions drawn from the study of quantitative and qualitative data of the Ebro River as a resource for the Ampolla DWTP are:
• From the point of view of quantity of water, the resource maintains a record of enough minimum flow for supply of DWTP. Annual flow variations concur with seasonal floods. Sudden flow increases (torrential rains) lead to changes in water quality, and it may be a risk to remove contaminants present in riverbed.
• From the point of view of water quality: o The temperature ranges from 6 to 27.5°C, which are relatively high values.
Temperature is significant important in certain treatment processes (coagulation/flocculation, membrane filtration), as well as water quality (dissolved oxygen), so it is essential to know its behavior.
o The range of pH variability decreases. According to literature, pH has tended to increase 0.5% per year. Analogously to temperature, the pH is important for operation of different treatment units during the purification.
o Conductivity has a close relationship with chloride and sulphate. Based on the historical data, it is estimated an increase of episodes in which the sulfate concentration is higher than 250mg/L, but the current plant does not allow its elimination, reason why the design of new plant should have processes capable of eliminating them.
o Turbidity is directly related to the flow of river, although its increase does not exceed 50 NTU, so it does not suppose a complication for the operability of DWTP. Also noteworthy is the subsequent storage raft, which offers a half-day residence time, and therefore favors the decantation of solids.
o Ammonium and TOC are within the limits of portability before enter to DWTP. o The UV index is inversely proportional to river flow. Flow of river is altered a
couple of times every year in an express way in order to eliminate macrophytes and therefore maintain the biological quality of water.

61
Deliverable n° 10.1
Annex 3 Climate Change impact on Drinking Water Treatment Plants
One of the most comprehensive study on the impacts of climate change on surface water quality and drinking water production is summarized in Delpla et al. (Delpla et al., 2009). Some of the outcomes of this literature review are the followings:
Climate variable Impact of Climate Change Consequences on DWTP
Higher annual average temperatures
Algal blooms, deoxygenation, more frequent inversions leading to cryptosporidium accumulations
Deterioration of raw water quality. Increased chlorine requirements. Potential taste and colour issues. Need to backwash filters more often. Increased treatment cost. Algal growth in rapid gravity filters and clarifiers.
Higher surface water temperature Potential impact on existing coagulation and filtration processes.
Increase in rates of biological and chemical processes
Increased treatment required to meet drinking water standards. Increases risk of residual chlorine depletion and contamination of supplies.
Density of water decreases Potential change in process efficiency – easier to treat a given volume of water.
Hotter summers
Increase in demand for water Increase in volume of water requiring treatment.
Increase in incidence of water and wetland associated disease
Risk of contamination of raw water. Increased treatment requirements.
Increase in fires in catchment Can increase colour load beyond water treatment works design capacity
Increase in agricultural use of pesticides and nitrates during longer growing season
Deterioration of raw water quality – harder to treat. Greater variability in water quality as a result of differing pollutants in raw water from altered land practices may affect the efficacy of water treatment processes. Single-stage treatment processes will be particularly vulnerable to this.
Drier summers
Low base flows and concentration of contaminants.
Deterioration in raw water quality and increased treatment requirements. Greater variability in water quality as a result of variable dilution potential associated with flow extremes may affect the efficacy of water treatment processes. Single-stage treatment processes will be particularly vulnerable to this.
Deeper water table pumping required
Deterioration in raw water quality and increased treatment requirements.
Lower volumes of water to be treated
Loss of supply and depressurisation of the supply system leads to greater incidence of air blockages, causing service failure
Loss of or intermittent supply from reservoirs
Increased sediment load in raw water as accumulated silt and debris is flushed out of service reservoirs and towers
Wetter winters
Fluvial, pluvial and surface water flooding
Risk of flooding of treatment works and loss of power, damage to SCADA and telemetry equipment. Direct flooding of storage tanks and raw water pipelines introducing contaminants.
Increased sediment load, turbidity and pollutants washed into water sources during flood events
Deterioration in raw water quality and increased treatment requirement. Heightened risk of siltation at intake structures and increased mobility into raw water of bound nutrients, potentially impacting treatment efficacy.
Flooding of access routes Interruption of supply chains (e.g. chemical supplies).
More intense rainfall events
Increase in heavy rainfall events Disturbance of flocculant blanket
Biological consequences Discolouration and odour problems
Fluvial, pluvial and surface water flooding
Risk of flooding of treatment works and loss of power, damage to SCADA and telemetry equipment. Direct flooding of storage tanks and raw water pipelines, introducing contaminants.
Increased sediment load, turbidity and pollutants washed into water sources during flood events
Deterioration in raw water quality and increased treatment requirement. Heightened risk of siltation at intake structures and increased mobility into raw water of bound nutrients, potentially impacting treatment efficacy.
Flooding of access routes Interruption of supply chains (e.g. chemical supplies).
Sea level rise Tidal flooding Risk of flooding of treatment works and loss of power, damage to SCADA and telemetry equipment.

IMPREX has received funding from the European Union Horizon 2020 Research and Innovation Programme under Grant agreement N° 641811
62
• there is a degradation trend of drinking water quality leading to an increase of at risk situations with regard to potential health impact, mainly during extreme meteorological events.
• water quality degradation is linked to global change (climate change but also land use evolution, deforestation, etc.) and to human activities of urban, industrial or agricultural origin. Climate change could lead to degradation in surface water quality as an indirect consequence of these activities.
• the climate change determinants affecting water quality are mainly the ambient (air) temperature and the increase of extreme hydrological events (drought and intense runoff). Soil drying-rewetting cycles and solar radiation increase may also be consid-ered
• Among water quality parameters, dissolved organic matter, micropollutants and path-ogens are susceptible to rise in concentration or number as a consequence of temper-ature increase (water, air and soil) and heavy rainfalls in temperate countries.
• Accordingly the risk of having disinfection by-products (DBPs) in drinking water (such as trihalomethanes (THMs)) might be higher, originating from natural organic matter transformation, pharmaceuticals or pesticides.
• For treatment plants, considering that all remediation actions have been made (pollu-tion source reduction, run off limitation, fertilizers and pesticides reduction manage-ment, etc.), adaptation measures must be envisaged for a better efficiency, particularly with regards to extreme events (heavy rainfalls and droughts). These measures inte-grate complementary treatment steps and process control even for small water supply systems.
• Increased flooding risk is considered a major risk to DWTP design and construction because of the serious consequences that disruption of water supply has on popula-tion. For instance, the 2007 flood of Mythe DWTP in England caused service disruption to about 340,000 customers and the reconstruction works cost Severn Trent Water £29,6 million (Defra & EA 2010). Another example is the tropical storm Lee that impact-ed United Water Pennsylvania in 2011. In Europe the update of the flood maps (Di-rective 2007/60/EC) currently consider climate change scenarios and the possible ex-tension of the flood plains.
• Also, the plant production capacity should be adapted to future water demand (seasonal peak and trend) and future water availability. During droughts abstracting capabilities are reduced but it is during that period that the consumption is the highest. There is a large spread in the climate change projection thus generating high variability in the study of future water availability and water balance (e.g. previous study performed by Versini and al (2016) show that annual water availability in the Llobregat basin will range between 147 hm3/year to 274 hm3/year for the period 2071-2100). Robust and flexible decision making processes are necessary to adapt to climate change impacts.
Conclusions regarding the ongoing work in WP10
• The long-term changes on water quality are linked to climate change but also interac-tions with land use changes and human activities. An holistic approach is therefore needed.
• Changes in air temperature, drought, and intense rainfall characteristics are the climate change drivers most affecting water quality. Climate change predictions for those pa-rameters could therefore provide a first indications on the areas that would be most af-fected.

63
Deliverable n° 10.1
• Long term studies considering trends and climate change impacts on water quality are necessary to identify the most appropriate remediation actions. These actions would maintain the raw water quality under acceptable level and identify the structural and operational changes to be made in the treatment plant.

IMPREX has received funding from the European Union Horizon 2020 Research and Innovation Programme under Grant agreement N° 641811
64
Annex 4 Climate Change impact on Drinking Water Networks Water distribution networks have a very long working life. They therefore have to be able to adapt to a changing climate in the short, medium and long terms. Network rehabilitation rates are generally quite low which provide only a limited scope for large improvements or adaptation of the asset base. For those reasons it is important to monitor and understand the performance of our networks in order to assess how they could be affected by the climate change. This would then inform a long term network strategy that would not only consider the asset, but also the system.
Climate variable Impact of Climate Change Consequences on Networks
Increase of temperature
Increased disinfectant consumption & bacterial activity
Increased bacterial regrowth leading to biofilm formation, customer illness, colour, taste and odours.
Increased customer demand Higher peak flow leading to higher head losses, longer pumping time
Greater changes in network pressure, greater solicitation of ancillaries (PRV), water hammer risks
Accelerated ageing of plastic pipes As the temperature increases PE life time reduces causing premature failure of the pipe under certain condition of disinfectant level and quality of the pipe material.
Rainfall More severe drying/wetting freeze/thaw cycles
These cycles cause the soil to shrink and expand as a result of changes in temperature or soil moisture increasing the risk of leakage or burst frequency.
Flooding Flooding of asset such as pumping station leading to the failure of the asset and the contamination of the water supplied
Land slides causing catastrophic failure of strategic mains.
Sea level rise Tidal flooding Flooding of asset such as pumping station leading to the failure of the asset and the contamination of the water supplied
Saline intrusion increasing the soil conductivity leading to an increased corrosion rate of the underground assets.
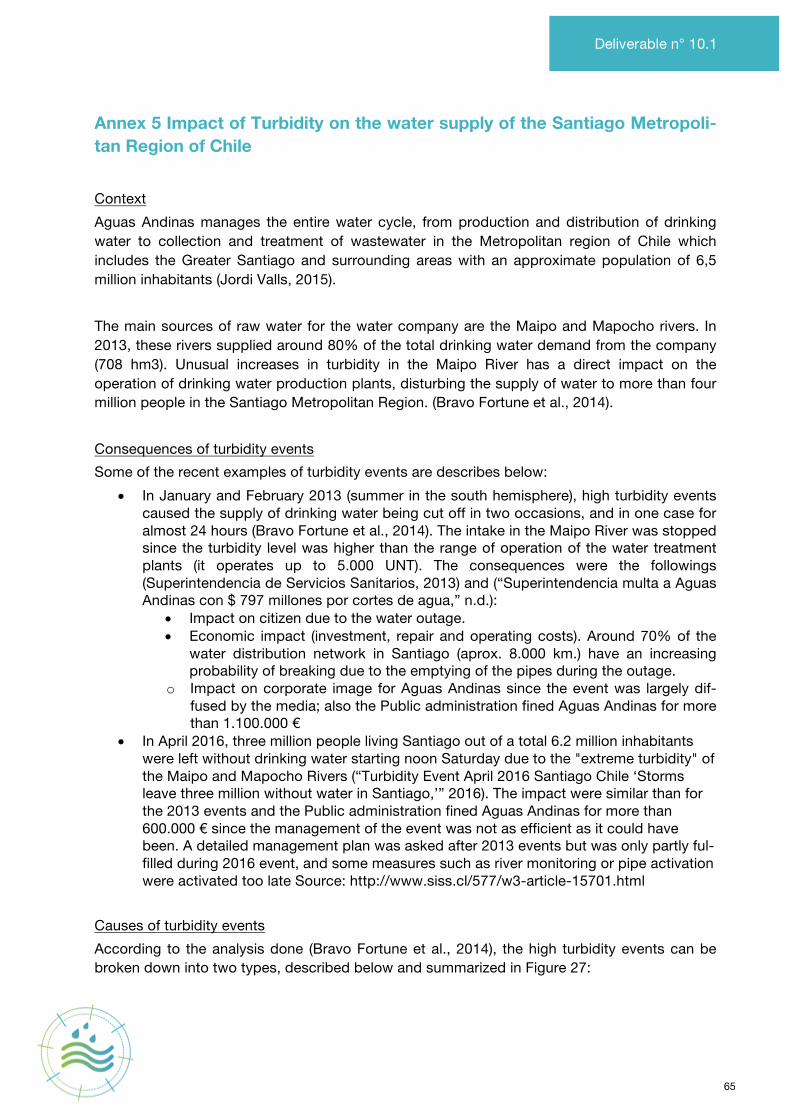
65
Deliverable n° 10.1
Annex 5 Impact of Turbidity on the water supply of the Santiago Metropoli-tan Region of Chile Context Aguas Andinas manages the entire water cycle, from production and distribution of drinking water to collection and treatment of wastewater in the Metropolitan region of Chile which includes the Greater Santiago and surrounding areas with an approximate population of 6,5 million inhabitants (Jordi Valls, 2015). The main sources of raw water for the water company are the Maipo and Mapocho rivers. In 2013, these rivers supplied around 80% of the total drinking water demand from the company (708 hm3). Unusual increases in turbidity in the Maipo River has a direct impact on the operation of drinking water production plants, disturbing the supply of water to more than four million people in the Santiago Metropolitan Region. (Bravo Fortune et al., 2014). Consequences of turbidity events Some of the recent examples of turbidity events are describes below:
• In January and February 2013 (summer in the south hemisphere), high turbidity events caused the supply of drinking water being cut off in two occasions, and in one case for almost 24 hours (Bravo Fortune et al., 2014). The intake in the Maipo River was stopped since the turbidity level was higher than the range of operation of the water treatment plants (it operates up to 5.000 UNT). The consequences were the followings (Superintendencia de Servicios Sanitarios, 2013) and (“Superintendencia multa a Aguas Andinas con $ 797 millones por cortes de agua,” n.d.):
• Impact on citizen due to the water outage. • Economic impact (investment, repair and operating costs). Around 70% of the
water distribution network in Santiago (aprox. 8.000 km.) have an increasing probability of breaking due to the emptying of the pipes during the outage.
o Impact on corporate image for Aguas Andinas since the event was largely dif-fused by the media; also the Public administration fined Aguas Andinas for more than 1.100.000 €
• In April 2016, three million people living Santiago out of a total 6.2 million inhabitants were left without drinking water starting noon Saturday due to the "extreme turbidity" of the Maipo and Mapocho Rivers (“Turbidity Event April 2016 Santiago Chile ‘Storms leave three million without water in Santiago,’” 2016). The impact were similar than for the 2013 events and the Public administration fined Aguas Andinas for more than 600.000 € since the management of the event was not as efficient as it could have been. A detailed management plan was asked after 2013 events but was only partly ful-filled during 2016 event, and some measures such as river monitoring or pipe activation were activated too late Source: http://www.siss.cl/577/w3-article-15701.html
Causes of turbidity events According to the analysis done (Bravo Fortune et al., 2014), the high turbidity events can be broken down into two types, described below and summarized in Figure 27:

IMPREX has received funding from the European Union Horizon 2020 Research and Innovation Programme under Grant agreement N° 641811
66
1. Heat-related events: caused by an increase in air temperature, which speeds up melt-ing in the basin and the transportation of sediment due to this mechanism, with a good linear relationship between flow flow rate and turbidity levels. These events generate a moderate increase in turbidity levels (daily anomaly up to 400ppm).
2. Rainfall-related events: these are characterized by the occurrence of convective storms over the higher parts of the mountains, with intense precipitations of short duration and a small spatial scale, causing erosion and landslide, thereby increasing turbidity in the river. In these cases, the localized nature of the precipitation would not be enough to give rise to a marked increase in flow rate, so there is no correlation between flow rate and turbidity levels. These events generate an extreme increase in turbidity levels (daily anomaly up to 12000ppm) which cause the cut off the water production.
Figure 27 Cause of high turbidity events in the Maipo River
Forecast of turbidity events The detection, simulation and forecast of high turbidity events was studied in AQUAPAPER, 2014. :
• Since rainfall-related events are associated with local convective activity, the current rain gauge network cannot detect much of this precipitation.
• One alternative would be to make use of WWLLN (World Wide Lightning Location Net-work) records to detect activity in the area studied.
• Also it could be useful to consider wind’s zonal aspect (east-west) to improve forecasts of convective precipitation (as it is the wind from Argentina that carries the damp air capable of climbing the Andes and feeding these storms).
Mass wasting mechanisms such as landslide that would cause extreme turbidity events would depend on
• conditioning factors such as the geomorphology of the area (slope, drainage channel), geology or vegetation. A methodology was applied in a case study to established a “ susceptibility index (SI)” based on the sum of the weighted scores for different condi-tioning factors.
• triggering factors such as precipitation intensity and accumulated precipitation, that modify the pre-existing stability of the land and help set off the events.

67
Deliverable n° 10.1
• The use of the MUSLE (Modified Universal Soil Loss Equation) is recommended to link conditioning factors and the trigger factors.
Conclusions regarding the ongoing work in WP10
• High turbidity events can have huge economic and social consequences. • High turbidity events can occurred due to different processes, that could be triggered
by intense precipitation or snow melting. • While high rainfall events associated with local convective activity are difficult to moni-
tor in mountainous regions, meteorological drivers (e.g. wind’s zonal aspect in the case of Santiago region) can help in alerting about these events.
• Forecast would help in preparing the water supply system to be more resilient to turbid-ity events and take pro-active decision.

IMPREX has received funding from the European Union Horizon 2020 Research and Innovation Programme under Grant agreement N° 641811
68
Annex 6 Impact of Turbidity on the water supply of Lima in Peru The water supply of Lima, Peru, has been affected by the high turbidity level of the Rímac river in January and March 2017. As a consequence of the temporary closure of La Atarjea treatment plant, the water supply has been affected in 26 districts
• The excessive turbidity of the Rimac water was caused by landslides (called "huayco” in Peru) driven by important rainfalls.. Important landslide were registred, bringing with them stones, logs, mud and other solid residues, that could damage the infrastructure of capture and treatment of drinking water of the plants La Atarjea. La Atarjea's potable water treatment plant (PTAP) can accept turbidity levels of up to 15,000 NTU.
• During those event, the Rímac river flow has presented more than 110,000 NTU, which makes it impossible to potabilize. If that raw water with excessive turbidity enters La Atarjea its filter system would collapse and the damage would be more serious, since it would be left to Lima without drinking water for weeks or months.
• The current demand of the population in Lima is 25m3 per second and La Atarjea is responsible for potable water up to 18 m3 / s, hence its importance in this critical scenario. In that sense, Sedapal as part of its contingency measures has activated 270 wells that extract water from the subsoil and that in practice are our reserves at the time complex. However, only up to 7 m3 / s can be extracted. Also 25 water tanker truck have be used to supply the hospitals.

69
Deliverable n° 10.1
Annex 7 Survey to plant operators In order to know the impacts of changes in raw water quality and the needs of forecast for plant operators, a survey was sent to several DWTP in Spain. This complement the information gathered in the two case studies of WP 10, Llobregat basin and Segura basin, both located on the Mediterranean coast. The following information was requested in the survey:
- Name of the company - Contact person - Name of DWTP - Location - Volume of treated water at the DWTP - Climatic conditions affecting water quality parameters - Time interval in which the climatic condition affect the quality parameter - Treatment used in the plant to treat quality parameter - Cost of the treatment - Preferred forecast periods for the different quality parameters affected by climatic
conditions and potential benefits. Weather forecasts are 1-12h (time weather forecast), 12-24h (daily weather forecast), 24h-7days (weekly weather forecast), 1month-3months (seasonal weather forecast), 30years and over (climate change forecast)
- We obtained responses from 21 DWTPs, 2 of which are located in the south, 4 on the Mediterranean coast and 15 in the central and northern area of Spain. The responses of the survey showed that one DWTP does not comment any relevant impact of extreme climatic conditions on the water quality while 20 DWTPs were affected by extreme weather and climatic events (specifically heavy rainfalls, droughts and heat waves). None of these 20 DWTPs were affected by cold waves. A total of 56 impacts of extreme weather and climatic events on water quality parameters were mentioned on the survey. Table 1 shows the impact of different extreme weather conditions on water quality parameters. It is observed that heavy rainfall is the climatic event that most affects water quality parameters, with a 55,4% of the impacts mentioned, being turbidity the water quality parameter most affected by heavy rainfalls, followed by aluminium suspension, iron & manganese, microbiological parameters, pH and colour. Then droughts will be the second event that most affects water quality parameters, with a 39,3% of the impacts mentioned, being conductivity the water quality parameter most affected by droughts, followed by iron & manganese, organic matter, pH, odour, nitrates, taste, sulphate and turbidity. Finally, heat wave is the third climatic event impacting on quality parameters, with only a 5,4% of the impacts mentioned, being odour the water quality parameter most affected by heat waves and followed by taste. Concluding also that 76,2% of DWTPs were impacted by heavy rainfalls, 71,4% of DWTPs were impacted by droughts and 9,5% of DWTPs were impacted heat waves.

IMPREX has received funding from the European Union Horizon 2020 Research and Innovation Programme under Grant agreement N° 641811
70
Table 1. Impact of extreme weather conditions on water quality parameters
Extremeweatherandclimaticeventsanalyzed(that
produceoneormoreimpactsonwaterqualityparameters)
Numberofimpactsofextremeweatherand
climateevents
mentioned
%ofimpactsofthiseventoverthetotalofimpacts
mentionedonwaterquality
parameters
Numberofwatersupply
companiesaffectedbyclimateevent
Numberof
DWTPsaffected
byclimateevent
%ofDWTPsimpacted (over21DWTPs)
Waterqualityparametersimpacted
(Numberoftimetheparametershasbeencitedoveratotalof56impacts
cited)
Heavyrainfall 31 55,4% 10 16 76,2%
Turbidity(15),Organicmatter(6),Aluminumsuspension(3),Ironand
manganese(3),Microbiologicalparameters
(2),pH(1),Color(1)
Drought 22 39,3% 10 15 71,4%
Conductivity(5),Ironandmanganese(5),Organic
matter(4),pH(2),Odor(2),Nitrates(1),Taste(1),
Sulphate(1),Turbidity(1)
Heatwave 3 5,4% 2 2 9,5% Odor(2),Taste(1)
Table 2 shows water quality parameters impacted and necessary treatments carried out on the water quality parameters affected by climatic events. Turbidity is the water quality parameter most affected by climatic events with a 28,6%, followed by organic matter with a 17,9%, iron & manganese with a 14,3%, conductivity with a 8,9%, odour with a 7,1%, aluminium suspension and pH with a 5,4%, microbiological parameters and taste with a 3,6%, colour, nitrates and sulphates with a 1’8%. In most of water quality parameters the most used treatment is the increase of reagents.
Table 2. Water quality parameters impacted and treatments carried out on the water quality parameters
Waterqualityparametersimpacted(whichdetermine
whattypeoftreatmentshavetobecarriedoutat
DWTP)
Numberoftimesthatthewaterquality
parametersis
mentioned
%oftimesthequality
parameteris
mentioned(overthetotalof56
responses)
Numberofwatersupply
companiesaffectedbythequality
parameter
NumberofDWTPsaffectedbythequality
parameter
%oftheDWTPsimpacted(over21DWTPs)
Necessarytreatment(numberoftimethetreatmenthasbeencitedoveratotalof56
impactscited)

71
Deliverable n° 10.1
Turbidity 16 28,6% 10 15 71,4%
Increaseofreagents(5),Increaseofreagents&Increasefilterwashing
frequency(9),Increaseofreagents,increasefilter
washingfrequencyandstopDWTP(1),Increaseofreagents,increasefilterwashingfrequencyand
sendrawwatertosewagesystemuntiltheepisode
ends(1)
Organicmatter 10 17,9% 6 9 42,9%
Increaseofreagents(7),Increaseofreagents&activatedcarbondosage(1),Increaseofreagents&washfilters(1),Increaseofreagents&stopDWTPif
thereisnotwaterdemand(1)
Iron&manganese 8 14,3% 3 4 19,0%Increaseofreagents(6),
Increaseofreagents&startozonation(2)
Conductivity 5 8,9% 3 5 23,8% Nothingcanbedone(5)
Odour 4 7,1% 4 4 19,0%
Activatedcarbondosage(2),Dilutewith
groundwatertoavoidreachingcriticalvalue(1),Increaseofreagents&Increasefilterwashing
frequency(1)
Aluminiumsuspension
3 5,4% 1 1 4,8%
Increasefilterwashingfrequency(2),Increase
filterwashingfrequency&stopDWTPifthereisnot
waterdemand(1)

IMPREX has received funding from the European Union Horizon 2020 Research and Innovation Programme under Grant agreement N° 641811
72
pH 3 5,4% 3 3 14,3%Increaseofreagents(2),UseofpHcorrector(1)
Microbiologicalparameters
2 3,6% 2 2 9,5% Increaseofreagents(2)
Taste 2 3,6% 2 2 9,5%
Activatedcarbondosage(1),Increaseofreagents&Increasefilterwashing
frequency(1)
Colour 1 1,8% 1 1 4,8% Increaseofreagents(1)
Nitrates 1 1,8% 1 1 4,8%Dilutewithsurfacewatertoavoidreachingcriticalvalue
(1)
Sulphates 1 1,8% 1 1 4,8% Nothingcanbedone(1)
Table 3 represents the most useful forecasts for each climatic event: • For the climactic event heavy rainfall the most useful weather forecast would be a hourly weather forecast (1-12h), followed of a daily weather forecast (12-24h) and finally of a weekly weather forecast (24h-7d). The short-term prediction of hours would be the most useful because DWTPs would capture more water in the hours before the storm, to produce more and be able to close during the time interval of heavy rainfalls. Another alternative would also be to catch the minimum amount of water during the rainy season so that the water treatment process would be as efficient as possible; preventing clogging of sand and carbon filters and dosing the minimum amount of reagents to avoid the formation of disinfection by-products, as for example are the trihalomethanes. • For the climatic event drought the most useful would be a daily weather forecast, followed of a weekly forecast and finally of a seasonal weather forecast (1-3m). During droughts there are restrictions on the catchment of surface water, so operators of DWTPs need to know if they need to collect water from other sources. A daily prediction will help them to produce more water during those hours before water restrictions. For the climatic event heat wave a daily forecast would be the most useful, followed of a weekly forecast and finally of a seasonal weather forecast. During heat waves the demand of water by the population increases considerably, so DWTPs will treat more water during the hours before the heat wave, since it is necessary to maintain a minimum level in the water distribution tanks so that the population does not run out of water

73
Deliverable n° 10.1
Table 3. Most useful weather/climate forecasts for each climatic event
Extreme weatherand climatic eventsanalysed
FORECAST PERIOD – firstpriority (number of timetheforecastperiodhasbeencitedovertotalcited)
FORECASTPERIOD– secondpriority (number of timetheforecastperiodhasbeencitedovertotalcited)
FORECAST PERIOD – thirdpriority (numberof time theforecast period has beencitedovertotalcited)
Heavyrainfall1-12h(22),12-24h(6),24h-
7d(3)12-24h(18),24h-7d(9) 24h-7d(15),1-3m(6)
Drought1-12h(1),12-24h(12),24h-7d(2),1-3m(6),30years
andover(1)
12-24h(1),24h-7d(11),1-3m(4)
1-3m(11),30yearsandover(1)
Heatwave12-24h(2),30yearsand
over(1)24h-7d(2) 1-3m(2)
Table 4 shows the type of proactive actions that could be performed or improved based on the water quality forecast that might be provided for different periods and parameters. The percentage of each of the responses has been calculated over the total of 56 responses. As shown in the table, the highest response rates was observed in the quality parameter turbidity, with treatment (increased reagents); where for a forecast period of 12-24h there is a response rate of 10.5% and for a forecast period of 1-12h there is a response rate of 8,9%. Percentages of 3.5% were observed in quality parameters as odour, organic matter, iron & manganese, aluminium suspension and conductivity for more short-term predictions (1-12h and 12-24h). And lower response rates (1,7%) have been observed particularly in the longer term predictions (24h-7d, 1-3months, 30 years and over).

IMPREX has received funding from the European Union Horizon 2020 Research and Innovation Programme under Grant agreement N° 641811
74
Table 4. Percentage of responses of the most useful predictions for each treatment and quality parameter
Forecastperiod Qualityparameter Proactiveactions%ofresponses
(over56responses)
1-12h
Aluminium suspension
Washfilters/Decanterspurge 1,7
Washfilters 3,5
Color Increaseofreagents 1,7
Iron & manganese Increaseofreagents 7,1
Organic matter
Increaseofreagents 3,5
Increaseofreagents/Activatedcarbondosage
3,5
Increaseofreagents/Checkfilters 3,5
Odour Activatedcarbondosage 3,5
Turbidity
Controlturbidityofrawwater 1,7
Increaseofreagents/Washfilters/Decanterspurge
5,3
Increaseofreagents 8,9
12-24h
Microbiological parameters Unspecified 1,7
Organicmatter Increaseofreagents 1,7
pH Unspecified 1,7
Taste Activatedcarbondosage 1,7
Conductivity
Operationalpracticesonthecatchment
1,7
Evaluatethemaximumconductivityonthecatchment
3,5
Operationalpracticesonthecatchment/Notifythehealthauthority
3,5
Odour Activatedcarbondosage 3,5
Iron & manganese Increaseofreagents 5,3
Turbidity Increaseofreagents 10,7
24h-7d
Organicmatter Increaseofreagents 1,7
Microbiological parameters Unspecified 1,7

75
Deliverable n° 10.1
pH Increaseofreagents 1,7
Unspecified 1,7
Turbidity Increaseofreagents 1,7
1-3months
Iron & manganese Increaseofreagents 1,7
Organicmatter
Increaseofreagents/Activatedcarbonchange
1,7
Checkfilters 1,7
OdourIncreaseofreagents/Activatedcarbon
change1,7
TasteIncreaseofreagents/Activatedcarbon
change1,7
Sulphates Knowledgeofdefaults 1,7
30yearsandoverNitrates
Operationalpracticesonthecatchment
1,7
OdourOperationalpracticesonthe
catchment1,7
Conclusions from the survey For most of the water systems studied, it seems that the sudden increase of turbidity due to heavy rainfall events is the main challenge for the treatment plant managers. Forecast of river water quality for the next hours and days are the most required to operate the treatment plant efficiently but seasonal forecast are also mentioned for all the climatic event considered. Since the survey gather the views of the treatment plant managers (responsible of producing “tap water” with the current infrastructures), the results concern operational issues with a short-term perspective. The need of long-term information is more obvious for planning issues (design of treatment plant) but has not been gathered in this survey. Depending on the infrastructure's lifespan, the speed and magnitude of water quality changes, this information could be more or less relevant for water plant operators. In general, Ooperation and planning will both benefit from the anticipated information provided by the water quality forecast with a daily to decadal forecast period. Forecast of heavy rainfall and erosion of river bed and basin slopes is one of the priority to be covered in the project. Adequate hydrological models (e.g. considering MUSLE equation) or statistical model would be necessary to perform those simulations. Impact of cold waves are not significant and would not be studied in the project.

IMPREX has received funding from the European Union Horizon 2020 Research and Innovation Programme under Grant agreement N° 641811
76
Impact of heat waves are also linked to change in water demand so a combined approach would be required (forecast of water quality and water demand).

77
Deliverable n° 10.1
Annex 8 Managing water quality under drought conditions in the Llobregat River Basin Summary: In this study one by Andrea Momblanch (Momblanch et al., 2015), a water quality model (based on AQUATOOL) is developed to simulate pollutants concentrations in the Llobregat River Basin according to the water quality of the runoff and the water demand discharges (water allocations are considered via storage, transport and consumption elements). This allows the analysis of the effects of water management scenarios on water quality variables, and especially during drought conditions. A model has been calibrated to simulate the drought that occurred from 2004 to 2008 taking into account the management rule applied during this period (reservoir release, WWTP performance, flow connections), then different alternative are tested. In these scenarios no climate data have been directly considered since the scenarios simulated use as input historical monthly inflows. Modelling tool(s): Two coordinated models are used to integrate aspects of water resource allocation (SIMGES model) and water quality assessment (GESCAL model). These two modules are part of the AQUATOOL decision support system shell (Andreu et al., 1996) SIMGES (Andreu et al., 2007). GESCAL (Paredes-Arquiola et al., 2010) is a water quality simulation model that allows analysis on water quality evolution in rivers, reservoirs and entire water resource systems according to the water quality of the runoff and the demand discharges. GESCAL simulates temperature, biochemical oxygen demand (BOD), dissolved oxygen, organic nitrogen, ammonium, nitrates, organic phosphorous, phosphates, Chlorophyll-a, toxins (e.g., heavy metals and organic compounds) and arbitrary constituents. One-dimensional and pseudo-stationary conditions are assumed for water quality in rivers. In reservoirs and lakes, water quality can be represented as a continuously stirred tank or as a two-layer model that includes the epilimnion and hypolimnion. Further details on the formulation of the model can be found in Paredes- Arquiola et al. (2010). Scenario simulated: During the drought period, natural streamflows decreased and the flows discharged by the WWTPs represented a larger proportion of the total river flows. These changes caused a decrease in the dilution capacity and subsequent water quality effects. Different management options have been tested for improving water quantity and quality management. The first approach is to establish minimum flows downstream of the heading reservoirs. This action measure considered in isolation would not entirely solve the water quality problems in the river basin because the average ammonium concentrations in the lower reaches of the Llobregat River would remain at or above 1 mgNH4 +/L. Moreover, the reliability in the supply to the irrigation demands considerably worsens with this approach, which further aggravates the problem. The second scenario also focused on water management because it suggested a diversion of the Anoia River to the Llobregat River. In this case, the results indicated that water quality would be reduced in the lower reaches of the Llobregat River by not diverting the Anoia River; however, the reduction was not critical. Simultaneously, the increase in available water resources would not provide the expected reduction in the supply deficits to address water scarcity problems. The last action measure was only focused on long-term water quality improvements by improving different WWTPs (the main WWTP or all the WWTPs). According to the results, this type of measure is worth pursuing because it is

IMPREX has received funding from the European Union Horizon 2020 Research and Innovation Programme under Grant agreement N° 641811
78
focused on the source of the problem. By reducing the nutrient concentrations in the lower reaches of the basin, the drinking treatment plant can apply easier and cheaper treatments while simultaneously improving the environmental quality of the river. Conclusions regarding the ongoing work in WP10 While empirical approaches are used to describe the impact of droughts on water quality, mechanistic models can be used to predict these impacts. The potential of these tools can be widened by applying jointly with water resource management models. A coupled approach water quality / water management model appears necessary to simulate and anticipate drought impacts and develop preventive actions at the river basin scale. This is especially necessary in Mediterranean basins, with limited natural flow in summer and therefore highly impacted by water management decisions (minimum reservoir release, WWTP performance, flow connections in the system). Details Water quality problems are often associated with flow fluctuations in rivers (Stow and Borsuk,2003). According to Tower et al (2010), there is a need to fully couple climate, streamflow, and water quality assessment components to ensure a complete range of potentials effects in order to planning effective strategies In the study released by Momblanch et al. (2015), integrated two mechanistic models for water management and water quality to evaluate the evolution of pollutants in river systems. The mechanistic models are based on physical and chemical principles are assumed to have some predictive capabilities (Warfvinge, 1995). AQUATOOL is a geo-referenced database that can be applied to nearly any river basin or water resource system type. The database provides common interface, data and result management tools for the different modules. The modules used in this study are SIMGES (Andreu et al. 2007) and GESCAL (Paredes-Arquiloa et al. 2010). SIMGES is a water management simulation model that optimises monthly water resource allocations at the river basin scale. This module solves a conservative flow network that contains storage, transport, diverting consumption and return elements. These features are based on the reality of the modelled system and must be defined and calibrated by the user. For each time steps of the simulation, the flow network algorithm determines the flows in the system while trying to satisfy multiple objectives as deficit minimisation, maximum adaptation to the reservoir target volume curves and hydropower production objetives. GESCAL (Paredes-Arquiola et al. 2010) is a water simulation model that allows analysis on water quality evolution in rivers, reservoirs and entire water resource systems according to the water quality of runoff and the demand discharges. GESCAL simulates temperature, biochemical oxygen demand (BOD), dissolved oxygen, organic phosphorous, phosphates, Chlorophyll-a, toxins and arbitrary constituents. One-dimensional and pseudo-stationary conditions are assumed for water quality in rivers. In reservoirs and lakes, water quality can be represented as a continuously stirred tank or as a two-layer model that includes the epilimnion and hypolimnion. Further details on the formulation of the model can be found in Paredes- Arquiola et al. (2010). The methodology used was based on the presented tools to analyse different alternatives for coping with the drought situation in the LRB. The method consists of three consecutive steps

79
Deliverable n° 10.1
(see Fig. 2). First, the water management and water quality models were calibrated and validated. It was crucial to include the analysed drought period in the calibration and validation data to ensure that the models adequately represent the performance of the system in the specific situation. In STEP 2, the action measures were designed and combined to generate reasonable and realistic scenarios that are in line with the identified casuistry. The measures that can be simulated are related to either water quantity or water quality. Finally, STEP 3 encompasses the analysis of the target variables for the action measures or sequence of action measures that best facilitate the mitigation of drought effects.
The main objective of this study was to analyse the effects of the drought period, October 2004 to September 2008, on the water quality of the Llobregat River Basin (LRB). The LRB is located in northeastern Spain and flows into the Mediterranean Sea. The basin covers 4957 km2 and has a mean annual precipitation of 704 mm, which produces a mean annual inflow of 694 Mm3 in unpaired conditions.

IMPREX has received funding from the European Union Horizon 2020 Research and Innovation Programme under Grant agreement N° 641811
80
Several highly populated cities with important industrial activities are located throughout the river basin. Consequently, the majority of water resources are devoted to urban supplies, which generate large amounts of wastewater are poured into the system. It also exists agricultural production; these activities produce diffuse pollution that alters the water quality in these areas. The water quality model was implemented to determine the evolution of BOD, dissolved oxygen, organic nitrogen, ammonium, nitrate, conductivity, and phosphate concentrations. The processes considered included degradation and sedimentation of BOD, aeration and sediment oxygen demand, degradation and sedimentation of organic nitrogen, nitrification of ammonium, denitrification of nitrates, and sedimentation and/or degradation of phosphates. The calibration period encompassed 4 years, while the validation period covered 2 years. Both phases included part of the drought period from 2004 to 2008. The validation of both models also produced acceptable results, with correlation coefficients ranging from 0.76 to 0.95 for the water allocation model and from 0.64 to 0.88 for the water quality model. Then the integrated model for simulating water management and water quality in the LRB was ready for applications. Finally, the results showed that the water quality of the LRB is affected by droughts. To minimise these effects, a scenario analysis was conducted using the integrated model for water management and water quality; different action measures for alleviating the drought effects were simulated: Reservoirs management: During the drought period, natural streamflows decreased and the flows discharged by the Waste Water Treatment Plant (WWTPs) represented a larger proportion of the total river flows. These changes caused a decrease in the dilution capacity and subsequentwater quality effects. There are several options for increasing the proportion of natural flows in a river.

81
Deliverable n° 10.1
Simulations were performed by changing the flows released from the reservoirs from 0.5 to 5 Mm3/month in increments of 0.5Mm3/month. Finally, the results demonstrated that forcing minimum flows downstream of the heading reservoirs is a valid approach for alleviating serious short-term water quality situations. However, it is not a reasonable permanent strategy because of how the supply deficits increases, which primarily affects the agricultural demands. Non diversion of the Anoia River flows: Increasing the available water resources in the LRB addresses the water scarcity problem caused by the drought. In the short term, resources could increase by diverting the flow of the Anoia River to the Llobregat River. However, given the poor water quality of this tributary, it was expected that this action measure might act to decrease might act decreasing the water quality. Finally, the last affirmation was confirmed, as the results showed a very slight variation in the pollutant concentrations. Improvements in wastewater treatments: As the main problem in the LRB is the water quality in the middle to lower reaches, where the intakes of the largest water purification plants are located, they defined a long-term measure that focuses on improving the WWTPs. In this scenario, many simulations were performed by considering individual improvements to the WWTPs. Another simulation, which we called the “optimal” scenario, assumed the simultaneous improvement of all WWTPs. According to the results, this type of measure is worth pursuing because it was focused on the source of the problem. By reducing the nutrient concentrations in the lower reaches of the LRB, the WPPs can apply easier and cheaper treatments while simultaneously improving the environmental quality of the river. In conclusion, the presented study provided an analysis of the pressures that affected the proper operation of the LRB under the drought that occurred from 2004 to 2008. Water scarcity and reduced water quality were part of the main human supply and environmental problems. Several measures were examined as possible short- or long-term solutions, including water management and water quality alternatives. The results showed that water management has a large effect on the water quality state, which in turn determines the suitability of water for the diverse uses in the river basin. This finding highlights the relevance of incorporating water quality into the planning and management of water resource systems.
Annex 9 Manzanares case: Another example of the use of the water quality models in order to simulate different
management scenarios in a water resources system is the study published by Paredes, Andreu,
& Solera (2010). In which the authors evaluated the effects of improvements in wastewater on
the water quality in the Manzanares river.
The increment of water use has consequences for the reduction of river flows, causing a lower
dilution capacity and a minor self-depuration capacity. The effluents of WWTPs downstream of
the Manzanares River, which represented 90% of the flow in the middle and lower parts of the
river, are the primary sources of water pollution.
In total, eight main WWTPs were discharged into the Manzanares River. During the year 2006,
the treatment facilities improved, as did the concentrations of the effluents. The constituent that

IMPREX has received funding from the European Union Horizon 2020 Research and Innovation Programme under Grant agreement N° 641811
82
improved the most was phosphorous, because all of the WWTPs reduced effluent
concentrations to less than 1 mg/l phosphorous.
Currently, water quality problems are related to low dissolved oxygen concentrations, a high
ammonia content in the water, and conductivity that is three or four times greater than natural
conditions. Furthermore, the contribution of nutrients from this area constitutes the better part of
the nitrogen and phosphorous pollution source, causing eutrophication problems in the
downstream reservoirs.
To achieve the highest ecological status and to evaluate the effectiveness of the program of
measures, a water quality model has been developed for the Manzanares River. This program
used was called GESCAL, only a section of the Manzanares River Basin was modelled in this
case. Constituents considered included conductivity, phosphorous, dissolved oxygen, organic
matter, and different forms of nitrogen.The tools and the methodology used was similar to the
Llobregat case. The calibration and validation was implemented with data from the period 2001-
2008.
Results of this study indicated that efforts at removing nutrients should be concentrated at the
three biggest WWTPs, and that nutrient removal in the other plants is not as necessary.
Moreover, these treatments will not be sufficient to maintain fish habitat conditions at all times.
Thus, it will be necessary to introduce additional measures to improve the dissolved oxygen
concentrations in the river. Among these measures, two possible solutions have been tested:
- The first measure is the increment of dissolved oxygen concentrations by means
of diffusers located in the low section of the river. The model allowed the mass of the ox-
ygen necessary to be assessed after the nutrients were removed in the three biggest
WWTPs.
- The second additional measure is to increase natural flow of the river by releas-
ing more water. The results of the model show that this measure would improve water
quality in terms of all of the constituents, but would also put the reliability of the Madrid
city water supply at risk.
The two models developed in both case studies, have been proved to be a valuables tools for
analysing water quality processes in the rivers and for assessing the efficiency of different
measures for improving this issue, constituting a for questions related to water quality.
In addition, it has shown the negative effects of the rivers flows fluctuations on the water quality
parameters. In both cases, the increment of the flows rates will be a possibility to improve the
ecologic state of the river ecosystem.

83
Deliverable n° 10.1
Annex 10 Turia case: Drought and water shortage effects are normally exacerbated due to collateral impacts on water
quality, since low streamflow affects water quality in rivers and water uses depend on it. One of
the most common problems during drought conditions is maintaining a good water quality while
securing the water supply to demands.
The droughts are common in the Mediterranean basins, these periods put under pressure the
Waters Resources Systems, an example of the challenge of this situation is the River Turia
case. The study conducted by Paredes-Arquiola et al.( 2016), the authors analyses the case of
the Ruria River Water Resources System in Eastern Spain during a droughts period. The
methodology and the tools employed was similar than the Llobregat River case and the
Manzanares River case).
The main water demands in the Turia System are agrarian and urban. The basin has different
problems related with water quantity and quality. One of the main problems is the allocation of
water among agrarian demands during drought periods. Therefore, reductions in the water
supplies have to be applied. Under this consideration, flows are lower because management
tries to keep water in the reservoirs and consequently an increased concentration of pollutants
is measured in the river.
In order to define possible solutions for the above-mentioned problem, the authors have
developed an integrated model for simulating water management and water quality in the Turia
River Basin to propose solutions for water quality problems under water scarcity.
The water quality model was developed with the Decision Support System Shell (DSSS)
AQUATOOL (Andreu et al., 1996). AQUATOOL comprises several modules. Firstly, the
SIMGES module (Andreu et al., 1996) allows the evaluation on water resources allocation and
secondly, the GESCAL module (Paredes-Arquiola et al., 2010) allows the assessment of water
quality.
Finally, the integral model allows exploring integral solutions taking into account water quantit
and quality aspects. Finally as the Llobregat case and Manzanares case, the obtained results
had demonstrated the efficacy of applying environmental flows as a measure to reduce
concentration of water pollutants during drought conditions. According to the results during
drought conditions, an increase in river flow may help to improve the water quality.
Other alternatives were simulated, as the improvement of specific treatments in WWTPs.
However, even in the optimal scenarios, an increase of water releases from the reservoirs is
necessary to reduce pathogens in the Valencia City water intake.

IMPREX has received funding from the European Union Horizon 2020 Research and Innovation Programme under Grant agreement N° 641811
84
Annex 11 Details on the climate data to be used
ECMWF ensemble re-forecast 1-15 days
EFAS driven by ECMWF model
Observation used as EFAS input
Parameters 2m Temperature, Total precipitation
Runoff, river flow Precipitation, temperature
Ensemble 10 members 51-members -
Forecast period 1-15 days 1-10 days -
Forecast time Mondays and Thursdays
Mondays and Thursdays (?)
-
Temporal resolution
6 hours 6 hours (?) 6 hours (?)
Spatial resolution 22km 5km (EFAS input)
5km 5km
Availability Re-forecast: last 20 years, with 6 hours resolution (daily for type EFAS input) Forecast mode: (payment)
Hindcast: from September 2012, daily data Forecast mode: (payment)
Daily value
ECMWF 1-15 days – total precipitation

85
Deliverable n° 10.1
EFAS driven by ECMWF model - Accumulated rainfall [mm] over the entire forecast range (10
days) of the deterministic ECMWF forecast.

IMPREX has received funding from the European Union Horizon 2020 Research and Innovation Programme under Grant agreement N° 641811
86
Annex 12 Examples of statistical models use to forecast turbidity
Purpose Methodology Results
Forecast of turbidity, suspended solids, conductivity. Johor River Basin (Malaysia)
Comparison of linear regression models (LRM), multilayer perceptron neural networks and radial basis function neural networks (RBF-NN)
The results showed that the use of neural networks and more specifically RBF-NN models can describe the behavior of water quality parameters more accurately than linear regression models. In addition, we observed that the RBF finds a solution faster than the MLP and is the most accurate and most reliable tool in terms of processing large amounts of non-linear, non-parametric data. (Najah, 2013)
Forecast of turbidity Tributary of the Iowa River. Forecast period: hours / days.
MLP algorithms compared to a line-ar regression Upstream turbidity and up-stream/downstream discharge measurements used as input pa-rameters
The performances of twenty neural networks were evaluated and the top five retained for the building of an ensemble model. The ensemble accuracy is reported algorithm reported accuracy greater than 95%. (Roz, 2011)
Forecast of turbidity (threshold exceedance probabilities) Bull Run River,in Oregon Forecast period: seasonal
Global methodology based on logistic regression technique to quantify the likelihood of turbidity exceedance. seasonal precipitation forecast used as an input to generate streamflow scenarios conditional on the
forecasts offer a slight improvement over climatology, but that representative forecasts are conservative and result in only a small shift in total exceedance likelihood. Synthetic forecasts are included to show the sensitivity of the total exceedance likelihood. The technique is general and could be applied to other water quality variables that depend on climate or hydroclimate. (Towler, 2010)

87
Deliverable n° 10.1
Annex 13 GESCAL model formulation The GESCAL tool allows the development of water quality models on simulation models of water resource systems previously developed with the SIMGES module. Although water quality has been considered in all possible elements of simulation modelling, the modelling of physicochemical and biological processes affecting quality is considered exclusively in the elements of river reaches (or channels) and reservoirs (or lakes). The constituents that can be modelled are the following:
- Temperature.
- Arbitrary pollutants.
- Dissolved Oxygen and Carbonaceous Organic Matter (COM).
- Nitrogen cycle: organic nitrogen, ammonium and nitrates. And its effects on dis-solved oxygen.
- Eutrophication: nitrogen cycle, phytoplankton (such as chlorophyll-organic and inor-ganic phosphorus, and its effect on dissolved oxygen).
ELEMENTS OF THE RIVER BASIN
(A) CHANNEL MODELLING (Watercourse, river reach, canal or
any other type of conduction)
(B) RESERVOIRE MODELLING (reservoire and lakes)
- It is considered unidimensional withhomogeneity of concentrations on both thevertical and transverse axis.- Stationary state: For each month, the steady-state conditions of water quality that wouldreach the river reach are estimatedconsidering that the conditions remainconstant within that time interval.- The processes of advection and dispersionare considered.- The modelling of the river reaches also takesinto account the possible hydraulic relationwith the aquifers, either by loses to or gainsfrom the aquifer.- The introduction of elements of diffusepollution is allowed.- Hydraulic parameters are estimated either bypower relations or Manning equationsassuming trapezoidal section.- Point loads are considered at nodes.
- It has been conceived the possibility ofmodelling them in two layers representing theepilimnion and the hypolimnion or as a singleelement of complete mixture. Thisconsideration can be variable depending on themonth of simulation.- In the reservoirs, the quota of the thermoclineand the distribution of inflows and outflowsbetween the two layers are established, on amonthly variable basis. In addition, the programautomatically estimates if the volume is notenough for the thermal stratification to occurand then it eliminates it.- When modelling stratified, diffusion betweenthe two layers is considered.- Due to the variability of the volume of thereservoirs over time, a dynamic estimation ofthe quality is made.- It also includes, for all pollutants, thepossibility of introducing flows of constituentsfrom the sediment.
FEATURESFEATURES

IMPREX has received funding from the European Union Horizon 2020 Research and Innovation Programme under Grant agreement N° 641811
88
(A) CHANNEL MODELLING
General
formulation
VWCqqCS
dxuCd
dxdCE
dxd iseed å+-+
+-÷øö
çèæ=
)(0
Where: E represents the dispersion (m2day-1); C the concentration of the constituent (mg/l); Ce the concentration of the constituent in the aquifer to which the river is connected (mg/l); x the distance along the length of the river reach (m); u speed (m day-1); V the volume of the mass of water (m3); qe is the flow that the aquifer brings (m3day-1); qs the possible flow filtered to the aquifer (m3day-1); Sd the amount of mass diffusely contributed to the river reach (g/day). ΣWi (M) represents the set of processes that eliminate or contribute matter to the element
River hydraulics
(u)
velocity (ms-1) = 11
ba Qu =
depth (m) = 22
ba Qh =
width river (m) = 33
ba Qb =
1321 =++ bbb and 1321 =×× aaa
Method: Leopold
and Maddock
(1953)
velocity (ms-1) = nIRu h21
32
=
Hydraulic radius (m) = 𝑅" =%"&'()***&'%+),-.-(&-)//.)0(2)
%"&0&%%&45&(+6&%&((7)
slope of the channel (m/m) = I
Method:
Manning's formula
Longitudinal dispersion
(E)
*
22
011.0hubuE =
ghsu =*
slope of the channel = s
Method:
Fischer et. al. (1979)

89
Deliverable n° 10.1
( )12ln ssuLE =
- s2 and s1 the salinity at the end and at the beginning of the reach
- L is the length of the reach (m)
Method: Thomman
(1987) [Estuaries dispersion]
(B) CHANNEL MODELLING
General formulation
EPILIMNION
( ) å+-+-=++ isee WCCECQCQdtdVC
dtdVC
dtdCV 12121112/1
11
11 '
General formulation
HYPOLIMNION
( ) å++-+-=-+ 221122222/12
22
2 ' isee WSedCCECQCQdtdVC
dtdVC
dtdCV
General formulation
FULLY MIXED
å+-=+ isee WCQCQdtdVC
dtdCV 111
11
11
Where: The subscript "1" represents the epilimnion or upper layer; the subindex "2" the hypolimnion or lower layer; V1 and V2 are the volumes of the layers (m3); V is the volume gained or lost (if negative) of the epilimnion over the hypolimnion due to heating or cooling over the month (m3); C1 and C2 are concentrations of each layer (M/V); C1/2 is the hypolimnion concentration if the volume increase is negative and the epilimnion if it is positive (mgl-1); Ce is the concentration of the inflows (mgl-1); t represents the time variable; Q1e and Q2e are the inflows in the time interval (m3t-1); Q1s and Q2s are the outflows in the time interval (m3t-1); Sed is the flow of constituent from the sediment (M/T); Wi1 and Wi2 are the set of processes of degradation or contribution of constituent in the mass of water. E'12 represents the dispersion coefficient between the two layers (m3t-1).

IMPREX has received funding from the European Union Horizon 2020 Research and Innovation Programme under Grant agreement N° 641811
90
Dispersion coefficient
(E’12)
12
1212'12 Z
AEE =
E12 = vertical diffusion (m2t-1) A12 = the area between the two layers (m2)
Z12 = the height of the thermocline (m)
WATER QUALITY IN THE REST OF ELEMENTS OF THE SYSTEM
Element Processes
River reaches
Physics: Advection and longitudinal dispersion
Chemical and biological: Depending on the constituent modelled.
Reservoirs
Physical: Complete mixture or stratification in two layers.
Chemical and biological: Depending on the constituent modelled.
Streamflows The time series of inflow concentration of each of the constituents modelled are entered as input data.
Nodes
A complete mixture is assumed in the node. The outflow concentration of the node is estimated by mass balance.
Demands
It is assumed that the quality of the water that arrives at a demand is a product of the mixture of the quality of the water at the exit of each one of its takes.

91
Deliverable n° 10.1
Intakes
Outflow concentrations of an intake are the same as those of the origin of the intake or they can be entered as input data.
Returns
Outflow concentrations of a return are obtained by balance between the different intakes related to that return or they can be entered as input data.
Hydropower Plants
Outflow concentrations are equal to those at the entry point
Aquifers
Constant concentrations provided as input data.
(C) WATER TEMPERATURE MODELLING
Method Thermal balance
approach
cewlwalwswnet JJJJJ +--+=f
Where: f net is the net heat flux; Jsw is the short-wave radiation; Jalw is the long-wave atmospheric radiation; Jwlw is the long-wave radiation emitted by the mass of water; Je represents the energy consumed in evaporation; Jc is the energy transmitted by convection from or to the volume of water.
CONSTITUENTS AND PROCESSES MODELLED
(F) GENERAL CONSIDERATIONS
(D) ARBITRARY POLLUTANTS
(E) ORGANIC MATTER, DISSOLVED OXYGEN AND
EUTROPHICATION PROCESSSES
(C) TEMPERATURE
- Thermalbalance approach
- Linearizationapproach
- Temperatureas input data
- Carbonaceous Organic Matter- Organic Nitrogen- Ammonia- Nitrites and Nitrates- Phytoplankton- Organic Phosphorous- Phosphates- Dissolved Oxygen
- Temperatureinfluence
- Dissolved oxygenconcentrationinfluence
- Sediment flux in reservoirs
- Coefficients and stoichiometry
- Conservativepollutants
- No conservativepollutants

IMPREX has received funding from the European Union Horizon 2020 Research and Innovation Programme under Grant agreement N° 641811
92
Method Linearization
approach
(1)Mixed fully (2) Epilimnion
(3) Hypolimnion
(1)
𝑊+ = ∅,&% = 𝐾&; ∗ 𝐴* ∗ (𝑇&; − 𝑇)
Where: Keq is the rate of heat exchange (Wm-2ºC-1); Teq is the equilibrium temperature (°C), T is the water temperature and As is the surface area of the sheet of water.
(2)
𝑾𝒊_𝒆𝒑 = ∅𝒏𝒆𝒕 = 𝑲𝒆𝒒 ∗ 𝑨𝒔 ∗ 𝑻𝒆𝒒 − 𝑻 − 𝟏 − 𝜷 ∗ 𝑰𝒐 ∗ 𝒆P𝑲𝑯𝟏 ∗ 𝑨𝒔
Where: β is the short-wave ratio that is absorbed in the most superficial layer of water. Io is the net shortwave solar radiation incident on the mass of water, K is the light attenuation constant of the reservoir, H1 is the height of the epilimnion and As is the surface of the water.
(3)
𝑊+_"+5 = 1 − 𝛽 ∗ 𝐼) ∗ 𝑒PVWX ∗ 𝐴*
(D) ARBITRARY POLLUTANTS MODELLING
No conservative
pollutants
( ) ChVSCKW T
i --= -å 20q
Where: K represents the degradation rate at 20 °C (day-1); q is the temperature correction coefficient; sedimentation is considered by a parameter VS that represents the sedimentation rate of the constituent (m day-1); H is the depth of the river (m); C represents the pollutant concentration in the river (mgl-1).
Conservative pollutants
å iW
(E) MODELLING ORGANIC MATTER, DISSOLVED OXYGEN AND EU-TROPHICATION PROCESSES

93
Deliverable n° 10.1
Carbonaceous Organic
Matter
LhVSL
KOOKW L
d
Tddi -
+-= -å
21
20q
Where: L is the concentration of COM in the river (M/V); Kd is the
degradation rate (T-1); q d is the temperature correction coefficient of the constant Kd; VSL is the sedimentation rate (mdía-1); H is the depth of the mass of water; T is the temperature of the mass of water.
Organic Nitrogen
AKrNhVSNKW T
resprespnaoNo
oTnoaNoai
2020 -- +--=å qq
Where: Knoa represents the ammonification constant (day-1); q noa represents the temperature correction coefficient of the previous constant; No is the concentration of organic nitrogen in the river (MT-
1); VSNO is the sedimentation rate of organic nitrogen (mday-1); rna represents the nitrogen content in the algae (mgN/mgA). The last term is only considered when phytoplankton is modelled, representing the contribution due to the respiration thereof.
Ammonia
AKFrNKOOKNK gnnaa
n
TnaiNaio
TKnoaNoa
'
21
2020iW
-+÷÷ø
öççè
æ
+-+= --å qq
Where: Na represents the concentration of ammonia (NH4+) in the
river (mgl-1); KNai is the nitrification constant (day-1); q nai is the temperature correction coefficient of the nitrification constant; Kn1/2 is the nitrogen half-saturation constant (mgl-1); O is the concentration of dissolved oxygen. Fn represents the preference factor for ammonia versus nitrates; rna is the stoichiometric coefficient (mgN/mgA); K”
g is the phytoplankton growth constant considering the temperature correcting factor, nutrient limitation and light attenuation (day-1); A is the concentration of chlorophyll-a (mgl-1). The last term is only considered when the global set is modelled.
Nitrites and Nitrates
AKFrNKO
KKN
KOOKW gnnao
no
noTnonoa
nai
TnaiNaii
'3
213
2132033
21
20 )1( --÷÷ø
öççè
æ
+-÷
÷ø
öççè
æ
+= --å qq
Where: No3 is the concentration of nitrates (mgl-1 -N); Kno3 represents the denitrification constant (day-1); q no3 is the temperature correction factor for the previous constant; KNo31/2 represents the half-saturation constant to take into account that denitrification only occurs in cases of anoxia.
Organic Phosphorous or
orTrespresppapor
Tmpmpi P
hVS
AKrfPKW -+-= --å 2020 qq

IMPREX has received funding from the European Union Horizon 2020 Research and Innovation Programme under Grant agreement N° 641811
94
Where: Por is the concentration of organic phosphorus (mgl-1). Kmp represents the mineralization constant of organic phosphorus (day-1); q mp is the temperature correction coefficient of the mineralization constant; rpa is the stoichiometric coefficient (mgP/mgA); VSor is the sedimentation rate of organic phosphorus (mday-1); fp is the fraction of organic phosphorus that is generated during the phytoplankton respiration.
Phosphates
AKrfAKrPKW Trespresppapgpaor
Tmpmpi
20'20 )1( -- -++-+=å qq
Where: P represents the concentration of inorganic phosphorus in the river (mgl-1).
Dissolved Oxygen
(1) ---+= --å LKOOKW Tddsat
TKaai
2020 )( qq
(2) +÷÷ø
öççè
æ
+- -
an
TnaiNaia N
KOOKr
21
20q
(3) AKrAKPP
KNN
MinFKr Trespresporesp
PNFaio
aiol
Tggocrec
20
2/1213
320max );( -- -÷
÷ø
öççè
æ
Where: O is the dissolved oxygen concentration in the river (mgl-1); Osat is the concentration of dissolved oxygen saturation (mgl-1); Ka is
the reaeration constant (day-1); q a is the temperature correction factor; ra represents the oxygen consumption by ammonium oxidation (mgO/mgN); rocrec and roresp represent the oxygen produced and consumed by the growth of algae and respiration.
1- Simple mode (only dissolved oxygen and organic matter) 2- second mode where nitrogen cycle is included 3- Last mode where the effect of phytoplankton and phosphorus is in-
cluded.
Phytoplankton
[ ] AhVS
AKKW ATresprespgi --+= -å 20' q
NlTggg FFKK ×××= -20
max' q
Where: Kgmax is the phytoplankton maximum growth constant at 20 °C
(day-1);q gisthetemperaturecorrectionfactorofphytoplanktongrowth;Fl
is the attenuation light factor with monthly variation; FN is the nutrient
limit factor; Kresp represents the coefficient for phytoplankton death and

95
Deliverable n° 10.1
respiration (day-1); q resp is the temperature correction factor; VSA is the
sedimentationrateofchlorophyll-a(mday-1).
In order to include the nutrient limitation, the expression developed byMichaelis-Menten:
÷÷ø
öççè
æ++ 2/12/13
3 ;PNFaio
aio
KPP
KNNMin
Where: Naio3 represents the concentration of inorganic nitrogen (mgl-1);
KNF1/2 is the nitrogen half-saturation constant; P is the concentration of
phosphates in the river reach (mgl-1); Kp1/2 is the half-saturation constant
forphosphorus(mgl-1).
The factor introduced to include the light limitation for phytoplankton
growth is determined from the light attenuation with depth by Beer -
Lambertlawandtheeffectofluminositylevelongrowth.
zKez eII ×-×= 0
Where:I0istheluminousintensityonthesurface(langleys/day),ofwhich
the visible light range corresponding to approximately 50% of incidentsolar radiation is used; Ke is the coefficient of light extinction. This
coefficient, Ke, introduces the effect of self-enlightenment by the
expression:
AKeKe at ×+= a0
Where:Ke0representsthewaterlightextinctioncoefficient(m-1);aatisthespecificlightextinctioncoefficientofphytoplankton(Lmg-1m-1)andAisthe
concentrationofchlorophyll-a(mgL-1).
Finally, the effect of the luminosity level ongrowth canbe introducedbysaturationorphoto-inhibitioncurves.Theformulationusedinthisstudyis
thatphoto-inhibition,whichfollowsSteele'slaw:
÷÷ø
öççè
æ-
×= sII
s
eIIFL
1

IMPREX has received funding from the European Union Horizon 2020 Research and Innovation Programme under Grant agreement N° 641811
96
WhereI (langleys) isthe luminous intensityandIs (langleys)the luminous
intensityofsaturation.
(F) GENERAL CONSIDERATIONS
PARAMETER PROCESSES
Temperature (±)Exchange with the atmosphere
Arbitrary pollutant (-)Sedimentation.
(-)Degradation.
Organic matter (-)Sedimentation.
(-)Degradation.
Dissolved oxygen
(+)Reaeration.
(-)Organic matter degradation.
(-)Demand of the sediment.
(-)Nitrification.
(+)Phytoplankton growth and (-) Phytoplankton respiration
Organic nitrogen
(-)Mineralization.
(-)Sedimentation.
(+)Phytoplankton respiration.
Ammonia
(+)Mineralization.
(-)Nitrification.
(-)Phytoplankton growth.
Nitrates
(+)Nitrification.
(-)Denitrification.
(-)Phytoplankton growth.
Phytoplankton (Chlorophyll-a)
(+)Growth.
(-)Respiration.
(-)Sedimentation.
Organic phosphorous
(-)Mineralization.
(-)Sedimentation.
(+)Phytoplankton respiration.

97
Deliverable n° 10.1
(F) GENERAL CONSIDERATIONS
PARAMETER PROCESSES
Inorganic phosphorous
(+)Mineralization.
(-)Sedimentation-Adsorption.
(-)Phytoplankton growth.
(+)Phytoplankton respiration.
The signs (+) and (-) mean that the process contributes or decreases constituents respectively. In addition, processes of diffuse contamination in river reaches can influence each of them and sediment flows in reservoirs.
Annex 14 RREA model formulation RREAmodelwasdevelopedinordertoestimatetheeffectofdifferentenvironmentalpressures
onthewaterbodies.TheauthorsoftheprogramaretheGroupofWaterResourcesEngineer-
ingofthePolytechnicUniversityofValencia.
Recently,someHydrographicConfederationsofSpainhadusedRREAto include intheBasins
Plans studies about the chemical state of the water bodies and to propose new programs
measures.
Itwasdesigntoworkinalargescale,asawaterresourcessystem.Themainobjectiveofthis
tools is localize possible environmental problems in areaswhere not exist registers ofwater
qualitydataandtestpossiblemanagementalternativestoimprovetheecologicalstateofthe
analysedwaterbodies.
TheRREAmodelallowstoestimatetheevolutionoftheconcentrationinthewatermassesof
pollutantsthatcanbemodelledwithfirstorderkinetics.Inaddition,itallowsaspecialmodule
inwhichareconsideredthefollowingconstituentsandtheirrelationships:BOD5,dissolvedox-
ygen,ammoniumandnitrates.
Basicallytheprogramestimatetheconcentrationofcontaminantineachwaterbodyusingthe
loadofcontaminant ineachone,theconcentration inthepreviouswaterbodyand including
thepossibledegradationthatsuffertheanalysedcontaminant.

IMPREX has received funding from the European Union Horizon 2020 Research and Innovation Programme under Grant agreement N° 641811
98
ThepreviousdiagramshowstherelationsandtheprocessusedtodevelopaRREAmodel.The
stepstoobtainalltheinformationrequiredbytheprogramare:
1. Usethewaterbodyinformationinordertoobtainthenetworkflow.Itisnecessarythegeolocationinformationofeachwaterbody.TheusercanuseaGISprocessordoitmanually.
2. ThroughthewaterbodyGISinformationandthedischargesdata(geolocated)willbeobtained(usingGIStools)theidentificationofinwhichwaterbodydischargeeachef-fluent.
3. Normally,thedischargedatabasesusesterminologyofequivalentinhabitantinordertoestimatethepollutantloadoftheeffluent.
4. Someanthropicactivitiesnotproducestypicaldischarges.Themostexampleisthedif-fusionpollutioncausedbyagriculturalactivities.Asinthepreviousstep,theusercouldestimatetheloadpollutantineachwaterbodybythediffusecontamination.
5. Withtheaggregationoftheloadestimationinthe3and4step,theusercouldknow,moreorless,thetotalpollutantloadineachwaterbody.
6. Normally,thestreamflow’sofeachsubbasinwerecalculatedbyarainfall-runoffmodelastheSIMPAmodeldevelopedbytheCEH-CEDEX.
7. Thedegradationconstantscanbeassignedbythewaterbodytypeorcanbemoreindi-vidualizediftheuserwantabetterfitting.
First,theprogramrequiresthespecificinformation.Theuserwillhavetocollectandevaluate
thefollowinformationaboutthestudycasetodeveloptheRREAmodel:
WATERBODY
Pollutant load
DISCHARGESDATABASE
NUTRIENTSBALANCEDIFFUSEPOLLUTION
CONCENTRATION
Pollutant load
Networkflow
STREAMFLOWS
RREAMODEL
DEGRADATIONCONSTANTS
Pollutantloadbydiffusecontamination

99
Deliverable n° 10.1
Thegeneralresultsobtainedaftertheimplementationofthemodelare:
• Flowseriestoeachwaterbody(Hm3/month)
• Theconcentrationofmodelledpollutantstoeachanalysedwaterbody(mg/l)
• Thedefectseriesofecologicflowtoeachwaterbody(Hm3/month).
• Otherspecificinformationdependingthemodelledpollutant.
Mathematicallyitispossiblereducethemodeltofourequations.First,itisnecessaryknowthe
flowbalance.Withthestreamflowdata,theprogramcancalculatetheamountofwaterineach
waterbody.
HYDRO-BALANCE
Water bodies • Length (in Km) • Network flow and order flow • Code water bodies
• Pollutant load by water body (Kg/month) Pollutant load
Concentration of the modelled pollutants
• DBO5 mg DQO/l • Fósforo mg P/l • Amonio mg N/l • Nitratos mg N/l
Streamflows • To each water body (Hm3/month) • Natural flows.
Degradation constants
• To each pollutant • To each water body (Km-1)
INFORMATION

IMPREX has received funding from the European Union Horizon 2020 Research and Innovation Programme under Grant agreement N° 641811
100
INPUTFLOW
Analysedwaterbody=i
𝑄&,+ = 𝑄[&,,+ + 𝑄*,](𝑗 → 𝑖),
+ab
WhereQe,i is the input flow in the analysed water body bymonth,Qgen,iisthesubbasinwatercontributionandQs,j(j->i)istheoutputflowofthewaterbodywhichdischargeintheana-lysedwaterbody.
OUTPUTFLOW
Analysedwaterbody=i
𝑄*,+ = 𝑄&,+ − 𝑄4&%(,+WhereQs,iistheoutputflowoftheanalysedwaterbody;Qe,iinputflowoftheanalysedwaterbodyandQdetri,outputflowbywaterdemands.
InthefollowdiagramarerepresentedtheprocessesandinteractionsmodelledinRREA:
POLLUTANTLOADBALANCE
A = ∑ 𝑄*,](𝑗 → 𝑖),+ab
B =𝑄[&,,+ C = −𝑄4&%(,+ D =𝑄*,+
B- The sum of output flow of previous water bod-ies.
A- The subbasin water contribution.
D- Water extraction (Demands).
C- Output flow.

101
Deliverable n° 10.1
INPUTPOLLUTANT
LOAD
Analysedwaterbody=i
𝑀&,+ = 𝑀[&,,+ + 𝑀*,](𝑗 → 𝑖),
]ab
Where,Me,I istheinput loadpollutant intheanalysedwaterbody; Mgen.i is the load pollutant generated in the subbasinandMs,j(j->i)istheoutputloadpollutantofallthewaterbod-ieswhichdischargeintheanalysedwaterbody.Ifexistsdemands,isnecessarydetractpartoftheinputload,becauseapartoftheloadpollutantwillbetransportedbytheoutputwaterdemand.Themodelusethefollowequation:
𝑀&,+ = 𝑀&,+ ∙ 1 −𝑄4&%(,+𝑄&,+
OTPUTPOLLUTANT
LOAD
Analysedwaterbody=i
𝑀*,+ = 𝑀&,+ ∙ 𝑒PVfWhereMs,iistheoutputpollutant;Me,iinthetotalinputpol-lutantloadintheanalysedwaterbody;Kisaspecificdegra-dationconstantanditdependofthepollutantmodelled.
Finally,as themodelhave informationabout flowandpollutant load theprogramcancalcu-
latestheconcentrationoftheanalysedpollutantineachwaterbodyandcomparestheresults
A- Input pollutant load from pre-viously water body
C- Degradation in the analysed water body
D- Output pollutant load
A = ∑ 𝑀*,](𝑗 → 𝑖),]ab
B = 𝑀[&,,+ C = 𝑀&,+ ∙
g1 − hijkl,mhj,m
n
D = 𝑀&,+
B- Discharges from hu-man activities and pollutant load by dif-fuse contamination

IMPREX has received funding from the European Union Horizon 2020 Research and Innovation Programme under Grant agreement N° 641811
102
withthemaximumconcentrationauthorized.Withtheseresults,theuserscananalysetheeco-
logical state and the environmental necessities of thewater bodies that do not havewater
qualityinformation.Inaddition,theprogramprovidestheoptionofevaluatethecapabilityof
theapplicationofnewmanagementstrategiesintheanalysedwaterresourcessystems.
Annex 15 Practices in La Contraparada DWTP related to Hazard Analysis and Critical Control Points DWTP in operation:
• Quarterly monitoring of the physical and chemical conditions of water in La Contraparada reservoir, by means of the realization of a profile in depth where are measured the parameters of temperature, dissolved O2 and presence of SH2. The parameters pH, conductivity, turbidity, organic matter, ammonium, nitrites, nitrates, soluble reactive phosphorus are normally analyzed at the surface and at depth. Only on the surface is controlled the algal community and chlorophyll "a".
• Under normal conditions the average retention time of the water in La Contraparada reservoir should not exceed 10 days.
• Monitoring and control of the water entering in La Contraparada reservoir during the times of the year coinciding with irrigation, as it was observed in the past a tendency to increase the concentration of nutrients. In case of an excessive increase of nutrient concentration, it is recommended a management study for each specific case.
• In summer it is advisable to maintain the water level at a height of approximately 5-6 meters, favoring the natural oxygenation of the water and minimizing the formation of SH2.
• Control of the algal community after rainfall episodes in areas adjacent to the water catchment, since in some years, after the periods of intense rains registered in the vicinity of La Contraparada reservoir, it was observed a significant growth of the phytoplankton community due to the incorporation of nutrients (mainly nitrates).
• An important factor to take into account are the operational techniques carried out in the DWTP, mainly increases and decreases in the water level of the reservoir. Decreases in the height of the reservoir concentrate the existing biomass, being able to increase the chlorophyll "a", organic matter, turbidity and break-point in the raw water. Increases in the level of the reservoir abruptly cause a resuspension effect of the decanted materials, releasing phosphorus from the sediments.
• Control of the algal community is necessary even if cyanophytes are absent, since a high density of other taxa can lead to depletion of nutrients and facilitate the development of cyanophyte species that are able to fix atmospheric nitrogen.
Stops and starts of DWTP:

103
Deliverable n° 10.1
• In the case of a stoppage in the water treatment for more than 10 days, the raw water intake from the reservoir to the plant must be emptied completely, thus avoiding the decomposition of the circulating water.
• Stops and starts are operations that destabilize the usual working conditions of DWTP. Therefore, before starting a plant, it is recommended to renew the water by increasing the height of the reservoir, thus diluting the precursors of DBPs. The requirements for water renewal will vary in each case, depending on the time of isolation of the reservoir, season of the year, initial height of the reservoir, etc.
• For a plant stop, it is advisable to lower the water level of the reservoir to 4-5 meters, to allow a better and faster water renovation.
• During plant stops of 10 days to 1 month, it is advisable to perform a profile of the reservoir in depth every 10-15 days during summer season, where at least are measured the parameters of temperature, dissolved O2, SH2 and break-point (chlorine demand). In case of stops above the month and during the summer, the profile would be made (if necessary) with weekly frequency.
• Before starting the plant after a stop of more than 10 days it is advisable to make a sampling to characterize the physico-chemical parameters: temperature, dissolved O2, SH2, break-point, suspended solids and ammonia; In case it is necessary to drain the reservoir before starting the purification.
Fishing community:
• Have identified the fish species present in the reservoir, their densities and their possibility of reproduction. To elaborate protocol of action to realize extractions of fish in case the density of individuals exceeds the recommended levels.
Disinfection By-Products:
• The renovation of the reservoir water seems to be a factor of relevance in the formation of bromates, closely related to the regeneration of the algal population and dissolution of the existing organic matter. It appears that opportunistic algae are poor precursors of bromates and / or are easily eliminated by preozonization.
• The treatment process of DWTP is capable of removing efficiently an important algal load from the raw water when it is live biomass with a high percentage of active chlorophyll. This leads us to interpret that to favour a control over the formation of DBPs, it is convenient to maintain a phytoplankton community in continuous growth, where the phases of senescence are minimized. This can be achieved by constant but not intense perturbation of the surrounding reservoir, for example, with the fluctuation of the height of the reservoir and the minimization of the residence time of the water in the reservoir.
• Forced aeration in the deep water area of the reservoir with compressor and diffusers. It seeks the homogenization of water mass, the increase of O2 and the reduction of SH2.
• Exhaustive control of BP and THMs during the treatment process.

IMPREX has received funding from the European Union Horizon 2020 Research and Innovation Programme under Grant agreement N° 641811
104
Annex 16 Control diagrams for the risk driven by hydrological extremes and climate events As practical examples in catchment and taking into account the climatic events, the following control diagrams have been developed, which are carried out in La Contraparada DWTP:
- Turbidity
The selected control points aim to minimize the impact on La Contraparada DWTP and on the distribution network of Aguas de Murcia are:
• Quality station at Tajo-Segura River Transfer catchment • Quality station at inlet water of La Contraparada DWTP • Daily controls at inlet water of La Contraprada reservoir • Profiles of the water in La Contraparada reservoir • In addition, in the laboratory of La Contraparada DWT there are permanent water taps
with water from the reservoir, raw water and the rest of the sampling points of the process (The water is not lost, because it returns to the beginning of the DWTP)
Preventive measures, as indicated in the Table (Table: HACCP Plan, which includes the identification of hazards and evaluation of sanitary risks of water for each of the stages for the supply of the Municipality of Murcia), are specific to each stage of water treatment and/or water supply, and are based on the knowledge of infrastructures and technical expertise.
- Eutrophication

105
Deliverable n° 10.1
The selected control points aim to minimize the impact on the La Contraparada DWTP are:
1. Previous points at the entrance of La Contraparada DWTP • Ojos reservoir • Tajo-Segura River Transfer • Entrance to La Contraparada reservoir • La Contraparada reservoir • Raw water at the entrance of La Contraparada DWTP
2. First stages of the treatment process: • Pre-ozonization • Decantation Regarding preventive measures, the HACCP table (Table X) describes the following:
EVENT DANGER PREVENTIVE MEASURES
Algal growth in La Contraparada. It is an uncontrollable event,
dependent on meteorology and high temperatures.
Presence of microcystins Control of algal population (chlorophyll "a", phycocyanin and genus of algae). Quality station of water Transfer and
entrance to DWTP. Maneuvers in the reservoir. Application of chlorine dioxide. Control of
ozone, chlorites and chlorates by-products in the water line. Ozone application and GAC
filtration. Reservoir maneuvers.
Presence of geosmin and MIB
Presence of precursors of disinfection byproducts (Bromate data are evaluated in pre-ozonized water)
- Conductivity

IMPREX has received funding from the European Union Horizon 2020 Research and Innovation Programme under Grant agreement N° 641811
106
The selected control points aim to minimize the impact on La Contraparada DWTP are:
• Tajo-Segura River Transfer • Entrance to La Contraparada reservoir • La Contraparada reservoir • Raw water at the entrance of La Contraparada DWTP
Preventive measures are: • Monitoring the water quality of Segura River, mainly the conductivity, because it is a
parameter that cannot be reduced in the existing treatment process, only through membranes
• Analytical control in catchment and entry to DWTP. Water Quality Station at the point of Tajo River Transfer and at the DWTP entrance
• Operational manoeuvres, dilution practices with reservoir water and / or plant shutdown if dilution is not possible
- Organic matter

107
Deliverable n° 10.1
The control points are:
• Tajo-Segura River Transfer • Entrance to La Contraparada reservoir • La Contraparada reservoir • Raw water at the entrance of La Contraparada DWTP
Preventive measures are:
• Water Quality Station at the point of Tajo-Segura River Transfer. Visual and analytical control in catchment and Segura River. Analytical control in the water entering to the reservoir.
• Operational manoeuvres, dilution practices with reservoir water and / or plant shutdown if dilution is not possible
• Control of algal population (chlorophyll "a" and algal species). Manoeuvres in the reservoir. Control of DBPs by the use of ozone in water line. Ozone application and CAG filtration. Reservoir manoeuvres.
• Daily water level control in the reservoir. Control turbidity. • Practices of exploitation in the treatment process: 1. Analytical control plan. Control of turbidity and organic matter in the clarification that
allows the manual adjustment of the dosage of reagents. 2. Dosing of chlorine, ozone and chlorine dioxide in pre-oxidation. Control of break point
and precursors of DBPs (organic matter), studies of Research, Development and Innovation (RDI) in pilot plant.

IMPREX has received funding from the European Union Horizon 2020 Research and Innovation Programme under Grant agreement N° 641811
108