drinking water quality – forecasting salinity intrusion … · drinking water quality –...
TRANSCRIPT

8th South Pacific Stormwater Conference & Expo 2013
DRINKING WATER QUALITY – FORECASTING SALINITY INTRUSION IN WHAKATANE RIVER
Ben Tuckey1, Colin Roberts1 and Santhan Gunasantha2. 1 DHI New Zealand, ecentre, Oaklands Road, Auckland.
2 Whakatane District Council, Civic Centre, Commerce Street, Whakatane.
ABSTRACT
The Whakatane River can experience sufficiently low flows in summer months that allow saline intrusion to reach, and pass, the town water supply intake. Such intrusion events have led to water quality issues with the town water supply. It has been necessary for the Whakatane District Council to manage such intrusion events to minimise the impact on drinking water quality. Having advanced warning of the timing and duration of such events is useful to council.
A modified version of a MIKE 11 river model was been developed (known as MIKE 11 XZ) where the model operates in a two dimensional mode in the vertical (X-Z) plane allowing vertically stratified flow to be simulated. This model has been applied to an existing MIKE 11 model of the Whakatane River and predictions made using both observed and predicted tidal levels and both observed and design low river flows. Forecasts made by the model were found to have strong agreement with actual salinity intrusion events.
This paper will present the work carried out for the Whakatane River salinity intrusion forecasting and demonstrate that it is possible to exploit existing investments in river models to make predictions of important water quality events.
KEYWORDS
Drinking Water, Saline Intrusion, MIKE 11 XZ, Forecast
PRESENTER PROFILE
Ben Tuckey is a coastal scientist with DHI in Auckland. He has been involved with numerous modelling studies in New Zealand, Australia, England and the Middle East, including harbour entrance stability for navigation; impact assessments for proposed wastewater outfalls; aquaculture and sedimentation and water quality in rivers and estuaries.
1 INTRODUCTION
The Whakatane River in the Bay of Plenty (see Figure 1) is the source of drinking water for Whakatane and Ohope through the Valley Road treatment plant operated by Whakatane District Council (WDC). The treatment plant is fed by an intake on the Whakatane River which is located approximately 11 km upstream from the river mouth.

8th South Pacific Stormwater Conference & Expo 2013
Figure 1: Locator map.
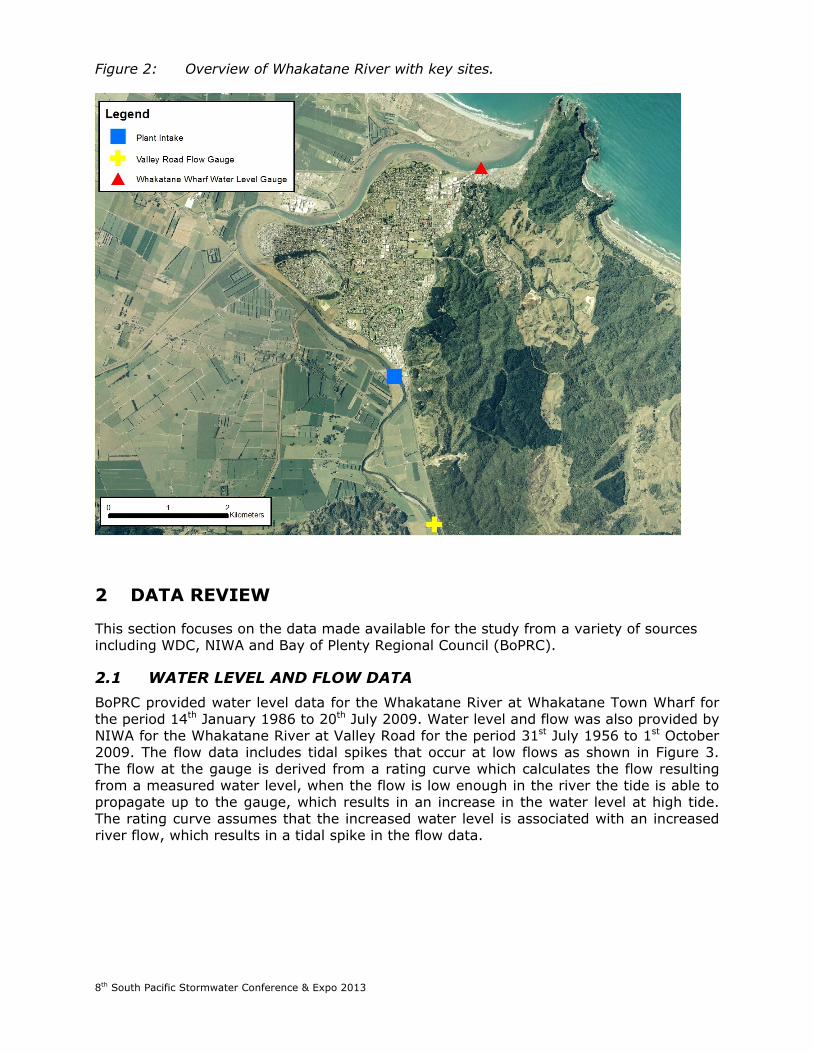
The Whakatane River can experience sufficiently low flows in summer months. There are occasions where these significant low flows allow saline water to intrude up-river past the location of the intake which causes issues with the water quality (including taste) of the Whakatane water supply. The frequency that seawater is able to reach the intake resulted in WDC needing to investigate options to minimize the intake of seawater into the treatment plant. In 2009 WDC commissioned DHI to undertake a computer modeling study of the saline intrusion phenomenon in the Whakatane River and provide WDC with long term hindcast and forecast predictions of saline intrusion within the river. These predictions were to help assess the nature of the saline intrusion and assist with identifying a feasible management approach or mitigation solution to the saline intrusion problems. The long term hindcast of the saline intrusion was carried out for 23 years (1986 – 2009). A number of forecasts of the saline intrusion with a range of constant low flows were provided for the periods 1st January to 1st April 2010 and 20th December 2010 to 1st March 2011 to alert WDC of the potential for saline intrusion to reach the intake during these periods. Figure 2 presents an overview of the Whakatane River and key sites such as the Whakatane Wharf level gauge, Valley Road flow gauge and the Whakatane treatment plant intake.
8th South Pacific Stormwater Conference & Expo 2013
Figure 2: Overview of Whakatane River with key sites.
2 DATA REVIEW
This section focuses on the data made available for the study from a variety of sources including WDC, NIWA and Bay of Plenty Regional Council (BoPRC).
2.1 WATER LEVEL AND FLOW DATA BoPRC provided water level data for the Whakatane River at Whakatane Town Wharf for the period 14th January 1986 to 20th July 2009. Water level and flow was also provided by NIWA for the Whakatane River at Valley Road for the period 31st July 1956 to 1st October 2009. The flow data includes tidal spikes that occur at low flows as shown in Figure 3. The flow at the gauge is derived from a rating curve which calculates the flow resulting from a measured water level, when the flow is low enough in the river the tide is able to propagate up to the gauge, which results in an increase in the water level at high tide. The rating curve assumes that the increased water level is associated with an increased river flow, which results in a tidal spike in the flow data.

8th South Pacific Stormwater Conference & Expo 2013
Figure 3: Flow from gauge on Whakatane River at Valley Road to illustrate occurrence of tidal spikes in data.
2.2 SALINITY MEASUREMENTS Salinity measurements were provided by WDC for several locations along the Whakatane River upstream and downstream of the intake for thirteen periods between 22nd December 2008 and 11th May 2009. The measurements were carried out using a CTD (Conductivity Temperature Depth) meter. The timing of the CTD casts is shown in Table 1.
Table 1: CTD casting periods.
CTD Name Downstream Distance Range (relative to intake) Date Time of measurements
CTD-01 0m to 10,000m 23/12/2008 Approximately 16:00 to 18:30
CTD-02 0m to 10,000m 12/1/2009 7:35 to 9:50
CTD-03 0m to 10,000m 14/1/2009 9:10 to 10:50
CTD-04 0m to 10,000m 29/1/2009 10:06 to 11:42
CTD-05 -500m to 10,000m 2/2/2009 13:12 to 15:40
CTD-06 -500m to 1,500m 3/2/2009 13:30 to 15:00
CTD-07 -500m to 5,500m 5/2/2009 14:32 to 15:46
CTD-08 -500m to 6,000m 9/2/2009 7:17 to 8:33
CTD-09 -700m to 1,500m 10/2/2009 8:19 to 9:03
CTD-10 2,000m to 9,500m 22/4/2009 10:48 to 11:53
CTD-11 -500m to 5,000m 22/4/2009 16:41 to 18:00
CTD-12 -400m to 5,500m 24/4/2009 6:34 to 7:30
CTD-13 -100m to 2,000m 11/5/2009 Not provided

8th South Pacific Stormwater Conference & Expo 2013
All of the CTD casts were carried out at the commencement of ebb tide and were normally completed by mid-ebb tide. The one exception is CTD-10 where measurements were carried out at around low tide. All casts were carried out when the river flow was less than 20 m3/s, when the saline intrusion is able to reach a reasonable distance upstream.
Salinity measurements were recorded as Practical Salinity Units (PSU), a common measure of salinity. Commonly seawater has 35 g of salt in 1000 g of water or a salinity of 35 ‰ (parts per thousand), which is equivalent to 35 PSU. Another way to measure salinity is conductivity (µS/cm); however this is not a practical unit for modelling studies. Water conductivity changes with relation to water temperature and salinity; hence PSU is a more consistent measure of salinity.
To illustrate the salinity distribution along the Whakatane River, for each period of salinity data collection, the salinity data has been interpolated between the CTD cast locations for CTD-01 to CTD-09. This was not possible for CTD-10 to CTD-13 as the salinity measurements were not measured throughout the whole water column. It should be noted that there was a significant amount of time between the first and last casts (a maximum of 100 minutes); however it was deemed acceptable to assume that the data provides an instantaneous observation of the salinity distribution along the Whakatane River at single point in time. The salinity distribution along the river for CTD-01 (23rd December 2008), CTD-02 (12th January 2009) and CTD-03 (14th January 2009) is shown in Figure 4.
Figure 4: Salinity Profile from CTD-01 (top), CTD-02 (middle) and CTD-03 (bottom). Note that the distance is relative to the treatment plant intake, with a positive value downstream of the intake.
Distance downstream from intake (m)
Sali
nity
(PS
U)
Dep
th (
m)

8th South Pacific Stormwater Conference & Expo 2013
The data illustrated that there is a salt wedge of dense marine water that propagates up the river during the flood tide. There is considerable vertical mixing that occurs which reduces the salinity stratification and diminishes the interface between marine and freshwater. The distance that the salt wedge reaches up the river is determined by variations in the river flow and tidal range. The salinity measurements from CTD-11 and CTD-12 confirmed that the salt intrusion was able to propagate upstream to the intake. At the beginning of this study it was assumed that the saline intrusion reached the intake due to low flow and large spring tides. However when measurements for CTD-11 and CTD-12 were collected the tidal range was reasonably small. Possible explanations for the saline intrusion reaching the intake for a smaller tide range are that it appears that when the rising tide comes into the river on top of a decent depth of water (i.e. low tide for smaller tidal range compared with low tide for a larger tidal range) then the tide can travel faster up the river (the speed of propagation of a tidal wave is proportional to the square root of the water depth, so the deeper the remaining water at low tide then the easier it is for the flooding tide to travel up the river). Also, for smaller tidal ranges, at low tide there is less impact on the travelling tide of bed friction. Further investigation of this phenomena was not within the scope of the study.
3 MODEL SET UP AND CALIBRATION
This section outlines the details of the hydrodynamic and advection/dispersion model development, calibration and verification. 3.1 MODEL A one dimensional hydrodynamic river model, MIKE 11 (DHI, 2012), for the lower Whakatane River was provided by BoPRC. This model was built for BoPRC as part of the Whakatane River Scheme, a flood protection and drainage scheme for the Whakatane River (Wallace, 2004). The model extended from 3 km upstream of the Valley Road flow gauge down to the river mouth. All other drainage channels apart from the main channel were removed to simplify the model. Since the model was not used to simulate high flows, simplifying the model did not effect the suitability of the model. The advection/dispersion module was included and salinity was selected as a modelled parameter. The Stratified Module (MIKE 11 XZ) was selected to include vertical resolution which was necessary to simulate salinity stratification. MIKE 11 XZ works by converting sections of the river which experience stratified conditions into two-dimensional sections by splitting the cross sections into a number of horizontal layers. The equations on which the method is based are width-averaged continuity, momentum and transport equations (Jakobsen et. al., 2005). The Valley Road flow data was used as the upstream boundary condition for the model. The flow data consisted of tidal spikes during lower flows (as described in Section 2.1). These spikes were removed by using a low pass filter. Water levels from Whakatane Wharf were used for the downstream boundary condition. A salinity of 35 PSU was used for the open ocean boundary and 0 PSU for the river inflow boundary. Ten equidistant (uniform) vertical layers were selected in MIKE 11 XZ.
8th South Pacific Stormwater Conference & Expo 2013
3.2 MODEL CALIBRATION 3.2.1 OBJECTIVE AND DESCRIPTION
Model calibration involves the refinement of hydraulic parameters to resolve important hydrodynamic processes for which the model is to be utilised. The main aim of this study was to match the behaviour of the saline intrusion within the Whakatane River during low flow conditions, therefore the model calibration was focused on achieving a reasonable match between observed and predicted salinities within the river for low river flows. The parameters that were adjusted to achieve the final calibration were the eddy viscosity and vertical dispersion parameters within MIKE 11 XZ. The eddy viscosity was decreased to encourage the propagation of the saline intrusion up the river, while vertical dispersion was decreased to reduce mixing between the saline and freshwater interface.
3.2.2 COMPARISON BETWEEN MEASURED AND PREDICTED SALINITY PROFILES
Simulations were carried out for the period 7th January to 11th February 2009. During this period, salinity profiles were collected along the river for eight separate occasions. Six of these periods were utilised for calibrating the model. Figure 5 presents the comparison of observed and predicted salinity profiles for selected profiles from 29th January 2009. The comparison between the observed and predicted salinity distributions for CTD-02 (12th January 2009), CTD-03 (14th January 2009) and CTD-04 (29th January 2009) is shown in Figure 6. There was a reasonable agreement between both the observed and predicted profiles and salinity distribution which suggests that a satisfactory calibration was achieved. The comparison between observed and predicted salinities does not indicate any specific location where the model was consistently not matching observed data. Most importantly, the model was shown to reasonably replicate the front of the saline intrusion as it propagated upstream.

8th South Pacific Stormwater Conference & Expo 2013
Figure 5: Comparison of observed and predicted salinity profiles from CTD-04 (29th January 2009).

8th South Pacific Stormwater Conference & Expo 2013
Figure 6 Observed (left) and predicted (right) salinity distribution for CTD-02 (top), CTD-03 (middle) and CTD-04 (bottom). Note that the distance is relative to the treatment plant intake, with a positive value downstream of the intake.
3.3 MODEL VERIFICATION Once a satisfactory calibrated model was achieved, the model was used to simulate a period where the saline intrusion was actually able to reach the intake. The period simulated was 1st April to 25th April 2009. When comparing the observed and predicted salinities for afternoon measurements taken on 22nd April 2009 (CTD-11), there was very good agreement, with 81% of predicted and observed salinities within 3 PSU. The behaviour of the simulated salt intrusion also matched with the measurements and propagated upstream to the intake. It was concluded that there was a satisfactory agreement between the observed and predicted salinities for both the model calibration and verification. Therefore the model could be used as a good predictive tool for assessing saline intrusion under low river flow conditions.
4 ANALYSIS OF SALINE INTRUSION
To analyse the extent and duration of saline intrusion propagating up to, and past the water intake the following scenarios were simulated:
Distance downstream from intake (m)
Sal
inity
(PS
U)
Dep
th (
m)

8th South Pacific Stormwater Conference & Expo 2013
Long term simulation with historical flows (at Valley Road) and levels (at Whakatane Wharf) as boundary conditions to the model to identify the percentage of time that specified salinities are exceeded at locations along the river.
Low river flows with predicted tidal levels for 1st January to 1st April 2010 and 20th December 2010 to 1st March 2011 (as requested by WDC) to provide a forecast as to when a salinity intrusion event is likely to reach the intake.
A threshold level of salinity of 0.1 PSU was selected which is approximately equivalent to a conductivity of 250 - 300 µS/cm. 0.1 PSU is the acceptable level of salinity for drinking water. 4.1 LONG TERM SIMULATION A long term simulation was carried out for the period 15th January 1986 to 19th July 2009, a duration of 23 years. A time series of the highest salinities (most likely at the bottom of the water column) were extracted along the river and from this the percentage of time the salinity was greater than a specified salinity was calculated. Figure 7 presents an example of the type results generated from the long term simulation, a percentage exceedence plot of salinity at the intake.
Figure 7: Percentage exceedence plots for salinity at selected distances from the intake (Note: Logarithmic scale).
The following was concluded from the results:
The saline intrusion was able to reach the intake (with a salinity greater than or equal to 0.1 PSU), 15% of the time.
The saline intrusion was not able to reach 2,500 m upstream of the intake (with a salinity greater than or equal to 0.1 PSU).

8th South Pacific Stormwater Conference & Expo 2013
Approximately 50% of the time the saline intrusion reaches 4,000m downstream from the intake (with a salinity greater than or equal to 0.1 PSU).
This information was used by WDC to determine a potential water abstraction point for an emergency intake pipe upstream of the permanent intake to use when the permanent intake was unusable during extreme low flow events.
4.2 LOW RIVER FLOW FORECAST SIMULATIONS To provide a forecast to WDC on the potential for saline intrusion to propagate up to the intake, a number of simulations were carried out for the periods:
1st January to 1st April 2010. 20th December 2010 to 1st March 2011.
Simulations were run for constant inflows ranging from 8 to 16 m3/s with a downstream boundary condition based on predicted tides at Whakatane Wharf from MIKE C-MAP (DHI, 2012). The simulation results were then processed and analysed to provide a quantitative prediction of the extent of the salinity intrusion for the two modelled periods. An example of the predicted salinity at the existing intake location at the river bed for 12 m3/s river flow for the period 20th December 2010 to 1st March 2011 is shown in Figure 8. The predicted salinity 0.5 m below the surface at the existing intake location for 8 m3/s river flow for the same period is shown in Figure 9. 0.1 PSU is the acceptable level of salinity for drinking water and is shown as a threshold line (blue) in the time series plots that follow. Table 2 presents the predicted maximum salinity intrusion extent upstream for January 2010. The salinity forecasts from the model were used to warn the operators in advance of the risk of saline intrusion into Whakatane water treatment plant. The simulations were used to predict the timing of the saline intrusion into the plant which helped the operators to plan and maximize the plant operations when fresh water could be abstracted. This ensured adequate storage was available to provide an uninterrupted water supply to the town. WDC provided feedback that a large spike in salinity was recorded at the intake on the 4th January 2010 when the river flow was approximately 9 m3/s. This was predicted by the forecast model for this date, which highlighted the excellent predictive ability of the model.
5 CONCLUSIONS
A hydrodynamic model (MIKE 11 XZ) was developed by DHI to help WDC investigate saline intrusion within Whakatane River and the issues with the water quality of the Whakatane town water supply that occurs during low river flows. The model was calibrated and verified using salinity profile data collected on several occasions upstream and downstream of the water supply intake with a strong agreement between predicted and actual saline intrusion events.

8th South Pacific Stormwater Conference & Expo 2013
Figure 8: Predicted salinity at existing intake at river bed for 12 m3/s river flow for period 20th December 2010 to 1st March 2011 (Note blue line = 0.1 PSU).
Figure 9: Predicted salinity at existing intake at approximately 0.5 m below water surface for 8 m3/s river flow for period 20th December 2010 to 1st March 2011 (Note blue line = 0.1 PSU).
Table 2: Predicted salinity intrusions for January 2010.

8th South Pacific Stormwater Conference & Expo 2013
Flow (m3/s) Approximately 0.2m below surface
River Bed
8 1,900m upstream 2,130m upstream
10 90m upstream 1,770m upstream
11 150m downstream 1,640m upstream
12 250m downstream 1,550m upstream
14 300m downstream 750m upstream
15 810m downstream At intake
16 1,390m downstream 200m downstream
A long term hindcast prediction of saline intrusion within the Whakatane River for 23 years was carried out. A number of forecasts of the saline intrusion with a range of constant low flows were provided for the periods 1st January to 1st April 2010 and 20th December 2010 to 1st March 2011. WDC used the hindcast predictions to determine a possible location for an emergency intake pipe upstream of the permanent intake. The operators of the plant were able to use the forecast predictions to assess when saline intrusion may occur at the Whakatane water treatment plant and maximize the plant operations to provide an uninterrupted supply to the Town. The model predicted a large spike in salinity that occurred at the intake on 4th January 2010, illustrating the robustness of the model as a predictive tool for assessing saline intrusion in Whakatane River.
ACKNOWLEDGEMENTS
The authors wish to thank Whakatane District Council for allowing this work to be presented and Mads Madsen for his support developing the MIKE 11 XZ model.
REFERENCES
DHI (2012): MIKE 11, A Modelling System for Rivers and Channels, Reference Manual, Hørsholm, Denmark.
DHI (2012): MIKE C-MAP, Extraction of World Wide Bathymetry Data and Tidal Information, User Guide, Hørsholm, Denmark.
Jakobsen, F., K.W. Olesen and M. Madsen (2005): A Simple Method to Include Vertical Resolution in a River Model, and Results from an Implementation. Nordic Hydrology Vol 36 No 2 pp 163–174 q IWA Publishing 2005. Wallace, P (2004): Hydraulic Modelling of the Lower Whakatane River and Floodplain. Report prepared for Environment Bay of Plenty.