d epartment of t ourism philippine tourism: gearing for more fun and progress
TRANSCRIPT

DEPARTMENT OF DEPARTMENT OF TOURISMTOURISM
Philippine Tourism: Philippine Tourism: Gearing for More Fun Gearing for More Fun
and Progressand Progress

DEPARTMENT OF DEPARTMENT OF TOURISMTOURISM
Awards and Citations, 2012Awards and Citations, 2012Citations and AwardsCitations and Awards OrganizationOrganization
PH – Top 12 Hottest Destinations in 2013PH – Top 12 Hottest Destinations in 2013 Conde Nast TravellerConde Nast Traveller
PH – One of the 15 Hottest Travel Destinations of PH – One of the 15 Hottest Travel Destinations of 20132013 Travel+LeisureTravel+Leisure
PH – One of the 10 Best Regions to Travel in 2013PH – One of the 10 Best Regions to Travel in 2013 Lonely PlanetLonely Planet
PH – One of the Travel Destinations in 2013PH – One of the Travel Destinations in 2013 Buceadores (Spanish Magazine)Buceadores (Spanish Magazine)
Boracay – Top Destination for RelaxationBoracay – Top Destination for Relaxation Agoda.comAgoda.com
Boracay – 2012 Best Island in the WorldBoracay – 2012 Best Island in the World Travel+LeisureTravel+Leisure
Boracay – Top Best Beach in AsiaBoracay – Top Best Beach in Asia Trip AdvisorTrip Advisor
Tubbataha – CNN Travel’s 50 Best Dive SitesTubbataha – CNN Travel’s 50 Best Dive Sites CNN WorldCNN World
Palawan – No. 4 Holiday Destination in AsiaPalawan – No. 4 Holiday Destination in Asia Smart Travel AsiaSmart Travel Asia
PH – Best Diving DestinationPH – Best Diving Destination Marine Diving Fair – TokyoMarine Diving Fair – Tokyo
Gold Award for Creative Theme DevelopmentGold Award for Creative Theme Development Expo 2012 – Yeosu, KoreaExpo 2012 – Yeosu, Korea
PH - Best Outbound Tourist Destinations in ChinaPH - Best Outbound Tourist Destinations in China Oriental Morning Post Oriental Morning Post (Consumer Poll)(Consumer Poll)

DEPARTMENT OF DEPARTMENT OF TOURISMTOURISM
International Visitor Arrivals, International Visitor Arrivals, 20122012
Visitor arrivals In thousandsVisitor arrivals In thousands
GrowthGrowthRateRate
11.5%11.5%
4.5%4.5%
9.9%9.9%
3.1%3.1%
19.1%19.1%
12.0%12.0%
7.6%7.6%
5.3%5.3%
5.9%5.9%
23.8%23.8%
8.4%8.4%
9.5%9.5%
3.5 M3.5 M
3.9 M3.9 M
4.3 M4.3 M
3.0 M3.0 M3.1 M3.1 M
CAGR = 6.7%CAGR = 6.7%
10.0 M10.0 M
8.2 M8.2 M 6.8 M6.8 M
5.5 M5.5 M4.3 M4.3 M
3.9 M3.9 M
CAGR = 23.5%CAGR = 23.5%

DEPARTMENT OF DEPARTMENT OF TOURISMTOURISM
International Visitor ReceiptsInternational Visitor Receipts
In US$ MillionIn US$ Million
CAGR = 5.2%CAGR = 5.2%
CAGR = 29.6%CAGR = 29.6%

DEPARTMENT OF DEPARTMENT OF TOURISMTOURISM
13 of 26
Key Markets Profile, 2012Key Markets Profile, 2012KOREAN VISITORSKOREAN VISITORS
SexSex
MaleMale 55.5%55.5%
FemaleFemale 41.9%41.9%
Median AgeMedian Age 34.634.6
Average Daily Expenditure (US$)Average Daily Expenditure (US$) 139.5139.5
Average Length of Stay (Nights)Average Length of Stay (Nights) 5.65.6
Travel ArrangementsTravel Arrangements
PackagePackage 53.6%53.6%
IndependentIndependent 45.4%45.4%
Purpose of VisitPurpose of Visit
HolidayHoliday 61.0%61.0%
BusinessBusiness 5.5%5.5%
OthersOthers 2.3%2.3%
Activities UndertakenActivities Undertaken
ShoppingShopping 91.2%91.2%
SightseeingSightseeing 37.7%37.7%
Beach HolidayBeach Holiday 13.7%13.7%
JAPANESE VISITORSJAPANESE VISITORS
SexSex
MaleMale 74.8%74.8%
FemaleFemale 23.5%23.5%
Median AgeMedian Age 39.739.7
Average Daily Expenditure (US$)Average Daily Expenditure (US$) 94.294.2
Average Length of Stay (Nights)Average Length of Stay (Nights) 5.45.4
Travel ArrangementsTravel Arrangements
PackagePackage 3.2%3.2%
IndependentIndependent 95.8%95.8%
Purpose of VisitPurpose of Visit
HolidayHoliday 55.1%55.1%
BusinessBusiness 15.2%15.2%
Visit Friends and RelativesVisit Friends and Relatives 1.5%1.5%
Activities UndertakenActivities Undertaken
ShoppingShopping 58.9%58.9%
SightseeingSightseeing 1.4%1.4%
SportsSports 1.4%1.4%
CHINESE VISITORSCHINESE VISITORS
SexSex
MaleMale 53.8%53.8%
FemaleFemale 44.4%44.4%
Median AgeMedian Age 34.734.7
Average Daily Expenditure (US$)Average Daily Expenditure (US$) 55.655.6
Average Length of Stay (Nights)Average Length of Stay (Nights) 8.68.6
Travel ArrangementsTravel Arrangements
PackagePackage 15.7%15.7%
IndependentIndependent 84.3%84.3%
Purpose of VisitPurpose of Visit
HolidayHoliday 58.9%58.9%
BusinessBusiness 7.6%7.6%
OthersOthers 1.4%1.4%
Activities UndertakenActivities Undertaken
ShoppingShopping 91.7%91.7%
Visit Friends and RelativesVisit Friends and Relatives 19.4%19.4%
SightseeingSightseeing 18.7%18.7%
DEPARTMENT OF DEPARTMENT OF TOURISMTOURISM
13 of 26
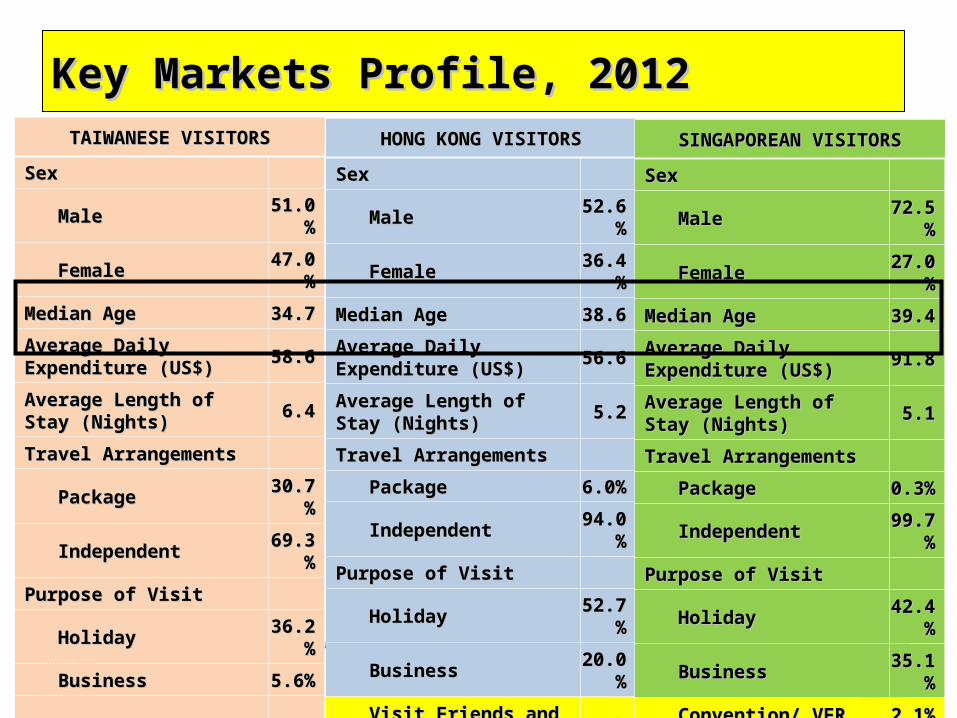
Key Markets Profile, 2012Key Markets Profile, 2012TAIWANESE VISITORSTAIWANESE VISITORS
SexSex
MaleMale 51.0%51.0%
FemaleFemale 47.0%47.0%
Median AgeMedian Age 34.734.7
Average Daily Expenditure (US$)Average Daily Expenditure (US$) 58.658.6
Average Length of Stay (Nights)Average Length of Stay (Nights) 6.46.4
Travel ArrangementsTravel Arrangements
PackagePackage 30.7%30.7%
IndependentIndependent 69.3%69.3%
Purpose of VisitPurpose of Visit
HolidayHoliday 36.2%36.2%
BusinessBusiness 5.6%5.6%
Activities UndertakenActivities Undertaken
ShoppingShopping 86.1%86.1%
SightseeingSightseeing 22.8%22.8%
Visit Friends and RelativesVisit Friends and Relatives 17.5%17.5%
HONG KONG VISITORSHONG KONG VISITORS
SexSex
MaleMale 52.6%52.6%
FemaleFemale 36.4%36.4%
Median AgeMedian Age 38.638.6
Average Daily Expenditure (US$)Average Daily Expenditure (US$) 56.656.6
Average Length of Stay (Nights)Average Length of Stay (Nights) 5.25.2
Travel ArrangementsTravel Arrangements
PackagePackage 6.0%6.0%
IndependentIndependent 94.0%94.0%
Purpose of VisitPurpose of Visit
HolidayHoliday 52.7%52.7%
BusinessBusiness 20.0%20.0%
Visit Friends and RelativesVisit Friends and Relatives 1.5%1.5%
Activities UndertakenActivities Undertaken
ShoppingShopping 31.0%31.0%
SightseeingSightseeing 23.3%23.3%
Beach HolidayBeach Holiday 4.3%4.3%
SINGAPOREAN VISITORSSINGAPOREAN VISITORS
SexSex
MaleMale 72.5%72.5%
FemaleFemale 27.0%27.0%
Median AgeMedian Age 39.439.4
Average Daily Expenditure (US$)Average Daily Expenditure (US$) 91.891.8
Average Length of Stay (Nights)Average Length of Stay (Nights) 5.15.1
Travel ArrangementsTravel Arrangements
PackagePackage 0.3%0.3%
IndependentIndependent 99.7%99.7%
Purpose of VisitPurpose of Visit
HolidayHoliday 42.4%42.4%
BusinessBusiness 35.1%35.1%
Convention/ VFRConvention/ VFR 2.1%2.1%
Activities UndertakenActivities Undertaken
ShoppingShopping 26.0%26.0%
SightseeingSightseeing 23.3%23.3%
Visit Friends and RelativesVisit Friends and Relatives 3.4%3.4%

DEPARTMENT OF DEPARTMENT OF TOURISMTOURISM
13 of 26
Key Markets Profile, 2012Key Markets Profile, 2012AMERICAN VISITORSAMERICAN VISITORS
SexSex
MaleMale 54.5%54.5%
FemaleFemale 45.1%45.1%
Median AgeMedian Age 41.041.0
Average Daily Expenditure (US$)Average Daily Expenditure (US$) 98.698.6
Average Length of Stay (Nights)Average Length of Stay (Nights) 14.514.5
Travel ArrangementsTravel Arrangements
PackagePackage 0.8%0.8%
IndependentIndependent 99.2%99.2%
Purpose of VisitPurpose of Visit
HolidayHoliday 54.5%54.5%
Visit Friends and RelativesVisit Friends and Relatives 9.2%9.2%
BusinessBusiness 8.1%8.1%
Activities UndertakenActivities Undertaken
ShoppingShopping 47.4%47.4%
SightseeingSightseeing 26.0%26.0%
Beach HolidayBeach Holiday 10.0%10.0%
CANADIAN VISITORSCANADIAN VISITORS
SexSex
MaleMale 49.8%49.8%
FemaleFemale 49.9%49.9%
Median AgeMedian Age 39.639.6
Average Daily Expenditure (US$)Average Daily Expenditure (US$) 79.879.8
Average Length of Stay (Nights)Average Length of Stay (Nights) 16.316.3
Travel ArrangementsTravel Arrangements
PackagePackage 3.0%3.0%
IndependentIndependent 97.0%97.0%
Purpose of VisitPurpose of Visit
HolidayHoliday 64.0%64.0%
Visit Friends and RelativesVisit Friends and Relatives 6.5%6.5%
BusinessBusiness 3.9%3.9%
Activities UndertakenActivities Undertaken
ShoppingShopping 53.0%53.0%
SightseeingSightseeing 38.1%38.1%
Beach HolidayBeach Holiday 9.5%9.5%
AUSTRALIAN VISITORSAUSTRALIAN VISITORS
SexSex
MaleMale 62.3%62.3%
FemaleFemale 17.2%17.2%
Median AgeMedian Age 39.939.9
Average Daily Expenditure (US$)Average Daily Expenditure (US$) 96.696.6
Average Length of Stay (Nights)Average Length of Stay (Nights) 15.015.0
Travel ArrangementsTravel Arrangements
PackagePackage 2.3%2.3%
IndependentIndependent 97.3%97.3%
Purpose of VisitPurpose of Visit
HolidayHoliday 64.3%64.3%
BusinessBusiness 11.6%11.6%
Visit Friends and RelativesVisit Friends and Relatives 6.4%6.4%
Activities UndertakenActivities Undertaken
ShoppingShopping 60.1%60.1%
Visit Friends and RelativesVisit Friends and Relatives 40.8%40.8%
Beach HolidayBeach Holiday 12.2%12.2%

DEPARTMENT OF DEPARTMENT OF TOURISMTOURISM
13 of 26
Key Markets Profile, 2012Key Markets Profile, 2012UNITED KINGDOM VISITORSUNITED KINGDOM VISITORS
SexSex
MaleMale 63.2%63.2%
FemaleFemale 36.3%36.3%
Median AgeMedian Age 39.339.3
Average Daily Expenditure (US$)Average Daily Expenditure (US$) 74.274.2
Average Length of Stay (Nights)Average Length of Stay (Nights) 15.115.1
Travel ArrangementsTravel Arrangements
PackagePackage 2.9%2.9%
IndependentIndependent 97.1%97.1%
Purpose of VisitPurpose of Visit
HolidayHoliday 63.9%63.9%
BusinessBusiness 11.4%11.4%
Visit Friends and RelativesVisit Friends and Relatives 3.2%3.2%
Activities UndertakenActivities Undertaken
SightseeingSightseeing 46.3%46.3%
ShoppingShopping 46.1%46.1%
Beach HolidayBeach Holiday 14.1%14.1%
GERMAN VISITORSGERMAN VISITORS
SexSex
MaleMale 64.9%64.9%
FemaleFemale 34.4%34.4%
Median AgeMedian Age 40.240.2
Average Daily Expenditure (US$)Average Daily Expenditure (US$) 78.978.9
Average Length of Stay (Nights)Average Length of Stay (Nights) 15.715.7
Travel ArrangementsTravel Arrangements
PackagePackage 2.7%2.7%
IndependentIndependent 97.3%97.3%
Purpose of VisitPurpose of Visit
HolidayHoliday 86.9%86.9%
BusinessBusiness 10.3%10.3%
Visit Friends and RelativesVisit Friends and Relatives 3.9%3.9%
Activities UndertakenActivities Undertaken
SightseeingSightseeing 49.2%49.2%
ShoppingShopping 45.4%45.4%
Scuba DivingScuba Diving 16.0%16.0%
OVERSEAS FILIPINOS VISITORSOVERSEAS FILIPINOS VISITORS
SexSex
MaleMale 31.5%31.5%
FemaleFemale 68.3%68.3%
Median AgeMedian Age 39.039.0
Average Daily Expenditure (US$)Average Daily Expenditure (US$) 40.440.4
Average Length of Stay (Nights)Average Length of Stay (Nights) 23.423.4
Travel ArrangementsTravel Arrangements
PackagePackage 0.0%0.0%
IndependentIndependent 100%100%
Purpose of VisitPurpose of Visit
HolidayHoliday 52.2%52.2%
Visit Friends and RelativesVisit Friends and Relatives 8.0%8.0%
OthersOthers 7.5%7.5%
Activities UndertakenActivities Undertaken
ShoppingShopping 62.4%62.4%
SightseeingSightseeing 30.4%30.4%
Beach HolidayBeach Holiday 14.4%14.4%

DEPARTMENT OF DEPARTMENT OF TOURISMTOURISM
Foreign Markets, 2012 and 2013Foreign Markets, 2012 and 2013
MarketsMarkets 20122012 20132013
KoreaKorea 1,031.1551,031.155 1,252,7891,252,789
USAUSA 652,626652,626 860,248860,248
JapanJapan 412,474412,474 445,364445,364
ChinaChina 250,883250,883 260,000260,000
ASEANASEAN 375,189375,189 546,701546,701
AustraliaAustralia 191,150191,150 260,055260,055
TaiwanTaiwan 216,511216,511 271,696271,696
Hong KongHong Kong 118,666118,666 169,169169,169
MarketsMarkets 20122012 20132013
CanadaCanada 123,699123,699 150,778150,778
United KingdomUnited Kingdom 113,282113,282 134,959134,959
GermanyGermany 67,02367,023 78,16978,169
IndiaIndia 46,39046,390 66,29766,297
RussiaRussia 28,27028,270 39,66639,666
ScandinaviaScandinavia 54,93554,935 78,43778,437
OthersOthers 590,558590,558 931,664931,664
TotalTotal 4,272,8114,272,811 5,545,9935,545,993

DEPARTMENT OF DEPARTMENT OF TOURISMTOURISM
Domestic TravellersDomestic Travellers
Domestic Travellers In thousandsDomestic Travellers In thousands
30.3 M30.3 M
37.5 M37.5 M40.7 M*40.7 M*
25.0 M25.0 M24.4 M24.4 M
CAGR = 6.1%CAGR = 6.1%
56.0M56.0M
51.7M51.7M
47.0M47.0M44.7M44.7M
40.7M40.7M37.5M37.5M
CAGR = 10.6%CAGR = 10.6%
* Estimate* Estimate
TotalTotal
974,397974,397 19.6%19.6%
702,798702,798 14.1%14.1%
613,279613,279 12.3%12.3%
396,289396,289 8.0%8.0%
359,320359,320 7.2%7.2%
338,992338,992 6.8%6.8%
290,845290,845 5.9%5.9%
281,243281,243 5.7%5.7%
200,295200,295 4.0%4.0%
184,362184,362 3.7%3.7%
171,823171,823 3.5%3.5%
152,377152,377 3.1%3.1%
151,454151,454 3.0%3.0%
150,067150,067 3.0%3.0%
DEPARTMENT OF DEPARTMENT OF TOURISMTOURISM
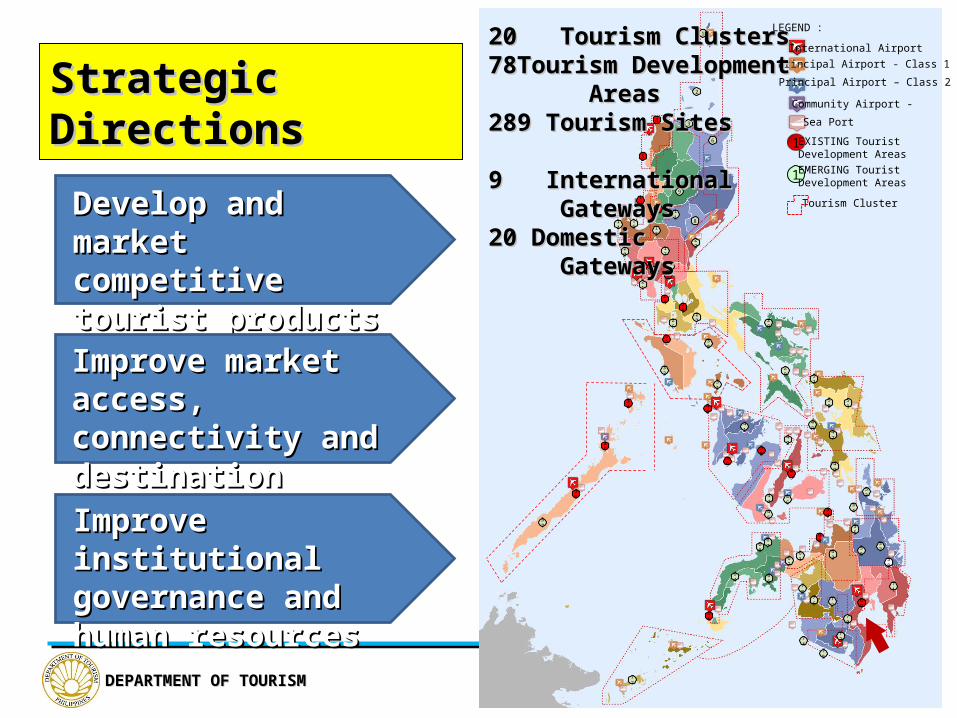
Develop and market Develop and market competitive tourist competitive tourist products and destinationsproducts and destinations
Improve market access, Improve market access, connectivity and connectivity and destination infrastructuredestination infrastructure
Improve institutional Improve institutional governance and human governance and human resourcesresources
2
34
5
12
7
8
9
10
16
14
17
1823
22
19
1
6
25
27
24
26
3230
33
34
35
36
37
31
29
28
40
39
38
43
4644
42
49
50 51
47
48
60
61 63
59
55
53
5657
54
58
70
69
75
72
7473
76
78
65
64
6768
77
11
1315
20
21
45
52
62
6671
41
LEGEND :
1 EXISTING TouristDevelopment Areas
1 EMERGING TouristDevelopment Areas
International AirportPrincipal Airport - Class 1
Principal Airport – Class 2
Community Airport -
Sea Port
Tourism Cluster
Strategic Strategic DirectionsDirections
20 Tourism Clusters20 Tourism Clusters7878Tourism DevelopmentTourism Development AreasAreas289 Tourism Sites289 Tourism Sites
9 International9 International GatewaysGateways20 Domestic20 Domestic GatewaysGateways

DEPARTMENT OF DEPARTMENT OF TOURISMTOURISM
NatureNature TourismTourism
Cultural Cultural TourismTourism
Sun and Beach Sun and Beach TourismTourism Cruise and Cruise and
Nautical TourismNautical TourismLeisure and Leisure and Entertainment Entertainment TourismTourism
MICE & Events MICE & Events TourismTourism
Health,Wellness, Health,Wellness, and Retirement and Retirement TourismTourism
Diving & Marine Diving & Marine Sports TourismSports Tourism
Education Education TourismTourism
Product PortfolioProduct Portfolio

DEPARTMENT OF DEPARTMENT OF TOURISMTOURISM
Room Capacity, 2012Room Capacity, 2012
DestinationsDestinations Available Available RoomRoom
Number of Number of EstablishmentsEstablishments
Northern PHNorthern PH 71,80471,804 2,2482,248
NCRNCR 31,79031,790 320320
Central LuzonCentral Luzon 15,02415,024 489489
Other RegionsOther Regions 24,99024,990 1,4391,439
New Accommodation Facilities in 2012New Accommodation Facilities in 2012
NameName RoomsRooms
Fairmont Hotel and Raffles SuitesFairmont Hotel and Raffles Suites 549549
Quest Hotels & Conference Ctr CebuQuest Hotels & Conference Ctr Cebu 427427
Calyx Center – CebuCalyx Center – Cebu 221221
Bellevue Resort - BoholBellevue Resort - Bohol 159159
Tunes Hotel – CebuTunes Hotel – Cebu 150150
Luxent Hotel – Quezon CityLuxent Hotel – Quezon City 116116
Dohera Hotel – CebuDohera Hotel – Cebu 100100
Microtel Accropolis – Quezon CityMicrotel Accropolis – Quezon City 8484
Hotel Expansion Program in Select DestinationsHotel Expansion Program in Select Destinations
NameName Additional RoomsAdditional Rooms
Aklan (Boracay Island)Aklan (Boracay Island) 1,5991,599
Bohol (Panglao Island)Bohol (Panglao Island) 1,2501,250
Metro ManilaMetro Manila 1,1231,123
Cebu/ Lapu Lapu/ Mandaue Cebu/ Lapu Lapu/ Mandaue 646646
Central PHCentral PH 61,97861,978 3,2203,220
Western VisayasWestern Visayas 15,20015,200 635635
Central VisayasCentral Visayas 27,44727,447 1,3061,306
Other RegionsOther Regions 19,33119,331 1,2791,279
Southern PHSouthern PH 28,92228,922 1,4051,405
Northern MindanaoNorthern Mindanao 8,1138,113 380380
Southern MindanaoSouthern Mindanao 9,6139,613 404404
Other RegionsOther Regions 11,19611,196 621621
Total PHTotal PH 162,704162,704 6,8736,873

DEPARTMENT OF DEPARTMENT OF TOURISMTOURISM
Room Projection in 2016Room Projection in 2016
Destination Destination ClustersClustersIsland Island
GroupingGrouping
Room Room Demand Demand in 2016in 2016
Northern PHNorthern PH 80,49380,493
Central PHCentral PH 82,17982,179
Southern PHSouthern PH 20,46120,461
Total PHTotal PH 183,134183,134
Critical Cluster Critical Cluster DestinationsDestinations
Room Room DemandDemand
Available Available RoomRoom
In the In the PipelinePipeline
Room Room GapGap
Metro Manila & Metro Manila & CALABARZONCALABARZON 54,81854,818 37,31137,311 7,3307,330 10,17710,177
Central VisayasCentral Visayas 41,40241,402 27,44727,447 2,1242,124 11,83111,831
BicolBicol 15,80415,804 8,5498,549 130130 7,1257,125
CordilleraCordillera 9,8519,851 6,8556,855 106106 2,8902,890
• Manila will still need the most Manila will still need the most rooms between now and 2016rooms between now and 2016
• Key demand cities outside of Key demand cities outside of Manila are: Cebu, Panglao, Manila are: Cebu, Panglao, Bicol, CordilleraBicol, Cordillera
• Current accommodation Current accommodation development in the pipeline development in the pipeline covers only 40% of room covers only 40% of room requirement requirement
Room SupplyRoom Supply(Available + Pipeline - Excess)(Available + Pipeline - Excess)
Available Available in 2012in 2012
In the In the Pipeline Pipeline
Excess Excess RoomRoom
Total Total Room Room
71,80471,804 8,2068,206 15,54215,542 64,46864,468
61,97861,978 5,1295,129 5,6855,685 61,42261,422
28,92228,922 1,6861,686 10,71710,717 19,89119,891
162,704162,704 15,02115,021 31,94331,943 145,782145,782
Room Gap Room Gap In CriticalIn Critical
DestinationDestinationClustersClusters
16,02516,025
20,75720,757
570570
37,35237,352

DEPARTMENT OF DEPARTMENT OF TOURISMTOURISM
CongestionCongestion
Taxes & FeesTaxes & Fees
Budget TerminalBudget Terminal
New TerminalNew Terminal
Premier GatewayPremier Gateway
Connectivity and Destination InfrastructureConnectivity and Destination Infrastructure
Secondary GatewaysSecondary Gateways
SafetySafety
Modular Terminal Modular Terminal Modular Capacity Airport Terminal.pptModular Capacity Airport Terminal.ppt
Priority AirportsPriority Airports
ClusterCluster AirportsAirports
Metro ManilaMetro Manila NAIANAIA
Central VisayasCentral Visayas Mactan-CebuMactan-Cebu
Western VisayasWestern Visayas Kalibo/ IloiloKalibo/ Iloilo
Central LuzonCentral Luzon ClarkClark
Davao GulfDavao Gulf DavaoDavao
PalawanPalawan Puerto PrincesaPuerto Princesa
Cagayan de OroCagayan de Oro LaguindinganLaguindingan
Laoag-ViganLaoag-Vigan LaoagLaoag
New AirportsNew Airports
Central VisayasCentral Visayas BoholBohol
BicolBicol DaragaDaraga

DEPARTMENT OF DEPARTMENT OF TOURISMTOURISM
Night LandingNight Landing
Connectivity and Destination InfrastructureConnectivity and Destination Infrastructure
Air SeatsAir Seats
Market AccessMarket Access
Domestic GatewaysDomestic Gateways
Travel FormalitiesTravel Formalities
Terminal UpgradeTerminal Upgrade
Navigational AidNavigational Aid
Priority AirportsPriority Airports
ClusterCluster AirportsAirports
Central VisayasCentral Visayas TagbilaranTagbilaran
Leyte-SamarLeyte-Samar Tacloban, Borongan, Tacloban, Borongan, CatarmanCatarman
Siargao-DinagatSiargao-Dinagat SiargaoSiargao
BicolBicol Daet, Pili, Legaspi, Naga, Daet, Pili, Legaspi, Naga, MasbateMasbate
BatanesBatanes BatanesBatanes
Marinduque-Marinduque-Romblon-MindoroRomblon-Mindoro
Marinduque, Tugdan, Marinduque, Tugdan, San JoseSan Jose
Agusan RiverAgusan River ButuanButuan
ZamboangaZamboanga Zamboanga, DipologZamboanga, Dipolog
CotabatoCotabato MlangMlang
DEPARTMENT OF DEPARTMENT OF TOURISMTOURISM
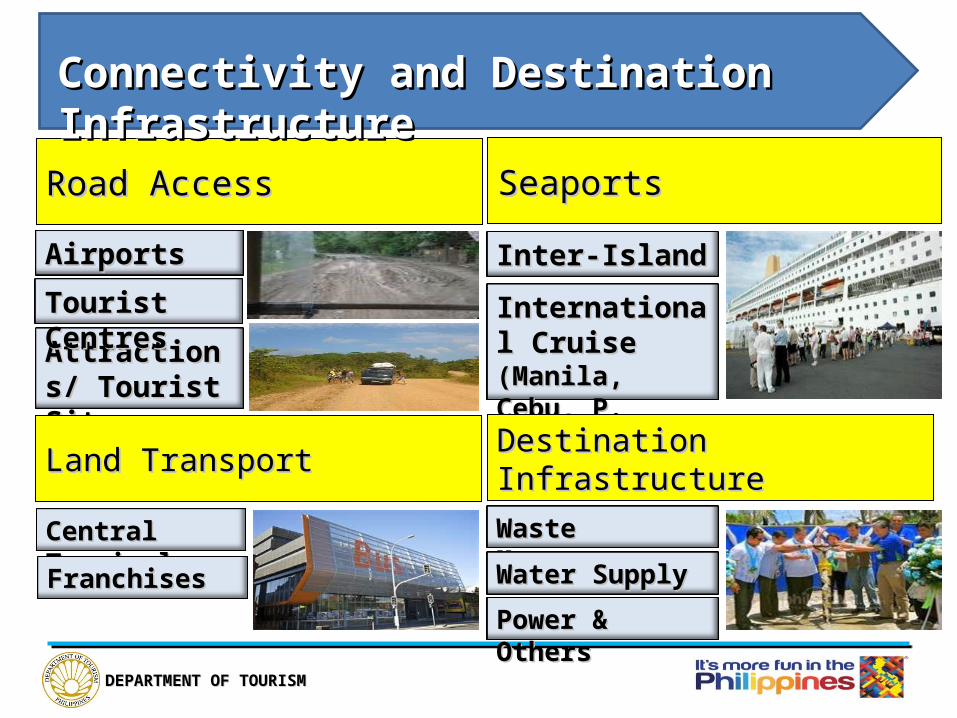
AirportsAirports
Attractions/ Attractions/ Tourist SitesTourist Sites
International International Cruise Cruise (Manila, (Manila, Cebu, P. Princesa)Cebu, P. Princesa)
Inter-IslandInter-Island
Road AccessRoad Access
Waste ManagementWaste Management
Connectivity and Destination InfrastructureConnectivity and Destination Infrastructure
Central TerminalsCentral Terminals
Seaports Seaports
Land TransportLand Transport Destination InfrastructureDestination Infrastructure
Tourist CentresTourist Centres
FranchisesFranchises Water SupplyWater Supply
Power & OthersPower & Others
DEPARTMENT OF DEPARTMENT OF TOURISMTOURISM
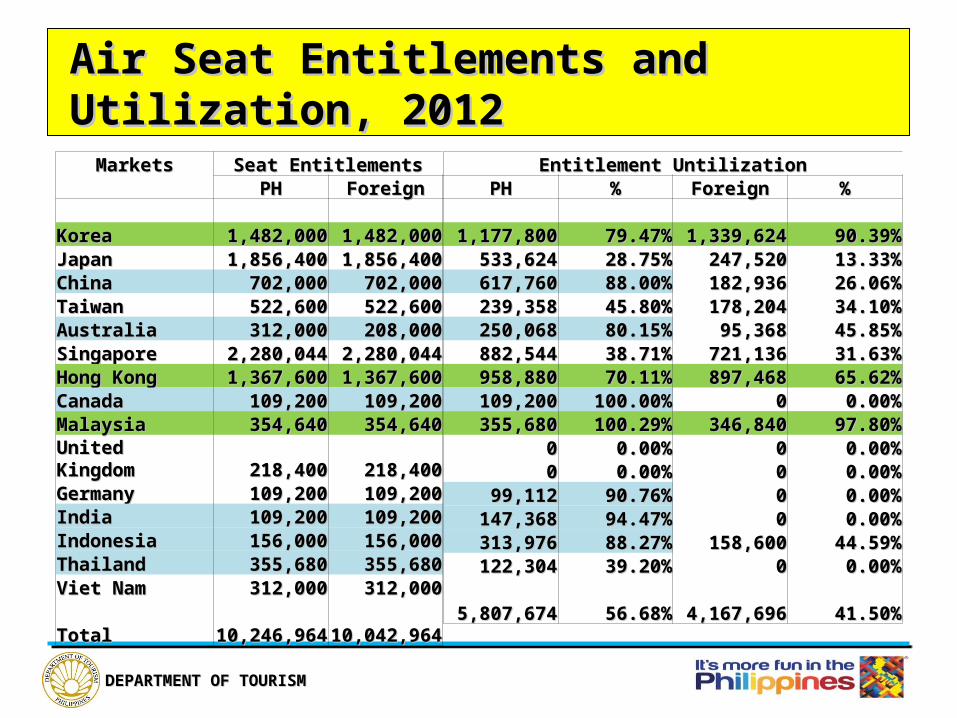
Air Seat Entitlements and Air Seat Entitlements and Utilization, 2012Utilization, 2012
MarketsMarkets Seat EntitlementsSeat Entitlements PHPH ForeignForeign
KoreaKorea 1,482,0001,482,000 1,482,0001,482,000JapanJapan 1,856,4001,856,400 1,856,4001,856,400ChinaChina 702,000702,000 702,000702,000TaiwanTaiwan 522,600522,600 522,600522,600AustraliaAustralia 312,000312,000 208,000208,000SingaporeSingapore 2,280,0442,280,044 2,280,0442,280,044Hong KongHong Kong 1,367,6001,367,600 1,367,6001,367,600CanadaCanada 109,200109,200 109,200109,200MalaysiaMalaysia 354,640354,640 354,640354,640United KingdomUnited Kingdom 218,400218,400 218,400218,400GermanyGermany 109,200109,200 109,200109,200IndiaIndia 109,200109,200 109,200109,200IndonesiaIndonesia 156,000156,000 156,000156,000ThailandThailand 355,680355,680 355,680355,680Viet NamViet Nam 312,000312,000 312,000312,000 TotalTotal 10,246,96410,246,964 10,042,96410,042,964
Entitlement UntilizationEntitlement UntilizationPHPH %% ForeignForeign %%
1,177,8001,177,800 79.47%79.47% 1,339,6241,339,624 90.39%90.39%
533,624533,624 28.75%28.75% 247,520247,520 13.33%13.33%617,760617,760 88.00%88.00% 182,936182,936 26.06%26.06%239,358239,358 45.80%45.80% 178,204178,204 34.10%34.10%250,068250,068 80.15%80.15% 95,36895,368 45.85%45.85%882,544882,544 38.71%38.71% 721,136721,136 31.63%31.63%958,880958,880 70.11%70.11% 897,468897,468 65.62%65.62%109,200109,200 100.00%100.00% 00 0.00%0.00%355,680355,680 100.29%100.29% 346,840346,840 97.80%97.80%
00 0.00%0.00% 00 0.00%0.00%00 0.00%0.00% 00 0.00%0.00%
99,11299,112 90.76%90.76% 00 0.00%0.00%147,368147,368 94.47%94.47% 00 0.00%0.00%313,976313,976 88.27%88.27% 158,600158,600 44.59%44.59%122,304122,304 39.20%39.20% 00 0.00%0.00%
5,807,6745,807,674 56.68%56.68% 4,167,6964,167,696 41.50%41.50%

DEPARTMENT OF DEPARTMENT OF TOURISMTOURISM
Target, 2012 - 2016Target, 2012 - 2016
IndicatorsIndicators 20122012 20132013 20142014 20152015 20162016
International TourismInternational Tourism
Visitor Arrivals (mil)Visitor Arrivals (mil) 4.64.6 5.55.5 6.86.8 8.28.2 10.010.0
Length of Stay (nights)Length of Stay (nights) 8.08.0 8.08.0 8.08.0 8.08.0 8.08.0
Average Daily Expenditure (Pesos)Average Daily Expenditure (Pesos) 4,431.04,431.0 4,914.04,914.0 5,431.05,431.0 5,939.95,939.9 6,470.06,470.0
Visitor Receipts (Pesos bil)Visitor Receipts (Pesos bil) 156.0156.0 205.4205.4 269.9269.9 350.4350.4 455.0455.0
Domestic TourismDomestic Tourism
Domestic Travellers (mil)Domestic Travellers (mil) 40.740.7 44.144.1 47.747.7 51.751.7 56.156.1
Domestic Trips (mil)Domestic Trips (mil) 162.7162.7 176.2176.2 191.0191.0 206.9206.9 224.2224.2
Length of Stay (nights)Length of Stay (nights) 4.74.7 4.74.7 4.74.7 4.74.7 4.74.7
Average Daily Expenditure (Pesos)Average Daily Expenditure (Pesos) 2,469.02,469.0 2,580.02,580.0 2,593.02,593.0 2,739.02,739.0 2,922.02,922.0
Domestic Receipts (Pesos bil)Domestic Receipts (Pesos bil) 1,152.01,152.0 1,298.61,298.6 1,409.21,409.2 1,607.11,607.1 1,852.11,852.1

DEPARTMENT OF DEPARTMENT OF TOURISMTOURISM
Economic Impact Projection, 2012 - 2016Economic Impact Projection, 2012 - 2016
IndicatorsIndicators 20122012 20132013 20142014 20152015 20162016
Gross Domestic ProductGross Domestic Product
Total Visitor Receipts (Pesos bil)Total Visitor Receipts (Pesos bil) 1,308.01,308.0 1,504.01,504.0 1,679.11,679.1 1,957.51,957.5 2,307.12,307.1
Tourism GVA (Pesos bil)Tourism GVA (Pesos bil) 650.8650.8 748.3748.3 835.4835.4 974.0974.0 1,147.91,147.9
Share to GDP (%)Share to GDP (%) 6.26.2 6.76.7 7.07.0 7.87.8 8.78.7
EmploymentEmployment
Tourism employment (mil)Tourism employment (mil) 4.24.2 4..94..9 5.45.4 6.36.3 7.47.4
Share to National Employment (%)Share to National Employment (%) 11.611.6 13.013.0 14.214.2 16.216.2 18.818.8

DEPARTMENT OF DEPARTMENT OF TOURISMTOURISM
Thank Thank you!you!
DEPARTMENT OF DEPARTMENT OF TOURISMTOURISM
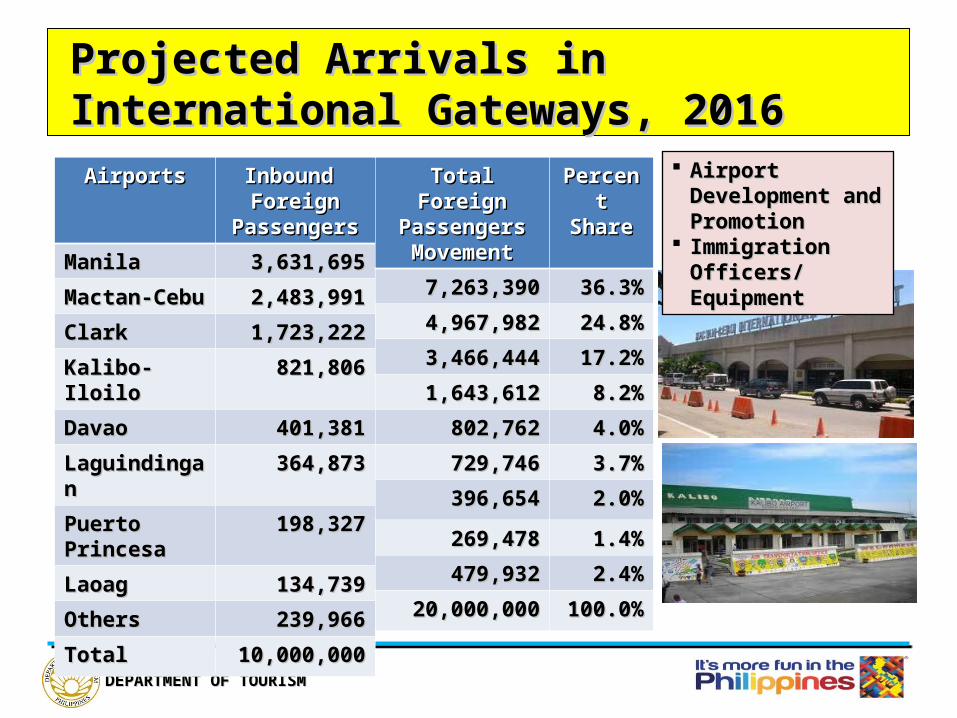
Projected Arrivals in International Projected Arrivals in International Gateways, 2016Gateways, 2016
AirportsAirports Inbound Inbound Foreign Foreign
PassengersPassengers
ManilaManila 3,631,6953,631,695
Mactan-CebuMactan-Cebu 2,483,9912,483,991
ClarkClark 1,723,2221,723,222
Kalibo-IloiloKalibo-Iloilo 821,806821,806
DavaoDavao 401,381401,381
LaguindinganLaguindingan 364,873364,873
Puerto PrincesaPuerto Princesa 198,327198,327
LaoagLaoag 134,739134,739
OthersOthers 239,966239,966
TotalTotal 10,000,00010,000,000
Airport Development Airport Development and Promotionand Promotion
Immigration Officers/ Immigration Officers/ EquipmentEquipment
Total Foreign Total Foreign Passengers Passengers MovementMovement
Percent Percent ShareShare
7,263,3907,263,390 36.3%36.3%
4,967,9824,967,982 24.8%24.8%
3,466,4443,466,444 17.2%17.2%
1,643,6121,643,612 8.2%8.2%
802,762802,762 4.0%4.0%
729,746729,746 3.7%3.7%
396,654396,654 2.0%2.0%
269,478269,478 1.4%1.4%
479,932479,932 2.4%2.4%
20,000,00020,000,000 100.0%100.0%