d. c. wrrc report no. 100 the anacostia river
TRANSCRIPT

D. C. WRRC REPORT NO. 100
THE ANACOSTIA RIVER: ECOLOGICAL STUDIES OF WATER POLLUTION BIOLOGY
BY
DR. VICTORIA C. GUERRERO
A FINAL REPORT
USGS GRANT AGREEMENT NO.
MARCH 1991
"The research on which the report is based was financed in part by the United States Department of the Interior, Office of Geological Survey through the D. C. Water Resources Research Center." "The contents of the publication do not necessarily reflect the views and policies of the United States Department of the Interior, nor does mention of trade name or commercial products constitute their endorsement by the U. S. Government."

TABLE OF CONTENTS

TABLE OF CONTENTS
Abstract 1. Introduction 1
1.1 Review of Literature 2 2. Objectives and Scope of the Study 3 3. Methodology 4
3.1 Sampling Procedure 3.2 Water Quality 3.3 Water Chemistry 3.4 Soil Chemistry 3.5 Biological Analysis 3.6 Descriptive Statistics
4. Results 6 5. Discussions and Conclusion 12
A. Water Quality
5.1 Temperature 5.2 pH 5.3 Dissolved Oxygen (DO) 5.4 Conductivity 5.5 Turbidity 5.6 Plankton, Turbidity, and Sediment 5.7 Storm Water Quality
B. Chemical Analysis 13 C. Physical Analysis 16 D. Biological Analysis 10
5.8 Coliform 5.9 Plankton and Benthos 5.10 Benthos 5.11 Plankton 5.12 Plankton Productivity 5.13 Benthos Productivity

Conclusion 29
6. References 30 7. Appendix 8. Photographs 83

LIST OF FIGURES
LIST OF FIGURES
FIGURE 1.0 The map of Anacostia River 36a
FIGURE 1.0A Station locations in the Anacostia River 36b
FIGURE 2.0 Temperature in the different stations from 37 1988 to 1990 A. 1988 B. 1989 C. 1990 FIGURE 3.0 Temperature and pH in the different stations 38
A. 1988 B. 1989 C. 1990
FIGURE 4.0 Relationship between dissolved oxygen and pH 39
A. 1988 B. 1989 40 - 43 C. 1990 FIGURE 5.0 Relationship between conductivity and pH 44 - 46
A. 1988 B. 1989 C. 1990 FIGURE 6.0 Alkalinity in the different stations from 47
1988 to 1990 A. 1988 B. 1989 C. 1990 FIGURE 7.0 Relationship between dissolved oxygen and 48
temperature A. 1988 49
B. 1989 C. 1990
FIGURE 8.0 Relationship between temperature and conductivity 50
A. 1988 51 B. 1989 52

FIGURE 9.0 Plankton species identified from April 1988 to 53 March 1990 FIGURE 10.0 Benthic species identified from April 1988 to 54 March 1990
Relationship between alkalinity and carbon FIGURE 11.0 55 dioxide in the different stations FIGURE 12.0 Relationship between alkalinity and calcium 56 ab in the different stations A. 1988 B. 1989 57-58
- 12.0 C. Relationship between dissolved oxygen and FIGUREconductivity, 1988
D. 1989, Dissolved oxygen and conductivityE. 1990, Dissolved oxygen and conductivityF. Carbon dioxide in stations-(1988 -- 1990)G. Coliform
iv

LIST OF PHOTOGRAPHS

LIST OF PHOTOGRAPHS
PAGES FIGURE 13.0 Anacostia River, collecting station # 4 83
FIGURE 14.0 Watts Branch at Anacostia River, Station # 5 84
FIGURE 15.0 South Side of Station # 8, Hickey Run 85
FIGURE 16.0 Sediment build -up, Station # 8, Hickey Run 86
FIGURE 17.0 Station # 12 on Kingman Island 87
FIGURE 18.0 Kingman Island, Station # 12 88
FIGURE 19.0 Concrete factory, Station # 14, department of Public Works 89
FIGURE 20.0 Heavy accumulation of cement, Station # 14 90
FIGURE 21.0 Destroyed sea-wall, Station # 16 (District Yacht Club) 91
FIGURE 22.0 Vegetation corridor in Station # 16 92
FIGURE 23.0 Marginal vegetation growth and sedimentation build-up in Station # 24 93
FIGURE 24.0 Vegetation in Station # 24 94
FIGURE 25.0 Sedimentation build-up in Station # 25 95
FIGURE 26.0 a Station # 26, East side of the Anacostia River on Anacostia Park and Sousa Bridge 96
FIGURE 26.0 b Uprooted trees, Station # 26 97
FIGURE 27.0 Drainage located on the east side of the river (Station # 26 98

LIST OF TABLES

LIST OF TABLES PAGES
TABLE 1.0 Summary of water quality 61
A. 1988 A. 1990 C. 1991
TABLE 2.0 Storm water quality 62
TABLE 3.0 Chemical Analysis 63
TABLE 4.0 Water analysis, total means 64
TABLE 5.0 Range values 65
TABLE 6.0 Turbidity data
TABLE 7.0 Water data from September 1988 to 1989 66a m
TABLE 8.0 Substrate composition and water condition 67abc
TABLE 9.0 Analysis of soils and sediments 68a-v
TABLE 10.0 Coliform test 68w
TABLE 11.0 Biotic index of pollution status of water 69a-b quality
TABLE 12.0 Pollution status of benthic species 23
TABLE 13.0 Total species identified during the study
TABLE 14.0 Diversity Index of species
TABLE 15.0 Species composition of plankton 70 a-b (April - September 1988) TABLE 16.0 Species composition of plankton 71 (September 1988 - July 1989) TABLE 17.0 Species composition of plankton 72 (September - December 1989) TABLE 18.0 Species composition of plankton 73a -b (February - July 1990) TABLE 19.0 Diversity Index of all individual species (April - July 1988) 74a -b -c TABLE 20.0 Diversity Index of all individual species (September - December 1989) 75a-b

TABLE 21.0 Diversity Index of all individual species 76a-b (February - March 1990) TABLE 22.0 Pollution status composition of benthic 77 species (April - November 1988) TABLE 23.0 Pollution status composition of benthic species (September 1988 - July 1989) 78 a-b TABLE 24.0 Pollution status of benthic species 79 a- b (September - December 1989) TABLE 25.0 Pollution status composition of benthic species (February - July 1990) 80 a-b TABLE 26.0 Summary of totals for plankton species (April 1988 - July 1990) 81 TABLE 27.0 Summary of average totals for benthic species (April 1988 - July 1990) 82 a-b

ACKNOWLEDGEMENTS
The author wishes to thank the U.S. Geological Survey for the generous grant to undertake this study.
The author also wishes to thank the following individuals for their generous cooperation
and assistance:
Miss Cecile Grant - Research Assistant
Mrs. Maria S. Hille - Research Assistant
Mr. Alouisse Cisse - Computer Programmer
Mr. Robert Juma - Student Assistant
Mr. Mohammad Ali - Student Assistant
Mr. Rayburn Robinson - Technician for WRRC
Dr. Hame M. Watt - Director, WRRC
viii

ABSTRACT
THE ANACOSTIA RIVER: ECOLOGICAL STUDIES OF RIVER POLLUTION BIOLOGY
The objectives of this research are: 1. To obtain the basic data on water, and water-related variables such as: water quality
values for: pH, dissolved oxygen, turbidity, temperature, conductivity, dissolved solids, chemical, and bacterial properties.
2. To provide a taxonomic survey of the plankton and benthic organisms, and identify the
extent of pollution using the biotic community of organisms as indicator species. 3. To study the chemical composition of the river bottom sediments.
4. To determine the community ecology of the river.
A total of nine stations were established to survey the ecology and water quality of the Anacostia River for three years: August 1987 to July 1988; August 1988 to July 1989; August 1989 to July 1990. The collecting stations selected are located close to drainage outlets of either combined or separate storm sewers. Water samples were taken from the main channel of the river. Sloughs, inlets, and backwater areas were given attention for comparison with the main river waters. Phytoplanktons and zooplanktons were collected using the Petersen Grabber and water bottles. The samples were taken from depths of 0 ft. to 5 ft. Water samples were analyzed for dissolved oxygen, temperature, pH, conductivity, and other water quality parameters using a Hydro lab apparatus. Soil samples and sediments were analyzed using the Soil Test Kit. Identification and actual counting of the organisms were made possible with the aid of a Counting cell and a microscope. PRINCIPAL FINDINGS AND SIGNIFICANCE:
PHASE I
Life in the Anacostia River is threatened by factors such as sedimentation, siltation, sewer overflow, water run-off, and other anthropogenic activities. Non-biodegradable materials from construction sites, as well as natural litter are continuously poured out into the river. Overall water samples collected were yellowish, slightly turbid, and at times have pungent odor. The physiography and ecology of the river has been changed tremendously by sedimentation, siltation and accumulation of litter. Existing vegetation and the watershed are being turned into a swampland.
Water quality tests conducted from April to August 1988 showed high temperature values (13.1 - 28.8 o C); low dissolved oxygen (DO) in majority of the stations; slightly acidic waters (6.1-6.9); and conductivity values (298-606 us/cm).
ix

Water quality tests conducted during storm events for the months of April, June and July
1988 showed no significant difference between the water quality data during non-storm events and after a heavy storm for temperature, pH, and conductivity. However, the amount of dissolved oxygen (DO) appears to be a few mg/l higher in majority of the stations and significantly lower in two of the study stations (# 25 and # 26). Conductance values for these two stations were several times lower after a storm event. Turbidity data showed the highest amount of suspended matter and particulates on April 13, 1988, and had the lowest reading three months after. Turbidity ranged from 7.0 in Station # 26 to 25.0 NTU in Stations # 25 and 26. Analysis of bottom sediments showed high magnesium (Station 14) ; high phosphorus (Station 5, 24, 25, 26 and 12 ) ; high ammonia (Station 4, 5) ; high calcium (Station 8 and 12). Total dissolved solids ranged from 160 - 380, the highest being in Station # 24. The results obtained for magnesium, iron, and nitrate appear to be statistically significant, with iron, magnesium, and nitrate exceeding the standard amount required for safe levels. Overall pH level of the substrate is alkaline. Four stations (# 12, 14, 24, and 26) have been tested for coliform. The results show a high concentration of coliform bacteria at these stations.
The frequency and occurrence of phytoplankton and zooplankton were extremely low in all stations. The species diversity and composition were extremely low. The Chlorophyta has the highest percentage of occurrence followed by flagellata, Cyanophyta, and Desmediaceae in this order. Tubifex sp., copepods, Diaptomus and Keratella are the most commonly occurring benthic species. These species were found in Stations # 4, 12, 14, 16, 25, and 26. These locations were located at drains. Soil and water analyses for stations # 8 and 16 show high readings of phosphates, ammonia, and nitrates. These three substances are vital nutrients for phytoplankton species and can result in creating „cultural eutrophication. The presence of Diatoms and desmids can also be correlated with the high concentration of calcium and carbonate compounds deriving from heavy calcite runoffs in the nearby construction sites.
x
PHASE II
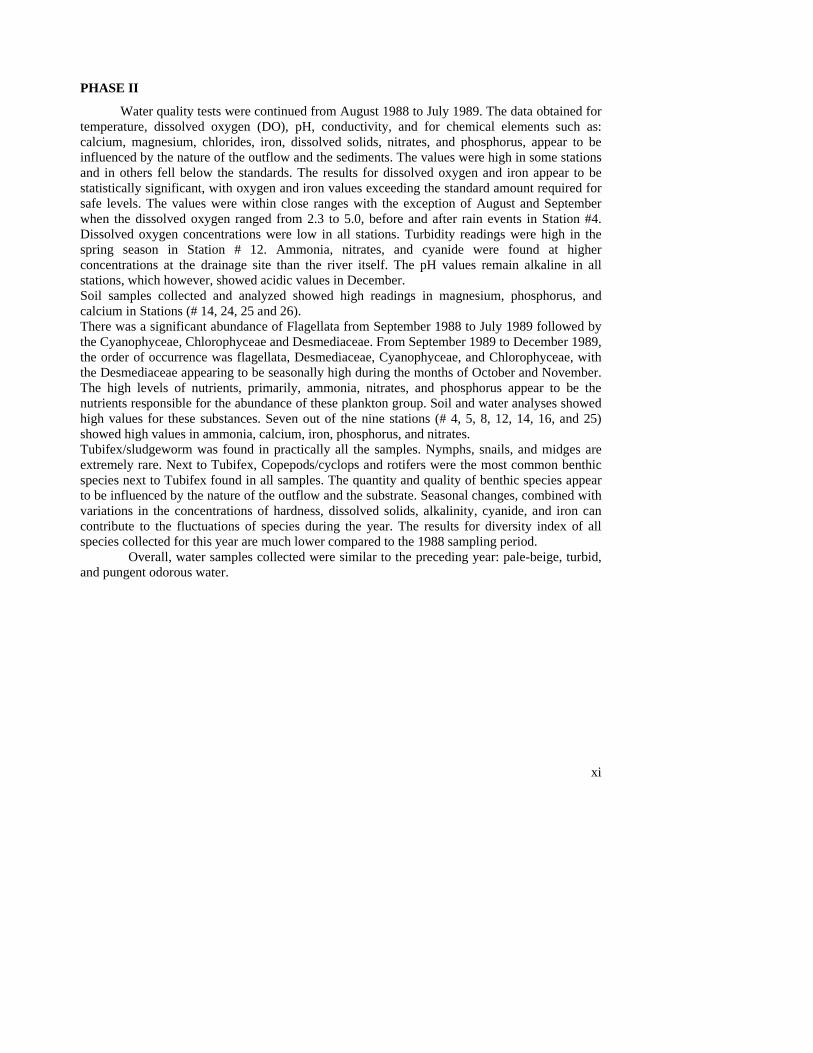
Water quality tests were continued from August 1988 to July 1989. The data obtained for temperature, dissolved oxygen (DO), pH, conductivity, and for chemical elements such as: calcium, magnesium, chlorides, iron, dissolved solids, nitrates, and phosphorus, appear to be influenced by the nature of the outflow and the sediments. The values were high in some stations and in others fell below the standards. The results for dissolved oxygen and iron appear to be statistically significant, with oxygen and iron values exceeding the standard amount required for safe levels. The values were within close ranges with the exception of August and September when the dissolved oxygen ranged from 2.3 to 5.0, before and after rain events in Station #4. Dissolved oxygen concentrations were low in all stations. Turbidity readings were high in the spring season in Station # 12. Ammonia, nitrates, and cyanide were found at higher concentrations at the drainage site than the river itself. The pH values remain alkaline in all stations, which however, showed acidic values in December. Soil samples collected and analyzed showed high readings in magnesium, phosphorus, and calcium in Stations (# 14, 24, 25 and 26). There was a significant abundance of Flagellata from September 1988 to July 1989 followed by the Cyanophyceae, Chlorophyceae and Desmediaceae. From September 1989 to December 1989, the order of occurrence was flagellata, Desmediaceae, Cyanophyceae, and Chlorophyceae, with the Desmediaceae appearing to be seasonally high during the months of October and November. The high levels of nutrients, primarily, ammonia, nitrates, and phosphorus appear to be the nutrients responsible for the abundance of these plankton group. Soil and water analyses showed high values for these substances. Seven out of the nine stations (# 4, 5, 8, 12, 14, 16, and 25) showed high values in ammonia, calcium, iron, phosphorus, and nitrates. Tubifex/sludgeworm was found in practically all the samples. Nymphs, snails, and midges are extremely rare. Next to Tubifex, Copepods/cyclops and rotifers were the most common benthic species next to Tubifex found in all samples. The quantity and quality of benthic species appear to be influenced by the nature of the outflow and the substrate. Seasonal changes, combined with variations in the concentrations of hardness, dissolved solids, alkalinity, cyanide, and iron can contribute to the fluctuations of species during the year. The results for diversity index of all species collected for this year are much lower compared to the 1988 sampling period.
Overall, water samples collected were similar to the preceding year: pale-beige, turbid, and pungent odorous water.
xi

Oil films were consistently found ai~j.-l the banks. The river banks are denuded of vegetation. The banks west of the Department of Public
Works and south of the Benning Road access are gone and have now been replaced by accumulation of waste materials and cement.
PHASE III
This is the final phase of the ecological examination of the Anacostia River from August 1989 to July 1990. Temperature for each station site varies from 10.9 to 15.8 o C given the type of season. Temperature ranged for these months were from 12.1 to 17.8 o C, and tends to fluctaute in the Fall. Monthly dissolved oxygen (g/ml) varies from 1.75 to 15.7. Dissolved oxygen concentration impacts on pH (6.4 to 7.1); conductivity (280 -311). Dissolved oxygen for this phase varied from 4.3 to 4.9. It also adversely affected the order of ecological equilibrium, resulting to eutrophication, and the decline of the phyto and zooplanktons, as well as the majority of the benthos species. Water from this river is best described as acidic. Calcium and calcium carbonate readings were high in some stations. As a result, Chrysophyceae, Desmediaceae, Gyrosigma, Melosira, Navicula, Nitzschia, and Stephanodiscus appeared at some stations, notably at all sites but occurring after heavy storm flows. These organisms indicate the presence of organic compounds as exhibited in the calcium and calcium carbonate readings. The organisms sampled show very low appearance of tolerant plankton and benthic species but a high count of pollution tolerant species. Protozoa are the primary constituent of the zooplanktons along with some species of the Euglenophyceae and Phyrrophyceae. There were very few colpidium and paramecia. The prevailing or dominant species were the sludgeworm/tubificid worms which were recorded as both abundant, and tolerant species within the benthos group followed by copepods, rotifers, watermites, and enchytaeids (Annelida). The stations with the most benthic species are # 25 and # 8. These stations also show high readings for ammonia, calcium, iron, manganese, and phosphorus. The dominant species for these two stations were the tubificid worms and the copepods. The diversity of plankton and benthic organisms could be the result of the combined effects of water run-off, high concentrations and variations of some of the chemical substances, sedimentation and siltation, anthropogenic activities, and sheer neglect in this part of the river.
The group of organisms categorized as to their pollutional status represent species that
can withstand high level of pollution. Species presence and abundance were influenced by controlling factors such as pH, nutrients, temperature, DO, conductivity, and turbidity. The river is constantly plagued by eutrophication and fish kill.
Soil analyses showed high content of phosphorus, manganese, ammonia, calcium, and
iron. Substrate samples are alkaline. The stations consistently high in these chemicals are Stations # 4, 5,
xii

8, 12, 14, 16, 24, and 25.
The basis of many of the perturbations occurring in the river bed which are important for the
existence and survival of the plankton and benthic organisms are the physical and chemical
processes obtaining in this environment. This study showed a significant abundance of green
algae and diatoms. This indicates that this aquatic community received high organic loads, i.e.
the effluent source of pollution primarily from ammonia, nitrates, and phosphates. These
nutrients encourages temporary overgrowth resulting in the process of eutrophication. The
presence of such nutrients are exemplified in the water and soil samples.
The Biotic Index Readings summarizes the general quality of the river. This indicates that there
was a high level of pollution, where intolrant species were low and subtolerant and
facultative species were found in practically all the nine stations.
In conclusion, the constant recurrence of algae constitutes the main problem facing the
Anacostia River.
Continuous monitoring of the river is necessary to estimate the level of degradation as well as to
provide some kind of measure to restore if not to enhance the quality and scenic beauty of the
river. This study shows that the ecology of the river has changed tremendously as shown in this
study. That the river is polluted is clearly marked in the organisms found and identified.
The use of plankton and benthic organisms as indicators of water quality in river management is
clearly marked by its reaction to certain changes in the natural features of the river. During the
past three years of the study, there has been a turn towards eutrophic conditions with increased
algae and fewer intolerant species.
xiii

1. INTRODUCTION The water quality of the Anacostia River is poor. unless a technology is developed that would
protect the river from continuous deterioration and degradation, the river will soon be dead.
Part of the visible degradation of the river is brought about by man. Man's activity has changed
the concentration of the nutrients above natural levels, accelerating and increasing algal growth
and eutrophication. Other activities such as extensive littering and open dumping, as well as
accumulation of nonbiodegradeable trash and litter, also contributed to the change in the river's
biotic resources.
These activities combined with natural biochemical and geological processes has
created serious problems on the river's load. These have changed the physical and the
biochemical components of the river. They have also caused large increases in river flow and
the accumulation of sediments in some parts. The physical forces of erosion and sedimentation
may be observed clearly during low tide in many locations. Sedimentation build-up is found in
all locations. Over times siltation made some areas shallow putrid and nearly transformed
others into swampland.
Prolonged rainfall periods coupled with the high tidal activity frequently flood some large
areas of the river. Extensive accumulation of sediments at the western coastline of Kingman
Island, for example, has caused the back flow waters to innundate and scrounged the upper
wetland, denuding the area of its vegetation. Stagnation results, which later on, eventually
impacts on the existing vegetation, and at the same time increases the formidable hazards of
accumulation of non-point products of pollution.
The delivery of pollutants to the river from non-point sources influence the water quality,
soil, and the biotic resources. Water pollution brought about by chemicals from non point
sources may be viewed as a stress response occurring in a series of stages:
A. The effects can be identified in the growth and decline of the phyto and zooplankton
species.
B. It could affect the benthos organisms as well.
C. It could enhance eutrophication and limit photosynthesis
D. The water could easily be polluted by sewer overflow.
1
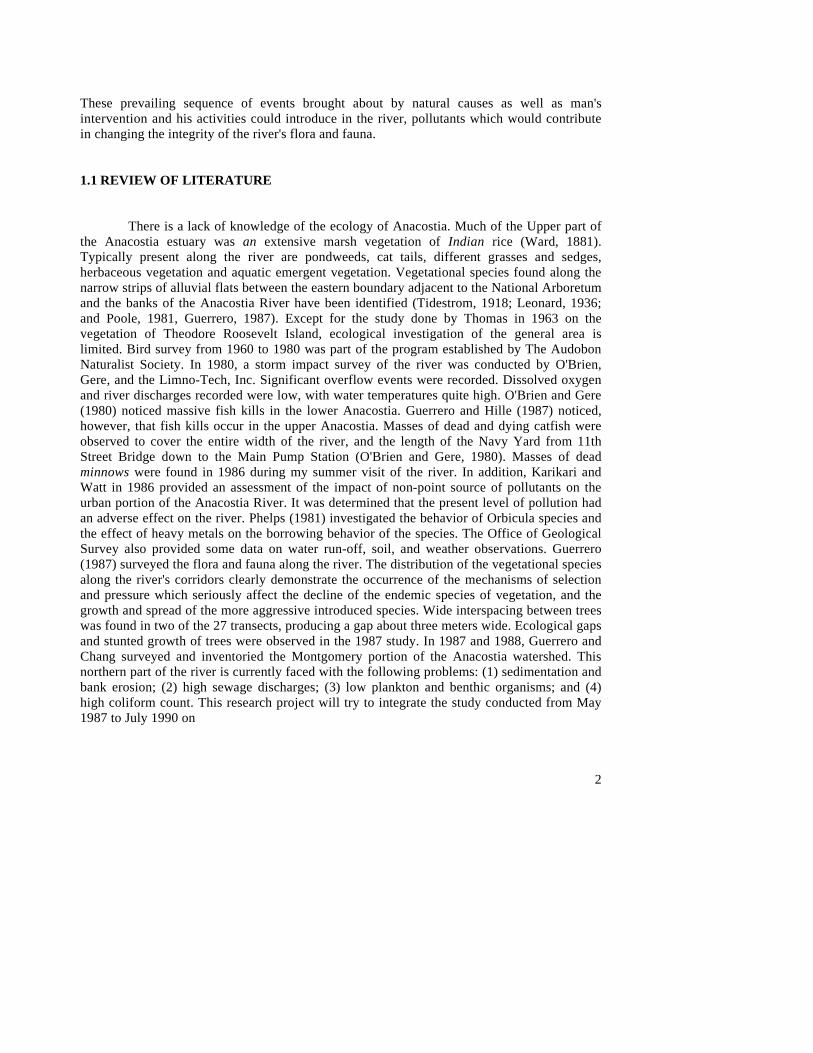
These prevailing sequence of events brought about by natural causes as well as man's intervention and his activities could introduce in the river, pollutants which would contribute in changing the integrity of the river's flora and fauna. 1.1 REVIEW OF LITERATURE
There is a lack of knowledge of the ecology of Anacostia. Much of the Upper part of the Anacostia estuary was an extensive marsh vegetation of Indian rice (Ward, 1881). Typically present along the river are pondweeds, cat tails, different grasses and sedges, herbaceous vegetation and aquatic emergent vegetation. Vegetational species found along the narrow strips of alluvial flats between the eastern boundary adjacent to the National Arboretum and the banks of the Anacostia River have been identified (Tidestrom, 1918; Leonard, 1936; and Poole, 1981, Guerrero, 1987). Except for the study done by Thomas in 1963 on the vegetation of Theodore Roosevelt Island, ecological investigation of the general area is limited. Bird survey from 1960 to 1980 was part of the program established by The Audobon Naturalist Society. In 1980, a storm impact survey of the river was conducted by O'Brien, Gere, and the Limno-Tech, Inc. Significant overflow events were recorded. Dissolved oxygen and river discharges recorded were low, with water temperatures quite high. O'Brien and Gere (1980) noticed massive fish kills in the lower Anacostia. Guerrero and Hille (1987) noticed, however, that fish kills occur in the upper Anacostia. Masses of dead and dying catfish were observed to cover the entire width of the river, and the length of the Navy Yard from 11th Street Bridge down to the Main Pump Station (O'Brien and Gere, 1980). Masses of dead minnows were found in 1986 during my summer visit of the river. In addition, Karikari and Watt in 1986 provided an assessment of the impact of non-point source of pollutants on the urban portion of the Anacostia River. It was determined that the present level of pollution had an adverse effect on the river. Phelps (1981) investigated the behavior of Orbicula species and the effect of heavy metals on the borrowing behavior of the species. The Office of Geological Survey also provided some data on water run-off, soil, and weather observations. Guerrero (1987) surveyed the flora and fauna along the river. The distribution of the vegetational species along the river's corridors clearly demonstrate the occurrence of the mechanisms of selection and pressure which seriously affect the decline of the endemic species of vegetation, and the growth and spread of the more aggressive introduced species. Wide interspacing between trees was found in two of the 27 transects, producing a gap about three meters wide. Ecological gaps and stunted growth of trees were observed in the 1987 study. In 1987 and 1988, Guerrero and Chang surveyed and inventoried the Montgomery portion of the Anacostia watershed. This northern part of the river is currently faced with the following problems: (1) sedimentation and bank erosion; (2) high sewage discharges; (3) low plankton and benthic organisms; and (4) high coliform count. This research project will try to integrate the study conducted from May 1987 to July 1990 on
2

the various aspects of study, ecology, biology, physical and chemical analysis of the river to provide the scientific base that has not been explored. 2. OBJECTIVES AND SCOPE OF THE STUDY
A three year ecological investigation of the Anacostia River was conducted from April 1988 to July 1990. The following objectives were pursued in this study.
A. To obtain the basic data on water and water related variables such as: water values
for pH; dissolved oxygen; turbidity; conductivity; and temperature. B. To determine the concentrations of ammonia nitrogen, C02 copper, chloride,
cyanide, calcium/magnesium, iron, chromium, nitrate, phosphate, phosphorus, sulfide, and total dissolved solids in water.
C. To determine the chemical composition of bottom sediments for phosphorus, potassium calcium, magnesium, nitrate, ammonia, iron, manganese, nitrate nitrogen, humus , and nitrogen.
D. To provide a taxonomic survey of the plankton and benthic organisms and identify the extent of pollution.
E. To determine the community ecology of the river.
3. METHODOLOGY
The study was conducted for a period of three years. Year I - April 1988 to July 1988 Year II - August 1988 to July 1989 Year III- August 1988 to July 1990
Figure 1.0 provides the collecting, viewing, and study stations. The locations used in the 1987 vegetation survey were identified and adopted in this study. The criteria considered in selecting these sites were based on:
the existence of a water outlet, a drainage or a sewer; the vegetation corridors; the nature of the biotic community.
A total of nine stations was established. All stations have drainage systems which drains along the corridors of the Anacostia River. The locations were identified using the Sewerage Map. Seven stations are near sewer drainage, and two are located at the exit of the Hickey Run and the Watts Branch tributaries. The sewer systems are either combined, separate, and/or storm sewers. Figure 2.0 shows the locations and relationships of the stations to the sewers.
3

Sampling Procedure
Water and soil samples were obtained along the river bank and at the drainage areas at
designated study locations. Water samples, soils, and benthos were collected at the river and at the drainage. There were sites where bottom sediment samples were collected from a boat, several distances away from the river bank because of encroachment of the retaining wall foundation. Samples were tested for: (1) water chemistry using a Calorimetric Kit (Water Pollution Detection Outfit, Model Am-21) ; and (2) the soil samples were collected with a Petersen Dredge and taken to the laboratory for examination. The soil samples were allowed to dry. Once samples were dry, a colorimetric analysis for representative chemical elements were determined using a Soil Testing Kit. 3.2 Water Quality
The parameters used to analyze the quality of water are: (1) temperature; (2) pH; (3) dissolved oxygen; (4) conductivity Samples were obtained from 1987 to 1990. These parameters were measured by means of a portable Hydrolab Digital 4041 that signals underwater units and converted to digital read out. The equipment was calibrated before each use.
3.3 Water Chemistry
Alkalinity, ammonia, nitrogen, C02, copper, chloride, pH, cyanide, calcium/magnesium, salinity, iron, chromium, nitrate, phosphate, sulfide, and total dissolved solids were measured with the aid of a Calorimetric Kit (Water Pollution Detection Outfit, Model AM-211).
3.4 Soil Chemistry
Soil samples collected once dry were determined for phosphorus, potassium, calcium, magnesium, nitrate, ammonia, iron, manganese, nitrate/nitrogen, humus, and nitrogen.
3.5 Biological Analysis
Plankton and Benthos Collection
A total of three samples per station were obtained from identified points within the
study sites with a bottom sampler from depths of 0 to 5 ft. Where the areas showed poor visibility and have depths of 5 to 8 ft, the samples were taken from depths of 0 to 5 ft as well. In areas which are extremely shallow, and less than a foot deep, the samples were collected from the surface. Examination and identification were done using a microscope.
4
3.1

Coliform Analysis In the summer of 1988, water samples were examined for coliform using the Most
Probable Number (MPN) technique. This technique is based on estimation to correlate the amount of coliform and the presence of the pathogen in water. The Presumptive Test was the technique used in this study. A series of fermentation tubes with graduated quantities (.01ml, .001ml, and .0001m1 of water samples) were used. The samples having twice the concentration more than the six other samples from each group of nine were innoculated with .01ml, .001ml, and .0001ml, of water samples. The test tubes were then incubated for 48 hours at 37 degrees Celsius. Gas formation in the inner fermentation tubes within 48 hours indicate a positive Presumptive Test.
DESCRIPTIVE STATISTICS
Chemical Analysis Samples obtained were analyzed using the means.
Plankton and Benthos
Plankton and benthos organisms were catalogued and systematically identified. Plankton and benthos species were catalogued and per station. Population were
averaged, and presented following equations: identified using the
Evaluation = Number of Individual Species x 100 Equation Total Number of Species
Benthic species were then categorized according to: 1) Tolerant: Pollutional or more/less tolerant species;
2) Facultative: Sub-tolerant or cleaner preference species; and
3) Intolerant: Clean water species
A Biotic Index (I) of pollutional Status of Water Quality was devised to determine the
state of pollution of the river, using the equation:
Biotic Index (I) = 2 (Intolerant) + Facultative Species
Standard values were adapted from the Michigan Resources Commission (1970).
5
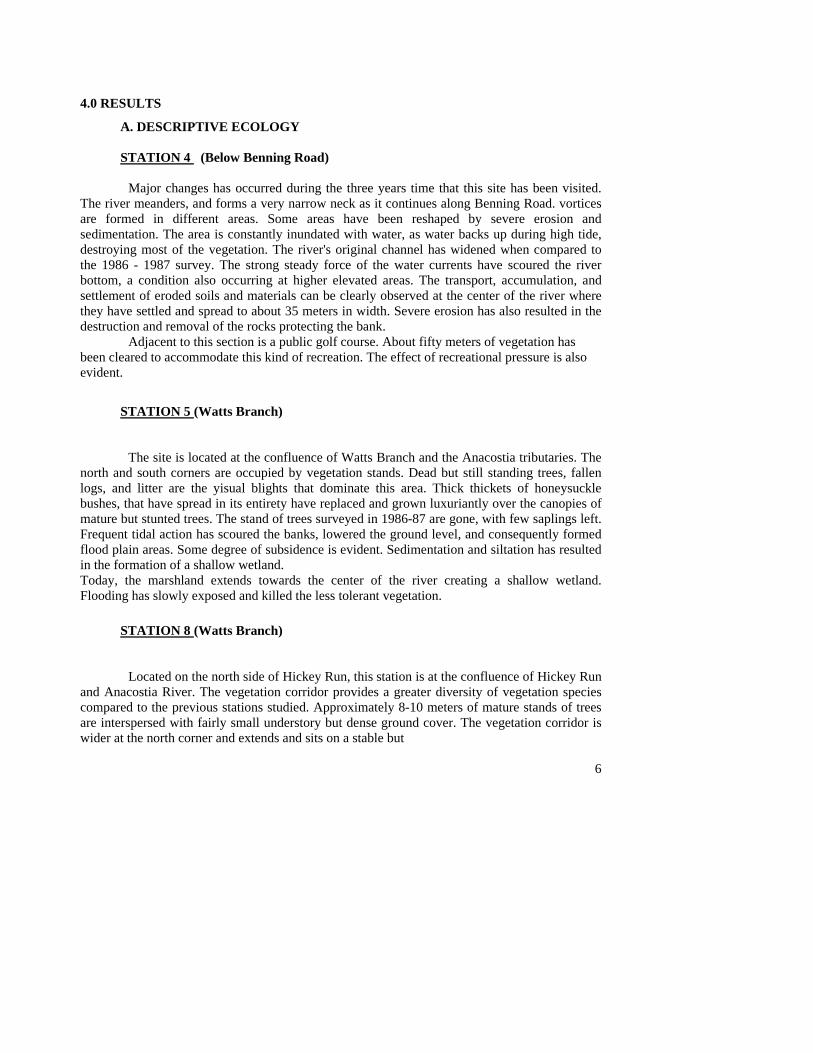
4.0 RESULTS
A. DESCRIPTIVE ECOLOGY STATION 4 (Below Benning Road)
Major changes has occurred during the three years time that this site has been visited.
The river meanders, and forms a very narrow neck as it continues along Benning Road. vortices are formed in different areas. Some areas have been reshaped by severe erosion and sedimentation. The area is constantly inundated with water, as water backs up during high tide, destroying most of the vegetation. The river's original channel has widened when compared to the 1986 - 1987 survey. The strong steady force of the water currents have scoured the river bottom, a condition also occurring at higher elevated areas. The transport, accumulation, and settlement of eroded soils and materials can be clearly observed at the center of the river where they have settled and spread to about 35 meters in width. Severe erosion has also resulted in the destruction and removal of the rocks protecting the bank.
Adjacent to this section is a public golf course. About fifty meters of vegetation has been cleared to accommodate this kind of recreation. The effect of recreational pressure is also evident.
STATION 5 (Watts Branch)
The site is located at the confluence of Watts Branch and the Anacostia tributaries. The north and south corners are occupied by vegetation stands. Dead but still standing trees, fallen logs, and litter are the yisual blights that dominate this area. Thick thickets of honeysuckle bushes, that have spread in its entirety have replaced and grown luxuriantly over the canopies of mature but stunted trees. The stand of trees surveyed in 1986-87 are gone, with few saplings left. Frequent tidal action has scoured the banks, lowered the ground level, and consequently formed flood plain areas. Some degree of subsidence is evident. Sedimentation and siltation has resulted in the formation of a shallow wetland. Today, the marshland extends towards the center of the river creating a shallow wetland. Flooding has slowly exposed and killed the less tolerant vegetation.
STATION 8 (Watts Branch)
Located on the north side of Hickey Run, this station is at the confluence of Hickey Run and Anacostia River. The vegetation corridor provides a greater diversity of vegetation species compared to the previous stations studied. Approximately 8-10 meters of mature stands of trees are interspersed with fairly small understory but dense ground cover. The vegetation corridor is wider at the north corner and extends and sits on a stable but
6

elevated bank. The bank at the south corner end, however, has undergone slight degree of erosion. A build-up of sediment is noticeable along the bank particularly the severity of this process in this station. Overall, this section of the river offers an opportunity to examine some native flora species.
STATION 12 (Storm Sewer on Kingman) The station is located north of East Capitol, and at the west bank of the river,
perpendicular to the storm sewer that extends from Robert F. Kennedy Stadium and underground, through the parking lot and into the river.
The vegetation consists of a single row of widely interspaced canopy of young hardy tree types: white mulberry, slippery elm, black locust, and coppice growth of honeysuckle bush, and tree of heaven. The endemic trees and ground cover vegetation found are severely depleted and diseased. Continuous cutting of the shrubbery prevailed in this location resulting in coppice growth forms. The scouring action of the water current on the unprotected and barren ground contributes to the considerable reduction of the vegetation corridor. Mature stand of trees are uncommon, as there are only very few left which are subject to erosion, act of vandalism, and park personnel action. The drain site is fully covered by vegetation corridor and flanked by eroded banks. Oil and gasoline film were observed at all times in the soil and the water surface. A very strong smell of an organic substance is common. STATION 14 (S. W., East side of the river, behind the Department of Public Works)
The station is located behind the Department of Public Works. A combined sewer that drains into the river is found on the south side of this station. The nearby concrete factory provides a continuous flow of trash, cement, and other related materials which are carried and settled in the river bed, which makes this station look more like a dump site. The vegetation corridor is narrow and thin, occupied mostly of stunted canopy trees measuring only about 30-35 cm (DBH). Tidal action sinks a lot of the litter , with large pieces remaining on the bank, thus debilitating next year's growth. Very little understory remains. Few mature trees are left. Due to the absence of a vegetation cover, a portion of the bank has also been washed away.
STATION 16 (District Yatch Club and Marina) A combined sewer overflow drains north of the Marina, on the west side of the Anacostia
River. The sewer line extends from an industrial and commercial area and drains on this site. Oil is the most common discharge.
During heavy rains, the bulk of garbage and litter accumulate and settle in this part of the
river. The retaining wall has
7

collapsed. The vegetation corridor has been reduced to a very low level by the process of sedimentation and siltation. The top soil and the slashing of the water is turned into erosive run-off. The vegetation corridor adjacent to the retaining wall have fewer sapplings of herbaceous species and coppice growth forms of honeysuckle bushes. While the tolerant species still persist, there is a shift towards the growth of exotic invaders.
STATION 24 (S, above Benning Road, East side of the river)
The storm sewer at this station is one of the many sewers that cut into the river from commercial, urban, and industrial plant located northeast of Washington. The surrounding area is maintained for recreational use.
The immediate area is gradually turning into a marshland. Marginal vegetation growth is beginning to emerge as a result of heavy sedimenation build-up. Continuous tidal action dumps the silted materials in this general area, which appears to be a catchment-basin for materials that are trapped and collected. The vegetation corridor is thinly spread out, interspersed with wide expanse of barren ground.
STATION 25 (Storm sewer area, near East capitol Street) The vegetation corridor consists only of coppice growth of shrubs, and vines. The
existing retaining wall has deteriorated. During heavy storms, boulders of rocks that serve as retaining wall have been moved. A typical sedimentation build-up is formed. During heavy storms, rocks placed under the edge of the bridge are transported and carried away.
STATION 26 (A. Park and Sousa bridge, east side of the river) This site is located on the east side of the river, and lies perpendicular to the Conrail
tracks at the Anacostia Park near the Sousa Bridge. This area has been always maintained and cleared of vegetation. A storm sewer line which also receives the discharge from Fort Dupont Run is located in this site. The drain is made of a large concrete pipe that extends from the residential areas next to the park, before it drains into the river. A basin is beginning to be formed by the tidal action along the sewer. This area has been extensively reshaped by sedimentation and siltation. These processes is more pronounced around the drainage site. The sediment buildup measures about 10 meters starting from the retaining wall into the river. At the drainage site, uprooted trees, some barely standing upright, are a common sight.
8

4.0 RESULTS 4.1 CHEMICAL ANALYSIS B. WATER QUALITY
Tables 1 a, b, c, summarize water quality analyses covering the period April 1988 to July 1990.
Table a shows the storm water quality for the months of May to July 1988 during Phase I of the study.
C. CHEMICAL ANALYSIS OF WATER SAMPLES
Table 3 summarizes the analysis covering the period August 1988 through August 1989; September 1989 through July 1990. Samples were tested for the different chemicals mentioned.
Table 4 summarizes the total mean for water analysis data for 1988, 1989, and 1990 years respectively.
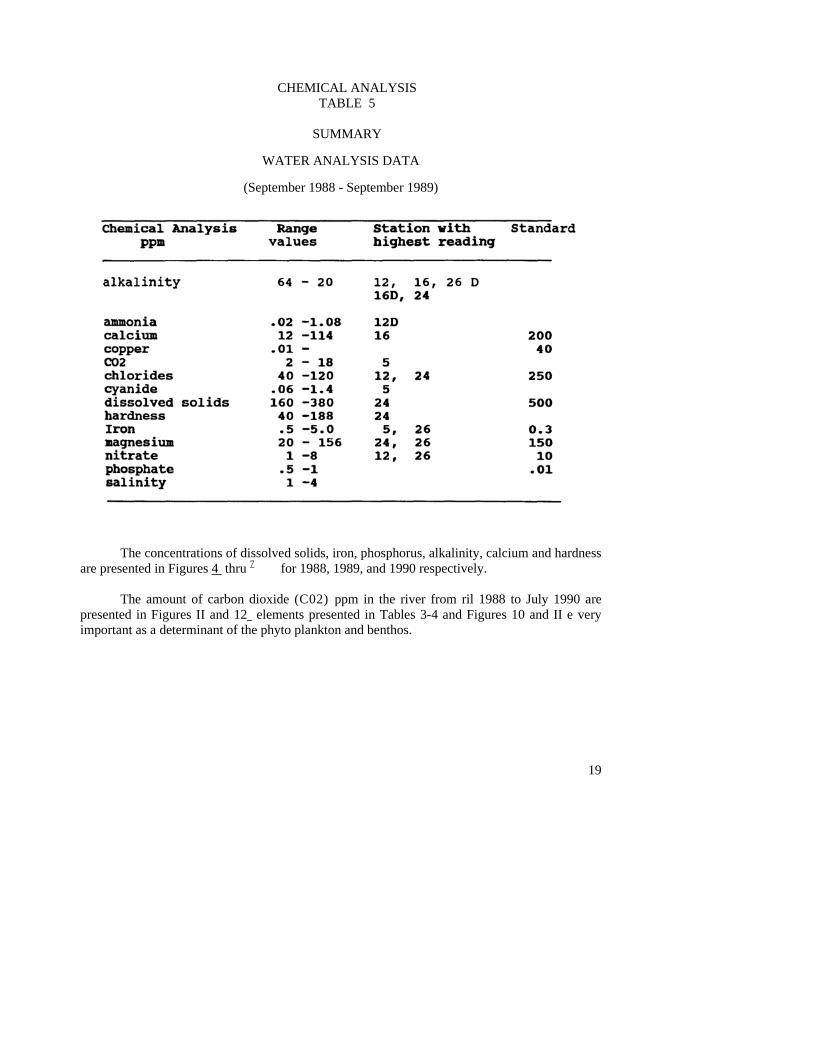
Table 5 summarizes the range values for alkalinity, ammonia, calcium, copper, CO2 , chlorides, cyanide, dissolved solids, hardness, iron, magnesium, nitrate, phosphate, and concentration of salinity from September 1988 to September 1989.
4.2 PHYSICAL ANALYSIS
D. Turbidity
Table 6 summarizes the turbidity data. Table 7 presents the analysis of water data from September 1988 to 1989. Table 8 summarizes the substrate composition and water condition in the Anacostia
watershed.
E. DRY SEDIMENTS
Table 9 summaries the analysis of soils and sediments covering the period from April to
July 1988; September 1988 to July 1989; and February to June 1990.
9

4.3 BIOLOGICAL ANALYSIS
F. Coliform
Table 10 summarizes the total mean for coliform test.
G. Plankton and Benthos
SUMMARY ANALYSIS
Tables 11 thru 27 summarize the species composition for plankton and benthos collected and analyzed during the study:
Table 11 Biotic index of pollutional status of water quality.
Table 12 Pollution status of benthic species
Table 13 Total species identified during the study
Table 14 Diversity index of species
Table 15 Species composition for plankton (April - September 1988)
Table 16 Species composition of plankton (September 1988 - July 1989)
Table 17 Species composition of plankton (September - December 1989)
Table 18 Species composition of plankton (February - July 1990)
Table 19 Diversity Index of all individual species (April - July 1988)
Table 20 Diversity Index of all individual species (September - December 1989)
Table 21 Diversity Index of all individual species (February - March 1990)
Table 22 Pollutional status composition of benthic species (April - November 1988)
Table 23 Pollutional status composition of benthic species (September 1988 - July 1989)
Table 24 Pollutional status of benthic species (September - December 1989)
10

Table 25 Pollutional status composition of benthic species (February - July 1990)
Table 26 Summary of totals for plankton species (April 1988 -July 1990)
Table 27 Summary of average totals for benthic species (April 1988 - July 1990)
11

TABLE 11
BIOTIC INDEX OF POLLUTIONAL STATUS OF WATER QUALITY OF ANACOSTIA RIVER
STATION POLLUTIONAL EQUATION BIOTIC INDEX READINGS
4D 2(0) + 1 1 Moderate Pollution 5 2(0) + 8 8 Clean with slow current8 2(0) + 1 1 Moderate pollution
*12 2(0) + 0 0 Gross pollution 12D 2(0) + 8 8 Clean with slow current14D 2(1) + 1 3 Moderate pollution 16D 2(0) + 7 = 7 Moderate pollution 16 No organism was found
24D 2(1) + 0 = 2 Moderate pollution *24S 2 (0) + 0 = 0 Gross pollution 25D 2 (1) + 0 = 2 Moderate pollution
*26D 2 (0) + 0 = 0 Gross pollution*26R 2 (0) + 0 = 0 Gross pollution
* Indicate the most polluted station sites located along the Anacostia River Standard Values adapted from the Michigan Water Resources Commission, 1970. Index range from 1-40 and correlated accordingly.
0 - gross pollution 1 - 6 - moderate pollution 4 - 9 - clean with slow current
10 - 40 - clean
12

5.0 DISCUSSION AND CONCLUSION
A. WATER QUALITY
5.1 Temperature
The temperature of the water in the nine stations ranged from 19.3 - 31.0º C (Phase I); 10.6 - 13.1º C (Phase II); and 12.3 - 17.8 o C (Phase III). In 1988, temperatures were high, 19.3 - 31.0º Celsius (May, June, July, and August). In 1989, the temperature showed narrow fluctuations, and the waters were relatively cooler with a X of 12.0º C compared to the previous year. The differences between stations were quite wide. In 1990, water samples collected in January through July ranged from 12.1 to 17.8º C. Temperature increased beginning April and warmed up in May, June, and July. The temperatures varied between stations. Comparison between stations showed, that it was considerable, at one extreme, as in Station #5 and #24 (31.0º C and 24.0º C). The station with the coolest temperature were stations #24, 12 and 16. Temperatures were higher in 1988 compared to those obtained in 1989, and 1990 respectively. (See Figures 2abc and Table 1 ).
Cairns (1956) showed that temperature range for diatomaceous algae is 20 – 30º C; 30
– 35º C for Chlorophyceace, and for the Cynophyceace is greater than 35º C. Outside of this temperature,species are not able to compete successfully at some temperatures. Temperature is an important variable which can inhibit or promote the growth of many aquatic organisms, particularly the plankton. Temperature higher than 20 o C should not be exceeded in order to protect the natural fish population. Temperature is an important variable which can inhibit or promote the growth of some algae. This study showed the dominance of some species and the decline of the others. Similarly, many benthic species were also affected as shown in Table 19
During Phase I of the study, the river and tributaries (stations) were largely acidic in
character ranging from pH 6.1 to 6.9 with the exception of Station # 14 which was alkaline. Station # 14 is located behind the Department of Public Works where construction materials, metal scraps, and garbage are abundant. Next to the sewer exist a cement factory.
In Phase II and Phase III of the study, the stations have pH on the alkaline range.
Table 2 summarizes the total mean of water quality data. Figures 3Abc shows the relationships between temperature and pH for Phase I, II, and III respectively.
The pH values ranged from 6.1 to 10.2 in majority of the stations, remaining on the
low alkaline side in Stations # 4, 5,
13

8, 12, 14, and 24. Stations # 16 and 25 were slightly acidic. This values with the exception of Stations # 12, 24, and 25 fall within the Water Quality Standards for pH which is 6.5 - 8.5 (Standard Units). Sewage discharges, wastes from industries, and power plants, including the Cement Factory are causing these high pH values. It appears that the slight increase in pH can be correlated most especially to the cement factory located nearby (Station # 14 ). Table 3 shows the relationship between the amount of dissolved oxygen, conductivity, and pH. As pH decreases, dissolved oxygen (DO) decreases and vice versa. A direct relationship exist for pH as with conductivity. See Figure 4 & 5.
The Anacostia River contained high amount of chemical substances, cations, and anions, specifically ammonia, calcium, C02, chlorides, dissolved solids, calcium carbonate, iron,magnesium and nitrates. The water is very alkaline (See Table Figure 6 shows alkalinity in different stations from: April to July 1988; September to July 1989; September to November 1989; and February to July 1990. Stations 12 and 14 had the highest alkalinity readings in 1988 and 1989. Alkalinity ranged from 24.0 to 153 (ppm). Alkalinity increased markedly during July and August as well as in September in all phases of the study., Ammonia (See Table 2 ) is present in high concentrations in Stations # 14, 16, 24, 25, and 26. Water Quality Standard for ammonia is .02 mg/l. Violations of the standard are widespread in all stations. Minimum alkalinity established by the National Technical Advisory Committee (NATO) is 20 mg/l. All the stations show range above the minimum. Ammonia concentration of 0.02 mg NH3 /1 can be toxic to fish. Walker (1952) emphasized that the sublethal effects of alkaline substances are probably even more important than the lethal effect; examples are the reduction of food organisms, destruction of fish spawn, and the like. The pH values between 6.5 and 8.0 are considered suitable for trout and other organisms. Overall mean for pH during the three year period was 6.7. All stations show poor quality in both the plankton and benthos organisms. The following ecological features can be used to describe the river:
1) high incidence of fallen branches and tree trunks. 2) accumulation of concrete materials. 3) evidence of heavy dumping. 4) heavy sediment build-up. 5) retention of large pile of non-biodegradeable "litter". 6) barren areas covered with silt, sediment, and trash accumulation. 7) sediment compaction turning the tributaries into a swampland.
14

5.3 Dissolved Oxygen (DO) Dissolved oxygen (DO) appears to be adequate in some stations but below the minimum standard in majority of the stations ( Stations # 5, 8, 16, 25, and 26). The range for dissolved oxygen was 2.0 to 8:3. Low dissolved oxygen concentrations occur seasonally (See Table 4 ). It vary between stations especially during the months of August and September (See Phase II) when the DO ranged from 2.3 to 5.0. In 1990, all stations where consistently low in dissolved oxygen. Very low oxygen concentrations may be caused by sewage water, and organic matter dissolved in the water. It may also be caused partly from discharges originating from the boats anchored at the District of Columbia Yacht Club and the presence of an overflow that drains north of the Marina. Water samples collected were turbid, pale to yellow color, and has a pungent odor. Figures 4 a b c thru 7 a be show the levels of dissolved oxygen (DO). The results show that DO appears to be a limiting factor in majority of the stations, with stations 24 and 25 showing higher readings in 1988, 1989 and station 14 in 1990. Figures 4 abc thru 5 abcshow the relationships of dissolved oxygen with pH and conductivity. Water quality data for dissolved oxygen indicated that all stations suffered low dissolved oxygen most of the time. The standard amount of dissolved oxygen (DO) is 5.0 mg/1. The data for dissolved oxygen when correlated with temperature exhibit an indirect relationship. Hypoxic condition prevailed in majority of the stations except # 12, 14, 16, and 24 in 1988, and in # 14 in 1989.In 1990, hypoxic condition was shown in stations # 4, 14, and 16. The decline in DO is also influenced by seasons (See Tables I thru 7 ). 5.4 Conductivity Conductivity ranged from 193.7 to 606.0 (us/cm), with stations # 12 and 25 having the highest conductance value during the three year period. The various chemical substances, dissolved solids, particulates, sediments, and silt may have contributed to these high values. Discharges, vertical distribution of electrolytes, as well as seasons may well contribute to the varying high values exhibited in all stations. Stations # 12, 24, and 25 showed consistent high conductance values. Welch (1953) showed that conductivity can be influenced by the vertical distribution of electrolytes in major water courses. Riverborne suspended sediments made of both inorganic particles (clays, iron oxides, aggregates, clay minerals, Fe, A1, S., N, and P and other inorganic particles). It is this bulk of fine grained river borne inorganic and inorganic particulate materials that are associated with these sediments (Berner and Berner, 1987). Erosion, sedimentation, and siltation also contributed to such high values (See Table 3 ).
15

Figures 5 and 8 show the relationships between temperature and conductivity for 1988 and 1989. Figure 5 shows the correlation between dissolved oxygen and conductivty.
The amount of dissolved solids in most of the stations, in April July 1988: September 1988 - July 1989, and in February - July 1990 were very high (See Table 3 ). The amount of dissolved solids in all Stations vary depending upon the topography and physiography of the watershed. Stations # 12, 25, and 26 show the highest values. The widespread distribution of dissolved solids brought about by the heavy accumulation of silt, would therefore explain instances of "fish kills' which appear to be a normal event, as well as the fluctuations in the total amount of dissolved oxygen (DO). Eroded storm sewer, broken retaining walls, and accumulation of non-biodegradeable litter were observed in these stations at all times. Station # 25 has a large storm sewer system 'that drains the northeast section of Washington, D. C., while station # 26 has a storm sewer line that receives discharges originating from Fort Dupont Run. Vegetation clearance or "ecological gap' (Guerrero, 1988) may be observed in stations # 14, 25, and 26 respectively, where sediment build-up has resulted in the complete disappearance of the overstory vegetation in the vegetation corridor.
Water Quality Data provided by the District of Columbia Environmental Control
Division (DCECD) as well as the river discharge data provided by the U. S. Geological Survey (TSS) concentrations in Benning Road Bridge is 77 mg/1 where the discharge in cfs ranged from 67.06 - 478.36 during a six months monitoring period. Station # 24 has 340 ppm of dissolved solids. This station is located south of Benning Road.
PHYSICAL ANALYSIS 5.5 Turbidity
The turbidity data is presented in Table 6 Turbidity ranged from 7.0 in Station 26 to 25.0 NTU for Station 25. Station 26 showed the highest amount of suspended matter and particulates on April 13, 1988 and had the lowest reading three months after.
Stations # 4, 16, and 24 show much lower values. It appears that the cause of turbidity in the stations studied is due to silt, detrital accumulation, as well as from domestic sewage.
Closely associated with turbidity is the Total Suspended Solids (TSS), which is the concentration of the total solid suspended in water. High concentration of TSS adversely affect the living resources. Data obtained for turbidity is high. Chang, et. al., 1988 observed highest concentration values of TSS on the upstream portion of the river, and the sudden drop in the concentrations downstream. According to these investigators, the
16

high total suspended solid concentrations and large sediment loads originate in the upstream side of the river (See Figure 1 )
Table 7 summarizes the substrate composition and water condition at various stations.
TABLE 7
ANACOSTIA RIVER WATERSHED SUBSTRATE COMPOSITION AND WATER CONDITION
STATION WATER CONDITION SUBSTRATE COMPOSITION
4 brown, beige, pungent silt/gravel turbid, oily
5 brown, yellow, pungent brown, silt, debris very turbid
8 yellow, pungent silt very turbid
12 clear, pungent, quite silt/gravel to slightly turbid
14 pale yellow, pungent sand/silt turbid
16 pale yellow, pungent sand/gravel/debris turbid
24 brown, pungent, very silt/gravel turbid
25 pale yellow, pungent silt/gravel lightly turbid
26 pale yellow, pungent silt/gravel turbid
17

5.6 Plankton. Turbidity and Sediment
The values for turbidity in 1988 ranged from 8.0 - 25.0, while in 1989, the values ranged from 21.0 - 75.0 NTU. Station 26 showed the highest amount of suspended matter and particulates on April 13, 1988 and had the lowest reading three months after. Stations # 4, 16, and 24 show a much lower reading (Phase I). It appears that the cause of turbidity is due to silt, detrital accumulation, as well as from domestic sewage.
The stations showing turbidity minimum of 50 were # 4, in April of 1990 and #24 in June
of 1990. The information provided is not enough to provide a conclusive statement, the values available show that sediment concentrations appear to be relatively low. Sediment deposition in Anacostia River vary from 0.2 to 0.7 inch per month. The deposited sediment thickness occurs for a length of 6000 feet out of the study length of 9000 ft (Chang, et. al., 1988). According to Chang, silt laden runoff from various construction sites and borrow pits are deposited along the various areas.
Sediments, silt and high turbidity are important limiting factors that constrain the development of plankton organisms (Guerrero, 1988). Erosion and siltation can also increase the temperature heat budgets of waters, limiting the benthos found in these substrates. A study done by Guerrero and Chang (1988) of the Maryland portion of the Anacostia River showed that benthos depended heavily on the type of substrate preferrably the clayloam type. Sand was the poorest and least preferred environment. Many cladocerans are eliminated by silt. Silt also always reduces the number of rotifers (Hynes, 1970). The occurrence and frequency of cladocerans, copepods, and rotifers were low in this study (See Table 8 ). Bedrocks, gravel, and silty environment are conducive habitual susbtrata for benthic organisms. This was not the case in this study.
5.7 Storm Water Quality
There appears no significant difference between the water quality data during non-storm events and after a heavy storm for temperature, pH, and conductivity. However, the amount of dissolved oxygen appears to be few degrees higher. Conductance values for Stations # 25 and 26 were several times lower after a storm event. Storm can bring about substances and pollutants from non-point sources that remain elevated several hours later, or it can bring about dilution and uniform mixing of the waters. The information provided in Table 8 and Figures – 5 8 show such correlations.
It is interesting to note, that after a heavy rainfall or a storm, Copepods were quite
common in some samples, while others had a few nematodes or tubificid worms. Figures 4 thru 5 summarize the relationship of this variable with dissolved oxygen, pH, and conductivity.
18
CHEMICAL ANALYSIS TABLE 5
SUMMARY
WATER ANALYSIS DATA
(September 1988 - September 1989)
The concentrations of dissolved solids, iron, phosphorus, alkalinity, calcium and hardness are presented in Figures 4 thru 7 for 1988, 1989, and 1990 respectively.
The amount of carbon dioxide (C02) ppm in the river from ril 1988 to July 1990 are
presented in Figures II and 12 elements presented in Tables 3-4 and Figures 10 and II e very important as a determinant of the phyto plankton and benthos.
19

C. PHYSICAL ANALYSIS The significance of temperature, pH, dissolved oxygen, and conductivity upon the
productivity of the river as shown in the ability of the organisms to exhibit some degree of tolerance in order to survive is shown in Figures I thru 12f. The plankton and benthos population are low (See Figures I and II).Temperature, pH, dissolved oxygen, and conductivity appear to be limiting in all stations. Stations that show these variables as limiting were also limiting in terms of species abundance and distribution.
D. BIOLOGICAL ANALYSIS 5.8 Coliform
In the summer of 1988, four stations # 12, 14, 24, and 26 have been tested positive for coliform. The results show a high concentration of coliform bacteria at these stations. The highest concentration occurred during the months of July for Stations 5, and # 25. This result is consistent with the study provided by the Council of Governments, in that the river is consistently in violation of the fecal coliform standards. River waters combined with turbid, nutrient-rich storm sewer run-offs as well as the effluents coming from the Blue Plains sewage treatment plant. (See Figure 12g)
Plankton-and-Benthos5.9 The dominant species were protists and chlorophyceae. Chlorophyceae was the highest occurring species in both Phase I and Phase II of the study. Chlorella and Chlamydomonas were the only occurring organisms during the period of September 1988 and July 1989. Scenedesmus, Cholorella, Pediastrum, and Chlorococcum were recorded as the most commonly occurring Chlorophyceae in April to July 1988. This particular group of algae are prevalent during the warmer months. The abundance of these species corresponds to the increase in the concentrations of phosphate, phosphorus, and nitrates. If there is an increase in a "normal" level of both nitrate and phosphate, a eutrophic water stem was observed in stations Numbers # 4, 5, 8, 12, 24, 25, and Eutrophication is generally associated with high sewage effluents or enriched run-offs and overflows found within or around the drains located along the Anacostia River. The results show the species of Chlorophyceae (Chlorella, Scenedesmus, and Ulothrix). This indicates a heavier organic effluent which was exhibited in station # 4D (located at a drainage site) and also stations # 4 S (South) , #8 and # 16 D. Soil and water analyses for stations # 8 and 16 D show high readings of phosphates, ammonia, and nitrates. These three substances are vital nutrients for phytoplankton, and an excessive influx of the former can result
20

in creating "cultural" eutrophication. Such occurrences are derivatives of either concentrated outflows from wastewater drains or upstream floodwaters. In addition, urban runoffs are "flushed" into the Anacostia River which increases the levels of pollutants posing as threats to the low and fragile plankton environment. Stations with drains, inlets, and sloughs show a shift of abundance from "diatom-dominated flora" to an increase in population of green algae, specifically Oedogonium and Cladophora. The appearance of these species is indicative of heavier organic load within the lotic contents of the Anacostia. Increase in diatomaceous algae may be due to heavy calcite runoffs from construction sites, outwash from rainfall, storm waters, and other urban interference.
The protozoan species were quite abundant during the first and Second year of study. The most common species found are: the Protists, Flagellata, Euglena, Phacus, and Colpidium. Seasons tend to affect the occurrence of these species. The Flagellates increased in number during the summer months with decreases in the Ciliates and Sarcodinids. Euglena, Phacus, and Colpidium were quite common during phase 2 of the study. For the earlier period, the following species emerged as commonly occurring : Colpidium, Phacus, Vorticella, Lepocinclis, and Euglena. The flagellates increased in abundance during the summer season while ciliates and sarcodinids decreased in number.
During the summer months, there is a greater tendency for the diatomaceous algae to
appear, especially the species Navicula and Cyclotella. During the warmer seasons, however, there is an increase appearance of the Nelosira. Navicula, Cylotella, and Nelosira are generally associated with filter clogging water systems. In Phase I of the study, the Nelosira species was also high. The other predominant species identified are : Diatoma, Nitzschia, and Stephanodiscus. All stations exhibited high' occurrence of these species. The tendency towards the preponderance of the diatomaceous algae over the Cyanophyceae group (See Figure 9) was noted.
Few species of Cyanophyceae were found. Oscillatoria was found in all samples;
Gomphosphaeria, and Phormidium were but few of this type, although, Station 24 and 25 were high in the anophyceae group. The Cyanophyceae species are indicative of extremely heavy pollution of organic nature.( See Table 11). This indicated that the water quality of the sample stations are not under the state of decomposition/mineralization zone. This could be regarded as being good because it is indicated in most water quality criteria assessments (Best, 1977, and Hynes, 70) that Cyanophyceae is indicative of extremely heavy organic llution. Chlamydomonas, Chlorella, Euglena, Oscillatoria, and edesmus are tolerant to organic pollution. This group of algae present to a greater degree at the drainage more than at the mouth of the drainage. This suggests, that phosphorus and ammonia are more concentrated at the dranage location, and that the outflow at the source of this condition.
Comment [C1]:
Comment [C2]: Start from page 53
21

The Anacostia River has exhibited high levels of pollution as indicated in this study, and the sources of this problem stems from urban development and its elimination of waste materials.
5.10 BENTHOS Species diversity appears to be constant from April 1988 to July 1989. The following
sights are common to the Anacostia River: visible waste deposits; oil spills, organic materials, heavy sedimenatation. These features are commonly expected in #8 (Hickey Run), #5 (Watts Branch), #14 (Department of Public Works),, # 24, #25, and # 26.
During Phase I, the most abundant species was Tubifex sp. The other singnificant
organisms found were Cladocerans; Rotifers: Copepods; Nematodes and Annelids. Only one species of clam and snail were found. There were no species categorized as intolerant species found during from April to July 1988. The months of April to July are generally regarded as peak seasons for most invertebrates to emerge and reproduce after a long period of dormancy. The organisms found in the 16 samples examined show that these species are more habitual for general population growth which tends to fluctuate with the water quality and other essential elements required to enhance population growth.
Most organisms thrive under "cleaner" conditions and slower currents which affects the
dispersal of each individual species in their own given environment. High levels of phosphorus, calcium, ammonia, nitrates, cyanide, etc., would affect some organisms, but not all species. Some species become susceptible and some would develop tolerance/ and or vulnerability producing high / low population, decrease / increase in reproductive rate, or a total extinction of the species ( Hynes, 1975 ). The results show that species diversity is low in all stations. However, some tolerant species such as the Tubifex sp. can thrive considerably under extreme environmental conditions. Most tubificid worms are found in areas with low dissolved oxygen (DO) but are absent if toxic pollution is present.
The Biotic Index Readings summarizes the general quality of the river (See Table II).
This table shows a high level of pollution located at four stations : 12 S, 24S, 26D, and 26R. The presence of subtolerant or intolerant species indicate how stressed the river system is. Again, Tubifex was found in practically all the samples from the 9 stations. It appears that is species has a high tolerant level to effluents such as cyanide, ammonia, manganese, and chlorides emitted into the river.
Using all the benthic organisms found in the 9 study stations a Table of Pollution Status was created to categorized he species found:
22

TABLE 1 2
Pollution Status
Tolerant Facultative Intolerant
Total No. of benthic 88 26 3 Species
TABLE 13
TOTAL SPECIES IDENTIFIED DURING THE THREE YEARS OF STUDY
Intolerant Tolerant Facultative
Total No. of 1647 (48.9%) 1704 (50.6%) 17 (0.7%) Benthic Species
Total Species 3368
Benthic species are composites of biological indices for monitoring water quality as shown in this study. Species diversity provide correlating factors such as the type of organisms found as well as the correlations to the tolerance of the species analyzed. e above Tables 12 and 13 provide this overview.
The use of benthic organisms as indicators of water quality river management is shown in this study as marked by the species reaction to certain changes in the natural features of the river. These associated features are depth, width, type of substratum, water velocity, chemicals, and the physical factors considered. Human activities have greatly influenced the changes occurring constantly in this aquatic environment which affects the abundance distribution of benthic species attributed to a given sector the river. Seasonal changes is another factor considered in terms of limiting species diversity. Dominance of the species may attributed to the surrounding environment as well as the individual species' ability to adapt to harsh conditions. Figure 10 summarizes the status of benthic species in the river from April 1988 to March 1990. High levels of chlorides, sodium, and other salts, including
23

cyanide can kill many benthic species. This study show that there were "extreme" cases, resulting in low diversity of benthic species. The stations found to be polluted between April and July 1988 were Stations 4, 12, and 14, all located on the northern part of the river, and 16, 24, 25, and 26 (North and Drain). Overall readings (see Biotic Index Chart), Tables 10 and II indicate that the most polluted stations appeared to be stations 25 and 26 (North and Drain Sites). These findings may well be associated with the fluctuating and tidal innundation of the Anacostia River, as well as the limiting factors such as time of the day, weather,and seasonality. Station 26 is located at a storm water drainage which accentuates the instability in the frequency and occurrence of species found in this station.
It should be noted that the most abundant tolerant benthic species is found in station # 14 (7/6/88, N=112). Table 14 summarizes the organisms found at the various stations sampled. Although the sample size is obviously samll for all the organisms tound; the species found are basically indicator species of pollution. Intolerant species were not found while 2 to 3 facultative or subtolerant species were encountered. The number of individuals and species were very low. These values indicate that the only species that can survive are species that have already been singled out with the wide range of tolerance limit such as the Tubificid worm. This species has been recognized as indicator of thermal and organic pollution.
A total of 335 benthic species were found with varying individual species of 21 . During
the second year a total of 2,419 species and a diversity number of 42 (See Table 19 ). The most commonly occurring species were Tubifex, Cyclops, and Diaptomus, Nematodes and other Oligochaetes. The tubificid worms and other Oligochaetes were present in most of the nine stations. These stations are highly polluted particularly of organic wastes which exist in large proportions. After a storm, copepods were quite common in some samples. These species are considered tolerant.
From April, 1988 to July, 1989 there has been low species varsity and abundance due to visible waste deposits, oil spills, organic materials, etc. Stations # 8 (Hickey Run), #5 (Watts Branch), #14 (Department of Public Works, # 24, # 25, and # 26 exemplify these conditions. Benthos population was very low. These stations also show the presence of harmful contaminants as shown the water and soil analyses (See Tables 9 a-u). Total benthic species examined, identified, and catalogued according to their pollutional status showed a total' of 3368 species (See Figure 10 ). Some benthic organisms can be used as indicators of water quality. These organisms showed marked ction to certain changes in the natural features of the river. The most abundant species is Tubifex sp. This species can adapt to utmost harsh conditions of low dissolved oxygen (DO) similar to anerobic condition. Figure shows the distribution of the benthic cies. This figure shows that most organisms are facultative, that is, the ability of the species to survive but preferred
24

"cleaner' waters, and very few tolerant, and intolerant species." The nine stations examined, showed that Anacostia, although low in speciers diversity, also showed a wide range of species collected within a given season. During the winter months, December to February, there were no organisms present, or if present, were few, with low diversity. Species predominant during the winter months were the Annelids such as the Tubifex OR, and Enchytraides. These organisms are known as " eubenthoc " which are dependent on the quality of the susbtrates, and any changes occurring in this area can greatly reduce the population diversity. Epibenthic communities consist of cladocerans, copepods, rotifers, and some insect larvae, and nymphs, are quite susceptible to any changes in the water quality as well as those organisms associated with submerged solid surfaces such as the periphyton (Mitchell & Stapp, 1981).
Other macroinvertebrates present are Annelida, Molluscs, Nematodes, Crustaceans, and some insect larvae. Molluscs have been few in numbers. The subtolerant groups of Molluscs found in Phase I and Phase II were Heliosoma and Physa sp. These species are indicative of changing sedimentary deposits, increase in water temperature, adaptation, and harmful toxins present in the river (Fuller, 1978). The Valvata sp is very low in Anacostia River. Valvata is intolerant to alkaline and acidic waters. They are also not capable of surviving in vary harsh environments as exhibited by the Anacostia River. It is an indicator species of stable water conditions and the absence of this organism suggest that pollutants are present.
During the months of June to July (1988-1989) when water emperatures begin to rise
quickly, substrata organisms were resent, as exemplified by the leech (Placobdella parasitica sp). other related organisms obtained from the nine stations are: ladocera, Hydra, Ostracod, Platyhelminthes, Prostoma, Rotifera, and Watermites. Scud (Gammarus sp.) and sowbug (Asellus sp) are identified. These two species although present were very arse. Scud and sowbug are intolerant to pollution. Asellus sp. for example is somewhat able to survive longer, hence can be consider as facultative species.
Soil samples collected ranged from silt/sand to gravels. The substrate plays an important
role in the habitation of many benthic organisms. Soil samples of silty deposits show a large numbers of Tubifex sp. The larva Midge, Chironomus a eubenthos species is as equally tolerant as the Tubifex and are usually found in silty sediment. Substrate samples collected from April to July 1988 show variations in the pH, the samples ranged from alkaline slightly acidic compared to the September to July, 1989 data. High amounts of ammonia, calcium, iron, magnesium, and phosphorus also show correlations in finding eubenthic species such as the oligochaetes and nematodes.
25

5.11 PLANKTON
Figure 9 shows the total species composition of plankton collected and identified from April, 1988 to September, 1988; to July, 1989; September to December, 1989: and January to March 1990.
In majority of the sites the dominant species were protists followed by the
Chlorophyceae. The Chlorophyceae was the highest ocurring species in Phase I and Phase II. Chlorella and Clamydomonas also were the commonly occurring organisms during the period of September, 1988 and in July, 1989. Scenedesmus, Chlorella, Pediastrum, and Chlorococcum were recorded as the most my occurring Chlorophyceae during April to July 1988. This particular species of algae are prevalent during the warmer summer months as shown for 1988 and 1989 respectively. Quite often, "algal blooms" were observed in majority of the stations. The resulting algal bloom may be related to the increase phosphate, phosphorus and nitrates (See Tables _8, 9_ and 10).Nitrates and phosphates were high, which could create a "eutrophication" as was observed at some sites, notably stations 4, 5, 12, 24, 25, and 26. Eutrophication is generally associated high sewage effluents and enriched runoffs found within and drains located along the Anacostia River.
Figure 9 shows the total plankton species identified from April, 1988 to March, 1990. This figure shows that dominant species were the Protists (Ciliates, Flagellates, and Sarcodinids) primarily zooplanktons. The flagellates increased during the summer season with decreases in ciliates and sarcodinids.
The Desmediaceae (Chrysophytes) are commonly found throughout most seasons
during the months of September to early Their abundance in a widespread area indicates the seasonality of these species as specific group members display. During the spring season, there is a greater tendency for more diatoms especially the species Navicula and Cyclotella. However, during warmer summer season, there is an increase in the appearance of Melosira. These three species are generally associated with filter-clogging systems. This trend was observed during Phase I and II of this study. The Chlorophyta group are dominant during conditions. Their appearance fluctuates between early and early fall. The Cyanophyta are also seasonal. Stations # 24 and # 25 showed characteristics typical of polluted waters septic "pig-pen" odors, slimy gelatinous clumps on rocks and boulders. Such conditions were quite overbearing. Examination of gelatinuous material showed the presence of Schlizothrix and Microleus with species of Anabaena and Anacystis. Thomas in 1975, showed these species as indicators of water quality.
26

The river is highly polluted as indicated by the type of planktons found. Desmediaceae is generally associated with organic effluents from storm water overflows as: observed in Stations # 14, 24& 25. The Chlorophyceae is indicative of high phosphates and nitrates present in the water. These correlations may be found in Tables 4
Nutrients, sediments, and trace metals, including pollutants, etc., can limit: 1) the growth of plankton population; 2) abundance of the species: 3) size of the population; and 4) species succession. Nitrate and phosphate, are two of the nutrients vital f o r plant growth in an aquatic ecosystem. Thus an increase in these nutrients, can produce a high growth rate in some species of algae, which in turn create an enriched water resulting in eutrophication. Table shows the concentrations of nitrates and phosphorus (ppm) in all the stations surveyed. Nitrates and phosphorus deter organisms and macrophytes to grow and impede water self-purification and the production of other essential features, specifically the dissolved oxygen (DO), pH, including conductance. The ranges for nitrates and phosphorus were 2 - 10 ppm for nitrates and .05 - 50 ppm for phosphorus respectively. High sewage effluents were found at most drainage sites along the river. Plankton are indicators of water quality. Identification and measurement of the extent of pollution in waters using the plankton community clearly elucidate the chemical condition and productivity of the Anacostia River. Pollution often resulted in tremendous mortality of plankton species. The effect of i n c r e a s i n g pollution upon the representative plankton species in stations # 4, # 12, # 4# 16,# 25, and # 26 was reflected in the significant decrease in their occurrence per sample except for the Cyanophyceae species. The results show that Chlorophyceae, Euglenophyceae, Protozoa, and Cyanophycese in this order were dominant, but Desmediaceae
to 5. The correlation of these species with pollution is seen in the results obtained from water and soil samples analyzed. Urban runoffs, fertilizers, and fertilizers are conglomerates of phosphorus and nitrogen compounds. Increase in the phytoplankton population will in turn increase the zooplankton followed by other benthic invertebrates and other larger vertebrates thus increasing the diversity of the population.
A total of 5 0 51 species were found at 9 station sites. Figure 10 shows the total benthos species identified from April, 1988 to March, 1990. The most abundant species were Tubifex/Sludgeworm and Copepods. Species of the Insecta/Pterygota emerged during spring to early fall (April to September). Most organisms found are facultative. During the winter months (December to January) the species present were few in number and diversity. These species are the Tubifex and Enchytraieds. These species are eubenthic species, which are dependent on the quality and texture of the subtrate and any changes occurring in the river can greatly reduce the population of these species.
5.12 PLANKTON PRODUCTIVITY
27

appeared low in all stations. Domestic sewage and waste pollution may account for at least a part of the difference in the frequency and occurrence of the plankton species in six of the stations. Organic pollution, in addition to high concentrations of waste materials found in inlets, sloughs, and around drains are sources for increase in the Chlorophyceae and Cyanophyceae. Heavy calcite run-off from construction sites; outwash from rainfall or storm waters and urbanization will encourage the growth of diatomaceous species. Stations with alkaline pH also exhibited high occurrence of these species.
Table 15 summarizes the occurrence of the plankton species.
Taking all the groups into consideration, during these past three years, emphasis was placed on the abundance of algae with direct reference to seasonal changes, along with added controlling limiting factors such as alkalinity, conductivity, temperature, essential nutrients, pH, etc. The effect of climatic or ambient features can in fact directly affect the type and the number of se species. Such behavioral patterns were noted in a shift in the abundance of "diatomaceous algae" to an increase in the population of Chlorophyceae, primarily of Oedogonium and Cladophora. This change creates an added feature of heavier organic load within the lotic contents of the Anacostia. In addition, the tolerant level for both species of Chlorphyceae and Cyanophyceae main factor behind organic pollution. Concentrations of waste materials found within and around drains, inlets, and sloughs were evident in this study. The Anacostia river has exhibited high levels of pollution as indicated in the findings provided in this report. The problem obtaining in this river originates from urban developments, wastewaters, and management, as well as other contributing factors: 1) recreational activities: 2) urban waste materials; 3). agricultural by products; 3) nearby cement factory; 4) sheer neglect by man. These factors affect the overall natural quality of the river. ( See Tables 16 .21 )
5.13 BENTHOS PRODUCTIVITY
Tables2 2-27 summarizes the occurrence of benthic species. Figure 10 summarizes the
occurrence of the species. Were there high incidence of pollution as exemplified by the type of benthic species occurring, the same species kept recurring. Most organisms are facultative (Tolerant) meaning there is a tendency for most organisms to survive but preference lies in "cleaner" waters. Given the physical factors of pH, temperature, mineral/nutrient contents, etc., pose as both a threat and enhancement for individual species survival. As noted previously in the plankton species, limiting factors can create a eutrophic or oligotrophic conditions depending on the availability and nature, and or composition of the minerals, light, temperature, etc. These can produce an increase in population density, growth rate, thus promoting the abundance of more diverse food sources. Tolerant species emerged as the dominant, were there were
28

48.9% as a group, and 0.5% intolerant and not capable of adapting. The subenthic community are dependent on the quality of the lower strata and any changes occurring in this area can greatly reduce the population diversity. Epibenthic communities are more susceptible to any changes in water quality as well as those submerged in solid surfaces which constitute the periphyton. All these subdivisions of the macroinvertebrates are affected by the continuous strains placed on the river, and the benthos species. This report shows the possibility of losing this community of organisms.
Overall, Anacostia has displayed a wide range of species collected and counted within a given seasonal pattern. During the winter months, December to February, there were no organisms present, or if present were very few in number and diversity. The subdivisions of the benthic community discussed are affected by continuous strains placed on the water quality. Population distribution correlates well with the availability of the physical factors and how these factors can limit habitation. During the last two years of this study, there has been a turn towards eutrophic conditions with increased algae and few intolerant species. This relates to the outflows of effluents during heavy `seasonal floods or direct point sources of human activites which invariably alters the aquatic community. CONCLUSION
The Anacostia River is faced with three major problems:
1. High Sewage Discharge
The river carries high amount of sewage and nonpoint discharges. Data obtained on the water quality and soil analyses showed the concentrations had exceeded levels which are detrimental to some indicator species. Values obtained for some water quality parameters such as: temperature, pH, conductivity, and dissolved oxygen, and chemical analyses of the substrate and water samples are high in majority of the stations or within the norm in others. Illegal discharges from the nearby power plant, and the cement factory, together with malfunctioning sanitary sewers are the responsible culprits changing the biota of the river.
2. Low Plankton and Benthos Species
The water quality of the Anacostia River is poor. Population density of plankton and
benthic organisms fluctuate with water and substrate quality. The benthic community are dependent on the quality of the substrate as well as the quality f the water. Some freshwater plankton and benthos were not found in this study. Sensitive values for temperature, pH, conductivity, and dissolved oxygen, including high and low concentrations of substances caused largely by forces of erosion and sedimentation, anthropogenic activities, and urbanization limit the productivity of this ecosystem.
29
3. Sedimentation, Siltation, and Erosion
The physical forces of erosion and sedimentation is another problem occurring in the river. Siltation and sedimentation build-up contributes to the disappearance of wetland vegetation and invasion of the barren swampland by terrestrial invading species such as tree of heaven and honeysuckle bush. The river which was once pristine, today, exhibits great problem relation to these forces.
It is apparent that life in the Anacostia River has already n changed by the various limiting factors discussed in this study. The river has changed completely an is beginning to turn into a swampland. This study identifies these problems and enables one to wonder if there is still a way to clean the once pristine system. It is not too late, but, there is still a chance.
30

R E F E R E N C E S American Public Health Association, American Water Works Association and Water
Pollution Control Federation. 1986. Standard Meyhods for the Examination of Water and Wastewater. Edited by Arnold E. Greenbert, Joseph J. Connors, and David Jenkins. 21st Edition.
Armitage, P.D., Moss, D., Wright, J.F., and Furse, M.T. 1983. "The Performance of a New Biological Water Quality Score System Based on Macroinvertebrates Over A Wide Range of Unpolluted Running-water Sites". Water Resources. Pergamon Press, Oxford, Great Britain. Vol. 17, pp.333-347.
Bargos, Txomin, Mesanza, Jesus M., Bassaguren, Ana and Orive, Emma. January, 1990. "Assesssing River Water Quality by Means of Multifactorial Methods Using Macroinvertebrates (A Comparative Study of Main Water Courses of Biscay)". Water Resources. Pergamon Press, Oxford, Great Britain. Vol. 24, No. 1, pp. 1 - 10.
Beck, W. M., Jr. 1954. Studies in Stream Pollution Biology: I. A Simplified Ecological Classification of Organisms. J. Fla. Acad. Sciences, 17(4): 211 - 227.
Best, G. A., Ross, S., 1977. River Pollution Studies. Liverpool: Liverpool University Press.
Burby, Raymond J. and Kaiser, Edward J. 1987. Emerging State Roles in Urban Stormwater Management. Water Resources Bulletin. June. Volume 23,No. 3, pp.43.
Carnegie, J. and J. Wooley. 1978. Laboratory Manual for Water and Waste Water, Part II Advanced. Linn-Benton Community College.
Ciaccio, Leonard L. 1971 (edited). Water and Water Pollution Handbook (in four volumes). Marcel Dekker, Inc., New York. Volumes I & II.
Coffman, W. P.; Cummins, W.; and Waycheck. J. C. 1971. Energy Flow in a Woodland Stream Ecosystem: I. Tissue Support Trophic Structure of the Autumal Community. Arch. Hydrobio. 68(2) :232-76.
Cummiins, J. D. 1985. 1984 Fisheries Survey of the Potomac and Anacostia Estuaries in Washington, D. C. George Washington University, 49 pp.
Currie, D.J. and Kalfe, J. 1984. The Relative Importance of Bacteria-Plankton and Phytoplankton of Phosphorus Uptake in Freshwater. Limnology Oceanographer. Vol. 29, pp. 311-321.
31

Davids, Donald D. and Wilhour, Raymond G. 1976. Susceptibility of Woody Plants to Sulfur Dioxide and Photochemical Oxidants. Corvallis Environmental Research Library, Office of Research and Development, U. S. Environmental Protection Agency, Corvallis Oregon. 72p. EPA-600/3-76-102.
Davis, Robert M. and Enamait, Edward C. 1982. Benthos-- Maryland/ Potomac River Watershed: Distribution and Abundance of Fishes Benthic Macroinvertebrates in the Upper Potomac River 1975-1979. Maryland Department of Natural Resources, Wildlife Administration, Annapolis, Maryland.
Department of Consumer and Regulatory Affairs. April, 1988. Water Quality Assessment: Volume I. DCRA, Housing and Environmental Regulation Administration, Environmental Control Division, Water Hygiene Branch. Government of the District of Colombia.
Dietemann, Allan J. and Giraldi, Robert. 1973. Resource Identification Study for the Anacostia River, Volume IV, 1948 vs. 1972, Fish Distributions. Maryland Department of Natural Resources Publications.
Egloff, D. A. and Brakel, W. H. 1973. Stream Pollution and a Simplified Diversity Index. Journal of Water Pollution Control Federation. Vol. 45, No. 11, p. 2269 - 2275.
Freed, J.R. and Slimat, M.W. 1978. Biological Indices in Water Quality Assessment. Versar Inc., Springfield, Va. ICPRB, Rockville, Md. Technical Publication, 78-2. From The Freshwater Potomac, Aquatic Communities and Environmental Stresses Proceedings of a Symposium, Jan.,1977, Md. p.76-79. Flynn, K.D. & Mason, W.T.(editors).
Fresi E., Gambi,M.C., Focardi,J., Bargagli,T., Baldi,F., and Falcai,L. 1983. Benthic Community and Sediment Types: A Structural Analysis. Marine Eclogy. Vol. 4, pp. 101-121.
Fuller S. 1978. The Changing Molluscan Community. Academy of Natural Sciences of Philadelphia, Pa. Division of Limnology & Ecology.
Gauch, H.G. 1982. Multivariate Analysis in Community Ecology. Cambridge University Press, England.
Gore, James A. 1985. The Restoration of Rivers and Streams-Theories and Experience. Butterworth Publishers, Boston.
Gosner, Kenneth L. 1971. Guide to Identification of Marine and Estuarine Invertebrates. Wiley-Interscience, a Division of John Wiley & Sons, Inc. New York.
32

Greeson, Phillip E. 1982. An Annotated Key to the Identification of Commonly Occurring and Dominant Genera of Algae Observed in the Phytoplankton of the U.S. Geological Survey WaterSupply Paper. U.S. Department of the Interior. U.S. Government Printing Office, Washington, D.C.
Haith, Douglas A. and Shoemaker, Leslie L. 1987. Generalized Watershed Loading Functions for Stream Flow Nutrients. Water Resource Bulletin : Volume 23, No. 3, June. pp. 471.
Harmon, G.H. 1978. Benthic Macroinvertebrates of the Freshwater Potomac. Maryland Department of Natural Resources, Annapolis. Water Resources Administration. ICPRB, Rockville, Maryland. Technical Publications, 78-2. Taken from "The Freshwater Potomac, Aquatic Communities and Environmental Stresses Symposium, Jan., 1977, Md. Flynn, K.D. & Mason, W.T.(editors). p. 29 -35.
Hart Jr., C.W. and Fuller, Samuel L. H. 1974(edited). Pollution Ecology of Freshwater Invertebrates (Water Pollution - A Series of Monographs). Academic Press, New York.
Hawkes H. A. 1979. Invertebrates as Indicators of River Water Quality. In Biological Indicators of Water Quality. James, A., and Evison, L., Eds., John Wiley & Sons, Chichester, UK.
Hellawell, J.M. 1986. Biological Indicators of Freshwater Pollution and Environmental Management Pollution Monitoring Series. Elsevier Applied Science Publishers, New York.
Howden, Henry F. 1948. An Ecological Study of the Distribution of the Fish in the Anacostia River Tributaries in Maryland. M.S. Thesis (Unpublished, Dept. of Zoology, University of Md.)
Hynes H.B.N. 1970.The Ecology of Running Waters, University of Toronto Press, Ontario, Canada.
Hynes, H.B.N. 1974. The Biology of Polluted Waters. University of Toronto Press, Toronto, Canada.
Junk, Dr. W. 1986. Seasonality of Freshwater Phytoplankton : A Global Perspective.
Kaesler, Roger L. and Herricks, Edwin E. 1976. Analysis Of Data From Biological Surveys Of Streams: Diversity and Sample Size Water Resources Bulletin, American Water Resources Association, Vol. 12, No. 6.
Keller, F. J. 1962. Effects of Urban Growth on Sediment Discharge Northwest Branch, Anacostia River Basin, Maryland. U.S. Geological Survey Professional Paper #450.
33

Kings D. L., and Ball, R. C. 1964. A Quantitative Biological Measure of Stream Pollution. J. Water Pollution Control Fed. 36: 650 - 653.
LLoyd, M., and Ghelardi, R.J. 1964. A Table for Calculating the "Equitability" Component of Species Diversity. J. Anim. Ecology. 33: 217 - 225.
Macan T.T. 1959. Freshwater Invertebrate Animals. Longmans, Green & Co. Ltd., London, England.
Mackenthum, Kenneth M. 1969. The Practice of Water Pollution Biology. U.S. Department of Interior, Federal Water Pollution Control Administration.
Mackinnon, Doris L. and Hawkes, R.S.J. 1961. An Introduction to the Study of Protozoa. Oxford at the Clarendon Press.
Metropolitan Washington Council of Governments. 1983. Urban Runoff in the Washington Metropolitan Area (Final Report - Washington, D.C. Area Urban Runoff Project): United States Environmental Protection Agency Nationwide Urban Runoff Program . Washington Metropolitan Water Resources Planning Boards Department of Environmental Programs.
Metropolitan Washington Council of Governments. 1986. Baseline Water Quality Assessment of the Anacostia River. Department of Environmental Programs, Water Resources Planning Board and the Maryland Department of Health and Mental Hygiene. 111 p.
Metropolitan Washington Council of Governments. 1987. Potomac River Water Quality 1984: Conditions and Trends in Metropolitan Washington. Department of Environmental Programs/Water Resources Planning Board.
Mitchell, Mark K. and Stapp, William A. 1986. Field Manual for Water Quality Monitoring. Thomson-Shore Printers. Dexter, Michigan.
Moss Brian. 1980. Ecology of Freshwater. (Freshwater Phytoplankton & Seasonal Variations).
Munawar, M. and Talling, J.F. 1977. Seasonality of Freshwater Phytoplankton : A Global Perspective Developments in Hydrobiology. Klummer Academic publishers.
Needham, James G. and Needham, Paul R. 1976. Guides to the study of Freshwater Biology. Holden-Day Inc., San Francisco. 5th edition.
34

Nightingale, Harry I. April, 1987. Water Quality Beneath Urban Runoff Water Management Basins. Water Resources Bulletin Volume 23, No. 2. pp. 197.
Omernik, J.M. and Powers, C.F. 1982. Total Alkalinity of Surface Waters - A National Map. United States Environmental Protection Agency. U.S. Government Printing Office, Corrallis, Oregon. EPA - 600/D82-333.
Overcash, Michael R. and Davidson, James M. 1981 (edited). Environmental Impact of Nonpoint Source Pollution. Ann Arbor Science Publishers Inc./ the Butterworth Group, Ann Arbor, Michigan.
Pearse, Vicki, John Pearse, Mildred Buchsbaum, and Ralph Buchsbaum. 1987. Living Invertebrates. Blackwell Scientific Publications, Palo Alto, California and The Boxwood Press, Pacific Grove, California.
Pennak, Robert W. Ph.D. 1953. Fresh-Water Invertebrates of the United States. The Ronald Press Company. New York.
Pratt, Henry Sherring, Ph.D. 1935. A Manual of the Common Invertebrate Animals (Exclusive of Insects). Mcgraw-Hill Book Company. Inc., New York, London, Toronto.
Ragan, R.M. and Rebuck, E. C. 1973. Resources Identification Study for the Anacostia River
Basin. Vol. 1. General Report Prepared for the Maryland Department of Natural Resources, Department of Civil Engineering, University of Maryland.
Reid, George K. 1965. Ecology of Inland Waters and Estuaries. Reinhold Publishing Corporation, New York. 4th Edition.
Reynolds, C.S. 1984. The Ecology of Freshwater Phytoplankton. 1984. Cambridge University Press.
Science of the Total Environment. Feb.15, 1984. "The Influence of Surface Runoff on the Macro-Invertebrate Fauna of an Urban Stream". Volume 33. pp. 271(12).
Spoon, Donald M. Survey. 1976. Ecology, and Systematics of the Upper Potomac Estuary Biota: Aufwuchs Microfauna Phase II. Department of Biology, Georgetown University. WRRC Final Report No. 8, Project No. B006-D.C. Water Resources Research Center, Washington Technical Institute, Washington, D.C. 20008.
Hess, Michael J.(editor). 1986. Examination of Water for Pollution Control A Reference Handbook. World Health Organization(WHO). Volumes I - III.
35

Taylor, W.R. and Grant, V. 1977. Plankton Ecology Project Nutrient and Chlorophyll Data. Alsop Cruises, April 1969 to April 1971. Special Report 61. The Johns Hopkins University. Chesapeake Bay Institute, Baltimore, MD. 121pp.
Thomas, William A. 1975. Indicators of Environmental Quality, New York. Plenum Publishing Co.
Department of Agriculture Soil Conservation Service. 1976. Soil Survey of the District of Columbia. National Cooperative Soil Survey. In Cooperation with U.S. Department of the Interior, National Park Service, National Capital Parks.
Environmental Protection Agency. 1985. In Cooperation with the State of Maryland, Commonwealth of Virginia, District of Columbia, Commonwealth of Pennsylvania. Chesapeake Bay Restoration and Protection Plan. Chesapeake Executive Council.
Environmental Protection Agency. 1985. Ambient Water Quality Criteria for Ammonia - 1984. U.S. EPA. US Government Printing Office. Duluth, Mn. EPA/440/5-85-001.
Geological Survey. 1984. A Water Quality Study of the Tidal Potomac River and Estuary-An Overview. U.S. Geological Survey Water-Supply 2233, 46 p.
Geological Survey. 1985. Distribution and Abundance of Submerged Aquatic Vegetation in the Tidal Potomac River and Estuary, Maryland and Virginia, May 1978 to November 1981. U.S. Geological Survey Water-Supply Paper 2234-A, 46 p.
Whitton, B.A. ed. 1975. River Ecology Studies in Ecology, Ecology, University of California Press, Berkley. Vo1.2, 1975. 345-402.
36

APPENDIX

FIGURES


37

38

39

40
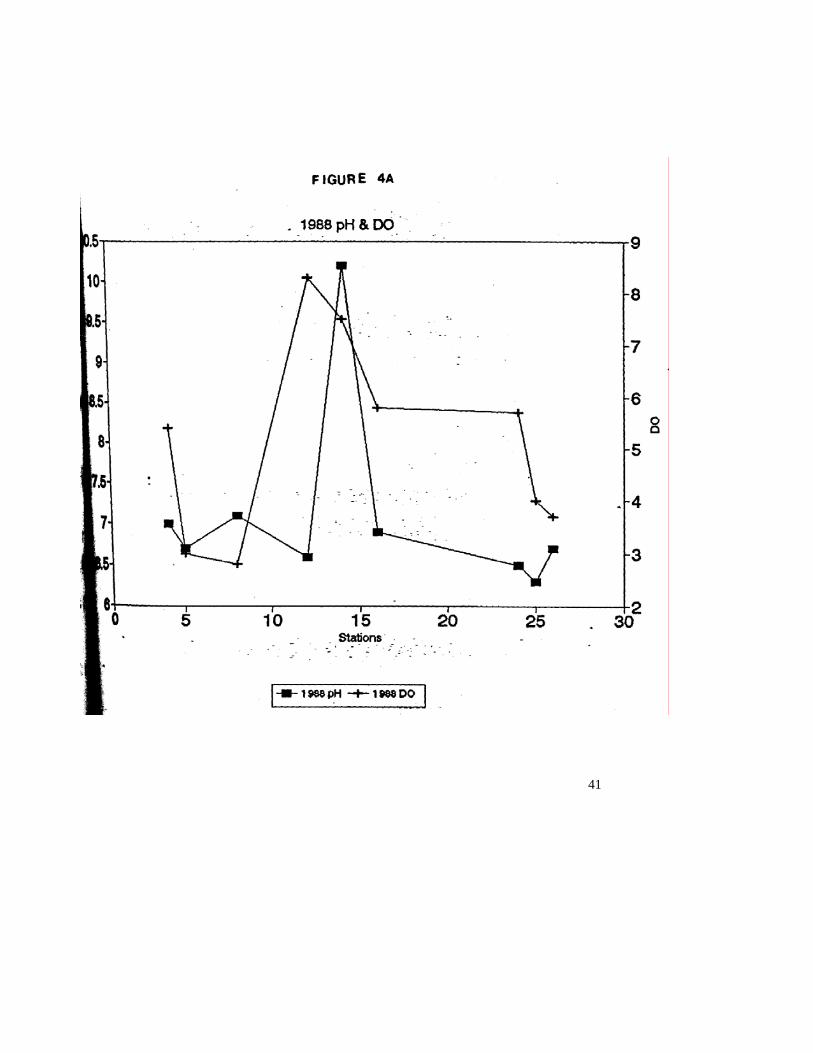
41

42

43

44

45

46
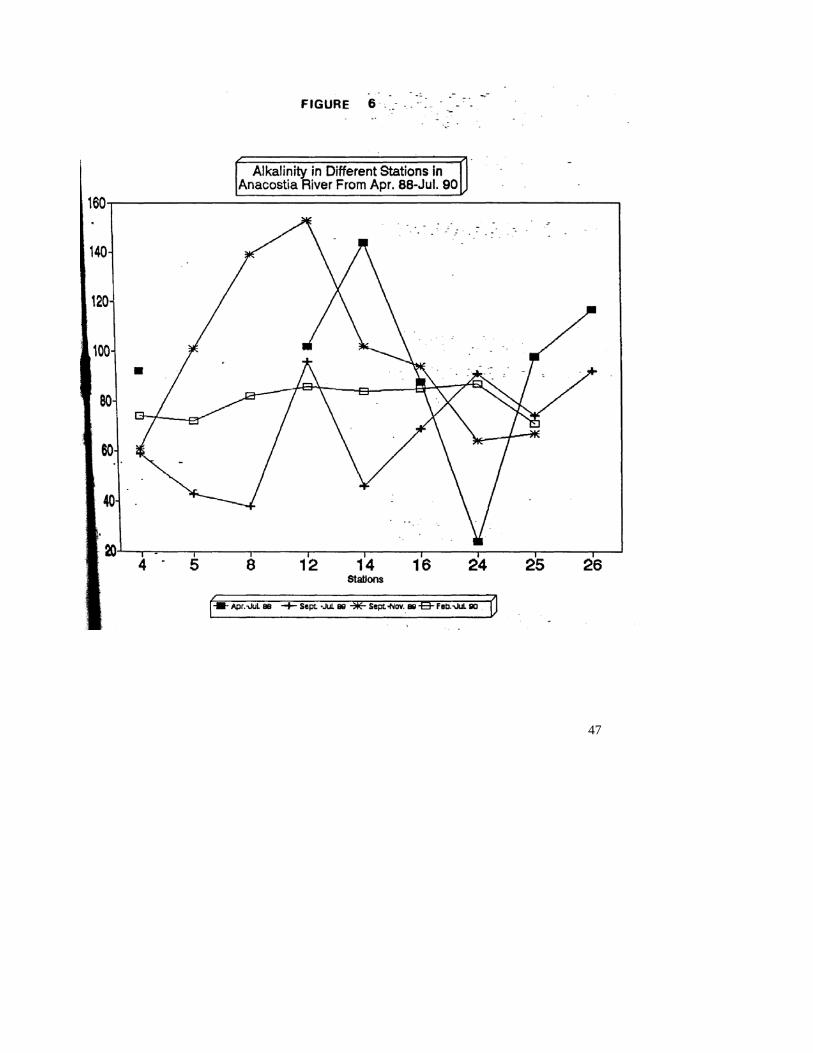
47

48

49
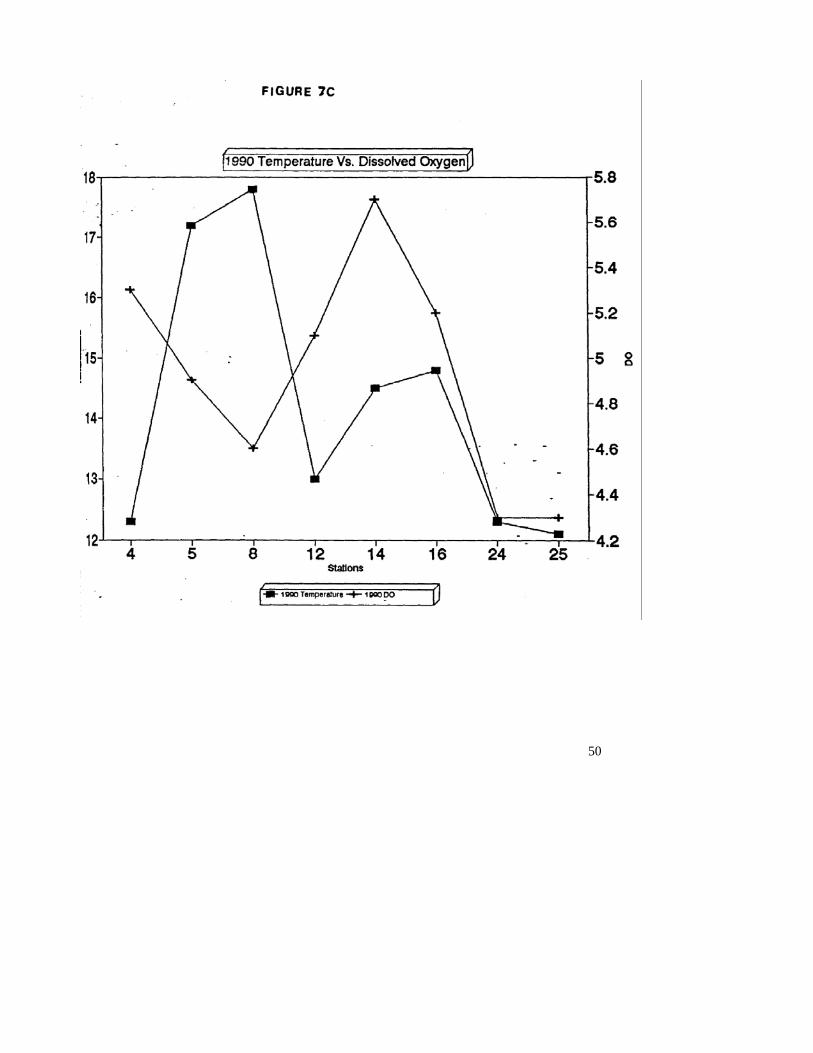
50
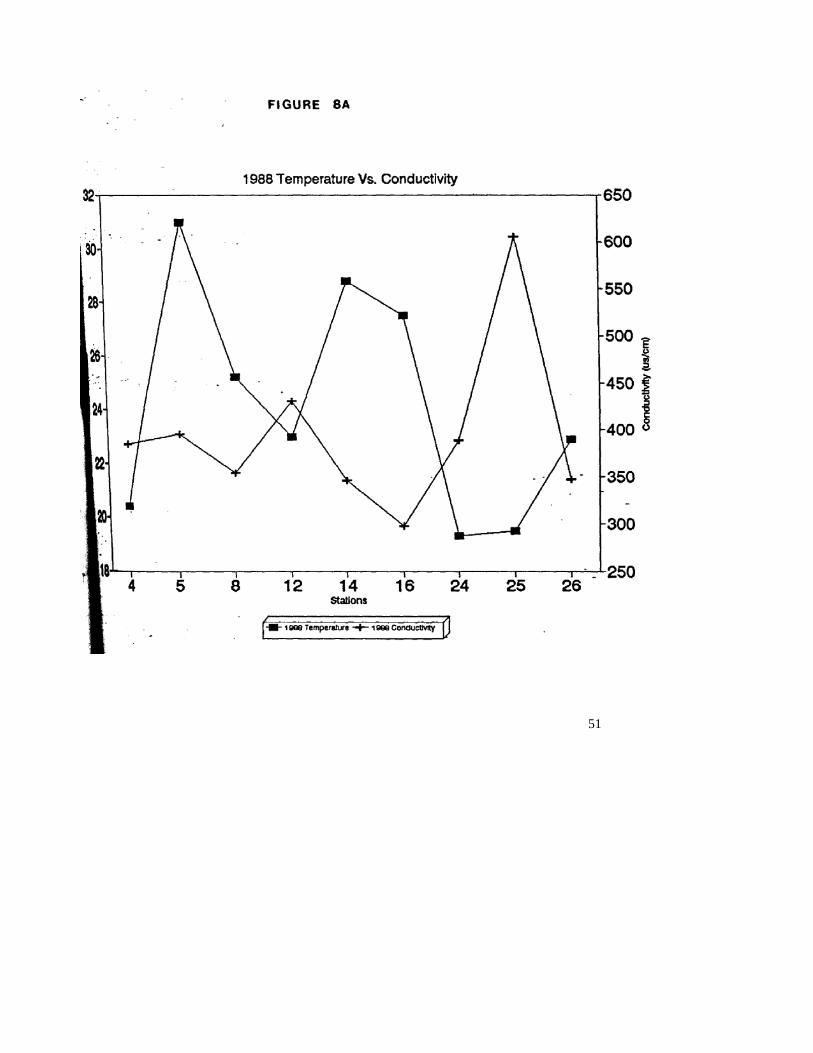
51

52

53

54

55

56a

Table 1 USGS/DC WRRC PROJECT
TOTAL MEAN OF WATER QUALITY DATA
(A) 1988
STATION TEMPERATURE pH DISSOLVED OXYGEN CONDUCTIVITY TOTAL (totals) (ºC) (mg/1) (US/cm) READINGS
------------------------------------------------------------------------------------------------------------------- 4 20.4 7.0 5.4 385.0 2 5 31.0 6.7 3.0 395.0 1 8 25.2 7.1 2.8 354.0 2
12 23.0 6.6 8.3 430.7 3 14 28.8 10.2 7.5 345.5 2 16 27.5 6.9 5.8 298.0 1 24 19.3 6.5 5.7 389.3 3 25 19.5 6.3 4.0 606.0 3
9 24.2 7.1 5.1 394.6 23 --------------------------------------------------------------------------------------------------------------------
26 22.9 6.7 3.7 347.5 6
(B) 1989 STATION TEMPERATURE pH DISSOLVED OXYGEN CONDUCTIVITY TOTAL
(Totals) (ºC) (mg/1) (US/cm) READINGS ------------------------------------------------------------------------------------------------------------------
4 13.1 7.0 4.7 308.3 9 5 12.6 7.2 4.1 207.0 10 8 13.3 7.1 4.5 128.1 9 1 11.0 6.1 4.4 520.1 7 1 12.3 7.1 5.1 194.7 6 1 11.1 7.2 4.2 193.7 6
------ ---------------- ------- ----------------------------------------- ---------- ------ --22
-------11.7 -----7.3 10.6 6.4 5.9
--------------248.6431.8
---7 11
5.9
8 12.0 6.9 4.9 279.0 65
(C) 1990 STATION TEMPERATURE pH DISSOLVED OXYGEN CONDUCTIVITY TOTAL (Totals) (ºC) (mg/1) (US/cm) READINGS --------------------------------------------------------------------------------------------------------------------
4 12.3 7.1 5.3 289.6 18 5 17.2 7.1 4.9 295.2 10 8 17.8 7.0 4.6 286.7 10 1 13.0 7.0 5.1 310.7 13 1 14.5 7.1 5.7 292.0 7 1 14.8 6.8 5.2 282.6 7 2 12.3 7.0 4.3 375.6 14 2 12.1 6.4 4.3 280.1 12
8 14.3 6.9 4.9 301.6 91 62
61

TABLE 2
USGS/DCWRRC PROJECT STORM WATER QUALITY FIELD DATA
MAY 1988 - MAY 1988
CONDUCTIVITYSTATION TEMPERATURE ºC pH DISSOLVED OXYGEN
(mg/l) DATE
(uS/cm)
12 18.5 6.5 4.2 398 05/20/88 14 20.0 6.3 4.5 20305/20/88 16 19.9 6.2 3.4 18905/20/88
05/20/88 24 18.4 6.3 4.8 306 06/09/88 4N 21.6 6.8 5.9 288 6/09/88 4S 21.6 6.8 5.2 2876/09/88 06/09/88
4D 20.9 6.6 5.0 27925 21.0 6.6 5.5 292
07/28/88 12 28.0 6.4 5.3 250 07/28/88 07/28/88 07/28/88
14 31.0 6.6 7.8 30016 30.0 6.9 6.9 31024 27.0 6.0 6.1 29025 25.0 6.1 6.1 69007/28/88
26D 25.0 6.6 6.1 43007/28/88 07/28/88 26S 28.5 6.9 6.0 290
4D 23.8 6.7 2.3 218 08/30/88 08/30/88 08/30/88 08/30/88 08/30/88 08/30/88 08/30/88 08/30/88 08/30/88
4S 23.9 6.8 2.3 20912 23.8 7.0 3.3 495
14D 20.5 8.4 7.8 1,302 14N 25.0 7.1 4.4 345
16 24.9 6.9 3.7 267 24D 24.0 6.7 4.4 360 24N 24.2 6.8 3.1 254 25D 24.2 6.7 2.8 222 25S 22.4 6.4 2.9 750
N = readings north of the drain S = readings south of the drain D = readings at drain

CHEMICAL April - July 1988
92 102 144 88 24 98 117 0.02 0.05 0.01 0.36 0.27 0.09 0.23 56 40 140 62 20 64 927.00 9.50 2.00 9.00 5.75 12.50 13.00 40 44 48 32 45 96 600.01 - - - - - -- - - - 0.03 - -- 0.01 - 0.08 0.03 0.01 0.03 0.25 0.05 0.28 0.18 0.04 0.70 0.73 180 310 172 207 85 310 279 88 102 148 88 78 126 144 0.01 0.25 0.13 1.00 1.69 2.13 1.50 32 16 12 27 10 62 523.00 5.00 2.00 2.33 0.50 3.50 2.50 0.10 0.13 0.02 - 0.28 0.40 1.00 1.40 0.84 0.54 0.66 2.07
----------------------------------------------------------------------------------------------------------------ANALYSIS (ppm) *Sta.4 Sta.l2 Sta.14 Sta.16 Sta.24 Sta.25 Sta.26
-----
Alkalinity Ammonia Calcium CO2 Chlorides Chlorine Chromium Copper Cyanide Dissd. Solids Hardness (CaCO3) Iron Magnesium Nitrate Phosphate Salinity (ppt)
-------------------------------------------------------------------------------------------------------------------------------- * Only 1 sample was taken from this station
------------------------------------------------------------ --------------------------------------------------------------- ----B
CHEMICAL (ppm) September 1988 - July 1989 ANALYSIS Sta.4 Sta.5 Sta.8 Sta.12 Sta.14 Sta.16 Sta.24 Sta.25 Sta.26 -------------------------------------------------------------------------------------------------------------------------------
Table 3. USGS/DC WRRC PROJECT
TOTAL MEAN FOR WATER ANALYSIS DATA
A
63
59 43 38 96 46 69 91 74 92 0.15 0.13 - 0.41 1.00 0.45 0.25 0.25 0.20 49 28 58 66 46 76 55 67 88 7.70 9.75 6.00 6.63 13.00 11.00 9.80 8.50 7.00 55 48 18 63 24 37 78 62 62 - - - 0.01 - 0.03 - 0.02 0.05 0.003 - - - - - - 0.005 - 0.37 0.69 0.20 0.53 0.80 0.55 0.23 0.20 1.40 94 - - 175 - 140 182 183 310
71 83 66 100 78 99 103 84 76
1.00 2.19 0.38 1.34 0.75 0.63 1.33 1.75 4.50 22 27 8 35 32 23 48 25 40 1.15 - 1.00 2.88 - 2.63 3.25 2.01 5.00 0.35 - - 0.42 - 0.38 0.38 0.40 3.00 0.90 0.60 1.80 1.60 0.80 1.70 1.72 1.40 5.60
Alkalinity Ammonia Calcium CO2 Chlorides Chlorine Chromium Copper Cyanide Dissd. Solids Hardness (CaCO3) Iron Magnesium Nitrate Phosphate Salinity (ppt)

Table 4 C
CHEMICAL September - November 1989 ANALYSIS(ppm) Sta.4 Sta.5 Sta.8 Sta.12 Sta.14 Sta.16 Sta.24 Sta.25 --------------------------------------------------------------------------------------------------------------------
Alkalinity
61 101 139 153 102 94 64 67 Ammonia - 0.02 0.02 0.41 0.34 0.06 - 0.01Calcium 70 87 84 49 87 40 100 70CO 4.50 7.25 3.75 7.25 8.50 4.50 2.00 2.002 Chlorides 40 50 51 55 32 32 44 40Chlorine - - - 0.13 - - 0.13 - Chromium - - - - - - - -Copper - - - - - - - - Cyanide 0.20 0.37 0.70 1.20 0.63 0.09 0.15 0.49 Dissd. Solids - - - - Hardness (CaCO3) 70 110 109 134 106 100 88 69Iron
1.75 2.38 1.13 0.44 2.88 0.69 1.07 1.25Magnesium 25 37 25 85 19 13 -14 -14 Nitrate - - - - - - - - Phosphate 1.07 0.75 0.13 0.38 0.69 0.25 0.44 0.69
Salinity(ppt) 0.90 1.10 1.00 1.10 0.90 0.90 1.20 1.30Sulfide - - - - 0.05 - - -
D
CHEMICAL February - July 1990 A N A L Y S I S ( p p m ) Sta.4 Sta.5 Sta.8 Sta.12 Sta.14 Sta.16 Sta.24 Sta.25
74 72 82 86 84 85 87 71Alkalinity Ammonia 0.12 0.02 0.03 0.06 0.07 0.06 0.08 0.07
62 61 72 70 78 74 81 64Calcium 7.80 7.75 8.88 15.25 4.75 5.88 9.00 10.90CO2 48 45 51 49 37 42 52 40Chlorides 0.02 0.19 0.06 0.06 - Chlorine 0.13 0.02 0.05
Chromium - - - Copper 0.01 - - 0.01 - - - 0.01 Cyanide 0.42 0.36 0.54 0.90 1.98 0.48 0.51 0.39Dislvd. Solids
Hardness (CaCO 204 223 233 176 200 195 214 184) 394 89 103 104 105 101 107 86Iron 3.00 0.63 0.63 0.88 0.44 1.16 1.85 1.00Magnesium 31 28 31 34 27 27 26 22Nitrate Phosphate
Salinity(ppt) 0.65 1.19 1.31 2.81 1.63 2.19 1.20 1.150.40 0.50 0.41 0.50 0.41 0.97 0.45 0.43Sulfide 1.12 2.30 2.10 2.00 0.95 0.95 1.04 0.96 - - - - - - - -
64
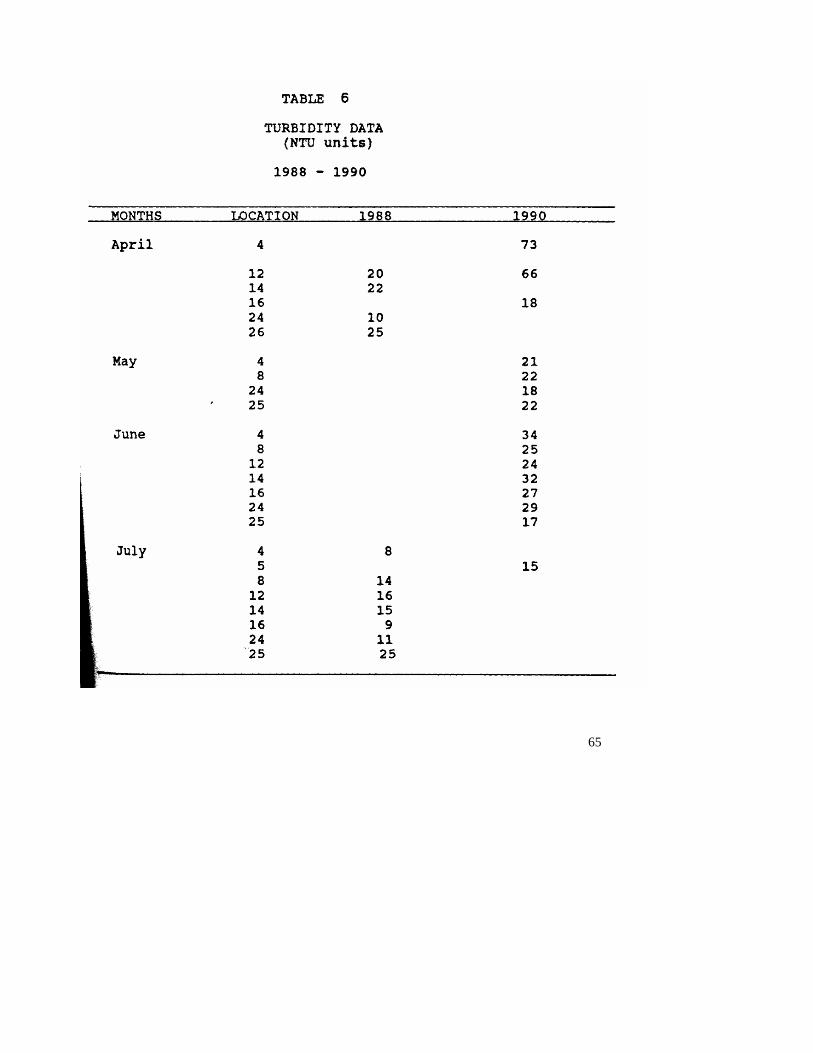
65

TABLE 7
USGS/DC WRRC PROJECT WATER ANALYSIS
September - November 1989
CHEMICAL Sta. 4 Sta. 5 ----------------------------------------------------------------------------------------------------------------------- ANALYSIS(ppm) 9/11 10/02 9/25 10/24
56 52 72 64 108 104 120 72 Alkalinity
Ammonia - - - - 0.02 0.02 0.02 0.02
Calcium 80 64 72 64 100 32 116 100 CO2 3.00 2.00 6.00 7.00 13 11 - 5.00 Chlorides
52 44 32 32 56 56 48 40 Chlorine - - - - - - - - Chromium - - - - - - - - Copper - - - - - - - -
0.15 0.15 0.10 0.40 0.05 1.20 0.15 0.05 Cyanide - - - - - - - - Dissolved Solids
116 120 76 68 124 124 120 72 ) Hardness (CaCO3
0.5 2.00 0.50 4.00 2.00 0.50 1.00 6.00 Iron 36 56 4.00 4.00 24 92 4.00 28 Magnesium - - - - - - - - Nitrate
0.50 2.50 1.00 0.25 0.50 2.50 - - Phosphate 0.80 0.80 0.80 1.20 1.20 0.80 1.20 1.20 Salinity (ppt)
- - - - - - - - Sulfide
PHYSICAL CHARACTERISTICS
--------- Pungent Pungent ODOR Light Pale Beige & COLOR brown & yellow slightly very quite turbid turbid turbid
66a

September - November 1989
CHEMICAL Sta. 8 Sta. 12 ANALYSIS (ppm) 9/25 10/24 9/21 10/12 ----------------------------------------------------------------------------------------------
Alkalinity 68 64 148 128 48 108 200 256 Ammonia 0.02 0.02 0.02 0.02 0.02 0.02 0.60 1.00
Calcium 64 52 108 112 72 44 48 32
CO 7.00 8.00 - - 2.00 5.00 12 10 2
Chlorides 36 40 60 68 32 48 64 76
Chlorine - - - - - - - -
- - - - - - - - Chromium - - - - - - - - Copper
1.20 1.20 0.20 0.20 0.40 0.40 1.80 2.20 Cyanide
- - - - - - - - Dissolved Solids
76 72 120 168 88 104 164 180 ) Hardness(CaCO3
0.25 0.25 2.00 2.00 0.25 0.50 0.50 0.50 Iron
12 20 12 56 16 60 116 148 Magnesium
- - - - - - - - Nitrate
0.25 0.25 2.00 2.00 0.25 0.50 0.50 0.50 Phosphate
0.80 0.80 1.60 1.80 1.20 1.80 1.20 1.20 Salinity (ppt)
- - - - - - - - Sulfide
PHYSICAL CHARACTERISTICSOdor - - - - Color Pale - Pale Beige & yellow & beige & quite very turbid slightly turbid turbid
66b
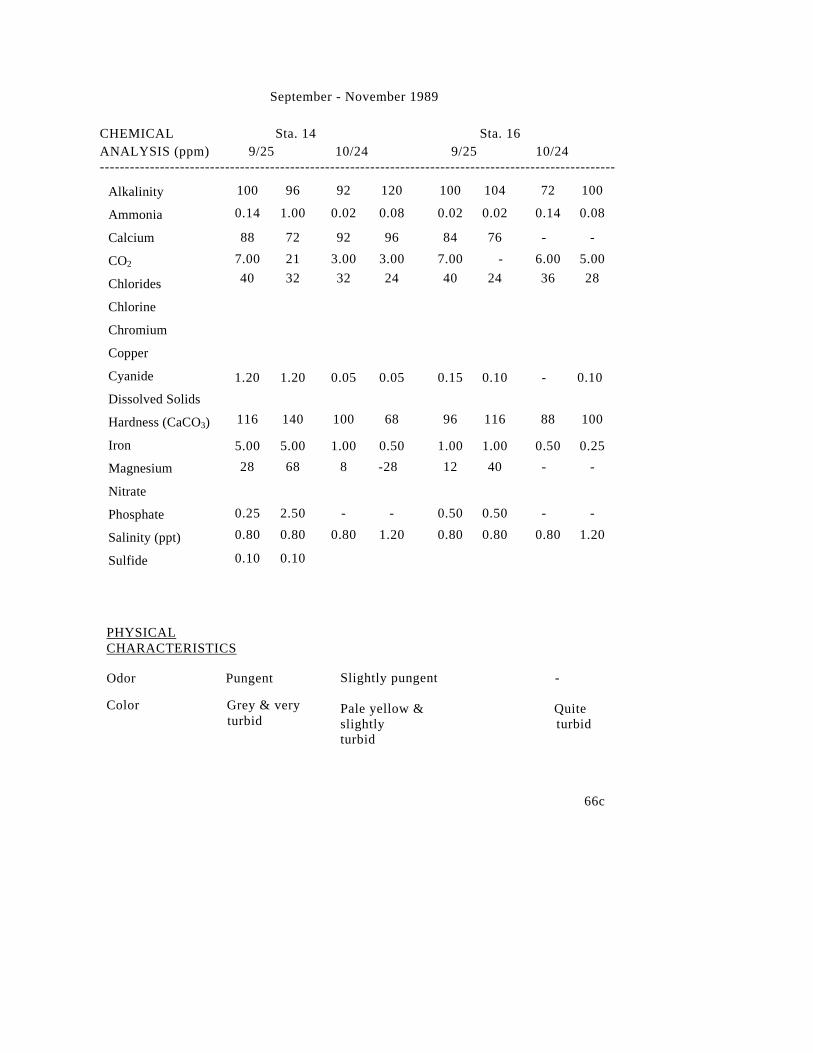
September - November 1989
CHEMICAL Sta. 14 Sta. 16 ANALYSIS (ppm) 9/25 10/24 9/25 10/24 -------------------------------------------------------------------------------------------------------
100 96 92 120 100 104 72 100
0.14 1.00 0.02 0.08 0.02 0.02 0.14 0.08
88 72 92 96 84 76 - - 7.00 21 3.00 3.00 7.00 - 6.00 5.00 40 32 32 24 40 24 36 28
1.20
1.20
0.05
0.05
0.15
0.10
-
0.10
116 140 100 68 96 116 88 100
5.00 5.00 1.00 0.50 1.00 1.00 0.50 0.25 28 68 8 -28 12 40 - -
0.25 2.50 - - 0.50 0.50 - - 0.80 0.80 0.80 1.20 0.80 0.80 0.80 1.20
0.10 0.10
PHYSICAL
Alkalinity
Ammonia
Calcium
CO2
Chlorides
Chlorine
Chromium
Copper
Cyanide
Dissolved Solids
) Hardness (CaCO3
Iron
Magnesium
Nitrate
Phosphate
Salinity (ppt)
Sulfide
CHARACTERISTICS
Slightly pungent - Odor Pungent
Color Grey & very Pale yellow & Quite slightly turbid turbid turbid
66c

September - November 1989
-------------------------------------------------------------------------------------------------------------------- CHEMICAL Sta. 24 Sta. 25 ANALYSIS (ppm) 9/07 10/02 9/07 10/02
------------------------------------------------------------------------------------------------------------------32 28 100 96 32 40 88 108 Alkalinity
0.02 0.02 Ammonia 72 52 144 132 80 100 72 88 Calcium
5.00 3.00 5.00 3.00 CO2 52 40 44 40 40 40 40 40
Chlorides 0.50 Chlorine
Chromium
Copper
Cyanide 0.15 0.15 0.15 0.15 0.10 0.05 0.60 1.20 Dissolved Solids
64 56 116 116 60 64 80 72 ) Hardness (CaCO3
0.25 1.00 2.00 1.00 2.00 3.00 Iron -8 -4 -28 -16 -20 -36 8 -8 Magnesium Nitrate
0.50 0.25 0.50 0.50 0.25 0.50 1.00 1.00 Phosphate 1.20 1.60 0.80 1.20 1.60 1.60 1.20 0.80 Salinity (ppt)
Sulfide
PHYSICAL CHARACTERISTICS
---------- Pungent ---------- ODOR Brown & Pale Beige & COLOR very turbid beige & slightly with oily slightly turbid film turbid
66 d

USGS/DC WRRC PROJECT WATER ANALYSIS February -
July 1990
\
Feb. 1 Feb. 15 April 4 May 16 Sta. 4 CHEMICAL
ANALYSISAlkalinity 80 88 80 84 60 60 84 76 Ammonia 0.08 0.08 0.02 0.02 0.02 0.02 0.08 0.08 Calcium 68 76 84 96 52 52 48 48
4.00 7.00 5.00 9.00 12.00 14.00 11.00 CO2
72 88 60 72 36 36 32 32 Chlorides Chlorine Chromium 0.025 0.05 Copper
0.80 0.40 1.20 1.20 0.05 0.05 0.20 0.20 Cyanide
200 220 240 200 120 180 180 360 Dissolved Solids 104 120 144 132 76 72 88 72 ) Hardness(CaCO3
0.50 0.50 0.50 2.00 1.00 1.50 2.00 2.00 Iron
Magnesium 36 44 60 36 24 20 40 24
Nitrate 1.00 1.00 1.00 1.00
0.25 0.50 0.50 0.50 0.50 0.25 0.25 0.50 Phosphate
Salinity (ppt) 2.40 1.60 0.80 1.20 0.80 0.80 0.80 0.80 Sulfide
66 e
ODOR --------------- ---------------- -----------------
PHYSICAL CHARACTERISTICS
--------------- COLOR Clear Clear Pale yellow Pale yellow Pale yellow & quite turbid & quite turbid
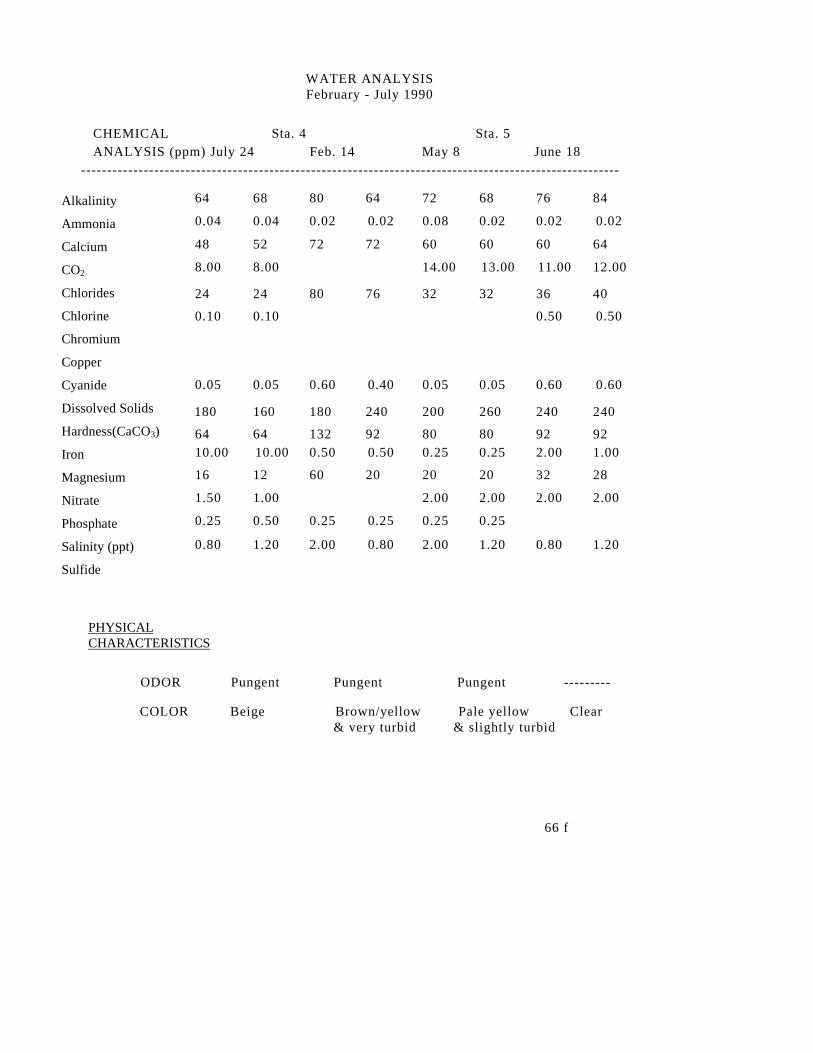
WATER ANALYSIS February - July 1990
CHEMICAL Sta. 4 Sta. 5 ANALYSIS (ppm) July 24 Feb. 14 May 8 June 18
-------------------------------------------------------------------------------------------------------
64 68 80 64 72 68 76 84 Alkalinity 0.04 0.04 0.02 0.02 0.08 0.02 0.02 0.02 Ammonia 48 52 72 72 60 60 60 64 Calcium 8.00 8.00 14.00 13.00 11.00 12.00 CO2
Chlorides 24 24 80 76 32 32 36 40
Chlorine 0.10 0.10 0.50 0.50
Chromium Copper 0.05 0.05 0.60 0.40 0.05 0.05 0.60 0.60 Cyanide
Dissolved Solids 180 160 180 240 200 260 240 240 ) Hardness(CaCO 64 64 132 92 80 80 92 92 3
10.00 10.00 0.50 0.50 0.25 0.25 2.00 1.00 Iron 16 12 60 20 20 20 32 28 Magnesium 1.50 1.00 2.00 2.00 2.00 2.00 Nitrate 0.25 0.50 0.25 0.25 0.25 0.25 Phosphate 0.80 1.20 2.00 0.80 2.00 1.20 0.80 1.20 Salinity (ppt) Sulfide
PHYSICAL CHARACTERISTICS
ODOR Pungent Pungent Pungent ---------
COLOR Beige Brown/yellow Pale yellow Clear & very turbid & slightly turbid
66 f

WATER ANALYSIS
February - July 1990--------------------------------------------------------------------------------------------------------------- CHEMICAL Sta. 5 Sta. 8 ANALYSIS (ppm) July 19 Feb. 14 May 8 June 18 ----------------------------------------------------------------------------------------------------------------
80 52 72 72 64 68 80 72 Alkalinity
0.08 0.08 0.04 0.04 Ammonia 52 48 80 80 52 64 68 72 Calcium
6.00 6.00 15.00 12.00 12.00 11.00 CO2
28 32 68 44 32 36 40 44 Chlorides
Chlorine 0.25 0.25
Chromium
Copper Cyanide 0.20 0.40 1.20 0.60 0.05 0.05 0.60 0.60 Dissolved Solids 200 220 200 220 260 200 200 240
) Hardness(CaCO 72 72 104 96 76 76 108 92 3
Iron 0.25 0.25 0.25 0.25 0.50 0.50 1.50 1.50 Magnesium 20 24 24 16 24 12 40 20
0.50 1.00 2.00 2.00 1.00 1.00 Nitrate 0.50 0.50 0.25 0.50 0.25 0.25 Phosphate 0.40 0.80 1.20 1.60 1.20 1.20 0.80 0.80 Salinity (ppt) Sulfide
ODOR Pungent Slightly Pungent Pungent ---------
COLOR Clear Brown/yellow Pale yellow Clear & & slightly & very turbid & slightly turbid very turbid turbid
66g

W AT E R A NA L YS I S Fe b r ua r y - Ju l y 1 990
C HE MI C AL S t a . 8 S t a . 12 A NA L Y S I S J u l y 1 9 F e b . 1 Fe b . 1 5 Ap r i l 4
- - - - - - - - - - - - - - - - - - - - - - - - - - - - - - - - - - - - - - - - - - - - - - - - - - - - - - - - - - - - - - - - - - - - - - - - - - - - - - - - - - - - - - -
Alkalinity
Ammonia
Calcium
CO2
Chlorides
Chlorine
Chromium
Copper
Cyanide
Dissolved Solids
Hardness(CaCO3)
Iron
Magnesium
96 132 60 64 92 84 100 100 0.04 0.04 0.04 0.04 0.14 0.14
76 84 56 52 76 76 72 72 11.00 10.00 9.00 6.00 4.00 4.00 12.00 13.00
48 52 48 40 60 60 44 52
0.25 0.25
-
- 0.05 0.05 0.60 0.60 0.10 0.10 1.20 1.40 0.20 0.20
300 240 160 120 140 140 120 210 132 140 96 76 148 116 96 96
0.25 0.25 2.00 2.00 0.50 0.50 1.00 1.00
56 56 40 24 72 40 24 24 Nitrate
Phosphate
Salinity (ppt)
Sulfide
2.00 2.50 1.00 1.50
1.00 1.00 0.50 0.50 0.50 0.50 0.25 1.00 0.80 0.80 1.60 0.80 0.80 0.80 1.20 0.80
-
OD OR P u ng e n t - - -
C OL O R C l e a r & P a l e ye l l o w Pa l e ye l l o w P a l e ye l l ow s l i gh t l y & q u i t e & q u i t e t u r b i d t u r b i d t u r b i d
66 h

WATER ANALYSIS February - July 1990
CHEMICAL Sta. 12 Sta. 14 ANALYSIS(ppm) July 10 Feb. 8 March 7 April 25
-------------------------------------------------------------------------------------------------------
104 84 76 72 88 88 68 76 Alkalinity
0.02 0.02 0.14 0.14 0.08 0.08 0.04 0.04Ammonia
Calcium 72 80 84 84 80 84 64 68 CO 6.00 7.00 3.00 3.00 5.00 6.00 6.00 8.002
Chlorides 40 48 40 44 48 52 20 20
0.25 0.25 Chlorine
Cyanide 0.20 0.20 1.00 1.00 0.60 0.60 0.10 0.15
260 260 180 180 120 180 140 260 Dissolved Solids
) Hardness(CaCO 100 100 112 100 124 120 80 84 3
Iron 1.00 0.50 0.50 0.50 0.50 0.5028 20 28 16 44 36 16 16 Magnesium
10.00 10.00 2.00 2.50 1.00 1.50 1.00 2.00Nitrate
Phosphate 0.25 0.50 0.25 0.25 0.50 0.50 0.50 0.25
Salinity (ppt) 1.20 0.80 1.20 1.20 0.80 1.20 0.80 0.80Sulfide ----
ODOR Slightly pungent
COLOR Pale yellow Pale yellow Clear Pale yellow & slightly Turbid
66i

WATER ANALYSIS February - July 1990
CHEMICAL Sta. 14 Sta. 16 ANALYSIS(ppm) July 10 Feb. 8 March 7 April 25
------------------------------------------------------------------------------------------------------------------------- 84 80 80 80 80 Alkalinity 84 116 84
Ammonia 0.08 0.08 0.04 0.08 0.08 0.08
Calcium 76 80 96 92 68 84 56 56 7.00 3.00 CO 6.00 6.00 5.00 10.00 11.002
56 48 36 40 40 Chlorides 32 36 44 0.05 Chlorine
Chromium
Copper 1.00 0.40 0.20 0.20 0.20 Cyanide 0.20 0.20 1.00 220 160 200 140 160 Dissolved 260 280 180
Solids 108 100 124 92 96 ) 108 108 88 Hardness(CaCO3
0.25 0.50 4.00 0.50 0.50 Iron 0.50
Magnesium 32 28 -8 16 32 40 36 40
Nitrate 1.00 2.00 - 2.00 2.00 0.50 1.00
Phosphate 0.50 0.50 0.25 0.50 0.50 5.00 0.25 0.25
Salinity (ppt) 0.80 0.80 0.80 1.20 0.80 1.20 1.20 0.80 Sulfide
ODOR Slightly pungent COLOR Pale yellow Pale yellow Beige & Pale yellow
& slightly slightly turbid turbid
6 6j

WATER ANALYSIS February - July 1990
Sta. 16 CHEMICAL Sta. 14
Feb. 26 April 23 ANALYSIS (ppm) July 10 Feb. 7
104 84 84 112 100 88 68 Alkalinity 84 0.02 0.40 0.14 0.0 0.04 0.02 0.02 Ammonia 0.02 68 72 92 80 100 60 60 Calcium 68 3.00 6.00 8.00 13.00 14.00 3.00 CO2
32 56 68 60 72 36 44 Chlorides 40 0.50 Chlorine 0.50 0.40 0.40 0.40 1.00 1.00 0.15 0.15 Cyanide 0.40
Dissolved Solids 260 240 160 180 180 240 140 180 ) 100 Hardness(CaCO 96 108 128 148 144 80 80 3
Iron 3.00 2.00 0.50 0.50 0.50 1.00 1.00 Magnesium 32
28 36 36 68 44 20 20 Nitrate 2.00
10.00 2.00 2.00 1.50 1.00 Phosphate 0.50 0.50 0.50 0.25 0.25 0.50 0.50 0.50 Salinity (ppt) 0.80 0.80 1.20 1.20 0.80 0.80 0.80 1.20 Sulfide ----
ODOR ----------- Yellow/brown Pale beige COLOR Pale yellow
& very turbid & slightly turbid

WATER ANALYSIS February - July 1990
-------------------------------------------------------------------------------------------------------------------- CHEMICAL Sta. 24 Sta. 25 ANALYSIS (ppm) May 16 July 24 Feb. 7 Feb. 28 ---------------------------------------------------------------------------------------------------------------------
Alkalinity 92 112 56 76 108 84 64 72
Ammonia 0.04 0.04 0.04 0.04 0.14 0.14 0.02 0.02
Calcium 88 92 104 60 92 60 64 64
CO 16.00 14.00 11.00 8.00 3.00 12.00 8.00 2
Chlorides 64 48 32 36 48 60 40 48
Chromium 0.10 0.10
Copper 0.025 0.025
Cyanide 0.40 0.40 0.60 0.60 0.60 0.60 0.15 0.25
Disd. Solids 320 340 180 220 120 120 140 140
112 140 68 64 112 120 88 88 Hardness
Iron 0.50 0.50 8.00 4.00 0.50 2.00 1.00 1.00
Magnesium 24 48 -36 4 20 60 24 24
Nitrate 1.50 1.50 1.50 1.00 2.00 2.00
Phosphate 1.00 1.00 0.25 0.50 0.25 0.25
Salinity 0.80 0.80 0.80 1.20 0.80 1.20 Sulfide
ODOR Pungent
COLOR Pale yellow Beige _ _ Pale yellow & quite & slightly
turbid turbid

WATER ANALYSIS February - July 1990
------------------------------------------------------------------------------------------------------------------ CHEMICAL Sta. 25 ANALYSIS(ppm) April 23 June 12 July 24------------------------------------------------------------------------------------------------------------------
Alkalinity 64 68 72 64 48 64
Ammonia 0.08 0.08 0.08 0.08 0.04 0.04
Calcium 56 56 68 68 52 56
CO 13.00 15.00 23.00 21.00 8.00 6.00 2
Chlorides 36 36 32 40 24 32
0.10 0.40 Chlorine
Chromium
Copper
Cyanide 0.15 0.15 0.60 0.60 0.40 0.40
Dis. Solids 200 200 240 240 240 200
Hardness 76 80 84 80 64 64
Iron 1.50 1.00 0.50 1.00 0.50 1.00
Magnesium 20 24 16 12 12 8
Nitrate 1.00 1.00 1.00 2.00 1.00 1.50
Phosphate 1.00 1.00 0.50 0.50
Salinity 0.80 0.80 1.20 1.20 0.80 0.80
PHYSICAL CHARACTERISTICS
ODOR Pungent
COLOR Pale beige Pale yellow Beige & slightly & quite turbid turbid
66m

8Table summarizes the substrate composition and water condition at various stations.
TABLE 8
ANACOSTIA RIVER WATERSHED SUBSTRATE COMPOSITION AND WATER CONDITION
STATION WATER CONDITION SUBSTRATE COMPOSITION
4 brown, beige, pungent silt/gravel
turbid, oily 5 brown, yellow, pungent brown, silt, debris
very turbid 8 yellow, pungent silt
very turbid 12 clear, pungent, quite silt/gravel
to slightly turbid 14 'pale yellow, pungent sand/silt
turbid 16 pale yellow, pungent sand/gravel/debris
turbid 24 brown, pungent, very silt/gravel
turbid 25 pale yellow, pungent silt/gravel
slightly turbid 26 pale yellow, pungent silt/gravel
turbid
6 7a

TABLE 8
Date Station Physical Characteristics
odor
3/03/88 4/11/88
4 4
color - pale beige - beige
7/12/88 4 1 -7/17/88 4 - pale beige
yellow brown7/27/88 4 -pale yellow9/09/88 4 -
9/11/89 4 0 Beige,10/02/89 4 0 Light brown11/03/89 4 0 Beige02/01/90 4 - Clear02/15/90 4 - Pale yellow
Pale yellow04/04/90 4 -Pale yellow05/16/90 4 -
07/24/90 4 0 Beige9/25/89 5 0 Pale
10/24/89 5 Brown/yellow02/14/90 5 pale yellow05/08/90 5 0
06/18/90 5 - Clear07/19/90 5 0 clear
yellow brown07/20/89 8 -pale yellow10/24/89 8 -
02/14/90 8 1 Yellow brownpale yellow05/08/90 8 0
06/18/90 8 - Clear07/19/90 8 0 Clear
pale yellow4/26/88 12 26/16/88 12 - yellow3/03/89 12 - pale beige4/11/89 12 - beige
light brown9/19/89 12 3pale yellow9/21/89 12 -
10/12/89 12 - beige02/01/90 12 pale yellow
_ pale yellow02/15/90 12 pale yellow07/10/90 12 -pale yellow06/02/88 14 -
06/16/88 14 - pale yellow07/12/89 14 - beige07/24/89 14 - pale yellow
9/25/89 14 0 Gray
67b

- pale yellow 02/08/90 14 03/17/90 14 07/10/90 14 05/27/88 16 06/16/88 16 06/30/88 16 07/24/89 16
- pale yellow - pale yellow O dark beige * * * yellow
beige - gray - pale yellow 9/22/89 16
9/25/89 16 02/08/90 16 03/17/90 16 04/25/90 16 07/10/90 16 04/14/88 24 07/08/88 24 09/14/88 24 3/03/89 24 4/11/89 24 7/12/89 24 9/07/89 24 10/02/89 24 02/07/90 24 02/26/90 24 04/23/90 24 05/16/90 24 07/24/90 24 06/01/88 25 07/13/88 25 9/07/89 25 9/14/88 25 3/03/89 25 4/11/89 25 7/12/89 25
O pale yellow - pale yellow O Beige - pale yellow - pale yellow - pale yellow - pale yellow
beige - pale beige - pale yellow
beige - yellow brown - pale beige - pale yellow -
beige - pale yellow - yellow brown pale beige beige beige - pale yellow - yellow beige
02/07/90 25 - - 02/28/90 25 - pale yellow 04/23/90 25 - pale beige 06/12/90 25 _ pale yellow 06/26/88 26 O pale yellow 07/11/88 26 - yellow 07/11/88 26 - yellow 09/01/88 26 - yellow brown 09/16/99 26 - dark beige
LEGEND
Clear 0 = Slightly Pungent * Turbid 1 = Pungent * * Slightly turbid @ 2 = oily * * * Very turbid


TABLE 9
USGS/DCWRRC PROJECT SOIL ANALYSIS
A p r i l - J u l y 1 9 88
S t a . 4 S t a . 1 2 S t a . 1 4 M a y 3 A p r i l 2 6 J un e 2 J un e 1 6 J u l y 6 - - - - - - - - - - - - - - - - - - - - - - - - - - - - - - - - - - - - - - - - - - - - - - - - - - - - - - - - - - - - - - - - - - - - - - - - - - - - - - - - - - - - - - - - -
A l ka l ine A l k a l i ne A l k a l i ne A l k a l i ne Soil Reaction Test (pH) Alkaline
Aluminum (Active) V. Low V.Low V.Low V.Low V.Low
Ammonia High Low M e d i um M e d i u m Low
V. Low V. Low Calcium Low
V.Low Chloride V. Low Low V.Low
Humus (Organic Soil) Low Low Low
Iron (Ferric) Low Low Low Low Low
V.Low V.Low High V.Low Magnesium
Manganese Low V. Low Low V. Low
Nitrate Low
Nitrite Nitrogen
Low Low M e d i u m Low Phosphorus Medium
V. Low Low Low V. Low Potassium V. Low
Sulfate
PHYSICAL CHARACTERISTICS - - - - Odor D a r k Da r k B r o wn B r o wn Color Dark Brown b r o wn b r o w n S i l t & S i l t & S i l t & S i l t & Texture Silt & Gravel g ra ve l s a n d s a n d s a n d
68 a

WATER ANALYSIS April - July 1988
-------------------------------------------------------------------------------------------------------- CHEMICAL Sta. 24 Sta. 25 Sta. 25N Sta. 25S ANALYSIS May 31 April 5 June 9 June 23 June 23 --------------------------------------------------------------------------------------------------------
Soil Reaction Test (pH)
Slightly Acidic
Alkaline Alkaline Neutral Alkaline
Aluminum (Active) V. Low V. Low - - -
Ammonia Medium Medium Medium V. High Medium Calcium Low Medium Low V. Low V. Low Chloride V. Low V. Low V. Low Low - Humus Low - Low Low Low (Organic Soil) Iron Low - Medium Medium Medium (Ferric) Magnesium Low Low V. Low V. Low Medium Manganese - - - - - Nitrate V. Low V. Low V. Low - - Nitrite - - - - - Nitrogen Phosphorus Medium High High High Medium Potassium Low Low V. Low V. Low V. Low Sulfate - - V. Low Low -
P H YS I C A L C HA R AC T E R I S T IC S O do r - P un g e n t - P u ng e n t P u ng e n t C o l o r Da r k Da r k D a r k G r e e n- G r e e n- B r o wn B r o wn B r o w n B r o w n B r o w n T e x t u re S i l t & S i l t & S i l t & S i l t & S i l t & Gr a ve l Gr a ve l G r a ve l G r a ve l G r a ve l ------------------------------------------------------------------------------------------------------
68 b

WATER ANALYSIS April - July 1988
-------------------------------------------------------------------------------------------------- CHEMICAL Sta. 25 Sta. 25N Sta. 25S ANALYSIS
Soil Reaction Alkaline Slightly Acidic Slightly Acidic --------------------------------------------------------------------------------------------------
Test (pH) Aluminum (Active) V. Low - -
Ammonia Medium High V. High Calcium Low Medium Medium Chloride V. Low - - Humus - - - (Organic Soil) Iron - Medium Medium (Ferric) Magnesium Low V. Low V. Low Manganese - - - Nitrate - - - Nitrite - - - Nitrogen Phosphorus V. Low High High Potassium V. Low Low V. Low Sulfate - - -
PHYSICAL CHARACTERISTICS ODOR Pungent Pungent Pungent COLOR Dark brown Dark brown Dark brown TEXTURE Silt & sand Silt & gravel Silt & gravel
68 c

USGS/DC WRRC PROJECT SOIL ANALYSIS
September 1988 - July 1989
-------------------------------------------------------------------------------------------------- CHEMICAL Sta. 4 Sta. 5 ANALYSIS April 12 May 17 Nov. 3 --------------------------------------------------------------------------------------------------
Soil Reaction Alkaline Medium Acid Slightly Neutral Neutral Test (pH) Acidic Aluminum (Active)
V. Low V. Low V. Low V. Low V. Low V. Low V. Low
Ammonia High Medium V. High V. High High Medium V. High Calcium Medium Low V. Low - - - - Chloride - - - V. Low V. Low Humus Low Low - V. Low V. Low Low (Organic Soil) Iron Low Low Low Low Medium Medium Medium (Ferric) Magnesium V. Low V. Low Low V. Low - Low V. Low Manganese Low Low - Low Medium
Low -
Nitrate Low Low V. Low V. Low - - -
Nitrite - - - - - Nitrogen Phosphorus Medium High High Medium Medium Low High Potassium Low V. Low V. Low Low V. Low Low Low Sulfate - - - - V. Low PHYSICAL CHARACTERISTICS ODOR - - Pungent Pungent Pungent COLOR Brown Brown Light Light Light brown brown brown TEXTURE Silt, gravel & Silt & Silt, sand & gravel with trash material Broken glass gravel
______________________________________________________________________________ All samples were taken from bottom sediment of river
D= Drain 68d R = River S = South

SOIL ANALYSIS September 1988 - July 1989
Sta. 8 Sta. 12D Sta. 12S Sta. 12 Sept. 1 Sept. 19 April 12
Soil Reaction Test (pH) Alkaline Alkaline Neutral Alkaline Aluminum (Active) V. Low Low V. Low V. Low V. Low V. Low
Ammonia V.High Medium V.High Medium Medium Medium
Calcium High Low High _ Low Medium
V.Low Chloride
Low Low Low Low Low Humus (Organic Soil)
Medium Medium Medium Low Low Low Iron (Ferric)
Magnesium Medium Low V.Low V.Low V.Low Low
Medium Manganese Low Medium V.Low - Low
Low V.Low Low V.Low V.Low V Low Nitrate
Medium V.Low High High High V.High Phosphorus
Potassium Low V. Low V. Low V. Low Low Low
PHYSICAL CHARACTERISTICS
COLOR Brown Brown Brown Brown Brownish grey Silt, Silt &Silt, Silt, sand & TEXTURE sand & gravel Silt & sand & gravel with trash gravel gravel broken glass material

SOIL ANALYSIS September 1988 - July 1989
CHEMICAL Sta. 12 Sta. 14D Sta. 24D & 24S Sta. 24 ANALYSIS May 17 Sept. 22 Sept. 14 April 12
Soil Reaction Neutral Alkaline Alkaline Neutral Alkaline & Acidic Test (pH) Aluminum V. Low V. Low V. Low V. Low V. Low V. Low V. Low (Active) Ammonia V. High V. High High Medium V. High Med. Med. Calcium - - High Medium High Low V. Low Chloride - - - V. Low V. Low - - Humus - - V. Low Low Low Low Low (Organic Soil) Iron (Ferric) V. Low Low V. Low V. Low V. Low V. Low V. Low Manganese - - - - Med. Low - - Nitrate V. Low V. Low V. Low V. Low - V. Low - Nitrite - - - - - - - Nitrogen Phosphorus Medium Medium V. High Medium High Med. Med. Potassium V. Low V. Low V. Low Low Low Low Low Sulfate - - - V. Low V. Low - - PHYSICAL CHARACTERISTICS ODOR - - - - - - - COLOR Brown Brown Brown Brown Brown Brown Brown TEXTURE Silt & Gravel Silt Silt & Silt& Silt, gravel &
& Gravel trash sand broken glass material
68 f

SOIL ANALYSISSeptember 1988 - July 1989
CHEMICAL Sta. 24 Sta. 25D Sta. 25 ANALYSIS May 16 Sept. 9 April 12 May 17
Soil Reaction Medium Acidic Neutral Neutral Alkaline Test (pH) Aluminum V. Low V. Low V. Low V. Low V. Low V. Low V. Low (Active) Ammonia V. High V. High V. High Medium Medium Med. Med. Calcium V. Low V. Low Low Medium Medium Medium V. Low Chloride Low Low V. Low - - Low - Humus Medium Low Low Low Low Low Low (Organic Soil) Iron (Ferric) Medium Medium Medium Low Medium Medium Medium Manganese - - Medium Low Low Medium Low Nitrate V. Low V. Low V. Low - - V. Low - Nitrite - - - - - - - Nitrogen Phosphorus High High Medium Medium Medium Medium Low Potassium Low Low Low Low V.Low V. Low V.Low Sulfate - - - - - - - PHYSICAL CHARACTERISTICS ODOR - - - - - - - COLOR Beige-brown Brown Brown Brown Brown Brown TEXTURE Silt Silt Silt, sand Silt, sand & Silt & sand
& Gravel gravel with leafy debris 68g

SOIL ANALYSIS September 1988 - July 1989
CHEMICAL Sta. 26D Sta. 26R Sta. 4 ANALYSIS Sept. 9 July 12
Soil Reaction Medium Alkaline Alkaline Alkaline Test (pH) Acid Aluminum
V. Low V. Low V. Low V. Low (Active) Medium High High V. Low Ammonia
Medium Medium Medium Calcium
Chloride
Low Low Humus (Organic Soil) Iron (Ferric) Low Medium Low Medium Magnesium Low V. Low V. Low _
Low Medium Medium Manganese Nitrate _ _ High Nitrite Nitrogen Phosphorus Low Medium Low Low Potassium V. Low Low Low Medium
PHYSICAL CHARACTERISTICS
Brown Brown Brown Light brown COLOR Silt, Silt & Silt with Silt TEXTURE sand & gravel leafy debris
gravel with bits of broken glass
68h

SOIL ANALYSIS September 1988 - July 1989
CHEMICAL Sta. 4 Sta. 5 Sta. 8 Sta. 12 ANALYSIS July 17 July 20 July 20 July12
Soil Reaction Neutral Neutral Alkaline Neutral Neutral Alkaline Test (pH) Alumimum - Medium Med. - - - - - (Active) Ammonia Low Low V. Low V. Low Low Low High Med. Calcium Chloride Humus Iron (Ferric) V. Low V. Low V. Low V. Low V. Low V. Low Med. Med. Magnesium Low Low High Low Low Low V. Low V. Low Manganese Med. Low Nitrate High High High High High High Low - Nitrite Nitrogen Phosphorus Low Low Med. Med. Med. Low High Low Potassium Low Low Low Low Low Low Low V. Low Sulfate Low PHYSICAL CHARACTERISTICS COLOR Brown Brown Brown Light Brw Brown Brown Green Brw Brown TEXTURE Silt & Silt, gavel Silt, Sand & Silt & woody debris Silt & Sand gravel & broken gravel leafy gravel glass & leafy debris
68i

SOIL ANALYSIS September 1988 - July 1989
Sta. 25 Sta. 25 Sta. 24 Sta. 24 July 17 July 12 July 17 July 12
Soil Reaction Alkaline Alkaline Alkaline Neutral Neutral Test (pH) Alumimum - - Low - - - - - (Active) Ammonia Med. V. High Low Low High - Low Low Calcium High Low Med. Med. Low Med. Med. Low Chloride Humus Iron (Ferric) Low Med. V. Low V. Low Med. Low V. Low V. Low Magnesium Med. Low Low V. Low Low Med. V. High Manganese Med. Nitrate V. Low High Nitrite Nitrogen Phosphorus Med. Low Med. Med. Low Low Low Med. Potassium V. Low Low Low Low V. Low V. Low Low Low Sulfate Low PHYSICAL CHARACTERISTICS COLOR Green Light Brown Light Brown Brown Brown Brown Brown Brown Brown TEXTURE Silt Sand & Silt & Sand & Silt & Silt Silt & gravel leafy gravel w/ gravel gravel debris broken glass
68j

USGS/DC WRRC PROJECT SOIL ANALYSIS
September - November 1989 ---------------------------------------------------------------------------------------------------------------------------------- CHEMICAL Sta. 4 Sta. 5 ANALYSIS 9/07 10/02 9/25 10/24 ----------------------------------------------------------------------------------------------------------------------------------
Soil Reaction Neu- Alka- Neutral Slight Alkaline Neutral Neutral Test (pH) tral line Acidic Aluminum - V. Low V. Low V. Low V. Low V. Low V. Low V. Low (Active) Ammonia V. High V. High High High V. High High High High Calcium Medium Medium High High Medium Med. Med. High Chloride V. Low Low Low V. Low Humus Low Iron (Ferric) Low Low Med. Med. High Med. Medium Medium Magnesium V. Low V. Low V. Low Manganese Medium Medium High Medium Medium Medium Medium High Low Low Low Low Low Nitrate Medium V. High V. Low V. Low V. Low Nitrite Nitrogen Phosphorus Medium Medium High Low Medium Medium Medium High Potassium V. Low Low Medium Medium Low Medium Medium Low Sulfate V. Low PHYSICAL CHARACTERISTICS ODOR Pungent COLOR Brown Brown Brown Brown Brown Brown Light Brown TEXTURE Silt & gravel Silt & Silt Silt with leafy Silt Silt gravel w/ & woody debris glass debris
68k

SOIL ANALYSIS
September - November 1989 ----------------------------------------------------------------------------------------------------------------------- CHEMICAL Sta. 8 Sta. 12 ANALYSIS 9/25 10/24 9/21* 10/12 ----------------------------------------------------------------------------------------------------------------------
Soil Reaction
Neutral Neutral Neutral Alkaline/ Test (pH) Med. Acidic Alumimium
V. Low V. Low V. Low V. Low V. Low V. Low V. L (Active) Ammonia High Medium V.High V.High Medium High Med
Low Medium High High Low Medium High Calcium
Low V.Low Chloride Humus Low Low Low (Organic Soil) Iron (Ferric) Medium Medium High High Low Medium Med Magnesium V.Low V.Low V.Low V.Low
High Medium Medium Low Medium High Med Manganese Low Low V.Low V.Low V.Low V.Low Medium V.Low Low Nitrate
V.Low Nitrite
Nitrogen V.Low V.low Medium High Medium Medium High Phosphorus Low Low Low Low V.Low Medium Med Potassium
V. Low Sulfate PHYSICAL
Brown Brown Grey Grey Brown Brown Brown
CHARACT. COLOR Silt &
Leafy Silt & woody Silt & leafy TEXTURE Silt Silt debris debris debris
68l

SOIL ANALYSIS
September - November 1989
-------------------------------------------------------------------------------------------------------- CHEMICAL Sta. 14 Sta. 16 ANALYSIS 9/25 10/24 9/25 10/24
Soil Reaction Alkaline Neutral Alkaline Alkaline Test (pH) Alumimium V.Low V.Low V. Low V. Low V. Low V.low V. Low V. L
(Active) V.High V.High V.High V.High Medium V.High V.High High Ammonia
High High High High High High High Med Calcium
Low V. Low V. Low Chloride
Humus
Low Low (Organic Soil) Medium Medium Low Medium Medium Medium High Med Iron (Ferric)
Low Low V.Low V.Low V.Low V.L Magnesium
Medium Medium Medium Medium Medium Med Med Manganese Low Low Low Low Low High High V.Low V.Low V.Low V.Low Nitrate
Nitrite Nitrogen
V.High V.High V.High V.High High High V.High High Phosphorus
V.Low V.Low Low Low V.Low V.Low V.Low V.L Potassium
Low Sulfate PHYSICAL CHARACT. ODOR Pungent Pungent COLOR Grey Grey Grey Grey Grey-Brown Orange-Bro TEXTURE Silt Silt Silt & leafy Sand & gravel Silt, sand
debris with trash gravel material
68m

SOIL ANALYSIS September - November 1989
CHEMICAL Sta. 14 Sta. 16 ANALYSIS 11/13 11/13
-----------------------------------------------------------------------------------------------------------
68 n
Neutral Neutral Alkaline Alkaline
Very Low Very Low Very Low Very Low
Very High Very High Very High Very High
High High High High
Medium
High
High
High
Very Low Very Low Very Low Very Low
Medium Low Medium Low Medium Medium Low Medium High High Very high
Very Low Low Very Low Very Low
Soil Reaction Test (pH) Alumimium (Active) Ammonia Calcium Chloride Humus (Organic Soil) Iron (Ferric) Magnesium Manganese Nitrate Nitrite Nitrogen Phosphorus Potassium Sulfate PHYSICAL CHARACT. ODOR Pungent Pungent Pungent Pungent
Dark grey Dark grey Grey Grey COLOR Silt, sand '& Silt, sand TEXTURE Silt Silt gravel gravel
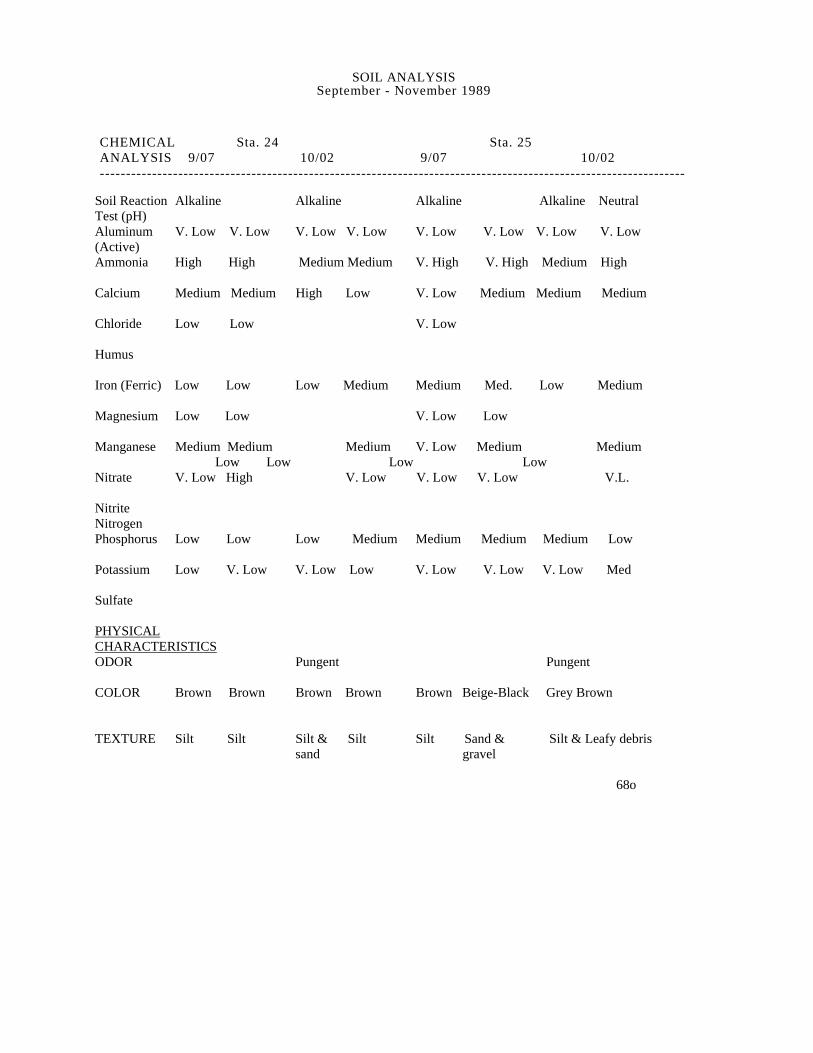
SOIL ANALYSIS September - November 1989
CHEMICAL Sta. 24 Sta. 25 ANALYSIS 9/07 10/02 9/07 10/02 ----------------------------------------------------------------------------------------------------------------
Soil Reaction Alkaline Alkaline Alkaline Alkaline Neutral Test (pH) Aluminum V. Low V. Low V. Low V. Low V. Low V. Low V. Low V. Low (Active) Ammonia High High Medium Medium V. High V. High Medium High Calcium Medium Medium High Low V. Low Medium Medium Medium Chloride Low Low V. Low Humus Iron (Ferric) Low Low Low Medium Medium Med. Low Medium Magnesium Low Low V. Low Low Manganese Medium Medium Medium V. Low Medium Medium Low Low Low Low Nitrate V. Low High V. Low V. Low V. Low V.L. Nitrite Nitrogen Phosphorus Low Low Low Medium Medium Medium Medium Low Potassium Low V. Low V. Low Low V. Low V. Low V. Low Med Sulfate PHYSICAL CHARACTERISTICS ODOR Pungent Pungent COLOR Brown Brown Brown Brown Brown Beige-Black Grey Brown TEXTURE Silt Silt Silt & Silt Silt Sand & Silt & Leafy debris sand gravel
68o

USGS/DC WRRC PROJECT SOIL ANALYSIS
February - June 1990
------------------------------------------------------------------------------------------------------- Sta. 4 Sta. 4 Sta. 5 Feb. 15 April 4 Feb. 15
------------------------------------------------------------------------------------------------------
Soil Reaction Alkaline Alkaline Slightly Medium Test (pH) Acid Acid Alumimium (Active) V. Low V. Low V.Low V.Low V.Low V.Low Ammonia
Medium Medium Medium Medium Medium Medium Calcium Medium Medium Medium Medium Medium Medium Chloride
V. Low V. Low Humus
Low Low (Organic Soil) Iron (Ferric)
Low Low Low Low Medium Low Magnesium V. Low V. Low V. Low V. Low V. Low V. Low Manganese Low Low Medium Medium Phosphorus Medium Medium Medium Medium V.High V.High Potassium Low Low V. Low Low Low Low Sulfate PHYSICAL CHARACT. ODOR
Brown Reddish- Brown Brown Brown Brown COLOR Brown Silt & Silt & Silt & gravel Silt Silt gravel gravel
TEXTURE

USGS/DC WRRC PROJECT SOIL ANALYSIS
February - June 1990---------------------------------------------------------------------------------------------------------------------------------- CHEMICAL Sta. 5 Sta. 8 Sta. 8 ANALYSIS May 8 Feb. 14 May 8
---------------------------------------------------------------------------------------------------------------------------------- Soil Reaction Alkaline Alkaline Slightly Medium Test (pH) Acid Acid Aluminium V. Low V. Low V. Low V. Low V. Low V. Low (Active) Ammonia Medium Medium Medium Medium Medium Medium Calcium Medium Medium Medium Medium Medium Medium Chloride - - - - V. Low V. Low Humus - - - - Low Low (Organic Soil) Iron Low Low Low Low Medium Low (Ferric) Magnesium V. Low V. Low V. Low V. Low V. Low V. Low Manganese - - Low Low Medium Medium Nitrate - - - - - - Nitrite - - - - - - Nitrogen Phosphorus Medium Medium Medium Medium V. High V. High Potassium Low Low V. Low Low Low Low Sulfate - - - - - - PHYSICAL CHARACTERISTICS ODOR - - - - - - COLOR Brown Reddish- Brown Brown Brown Brown Brown TEXTURE Silt & Silt & Silt & gravel Silt Silt gravel gravel
68 q

February - June 1990
CHEMICAL Sta. 12 Sta. 12 Sta. 14
----------------------------------------------------------------------------------------------------- ANALYSIS Feb. 15 April 4 March 7
Soil Reaction Alkaline Neutral Neutral Alkaline Test (pH) Aluminium V. Low V. Low V. Low V. Low V. Low V. Low (Active) Ammonia High Medium High V. High V. High V. High Calcium Low Low Medium Medium High High Chloride - - - - - - Humus - - - - - - (Organic Soil) Iron High Medium High V. High Low Low (Ferric) Magnesium - - V. Low V. Low Medium Medium Manganese Med. Low - Medium High Med. Low Medium Nitrate - - - - - - Nitrite - - - - - - Nitrogen Phosphorus Medium Medium Medium Medium Low Medium Potassium Low Low Low Low Medium Medium Sulfate - - - - - - PHYSICAL CHARACTERISTICS ODOR - - - - Slightly pungent COLOR Brown Brown Brown Brown Grey Grey TEXTURE Silt & Silt & Silt & gravel Sand Sand gravel gravel
68r

February - June 1990
CHEMICAL Sta. 14 Sta. 16 Sta. 16 ANALYSIS April 25 March 7 April 25
--------------------------------------------------------------------------------------------------------- Soil Reaction Neutral Alkaline Neutral Alkaline Test (pH) Aluminium V. Low V. Low V. Low V. Low V. Low V. Low (Active) Ammonia V. High V. High V. High V. High V. High V. High Calcium - - Medium High - - Chloride - - - - - - Humus - - - - - - (Organic Soil) Iron Medium Medium High High Low Medium (Ferric) Magnesium - - V. Low V. Low Medium Medium Manganese - Med. Low Medium Medium - - Nitrate - - - - - - Nitrite - - - - - - Nitrogen Phosphorus High High Medium High High High Potassium Low Low V. Low V. Low Medium Low Sulfate - - - - - - PHYSICAL CHARACTERISTICS ODOR - - Slightly pungent - - COLOR Dark grey Grey Grey Brown Brown TEXTURE Silt & sand Silt & gravel Silt with leafy debris
68s

February - June 1990
CHEMICAL Sta. 24 Sta. 24 Sta. 25 ANALYSIS Feb. 26 April 23 Feb. 28
------------------------------------------------------------------------------------------------------
Soil Reaction Slightly Acid Alkaline Alkaline Test (pH) Aluminium V. Low V. Low V. Low V. Low V. Low V. Low (Active) Ammonia High High Medium Medium High Medium Calcium Low Low - - Medium Medium Chloride - - - - - - Humus - - - - - - (Organic Soil) Iron Medium Medium Low Low Medium Medium (Ferric) Magnesium V. Low V. Low Low Low V. Low V. Low Manganese Med. Low Med. Low Med. Low Med. Low Low Low
Nitrate V. Low V. Low - - V. Low V. Low Nitrite - - - - - - Nitrogen
Phosphorus Low Low V. Low V. Low Medium Medium Potassium V. Low Low Low Low Low Low Sulfate - - - - - - PHYSICAL CHARACTERISTICS ODOR - - - - - - COLOR Brown Brown Brown Brown Brown Brown TEXTURE Silt & gravel Silt with leafy debris Silt & gravel
68t

February- June 1990
CHEMICAL Sta. 25 Sta. 25 ANALYSIS April 23 June 12 ---------------------------------------------------------------------------------------------------------
68 u
Soil Reaction Alkaline Neutral Test (pH) Aluminum V. Low V. Low V. Low V. Low (Active) Ammonia Medium Medium V. High V. High Calcium - - - - Chloride - - - - Humus - - - - (Organic Soil) Iron Low Low Medium High (Ferric) Magnesium Low Low V. Low V. Low Nitrate - - - - Nitrite - - V. Low V. Low Nitrogen Phosphorus Medium Low Medium High Potassium Low Low Low Medium Sulfate - - - - PHYSICAL CHARACTERISTICS ODOR - - - - COLOR Brown Brown Grey Grey TEXTURE Silt & sand with Silt with trash debris Leafy debris

TABLE 10
THE TOTAL MEAN FOR COLIFORM TEST (April – July 1988)
DATE STATION
4/08
MEAN (MPN Per 100 ml*)
12 59.7 4/13 26 41.04/15 24 39.34/22 14 3.77/04 12 63.77/06 16 5.77/08 14 17.07/11 24 4.37/13 26 19.77/15 25 1966.77/18 8 406.07/20 5 2400.07/22 4 136.0
* From MPN Index for Positive and Negative results when three 10 ml, three 1 ml and three 0.1 portions are used.

TABLE 11
BIOTIC INDEX OF POLLUTIONAL STATUS OF WATER QUALITY OF ANACOSTIA RIVER
STATION POLLUTIONAL EQUATION BIOTIC INDEX READINGS
4D 2(0) + 1 = 1 Moderate Pollution 5 2(0) + 8 8 Clean with slow current8 2(0) + 1 1 Moderate pollution
*12 2(0) + 0 0 Gross pollution 12D 2(0) + 8 8 Clean with slow current 14D 2(1) + 1 3 Moderate pollution 16D 2(0) + 7 = 7 Moderate pollution 16 No organism was found24D 2(1) + 0 - 2 Moderate pollution
*24S 2(0) + 0 = 0 Gross pollution 2(1) + 0 = 2 Moderate pollution25D 2(0) + 0 = 0 Gross pollution*26D
*26R 2(0) + 0 = 0 Gross pollution
* Indicate the most polluted station sites located along the Anacostia River
Standard Values adapted from the Michigan Water Resources Commission, 1970. Index range from 1-40 and correlated accordingly.
0 - gross pollution 1 - 6 - moderate pollution4 - 9 - clean with slow current
10 - 40 - clean
68 w

TABLE 14
DIVERSITY INDEX OF ALL INDIVIDUAL BENTHOS SPECIES FOUND IN ANACOSTIA RIVER LEGEND:
A April - July 1988
B Sept. 1988 - July 1989 Sept. 1989 - Dec. 1989 C
D Feb. 1990 - March 1990
SPECIES A B C D
3 22 - 1 Aelosoma 4 1 - - Bristle worm
10 30 30 13 Enchytraeds 205 1014 211 386 Tubifex - 1 1 - Leech 2 - - - Cladoceran 2 - - - Alona 4 - 1 7 Daphnia 3 - - - Diaphanosoma 15 - - 5 Polyphenus 2 2 - 3
Bosmia 8 487 106 93 Diaptomus
42 619 39 61 Cyclops Mollusca - - - - Faucet snail - 1 Pond snail - 14 - - Pouch snail - 1Finger snail - 1
1 4 1 1 Valvata Peashell 1 19 - - Orb snail Nematoda 9 8 7 13 Diplogasteroides 1 2 - - Rhabditis 1 38 7 13 Ditylenchus 8 38 17 13 Myceliophagus
- 14 - - Nemertea Platyhelminthes - 12 5 - Dugesia - 10 7 2 Stenostomun
- 4 4 - Planaria 1 24 4 2 Ostracod - 11Scud 2 0 2 7Sow bug

TABLE
DIVERSITY INDEX OF ALL INDIVIDUAL BENTHOS SPECIES FOUND IN ANACOSTIA RIVER
SPECIES A B C D
Rotifera Keratella - 4 101 67
Bdelloid 3 - - - Synchaeta - 1 - 2
Euchlaris 2 - - - Philodina - - 1 1
Filinia 2 - - 2 Monostyla 8 7 - 9
Proales 2 4 1 2 Watermite 2 1 32 16 Cranefly 3 - - - Nymph 3 - - - Dragonfly adult 1 - - - Dragonfly nymph 1 - - -
Larval Midge - - - 1 Ablabesmyia - 13 3 1
Chironomus - 11 1 1 Sewage fly - - 1 1 Mayfly nymph - 1 - - Stonefly - 1 - -
69 b

TABLE 15
USGS/DC WRRC PROJECT SPECIES COMPOSITION FOR PLANKTON
APRIL - SEPTEMBER 1988
NO. OF
70 a
STATION FLAGELLATA CYANOPHYTASAMPLES %
CHLOROPHYTA DESMIDICEA%
24* 3 7.7 38.5 5304/12/88 25* 3 10.0 60.0 3004/05/88
04/05/88 26* 3 7.7 23.1 30.8 38 05/03/88 4 * 3 27.6 13.8 31.0 27
4 1 56.3 5.5 18.7 1906/09/88 12 1 25.0 30.6 27.8 1606/16/88
06/27/88 12 1 58.6 21.4 12.9 706/16/88 14S 1 83.3 16.7 06/16/88 16S 1 52.6 36.8 1006/30/88 16 1 1.2 16.9 76.1 506/24/88 24 1 53.1 7.3 25.6 14
26N 1 51.5 36.4 3.0 906/23/88 06/23/88 26S 1 45.3 21.1 32.0 1
14 1 28.9 50.0 17.3 307/06/88 24 1 34.9 33.3 18.8 1307/08/88 26D 1 28.9 26.9 30.8 1307/11/88 26R 1 21.4 21.7 29.7 2707/11/88 4D 2 4.0 35.0 58.0 309/01/88 4S 2 10.4 12.5 66.7 1009/01/88 8 2 17.7 27.1 37.5 1709/01/88 16D 1 8.3 44.4 33.3 1409/22/88
TOTAL TOTAL TOTAL TOTAL INDIVIDUALS MONTHS STAS. WATER 493 389 631 242 COVERED SAMPLES COLLECTED = 5 = 8 = 32
* For these sample stations the individual species were not counted, identified and classified in the above groups D = DRAIN N = NORTH R = RIVER S = SOUTH

USGS/DC WRRC PROJECT POLLUTIONAL STATUS COMPOSITION OF BENTHIC SPECIES
APRIL - NOVEMBER, 1988.
MONTH STATION NO. OF TOLERANT FACULTATIVE % INTOLERANT %SAMPLES
YR. (Pollutional or (Sub-tolerant or
More/less cleaner preference (Clean water species)tolerant sp.) species)
04/26/88 12 1 62.5 37.5 04/12/88 24 3 76.5 23.5 04/05/88 25 3 100.0 - 04/05/88 26 3 100.0 -
05/03/88 4 1 100.0
06/09/88 4 1 - 100.0 06/16/88 12 1 - 100.0 06/27/88 12 1 55.6 44.4 06/16/88 14S 1 - 100.0 06/16/88 14N 1 100.0 - 06/30/88 16 1 - 100.0 06/24/88 24 1 - 100.0 06/23/88 26N 2 44.4 55.6 06/23/88 26S 2 - 100.0 07/06/88 14 1 88.9 11.1 07/08/88 24 1 - 100.0 07/11/88 26D 1 - 100.0 07/11/88 26R 1 - 100.0 09/01/88 4D 2 - 100.0 09/01/88 8 2 50.0 50.0 09/19/88 12S 1 100.0 - 09/19/88 12D 1 - 100.0 09/22/88 14D 1 66.7 16.7 16.7 09/22/88 16D 1 - 100.0 09/14/88 24D 2 50.0 - 50.0 09/14/88 24S 2 100.0 - 09/14/88 25D 1 94.1 - 5.9 09/16/88 26D 1 100.0 - 09/16/88 26R 1 100.0 -
11/03/88 5 3 74.2 25.8
TOTAL TOTAL TOTAL TOTAL INDIVIDUALS MONTHS STATIONS WATER COVERED SAMPLES COLLECTED = 9 = 44 = 300 = 149 = 3 D = DRAIN N = NORTH R = RIVER S = SOUTH
70b
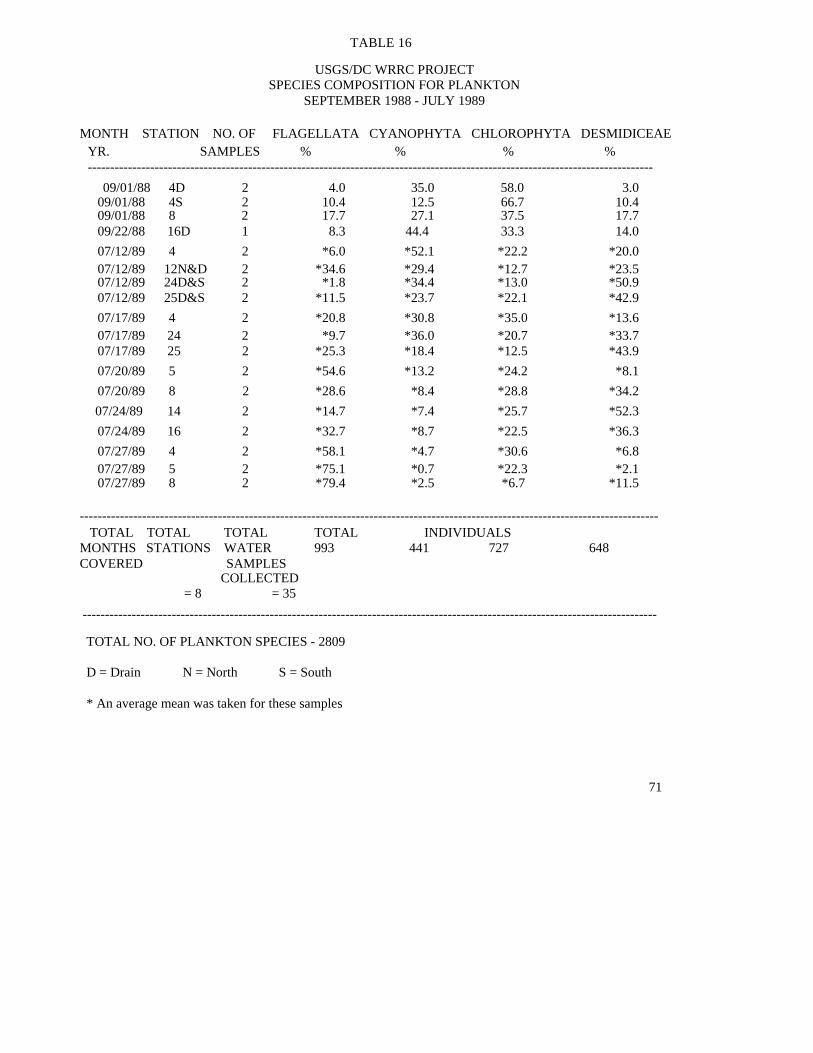
TABLE 16
USGS/DC WRRC PROJECT SPECIES COMPOSITION FOR PLANKTON
SEPTEMBER 1988 - JULY 1989
MONTH STATION NO. OF FLAGELLATA CYANOPHYTA CHLOROPHYTA DESMIDICEAE YR. SAMPLES % % % % -------------------------------------------------------------------------------------------------------------------------------
09/01/88 4D 2 4.0 35.0 58.0 3.0 09/01/88 4S 2 10.4 12.5 66.7 10.4 09/01/88 8 2 17.7 27.1 37.5 17.7 09/22/88 16D 1 8.3 44.4 33.3 14.0 07/12/89 4 2 *6.0 *52.1 *22.2 *20.0 07/12/89 12N&D 2 *34.6 *29.4 *12.7 *23.5 07/12/89 24D&S 2 *1.8 *34.4 *13.0 *50.9 07/12/89 25D&S 2 *11.5 *23.7 *22.1 *42.9 07/17/89 4 2 *20.8 *30.8 *35.0 *13.6 07/17/89 24 2 *9.7 *36.0 *20.7 *33.7 07/17/89 25 2 *25.3 *18.4 *12.5 *43.9 07/20/89 5 2 *54.6 *13.2 *24.2 *8.1 07/20/89 8 2 *28.6 *8.4 *28.8 *34.2 07/24/89 14 2 *14.7 *7.4 *25.7 *52.3 07/24/89 16 2 *32.7 *8.7 *22.5 *36.3 07/27/89 4 2 *58.1 *4.7 *30.6 *6.8 07/27/89 5 2 *75.1 *0.7 *22.3 *2.1 07/27/89 8 2 *79.4 *2.5 *6.7 *11.5
---------------------------------------------------------------------------------------------------------------------------------- TOTAL TOTAL TOTAL TOTAL INDIVIDUALS MONTHS STATIONS WATER 993 441 727 648 COVERED SAMPLES
COLLECTED = 8 = 35
---------------------------------------------------------------------------------------------------------------------------------
TOTAL NO. OF PLANKTON SPECIES - 2809
D = Drain N = North S = South
* An average mean was taken for these samples
71

TABLE 17
USGS/DC WRRC PROJECT SPECIES COMPOSITION FOR PLANKTON
September - December 1989
STATION NO. OF CHLOROPHYTA CYANOPHYTA DESMIDICEAE FLAGELLATA DATE SAMPLES % % % %
---------------------------------------------------------------------------------------------------------------------------------- 09/07/89 4 2 29.9 10.7 52.1 7.309/07/89 24 2 29.1 20.6 32.9 17.6 09/07/89 25 2 18.5 20.0 45.3 16.3 09/21/89 12 2 6.1 2.3 2.5 89.1 09/25/89 5 2 21.9 1.7 5.5 71.0 09/25/89 8 2 5.5 18.4 2.3 73.8 09/25/89 14 2 19.1 7.2 66.5 7.2 09/25/89 16 2 21.0 42.5 32.1 4.6
10/02/89 4 2 4.1 - 35.6 60.3 10/02/89 24D/S 2 36.3 - 10.0 53.7 10/02/89 25N/S 2 6.9 27.2 6.7 59.2 10/12/89 12D 2 15.5 7.9 33.1 43.6
10/24/89 5 2 8.7 12.0 72.9 6.4 10/24/89 8 2 16.4 19.7 59.8 4.1 10/24/89 14 2 - 10.1 83.5 6.4 10/24/89 16 2 7.4 2.7 89.0 1.0 11/13/89 14 2 16.5 1.5 29.2 52.8 11/13/89 16 2 19.5 0.6 14.7 65.3 11/15/89 4 *1 1.7 13.3 85.0 - 11/15/89 5 *1 27.0 11.5 61.5 - 11/15/89 8 *1 34.8 10.7 46.4 8.0
11/15/89 14 *1 5.3 - 89.4 5.3 11/15/89 16 *1 18.8 - 68.8 12.5 11/15/89 24 *1 15.6 6.3 64.1 14.1 11/15/89 25 *1 13.3 8.9 66.7 11.1 12/04/89 4 *1 38.5 38.5 23.0 12/04/89 5 *1 30.0 70.0
12/04/89 24 *1 20.0
---------------------------------------------------------------------------------------------------------------------------------
TOTAL TOTAL MONTHS STAS. COVERED
= 4 = 8 --------------------------------------------------------------------------------------------------------------------------------
TOTAL TOTAL INDIVIDUALS WATER SAMPLES COLLECTED = 48 441 + 269 + 973 + 1002 = 2685
D = Drain N = North S = South
* For these sample stations an average mean was not taken due to the collection of 1 sample per site 72
-
12/04/89 14 *1 7.7 76.9 15.4 12/04/89 16 *1 14.3 52.4 33.3
72.0 8.0

TABLE 18
USGS/DC WRRC 'PROJECT SPECIES COMPOSITION FOR PLANKTON
FEBRUARY - JULY 1990 ---------------------------------------------------------------------------------------------------------------------------- MONTH STATION NO.OF FLAGELLATA CYANOPHYTA CHLOROPHYTA DESMIDICEAE YR. SAMPLES % % % %
---------------------------------------------------------------------------------------------------------------------------- 4 2 13.1 5.3 30.3 51.4 02/01/90
02/01/90 12 2 45.8 6.4 7.5 40.4 02/07/90 02/07/90 02/07/90
4 2 12.6 18.9 18.3 50.3 24 2 5.1 41.7 3.5 49.8 25 2 23.4 5.5 22.9 48.2 14 2 25.1 74.9 02/08/90
02/08/90 16 *1 12.5 12.5 5.0 70.0
5 2 31.7 0.5 58.1 9.8 8 2 44.7 1.1 15.9 38.4 4 2 63.2 1.3 29.6 6.1
12 2 84.1 2.0 9.5 4.4
24 2 29.0 19.8 6.4 44.8 25 2 42.6 14.8 8.8 33.9 14 2 5.8 26.3 21.6 46.5 16 2 2.1 10.6 25.3 62.1
5 2 62.4 6.7 22.3 8.8 8 2 35.4 18.9 37.1 8.3
4 2 24.9 2.7 14.0 58.4 12 2 26.9 1.9 22.2 49.1 24 2 92.1 1.2 6.8 25 2 88.4 2.0 9.6 14 2 69.6 0.6 7.0 24.0 16 2 4.2 95.8
5 2 7.7 3.5 23.9 65.08 2 7.7 3.4 45.3 43.6
4 2 41.4 3.5 55.3
24 2 38.4 6.7 4.0 51.0 25 2 11.6 0.9 3.1 84.6
5 2 9.6 33.2 6.1 51.1 8 2 11.0 19.7 1.5 68.0
73a

07/10/90 07/10/90 07/10/90
12 2 17.3 9.1 29.8 43.9 14 2 32.8 11.2 33.8 21.3 16 2 21.3 6.2 35.3 37.3
07/19/90 5 2 12.4 19.7 68.0 07/19/90 8 2 0.8 19.1 13.9 66.3
4 2 20.1 25.0 24.7 30.4 07/24/90 07/24/90 24 2 9.9 10.9 32.6 46.6 07/24/90 25 2 14.0 13.2 22.0 50.9
---------------------------------------------------------------------------------------------------------------------------- TOTAL TOTAL TOTAL MONTHS STATIONS WATER
TOTAL INDIVIDUALS
SAMPLES COLLECTED
= 75 3259 + 1197 + 2443 + 4539 = 11438 ---------------------------------------------------------------------
= 6 = 8
----------------------------------------------------------------------------------------------------------------------------- * For this sample station the mean was not taken due to the collection of 1 sample at that site

TABLE 19
USGS/DC WRRC PROJECT
DIVERSITY INDEX (DI) OF ALL INDIVIDUAL SPECIES FOUND IN THE ANACOSTIA RIVER
April - July 1988
Evaluation Equation =>Number of Individual Species X 100 Total Number of Species
BENTHIC SPECIES NO. OF SPECIES D.I.
Annelida Aeolosoma Leidyi/Cragin 3 0.90Bristleworm/Deco 4 1.19Enchytraeids 10 2.99Tubifex/Sludgeworm 205 61.20
Cladocerans Alona 2 0.60Daphnia 4 1.19Diaphanosoma 3 0.90Polyphemus 15 4.48
Copepod Cyclops 42 12.54Diaptomus 8 2.39
Mollusca Orb Snail 1 0.30Peashell Clam 1 0.30
Nematoda Ditylenchus Myceliophagus 8 2.39 Roundworm Diplogasteroides 9 2.67Rhabiditis 1 0.30 Rotifers Bdelloid 3 0.90Euchlanis Dilata 2 . 0.60Filinia 2 0.60Monostyla 8 2.39Proales 2 0.60
Watermite 2 0.60
TOTAL TOTAL TOTAL NUMBER OF NUMBER OF %BENTHIC SPECIES INDIVIDUALS
= 21 = 335 = 100.03


USGS/DC WRRC PROJECT DIVERSITY INDEX(DI) OF ALL INDIVIDUAL SPECIES
FOUND IN THE ANACOSTIA RIVER September 1988 - July 1989
Evaluation Equation => Number of Individual Species X 100 % Total Number of Species
---------------------------------------------------------------------------------------------------------------------------- BENTHIC SPECIES NO. OF SPECIES D.I. (%) ------------------------------------------------------------------------------------------------------------------------------ Annelida - Aeolosoma Leidyi/Cragin 22 0.91- Bristleworm/Deco 1 0.04- Enchytraeids 30 1.24- Leech/Placobdella Parasitica 1 0.04- Tubifex/Sludgeworm 1014 41.92Cladocerans - Bosmina 3 0.12- Daphnia 2 0.08Copepod - Cyclops 619 25.60- Diaptomus 487 20.13Cranefly Nymph 3 0.12Dragonfly - Adult 1 0.04- Nymph 1 0.04
Hydra (pink) 1 0.04
Larva Midge - Ablabesmyia 13 0.54- Chironomus il 0.45
Mayfly Nymph 1 0.04
Mollusca - Faucet Snail 4 0.17- orb Snail 19 0.79- Pond Snail 1 0.04- Pouch Snail 14 0.58- Fingernail Clam 1 0.04- Peashell Clam 4 0.17- Valvata(snail) 1 0.04Nematoda - Ditylenchus Myceliophagus 38 1.57

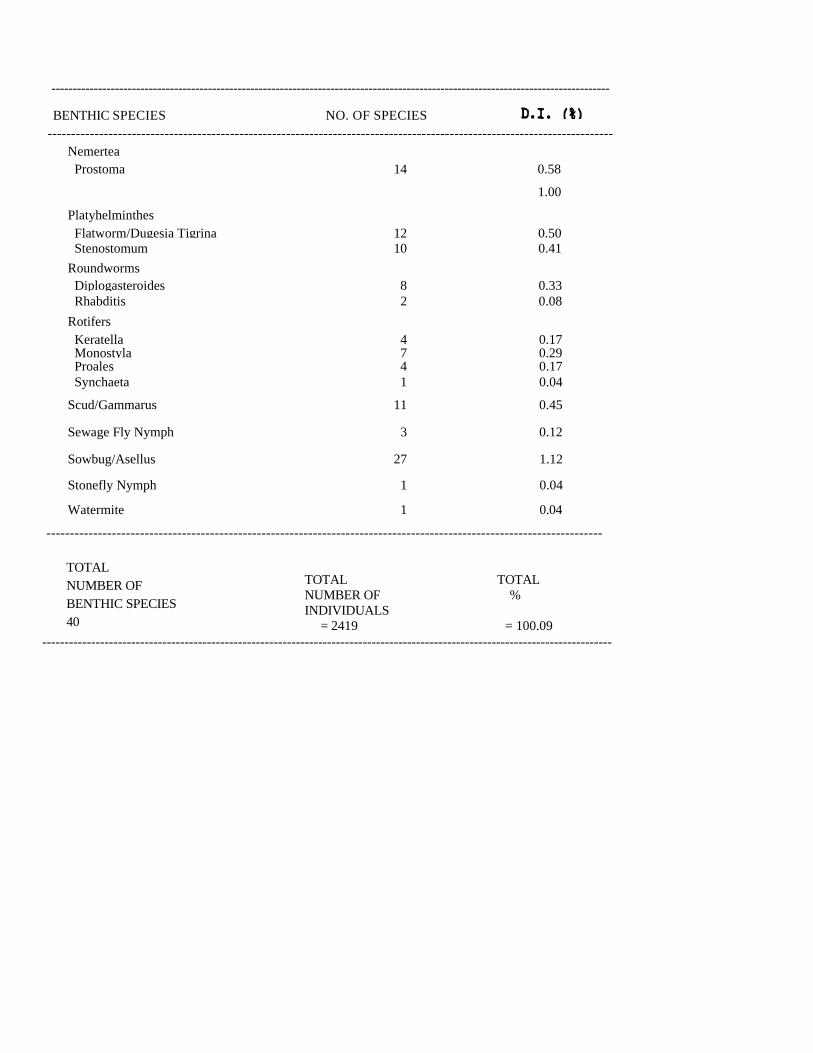
------------------------------------------------------------------------------------------------------------------------------------
BENTHIC SPECIES NO. OF SPECIES -------------------------------------------------------------------------------------------------------------------------
Nemertea Prostoma 14 0.58
1.00
Platyhelminthes Flatworm/Dugesia Tigrina 12 0.50Stenostomum 10 0.41
Roundworms Diplogasteroides 8 0.33Rhabditis 2 0.08
Rotifers Keratella 4 0.17Monostyla 7 0.29Proales 4 0.17Synchaeta 1 0.04
Scud/Gammarus 11 0.45
Sewage Fly Nymph 3 0.12
Sowbug/Asellus 27 1.12
Stonefly Nymph 1 0.04
Watermite 1 0.04
-----------------------------------------------------------------------------------------------------------------------
TOTAL TOTAL TOTAL NUMBER OF % INDIVIDUALS
NUMBER OF BENTHIC SPECIES 40 = 2419 = 100.09
--------------------------------------------------------------------------------------------------------------------------------

TABLE 20
USGS/DC WRRC PROJECT DIVERSITY INDEX(DI) OF ALL INDIVIDUAL SPECIES
FOUND IN THE ANACOSTIA RIVER September - December 1989
Annelida-Enchytraeids 30 5.31-Leech/Placobdella Parasitica 1 0.35-Tubifex/Sludgeworm 211 37.35
Cladocerans -Daphnia 1 0.18
Copepod -Cyclops
39 6.90
-Diaptomus 106 18.76
Gastrotrich 1 0.18
Insecta/Pterygota -Larva Midge/Ablabesmyia
3 0.53-Larva Midge/Chironomus 1 0.18-Sewagefly Larva 1 0.18Mollusca -Faucet Snail/Bithynia
3 0.53
-Peashell Clam/Pisidium 1 0.18
Nematoda -Ditylenchus Myceliophagus 7 1.24
Nemertea -Prostoma 2 0.35
Ostracod 4 0.71
-Platyhelminthes -Flatworm/Dugesia Tigrina
5 0.89-Flatworm/Planaria 4 0.71-Roudworm/Rhabditis 1 0.18- Stenostomum 7 1.24
Evaluation Equation =>Number of Individual Species X 100% Total Number of Species
BENTHIC SPECIES NO. OF SPECIES D.I. (%)
75 a

----------------------------------------------------------------------------------------------------------------------- BENTHIC SPECIES NO. OF SPECIES D.I. (%) ------------------------------------------------------------------------------------------------------------------------Rotifers - Keratella 101 17.88 - Philodenia 1 0.18 - Proales 1 0.18
Scud/Gammarus 1 0.18
Watermite/Limnochares 32 5.66
--------------------------------------------------------------------------------------------------------------------------
TOTAL TOTAL TOTAL NUMBER OF NUMBER OF % BENTHIC SPECIES INDIVIDUALS
= 25 = 565 = 100.03
---------------------------------------------------------------------------------------------------------------------------
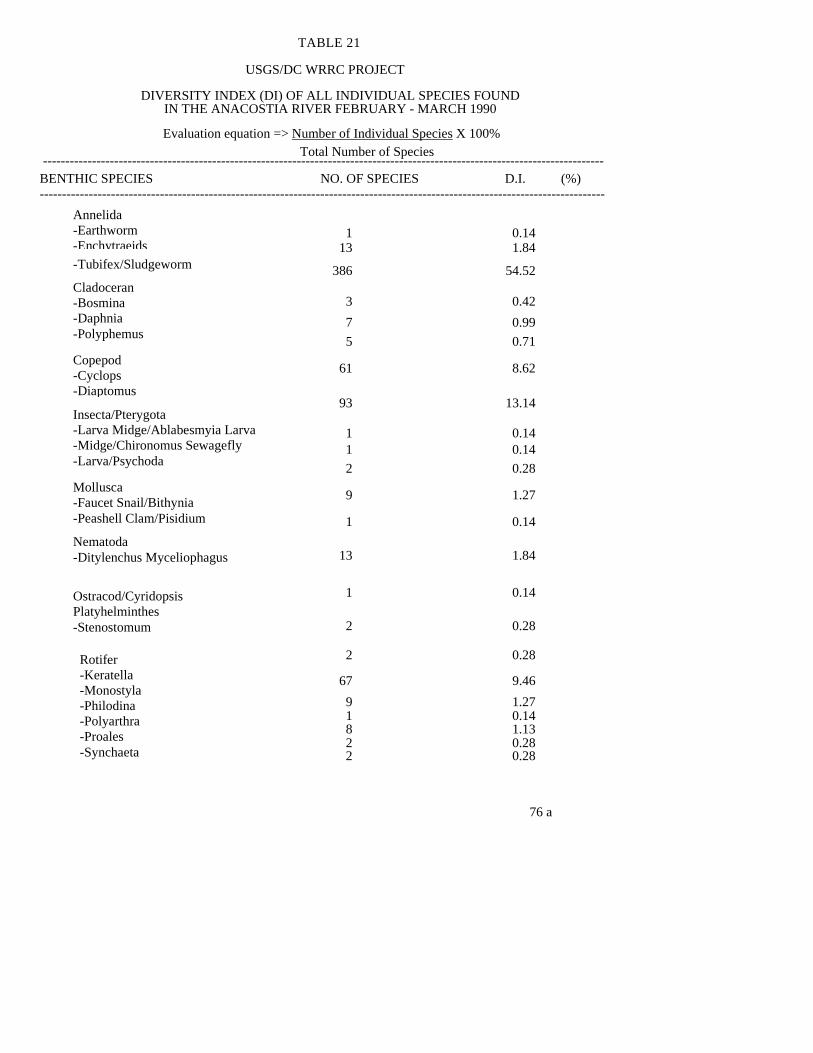
TABLE 21
USGS/DC WRRC PROJECT
DIVERSITY INDEX (DI) OF ALL INDIVIDUAL SPECIES FOUND IN THE ANACOSTIA RIVER FEBRUARY - MARCH 1990
Evaluation equation => Number of Individual Species X 100%
---------------------------------------------------------- ------------------------------------- -------------------------------Total Number of Species
BENTHIC SPECIES NO. OF SPECIES D.I. (%) -------------------------------------------------------------------------------------------------------------------------------
Annelida -Earthworm 1 0.14-Enchytraeids 13 1.84-Tubifex/Sludgeworm 386 54.52Cladoceran
3 0.42-Bosmina -Daphnia 7 0.99-Polyphemus 5 0.71Copepod 61 8.62-Cyclops -Diaptomus
93 13.14Insecta/Pterygota -Larva Midge/Ablabesmyia Larva 1 0.14-Midge/Chironomus Sewagefly 1 0.14-Larva/Psychoda 2 0.28Mollusca 9 1.27-Faucet Snail/Bithynia -Peashell Clam/Pisidium 1 0.14Nematoda
13 1.84-Ditylenchus Myceliophagus
1 0.14Ostracod/Cyridopsis Platyhelminthes
2 0.28-Stenostomum
2 0.28Rotifer -Keratella 67 9.46-Monostyla
9 1.27-Philodina 1 0.14-Polyarthra 8 1.13-Proales 2 0.28
-Synchaeta 2 0.28
76 a
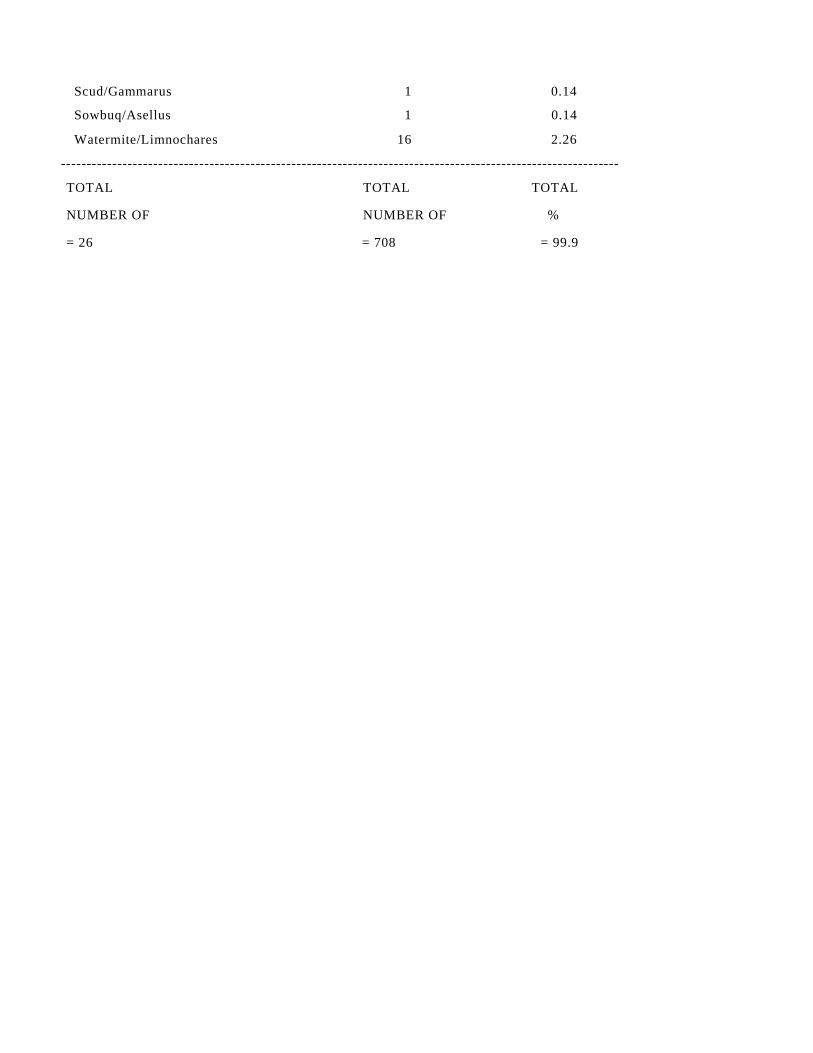
Scud/Gammarus 1 0.14
Sowbuq/Asellus 1 0.14
Watermite/Limnochares 16 2.26
-------------------------------------------------------------------------------------------------------------
TOTAL TOTAL TOTAL
NUMBER OF NUMBER OF %
= 26 = 708 = 99.9
----------------------------------------------------------------------

TABLE 22
USGS/DC WRRC PROJECT POLLUTIONAL STATUS COMPOSITION OF BENTHIC SPECIES
APRIL - NOVEMBER, 1988
NO. OF TOLERANT FACULTATIVE INTOLERANT MONTHSAMPLES % % %
TOTAL TOTAL TOTAL MONTHS STATIONS WATER COVERED SAMPLES COLLECTED
= 6 = 9 = 44 = 300 = 149 = 3
TOTAL INDIVIDUALS
D = DRAIN N = NORTH R = RIVER S = SOUTH
77
04/26/88 12 04/12/88 24 04/05/88 25 04/05/88 26 05/03/88 4
06/09/88 4 06/16/88 12 06/27/88 12 06/16/88 14S 06/16/88 14N 06/30/88 16 06/24/88 24 06/23/88 26N 06/23/88 26S 07/06/88 14 07/08/88 24 07/11/88 26D 07/11/88 26R 09/01/88 4D 09/01/88 8 09/19/88 12S 09/19/88 12D 09/22/88 14D 09/22/88 16D 09/14/88 24D 09/14/88 24S 09/14/88 25D 09/16/88 26D 09/16/88 26R 11/03/88 5
(Pollutional or more/less
tolerant species)
(Sub-tolerant (Clean water sp.) or cleaner pre- ference species)
1 62.5 37.5 3 76.5 23.5 3 100.0 3 100.0
1 100.0 -
1 - 100.0 1 - 100.0 1 55.6 44.4 1 - 100.0 1 100.0 - 1 - 100.0 1 - 100.0 2 44.4 55.6 2 - 100.0 1 88.9 11.1 1 - 100.0 1 - 100.0 1 - 100.0 2 - 100.0 2 50.0 50.0 1 100.0 - 1 - 100.0 1 66.7 16.7 16.71 - 100.0 2 50.0 - 50.02 100.0 - 1 94.1 - 5.91 100.0 - 1 100.0 - 3 74.2 25.8 -
STATIONYR.

TABLE 23 USGS/DC WRRC PROJECT
POLLUTIONAL STATUS OF BENTHIC SPECIES September 1988 - July 1989
------------------------------------------------------------------------------------------------------------------ DATE STATION NUMBER TOLERANT FACULTATIVE INTOLERANT TOTAL OF NUMBER SAMPLES (per sta.)
------------------------------------------------------------------------------------------------------------------
- 1 9/01/88 4D 2 - 100.0 9/01/88 8 2 100.0 - - 2 9/14/88 24D 2 50.0 50.0 2 9/14/88 24S 2 100.0 - 1 9/14/88 25D 1 94.1 5.9 17 9/16/88 26D 1 100.0 - - 7 9/16/88 26R 1 100.0 - - 12 9/19/88 12S 1 100.0 - 23 9/19/88 12D 1 - 100.0 8 9/22/88 14D 1 66.7 33.3 6 9/22/88 16D 1 - 100.0 7 1/03/88 5 3 74.2 25.8 31 4/25/89 4 1 20.0 60.0 20.0 5 4/25/89 12 2 *10.0 *89.2 *0.8 112 4/25/89 24 2 *33.8 *65.5 *0.7 175 4/25/89 25 2 *45.0 *55.0 - 40 5/02/89 4 2 *55.6 *41.0 *3.4 86 05/02/89 12 2 *23.3 *75.0 *1.8 107 05/02/89 24 2 *22.1 *77.9 0.0 146 05/02/89 25 2 *62.4 *37.6 - 152 05/17/89 4 2 *59.7 *39.4 *1.0 70 05/16/89 12 2 *87.5 *12.5 - 26 05/16/89 24 2 *17.1 *82.9 - 341 05/16/89 25 2 *76.9 *23.2 - 236 07/12/89 4 2 *10.3 *89.7 53 07/12/89 12N&D 2 *54.6 *45.5 33 07/12/89 24D&S 2 *5.0 *95.0 141 17/12/89 25D&S 2 *67.0 *33.0 27 17/17/89 4 2 *100.0 - 8 17/17/89 24 2 *69.0 *31.0 266 17/17/89 25 2 *46.3 *53.7 54

07/20/89 5 2 *11.8 *88.2 8107/20/89 8 2 *75.0 *25.0 507/24/89 14 2 *100.0 - - 1607/24/89 16 2 *79.4 *20.1 *0.5 11607/27/89 4 2 - *33.4 *16.6 307/27/89 5 2 - *50.0 - 207/27/89 8 2 *50.0 - - 1------------------------------------------------------------------------------------------------------------------------------ TOTAL TOTAL TOTAL TOTAL NUMBER OF INDIVIDUALS MONTHS STATIONS SAMPLES
TOTAL
COVERED COLLECTED5 9 69 1118 + 1289 + 12 = 2419
------------------------------------------------------------------------------------------------------------------------------
D = Drain N = North S = South TOLERANT : Pollutional or more/less tolerant species FACULTATIVE : Sub-tolerant or cleaner preference species INTOLERANT : Clean water species
* An average mean was taken for these samples

TABLE 24
USGS/DC WRRC PROJECT POLLUTIONAL STATUS OF BENTHIC SPECIES
September - December 1989 ----------------------------------------------------------------------------------------------------------------------------- DATE STATION NUMBER TOLERANT FACULTATIVE INTOLERANT TOTAL OF SAMPLES NUMBER (per sta.) -----------------------------------------------------------------------------------------------------------------------------09/07/89 4 2 x = 100.0 1 09/07/89 25 2 x = 50.0 09/21/89 12 2 x = 50.0 x = 50.0 9 09/25/89 5 2 x = 38.7 x = 61.3 31 09/25/89 8 2 x = 2.4 x = 97.6 90 09/25/89 14 2 x = 75.0 x = 25.0 8 09/25/89 16 x = 100.0 7 10/02/89 4 2 x = 12.5 x - 75.0 x = 12.5 7 10/02/89 24D/S 2 x = 55.5 x = 44.5 - 15 10/02/89 25N/S 2 x = 72.1 x = 26.7 x = 1.2 122 10/12/89 12D 2 x = 32.1 x = 62.0 x = 5.9 49 10/24/89 5 2 x = 92.4 x = 7.7 - 27 10/24/89 8 2 x = 94.5 x = 5.5 - 42 10/24/89 14 2 x = 92.3 x = 7.7 - 19 10/24/89 16 2 x = 79.2 x = 20.8 - 14 11/13/89 14 2 x = 12.9 x = 87.1 - 29 11/13/89 16 2 x = 32.8 x = 67.2 - 61 11/15/89 8 1 100.0 1 11/15/89 16 1 - 100.0 - 1 11/15/89 24 1 28.6 71.4 - 7 11/15/89 25 1 23.1 76.9 - 13 12/04/89 24 1 100.0 1 ----------------------------------------------------------------------------------------------------------------------------
TOTAL TOTAL TOTAL TOTAL NUMBER OF INDIVIDUALS MONTHS STATIONS SAMPLES
TOTAL
COVERED COLLECTED 565 4 8 39 280 + 281 + 4 =
----------------------------------------------------------------------------------------------------------------------------- D = Drain N = North S = South
79 a

INTOLERANT : Pollutional or more/less tolerant species FACULATATIVE : Sub-tolerant or cleaner preference species INTOLERANT : Clean water species
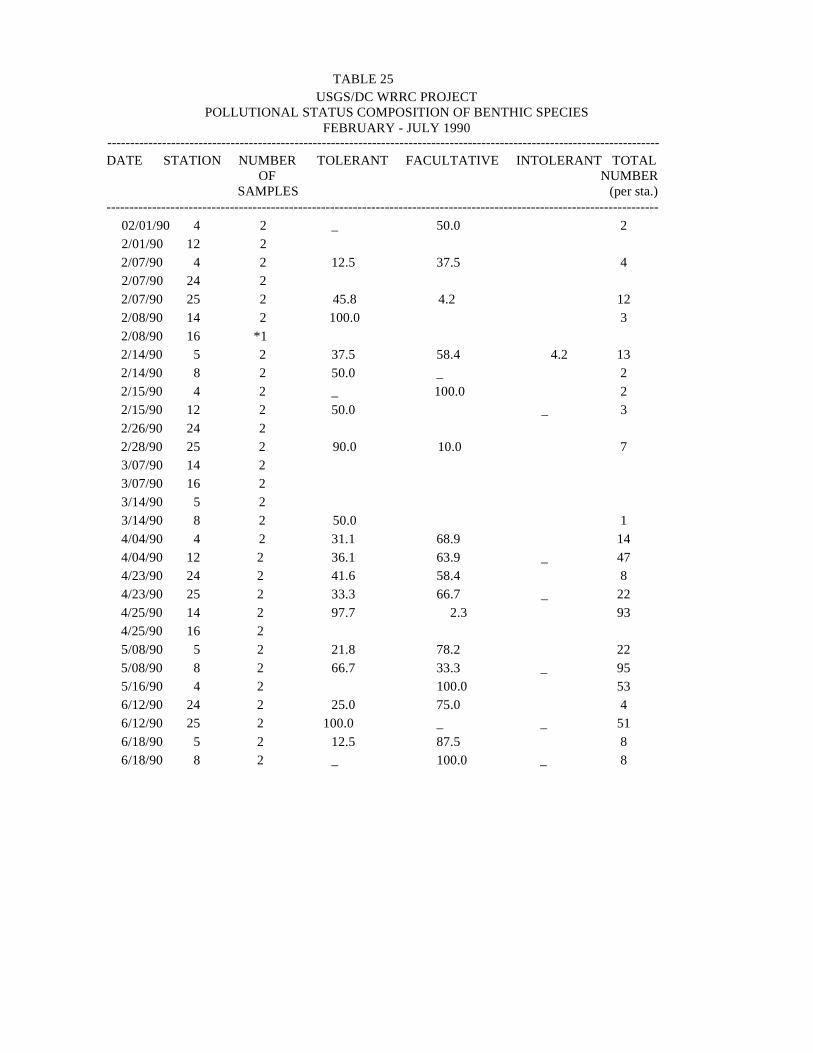
TABLE 25 USGS/DC WRRC PROJECT
POLLUTIONAL STATUS COMPOSITION OF BENTHIC SPECIES FEBRUARY - JULY 1990
------------------------------------------------------------------------------------------------------------------------- DATE STATION NUMBER TOLERANT FACULTATIVE INTOLERANT TOTAL OF NUMBER SAMPLES (per sta.) -------------------------------------------------------------------------------------------------------------------------
02/01/90 4 2 _ 50.0 2 2/01/90 12 2 2/07/90 4 2 12.5 37.5 4 2/07/90 24 2 2/07/90 25 2 45.8 4.2 12 2/08/90 14 2 100.0 3 2/08/90 16 *1 2/14/90 5 2 37.5 58.4 4.2 13 2/14/90 8 2 50.0 _ 2 2/15/90 4 2 _ 100.0 2 2/15/90 12 2 50.0 _ 3 2/26/90 24 2 2/28/90 25 2 90.0 10.0 7 3/07/90 14 2 3/07/90 16 2 3/14/90 5 2 3/14/90 8 2 50.0 1 4/04/90 4 2 31.1 68.9 14 4/04/90 12 2 36.1 63.9 _ 47 4/23/90 24 2 41.6 58.4 8 4/23/90 25 2 33.3 66.7 _ 22 4/25/90 14 2 97.7 2.3 93 4/25/90 16 2 5/08/90 5 2 21.8 78.2 22 5/08/90 8 2 66.7 33.3 _ 95 5/16/90 4 2 100.0 53 6/12/90 24 2 25.0 75.0 4 6/12/90 25 2 100.0 _ _ 51 6/18/90 5 2 12.5 87.5 8 6/18/90 8 2 _ 100.0 _ 8


7/10/90 12 2 58.7 41.3 59 7/10/90 14 2 50.0 _ 1 7/10/90 16 2 _ 50.0 5 7/19/90 5 37.6 62.4 - 37 7/19/90 8 90.1 9.9 106 7/24/90 4 2 50.0 50.0 5 7/24/90 24 2 - 100.0 9 7/24/90 25 2 _ 100.0 12
-------------------------------------------------------------------------------------------------------------------------
TOTAL TOTAL TOTAL TOTAL NUMBER OF INDIVIDUALS MONTHS STATIONS SAMPLES
TOTAL
COVERED COLLECTED = 6 = 8 = 75 417 + 290 + 1
= 708 -------------------------------------------------------------------------------------------------------------------------
TOLERANT : Pollutional or more/less tolerant species FACULTATIVE : Sub-tolerant or cleaner preference species INTOLERANT : Clean water species
* Only one sample was collected from this station therefore the mean was not calculated

Table 2 6 - USGS/DC WRRC PROJECT
SUMMARY OF TOTALS FOR PLANKTON SPECIES APRIL, 1988 - JULY, 1990
------------------------------------------------------------------------------------------------------------------- NAME MONTH/YEAR TOTALS OF April - Sept.1988 - Sept. - Feb. – SPECIES Sept.1988 July,1989 Dec.1989 July,1990
------------------------------------------------------------------------------------------------------------------- Flagellata 493 993 269 3259 5014
Cyanophyta 389 441 973 1197 3000
Chlorophyta 631 727 441 2443 4242
Desmidiceae 242 648 1002 4539 6431
------------------------------------------------------------------------------------------------------------------- 1755 + 2809 + 2685 + 11438 = 18677
-------------------------------------------------------------------------------------------------------------------
81

Table 2 7 USGS/DC WRRC PROJECT
SUMMARY OF AVERAGE TOTALS FOR BENTHIC SPECIES APRIL, 1988 - JULY, 1990
----------------------------------------------------------------------------------------------------------------------- NAME MONTH/YEAR TOTALS SPECIES April- Sept.1988- Sept.- Feb.- (Total no. = 40) July,1988 July,l989 Dec.1989 July,1990 ------------------------------------------------------------------------------------------------------------------------
Annelida Aeolosoma Leidyi 3 22 - 25 Bristleworm/Dero 4 1 - 5 Earthworm - 1 1 Enchytraeids 10 30 30 13 83 Leech/Placobdella - 1 1 2
Tubifex/Sludgeworm 205 1014 211 386 1816 Cladoceran Alona 2 2 Bosmina - 3 - 3 6 Daphnia 4 2 1 7 14 Diaphanosoma 3 - - - 3 Polphemus 15 - - 5 20 Copepod Cyclops 42 619 39 61 761 Diaptomus 8 487 106 93 694 Gastrotrich 1 - 1 Hydra(pink) 1 - - 1 Insecta/Pterygota Cranefly Nymph 3 - - 3 Dragonfly Adult 1 - - 1 Dragonfly Nymph 1 - - 1 Larva Midge/Able. 13 3 1 17 Larva Midge/Chir. 11 1 1 13 Mayfly Nymph 1 - - 1 Sewagefly Nymph 3 1 2 6 Stonefly Nymph 1 - - 1 llusca Faucet Snail - 4 3 9 16 Orb Snail 1 19 - - 20 Pond Snail - 1 - - 1 Pouch Snail - 14 - - 14 Fingernail Clam - 1 - - 1 Peashell Clam 1 4 1 1 7 Valvata Snail - 1 - - 1 Nematoda
Ditylenchus Mycel. 8 38 7 13 66

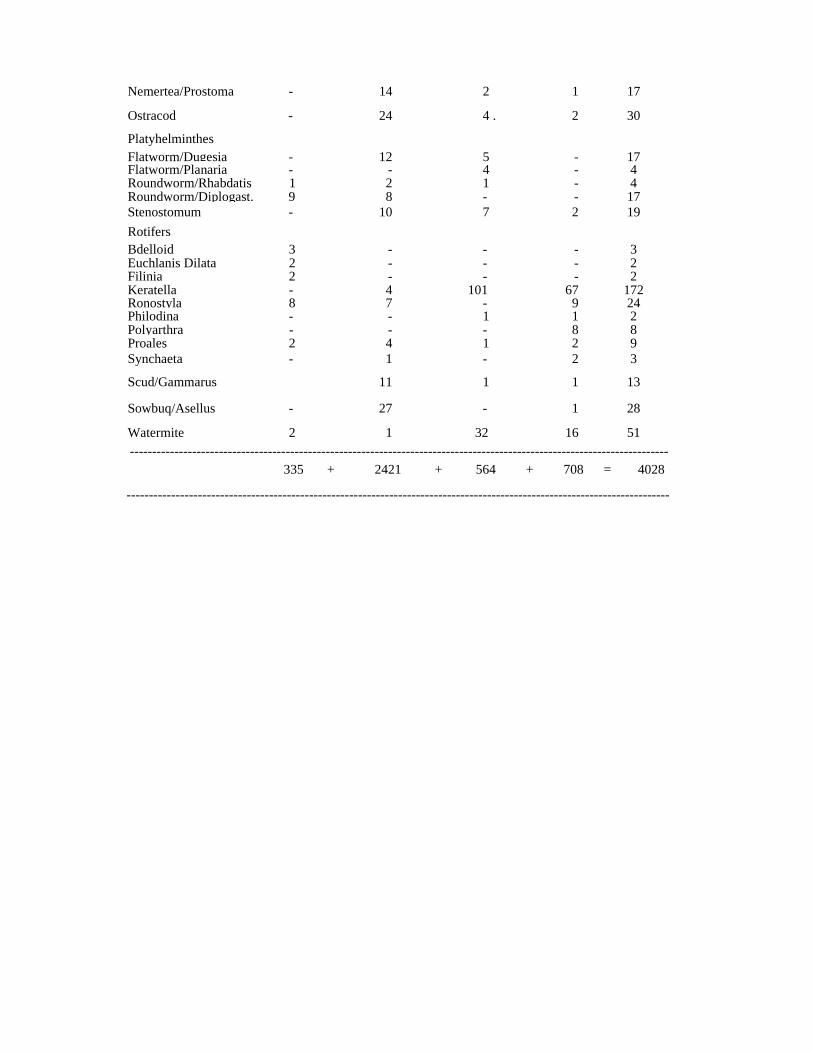
Nemertea/Prostoma - 14 2 1 17
Ostracod - 24 4 . 2 30
Platyhelminthes Flatworm/Dugesia - 12 5 - 17 Flatworm/Planaria - - 4 - 4 Roundworm/Rhabdatis 1 2 1 - 4 Roundworm/Diplogast. 9 8 - - 17 Stenostomum - 10 7 2 19 Rotifers Bdelloid 3 - - - 3 Euchlanis Dilata 2 - - - 2 Filinia 2 - - - 2 Keratella - 4 101 67 172 Ronostyla 8 7 - 9 24 Philodina - - 1 1 2 Polyarthra - - - 8 8 Proales 2 4 1 2 9 Synchaeta - 1 - 2 3
Scud/Gammarus 11 1 1 13
Sowbuq/Asellus - 27 - 1 28
Watermite 2 1 32 16 51 ------------------------------------------------------------------------------------------------------------------------- 335 + 2421 + 564 + 708 = 4028
--------------------------------------------------------------------------------------------------------------------------
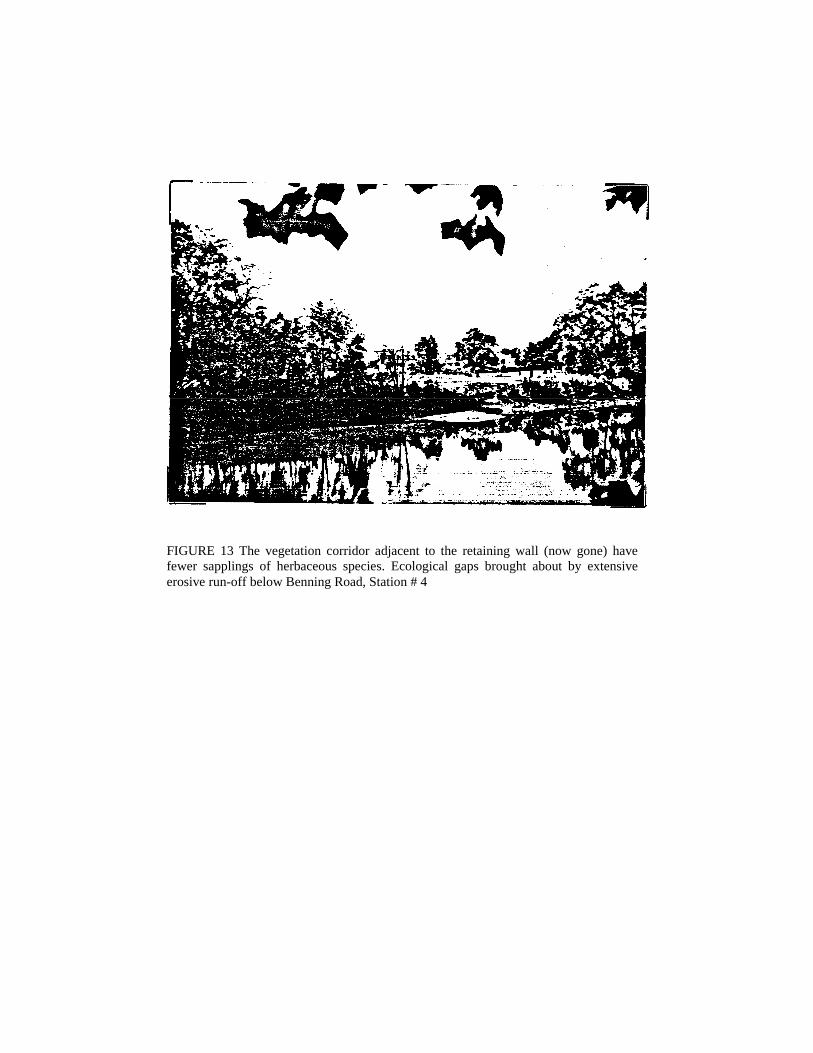
FIGURE 13 The vegetation corridor adjacent to the retaining wall (now gone) have fewer sapplings of herbaceous species. Ecological gaps brought about by extensive erosive run-off below Benning Road, Station # 4

FIGURE 14 Both corners of the east corridors have undergone Disturbance, mouth of Watts Branch at Anacostia River, Station #5
84

FIGURE 15 South side of station 8 (Watts Branch) north side of Hickey Run. Washedout trees. North corner is well protected from erosion.
85

FIGURE 16 A build-up of sediment is noticeable along Station .8 (Watts Branch)
86
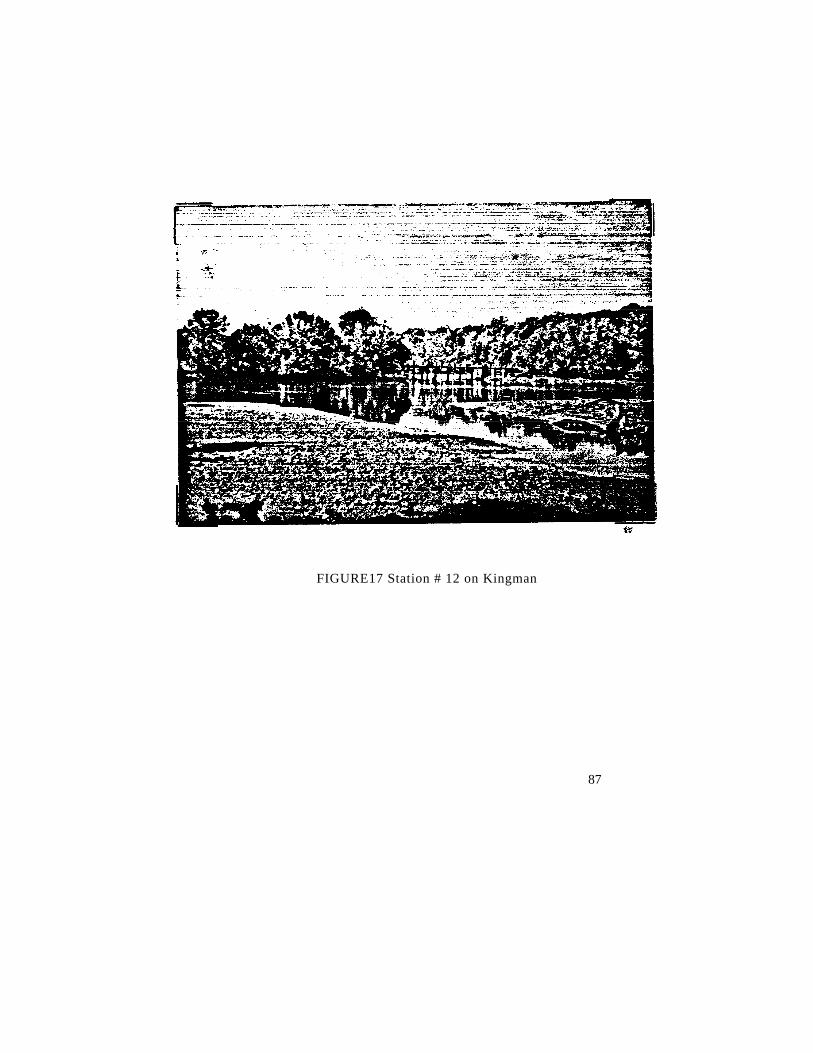
FIGURE17 Station # 12 on Kingman
87

FIGURE 18 Mature stand of trees (cottonwood) along the river bank on Kingman (Station#12).
88


FIGURE 20 Station # 14, behind the Department of Public Works, showing heavy accumulation of cement along the river bed.
90

FIGURE 21 Station # 16 (District Yatch Club),
showing destroyed sea wall
91

FIGURE 22 Station # 16 (District Yatch Club). The vegetation corridor has been reduced to a very low level by sedimentation and siltation. The vegetation corridor have coppic growth of vegetation.


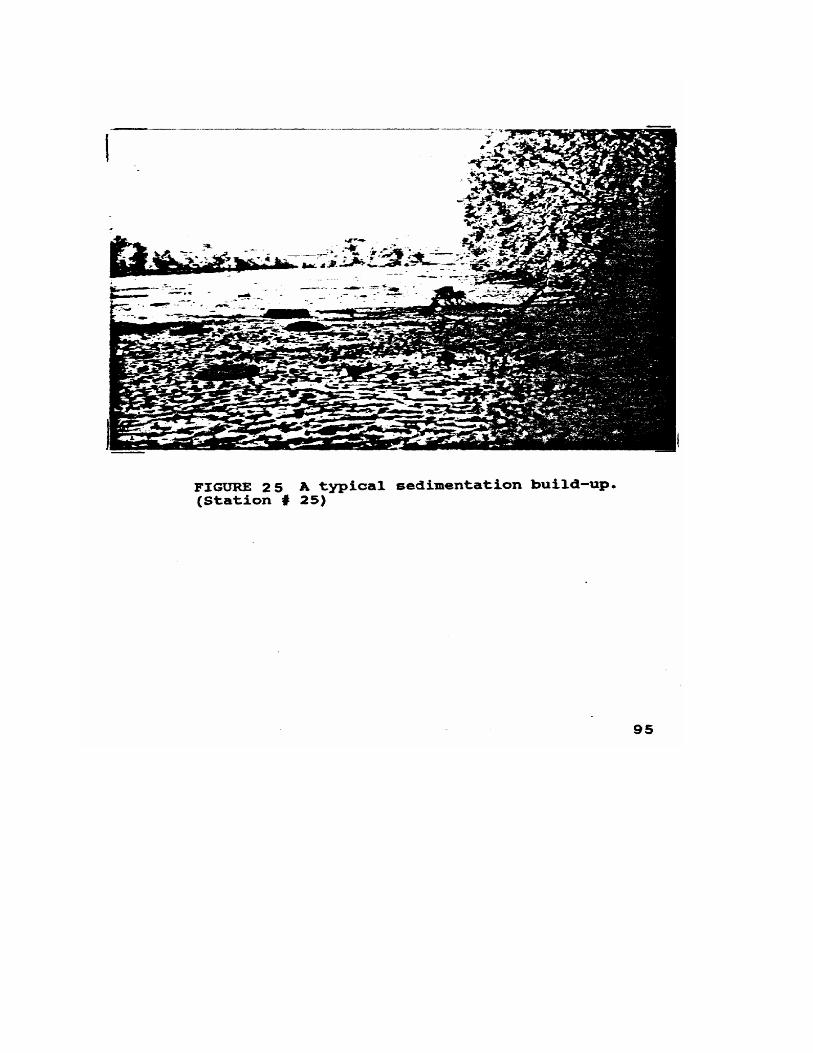

FIGURE 26 a-Damaged condition of the sea wall as seen during low tide. The sediment build up can be seen in the foreground. Station # 26, East side of the river on Anacostia Park and Sousa Bridge.

FIGURE 26b Station # 26, East side of the river on Sousa Bridge and Anacostia Park. Taken along the marginal area of the drainage, showing the existing trees are all uprooted.

FIGURE 27 A view of the drainage located on the east side of the river (Station # 26 A. Park and Sousa bridge, east side of the river)
