cyclic behavior of deep slender wide-flange steel beam...
TRANSCRIPT
CYCLIC BEHAVIOR OF DEEP SLENDER
WIDE-FLANGE STEEL BEAM-
UNDER COMBINED LATERAL
DRIFT AND AXIAL LOAD
A. Elkady1 and D. G. Lignos
2
ABSTRACT
During a seismic event, first-story
( drift demands coupled with -
selected
behavior of wide-flange beam-columns i
FEA simulations are used to evaluate: (a) the
flexural strength of the wide-flange beam-columns; (b) their -
a
-
web and flange slenderness ratios near the compactness limits of current seismic
design provisions. It is found that a deep slender wide flange column experiences more than two
times the axial shortening of a stocky wide flange column. -
wide-flange sections undergo
lateral loading current modeling recommendations
-
1PhD Candidate, Dept. of Civil Eng. and Applied Mechanics, McGill University, Montreal, Canada H3A 0C3
2Assistant Professor, Dept. of Civil Eng. and Applied Mechanics, McGill University, Montreal, Canada H3A 0C3
Elkady A, Lignos DG. Cyclic behavior of deep - -
axial load. Proceedings of the 10th
National Conference in Earthquake Engineering, Earthquake Engineering
Research Institute, Anchorage, AK, 2014.
Tenth U.S. National Conference on Earthquake Engineering Frontiers of Earthquake Engineering July 21-25, 2014 Anchorage, Alaska 10NCEE
- -
Drift And Axial Load
A. Elkady1
and D. G. Lignos2
ABSTRACT During a seismic event, first-story columns in steel Special
- In
this paper, - -
flexural strength of the wide-flange beam-column -
- sections with web and flange slenderness ratios
- capping plastic rota -
-
Introduction
Deep wide-flange columns are typically used as part of steel buildings with perimeter special
moment frames (SMFs) in North America. These members are often selected over stocky
sections due to their high inertia-to-weight ratio. Deep slender wide-flange sections are
characterized by: 1) depths larger than 406 mm (i.e., 16 inches); and 2) compact webs and
λhd)based
on [1]. The high slenderness ratios of the webs and flanges imply weak resistance to twisting and
out-of-plane buckling in addition to susceptibility to local buckling failure modes.
Experimental data on the cyclic behavior of deep slender wide-flange beam-columns is
not presently available in the literature. Limited beam-column tests were conducted on either
small and/or stocky sections [2-4]. These tests demonstrated that stocky sections (i.e., h/tw<30
and bf/2tf<6) perform well even at high compressive axial load ratios of P/Py =0.8, where Py is
the axial yield strength of a steel column (Py is the product of the cross section gross area Agross
1PhD Candidate, Dept. of Civil Eng. and Applied Mechanics, McGill University, Montreal, Canada H3A 0C3
2Assistant Professor, Dept. of Civil Eng. and Applied Mechanics, McGill University, Montreal, Canada H3A 0C3
Elkady A, Lignos DG. - b -
axial load. Proceedings of the 10th
National Conference in Earthquake Engineering, Earthquake Engineering
Research Institute, Anchorage, AK, 2014.
and the yield stress Fy). Experimental studies on deep slender wide-flange beams [5, 6] have
demonstrated that these sections deteriorate fast in flexural stiffness due to web and
flange local buckling under cyclic loading.
This paper investigates the cyclic behavior of a range of wide-flange beam-columns
through detailed finite element (FE) analysis. These beam-columns are subjected to combined
lateral drift and axial load ratios. A typical first-story interior column is considered for this
investigation. The FE model simulates the rotational flexibility expected at the column's top end.
The FE results are used to evaluate and assess the following issues: (a) the cyclic deterioration in
flexural strength of beam-columns; (b) the pre-capping plastic rotation of beam-columns; and (c)
the axial shortening of a steel column when it is subjected to cyclic loading.
Member Sizes and Loading Protocols
A set of 40 wide-flange steel sections is selected for the FE study. The selected sections
represent a wide spectrum of web and flange slenderness ratios. The range of sections covers
those typically used as first-story columns of SMFs in low- and mid-rise buildings in North
America. The selected sections along with some of their main geometric properties are
summarized in Table 1. The web and flange slenderness ratios of 35 sections comply with the
compactness limits for highly ductile members (λhd) as specified by [1] even at high levels of
axial load ratio (i.e., P/Py=0.5). The remaining 5 sections (marked with asterisk), are compact
sections with web and flange slenderness ratios that comply with the compactness limits
specified for moderately ductile members (λmd). It should be noted that for highly ductile
members, the compactness limits for the flange slenderness is 7 and the compactness limit for the
web slenderness is 43, at P/Py=0.5.
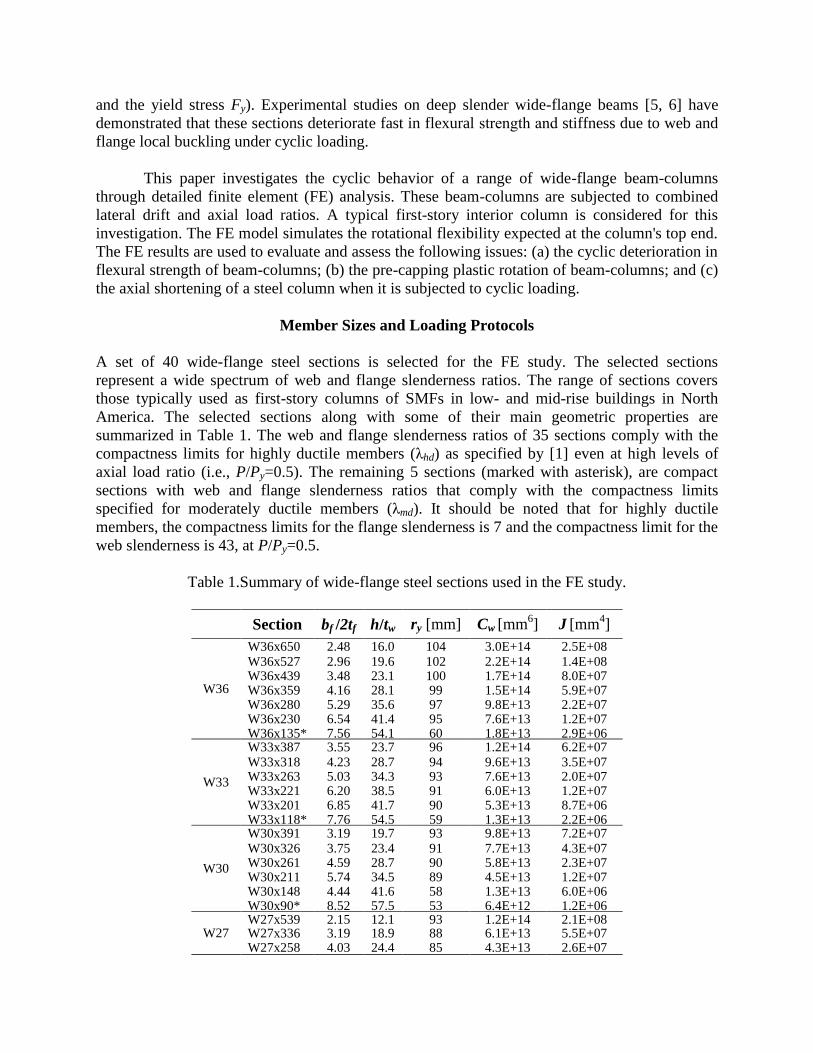
Table 1.Summary of wide-flange steel sections used in the FE study.
Section bf /2tf h/tw ry [mm] Cw [mm
6] J [mm
4]
W36
W36x650 2.48 16.0 104 3.0E+14 2.5E+08 W36x527 2.96 19.6 102 2.2E+14 1.4E+08 W36x439 3.48 23.1 100 1.7E+14 8.0E+07 W36x359 4.16 28.1 99 1.5E+14 5.9E+07 W36x280 5.29 35.6 97 9.8E+13 2.2E+07 W36x230 6.54 41.4 95 7.6E+13 1.2E+07 W36x135* 7.56 54.1 60 1.8E+13 2.9E+06
W33
W33x387 3.55 23.7 96 1.2E+14 6.2E+07 W33x318 4.23 28.7 94 9.6E+13 3.5E+07 W33x263 5.03 34.3 93 7.6E+13 2.0E+07 W33x221 6.20 38.5 91 6.0E+13 1.2E+07 W33x201 6.85 41.7 90 5.3E+13 8.7E+06 W33x118* 7.76 54.5 59 1.3E+13 2.2E+06
W30
W30x391 3.19 19.7 93 9.8E+13 7.2E+07 W30x326 3.75 23.4 91 7.7E+13 4.3E+07 W30x261 4.59 28.7 90 5.8E+13 2.3E+07 W30x211 5.74 34.5 89 4.5E+13 1.2E+07 W30x148 4.44 41.6 58 1.3E+13 6.0E+06 W30x90* 8.52 57.5 53 6.4E+12 1.2E+06
W27 W27x539 2.15 12.1 93 1.2E+14 2.1E+08 W27x336 3.19 18.9 88 6.1E+13 5.5E+07 W27x258 4.03 24.4 85 4.3E+13 2.6E+07
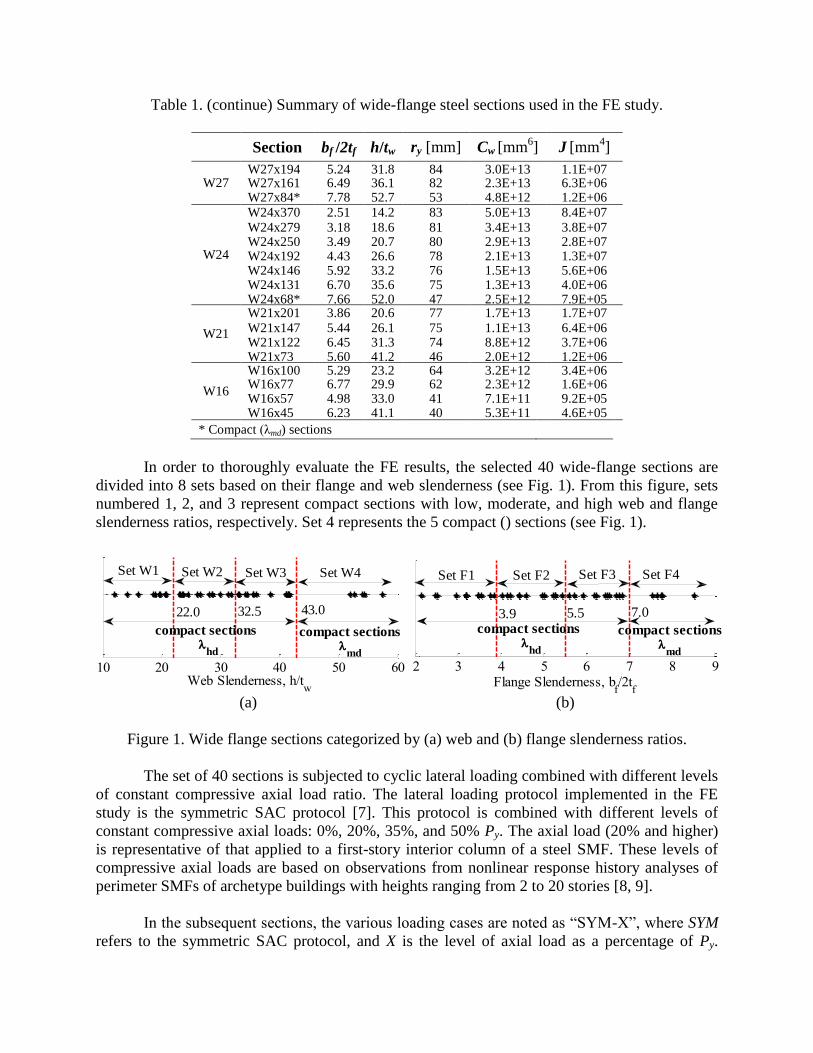
Table 1. (continue) Summary of wide-flange steel sections used in the FE study.
Section bf /2tf h/tw ry [mm] Cw [mm
6] J [mm
4]
W27 W27x194 5.24 31.8 84 3.0E+13 1.1E+07 W27x161 6.49 36.1 82 2.3E+13 6.3E+06 W27x84* 7.78 52.7 53 4.8E+12 1.2E+06
W24
W24x370 2.51 14.2 83 5.0E+13 8.4E+07 W24x279 3.18 18.6 81 3.4E+13 3.8E+07 W24x250 3.49 20.7 80 2.9E+13 2.8E+07 W24x192 4.43 26.6 78 2.1E+13 1.3E+07 W24x146 5.92 33.2 76 1.5E+13 5.6E+06 W24x131 6.70 35.6 75 1.3E+13 4.0E+06 W24x68* 7.66 52.0 47 2.5E+12 7.9E+05
W21
W21x201 3.86 20.6 77 1.7E+13 1.7E+07 W21x147 5.44 26.1 75 1.1E+13 6.4E+06 W21x122 6.45 31.3 74 8.8E+12 3.7E+06 W21x73 5.60 41.2 46 2.0E+12 1.2E+06
W16
W16x100 5.29 23.2 64 3.2E+12 3.4E+06 W16x77 6.77 29.9 62 2.3E+12 1.6E+06 W16x57 4.98 33.0 41 7.1E+11 9.2E+05 W16x45 6.23 41.1 40 5.3E+11 4.6E+05
* Compact λmd) sections
In order to thoroughly evaluate the FE results, the selected 40 wide-flange sections are
divided into 8 sets based on their flange and web slenderness (see Fig. 1). From this figure, sets
numbered 1, 2, and 3 represent compact sections with low, moderate, and high web and flange
slenderness ratios, respectively. Set 4 represents the 5 compact () sections (see Fig. 1).
(a) (b)
Figure 1. Wide flange sections categorized by (a) web and (b) flange slenderness ratios.
The set of 40 sections is subjected to cyclic lateral loading combined with different levels
of constant compressive axial load ratio. The lateral loading protocol implemented in the FE
study is the symmetric SAC protocol [7]. This protocol is combined with different levels of
constant compressive axial loads: 0%, 20%, 35%, and 50% Py. The axial load (20% and higher)
is representative of that applied to a first-story interior column of a steel SMF. These levels of
compressive axial loads are based on observations from nonlinear response history analyses of
perimeter SMFs of archetype buildings with heights ranging from 2 to 20 stories [8, 9].
q “ Y -X” SYM
refers to the symmetric SAC protocol, and X is the level of axial load as a percentage of Py.
10 20 30 40 50 60Web Slenderness, h/t
w
Set W2 Set W3 Set W4Set W1
43.032.522.0
compact sections
hd
compact sections
md
2 3 4 5 6 7 8 9Flange Slenderness, b
f/2t
f
Set F4Set F2 Set F3Set F1
3.9 7.05.5
compact sections
md
compact sections
hd
Additionally, a monotonic lateral loading case with no axial load, MON-00, is also conducted.
Finite Element Modeling
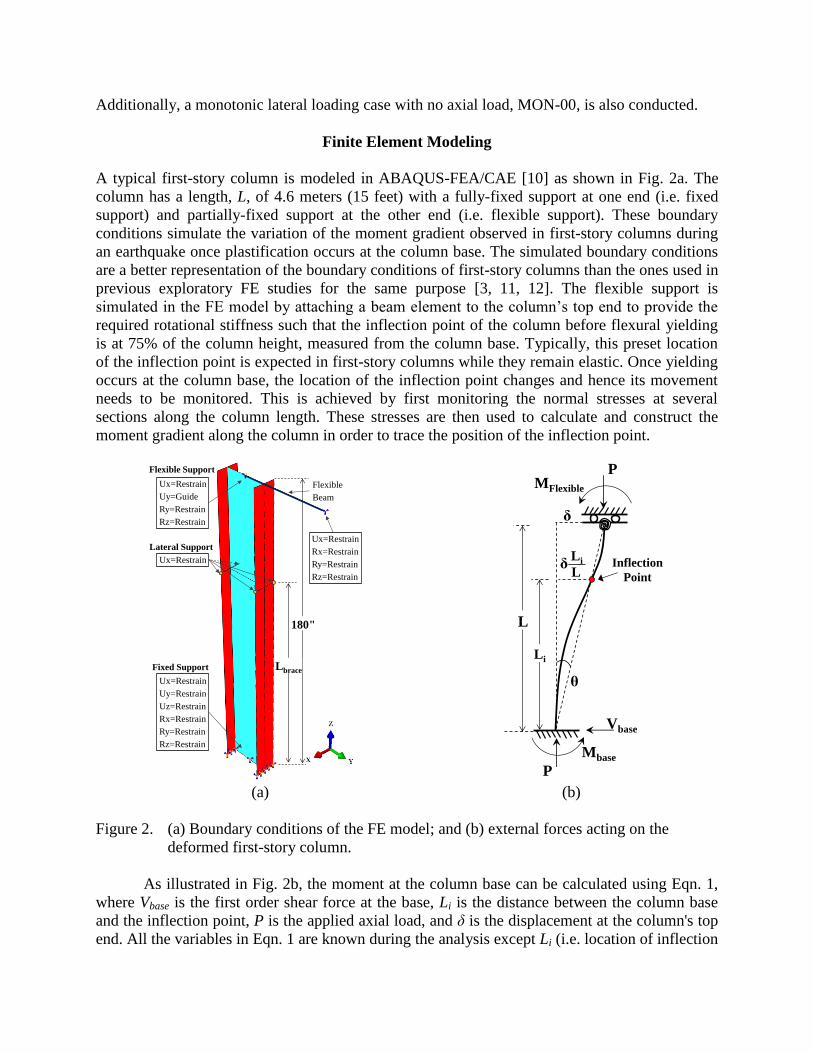
A typical first-story column is modeled ABAQUS-FEA/CAE [10] as shown in Fig. 2a. The
column has a length, L, of 4.6 meters (15 feet) with a fully-fixed support at one end (i.e. fixed
support) and partially-fixed support at the other end (i.e. flexible support). These boundary
conditions simulate the variation of the moment gradient observed in first-story columns during
an earthquake once plastification occurs at the column base. The simulated boundary conditions
are a better representation of the boundary conditions of first-story columns than the ones used in
previous exploratory FE studies for the same purpose [3, 11, 12]. The flexible support is
’
required rotational stiffness such that the inflection point of the column before flexural yielding
is at 75% of the column height, measured from the column base. Typically, this preset location
of the inflection point is expected in first-story columns while they remain elastic. Once yielding
occurs at the column base, the location of the inflection point changes and hence its movement
needs to be monitored. This is achieved by first monitoring the normal stresses at several
sections along the column length. These stresses are then used to calculate and construct the
moment gradient along the column in order to trace the position of the inflection point.
(a) (b)
Figure 2. (a) Boundary conditions of the FE model; and (b) external forces acting on the
deformed first-story column.
As illustrated in Fig. 2b, the moment at the column base can be calculated using Eqn. 1,
where Vbase is the first order shear force at the base, Li is the distance between the column base
and the inflection point, P is the applied axial load, and δ is the displacement at the column's top
end. All the variables in Eqn. 1 are known during the analysis except Li (i.e. location of inflection
Ux=Restrain
Uy=Restrain
Uz=Restrain
Rx=Restrain
Ry=Restrain
Rz=Restrain
Ux=Restrain
Rx=Restrain
Ry=Restrain
Rz=Restrain
Flexible
Beam
Fixed Support
Flexible Support
180"
Lbrace
Ux=Restrain
Uy=Guide
Ry=Restrain
Rz=Restrain
Ux=Restrain
Lateral Support
Vbase
P
Mbase
PMFlexible
L
Li
δ
Inflection
Pointδ
Li
L
θ
point), which is calculated as discussed in the previous paragraph.
base base i iM V L P L / L (1)
The column is laterally supported at a distance Lbrace measured from the column base.
The length Lbrace is taken as the minimum of Lb,HD and Lp as given by Eqns. 2 and 3, where Lb,HD
is the minimum length between points that are braced against lateral displacement for h
members [1] and Lp is the maximum laterally unbraced length required to avoid lateral
torsional buckling for the yielding limit state in steel beams [13]. This is done in order to
investigate the effect of plastic hinging on the overall column performance without considering
the possibility of lateral torsional buckling throughout the member. The latter is currently
investigated by a separate FE study. In all cases, the length Lbrace was controlled by Lp.
0 086b,HD y yL . r E / F (2)
1 76p y yL . r E / F (3)
The column is meshed using 1"x1" 4- q “ 4 ”
global geometric imperfections are introduced to the model by scaling and superimposing the
’ G
with ASTM [14] limits. The approach to introduce such imperfections has been discussed in
detail in a companion paper [12]. Residual stresses was shown to be insignificant based on the
same study [12]; hence they are not considered as part of the FE model discussed herein.
The nonlinear cyclic behavior of the column is simulated using the nonlinear
isotropic/kinematic hardening material model in ABAQUS. A modulus of elasticity E=208000
MPa (30165 ksi) and an expected yield stress of Fy=383 MPa (55.5 ksi) is considered to
represent typical ASTM A992 Gr.50 steel (Fy=345MPa). The additional four parameters, used to
define the cyclic hardening properties of the material model, are as follows: C=6895 MPa (1000
ksi), γ=25, Q∞=172 MPa (25 ksi), and b=2. These
tests conducted by Krawinkler et al. [15] and MacRae et al. [2]. These parameters are
independent of the loading history and axial load demand that a steel column is subjected to [12].
The aforementioned FE modelling approach has been validated against past experimental data
- tests [2] as discussed in [12].
Results and Discussion
This section summarizes the results based on the FE analysis of the 40 sections shown in Table
1. Emphasis is placed on the following issues: (a) the cyclic deterioration in flexural strength of
the steel columns; (b) the pre-capping plastic rotation of steel beam-columns; and (c) the column
axial shortening.
Cyclic Deterioration in Flexural Strength
Fig. 3 shows the simulated peak strength response at the column base (normalized by the plastic

strength, Mp) measured at a range of chord rotations, θ: 1, 2, 3, 4, and 5% rads. From this figure,
it is evident that the applied axial load and the section cross sectional slenderness affect both the
level of cyclic strain hardening and the rate of cyclic deterioration in flexural strength of a steel
column. Fig. 3a shows that, in the absence of axial load, cyclic strain hardening (expressed by
the ratio of the maximum moment to plastic moment, Mmax/Mp) can reach a factor of 2.0 for
highly compact sections (i.e. Sets W1 and F1). This is primarily attributed to: 1) the large
number of small inelastic cycles within the symmetric SAC protocol; and 2) the absence of axial
load. Generally, the level of cyclic strain hardening decreases when the applied axial load
increases. The same observation holds true when the web and flange slenderness ratios increase
(see Table 2).
In the absence of axial load (see Fig. 3a), all the sections are able to maintain their plastic
bending strength at 4% chord rotation. When the applied axial load increases (see Figs. 4b to 4d),
the rate of cyclic deterioration in flexural strength of steel columns increases. For an applied
axial load larger than 20% Py, seismically compact sections, with high web and flange
slenderness ratios (i.e., 32.5<h/tw<43 and 5.5<bf/2tf<7), approach zero flexural strength before
reaching a 4% chord rotation. At 50% Py (see Fig. 4d), almost all the cross sections reach a zero
flexural strength before reaching a 4% chord rotation.
(a) SYM-00 (b) SYM-20
(c) SYM-35 (d) SYM-50
Figure 3. Normalized peak strength response of steel columns at different chord rotations.
0 0.02 0.04 0.060
0.5
1
1.5
2
2.5
Chord Rotation, [rad]
M/M
p
Set W1
Set W2
Set W3
Set W4
0 0.02 0.04 0.060
0.5
1
1.5
2
2.5
Chord Rotation, [rad]
M/M
p
Set W1
Set W2
Set W3
Set W4
0 0.02 0.04 0.060
0.5
1
1.5
2
2.5
Chord Rotation, [rad]
M/M
p
Set W1
Set W2
Set W3
Set W4
0 0.02 0.04 0.060
0.5
1
1.5
2
2.5
Chord Rotation, [rad]
M/M
p
Set W1
Set W2
Set W3
Set W4
Another way to assess the cyclic performance of the steel beam-columns, analyzed as
part of this paper, is to examine if they can sustain 80% of their full plastic flexural strength at
4% chord rotation. This assessment is consistent with the way that fully restrained beam-to-
column connections are evaluated in terms of flexural resistance according to [1]. The average
values of the chord rotation at 80% Mp for each section set are summarized in Table 2. This table
indicates that deep slender wide-flange beam-columns close to the compact limits for highly
ductile members as per [1] (i.e. Sets F3 and W3) reached 80% of their plastic bending moment,
Mp, at chord rotations less than 4% rads even at low axial load ratios (P/Py=0.2).
Table 2. Summary of average chord rotations at 80% Mp and average levels of cyclic strain
hardening, Mmax/Mp.
Chord Rotation at
80% Mp [% rad]
Cyclic Strain
Hardening, Mmax/Mp
P/Py [%] 00 20 35 50 00 20 35 50
Sets based on
flange slenderness
F1 bf/2tf<3.9 >5 >5 4.2 2.6 1.9 1.6 1.4 1.2
F2 3.9<bf/2tf<5.5 >5 4.5 2.5 1.1 1.5 1.2 1 0.8
F3 5.5<bf/2tf<7 >5 3.3 1.3 <1 1.4 1.1 0.9 0.6
F4 bf/2tf >7 >5 1.5 <1 <1 1.2 0.9 0.6 NA
Sets based on web
slenderness
W1 h/tw<22 >5 >5 4.4 3.1 1.9 1.6 1.4 1.2
W2 22<h/tw<32.5 >5 >5 3.2 1.4 1.6 1.3 1.1 0.9
W3 32.5<h/tw<43 >5 3.3 1.3 <1 1.4 1.1 0.9 0.6
W4 h/tw >43 >5 1.5 <1 <1 1.2 0.9 0.6 NA
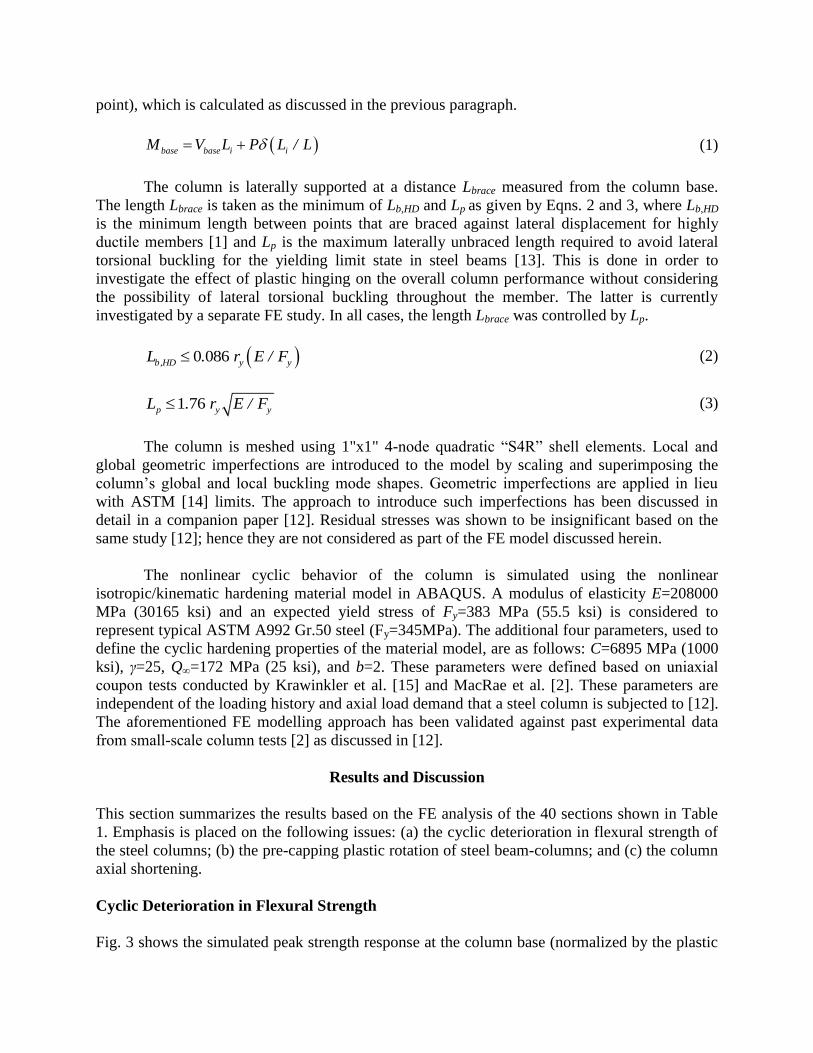
Pre-Capping Plastic Rotation
The pre-capping plastic rotation is commonly used by structural engineers to model structural
components as part of steel frame buildings in order to conduct a nonlinear static and/or dynamic
analysis to evaluate their seismic performance. The PEER/ATC [16] modeling recommendations
for steel columns (modeling option 1) use the pre-capping plastic rotation θp, in addition to other
strength and deformation parameters, to construct a monotonic "backbone" curve that bounds the
behavior of a steel component as shown in Fig. 4a. For the PEER/ATC [16] modeling option 1,
θp is computed based on the multivariate regression equations developed by [6]. These equations
were obtained from extensive calibrations in which the parameters of the backbone curve were
matched to cyclic experimental data from steel beams with 20<h/tw<55 and 4<bf/2tf<8. The pre-
capping plastic rotation calculated using PEER/ATC [16] “θp, ATC-Option1”
compared to the θp, values as predicted by the FEA. For both the cyclic and monotonic loading
cases, θp is defined as the difference between the capping rotation (at maximum flexural strength)
and the yield rotation (at plastic flexural strength) as shown in Figs. 4b and 4c. It should be noted
that in the case of cyclic loading, the capping rotation is deduced based on the cyclic envelope
curve as shown in Fig. 4b.
(a) (b) (c)
Figure 4. Definition of the pre-capping plastic rotation; (a) PEER/ATC [16], modeling option
1; (b) FEA cyclic loading; (c) FEA monotonic loading.
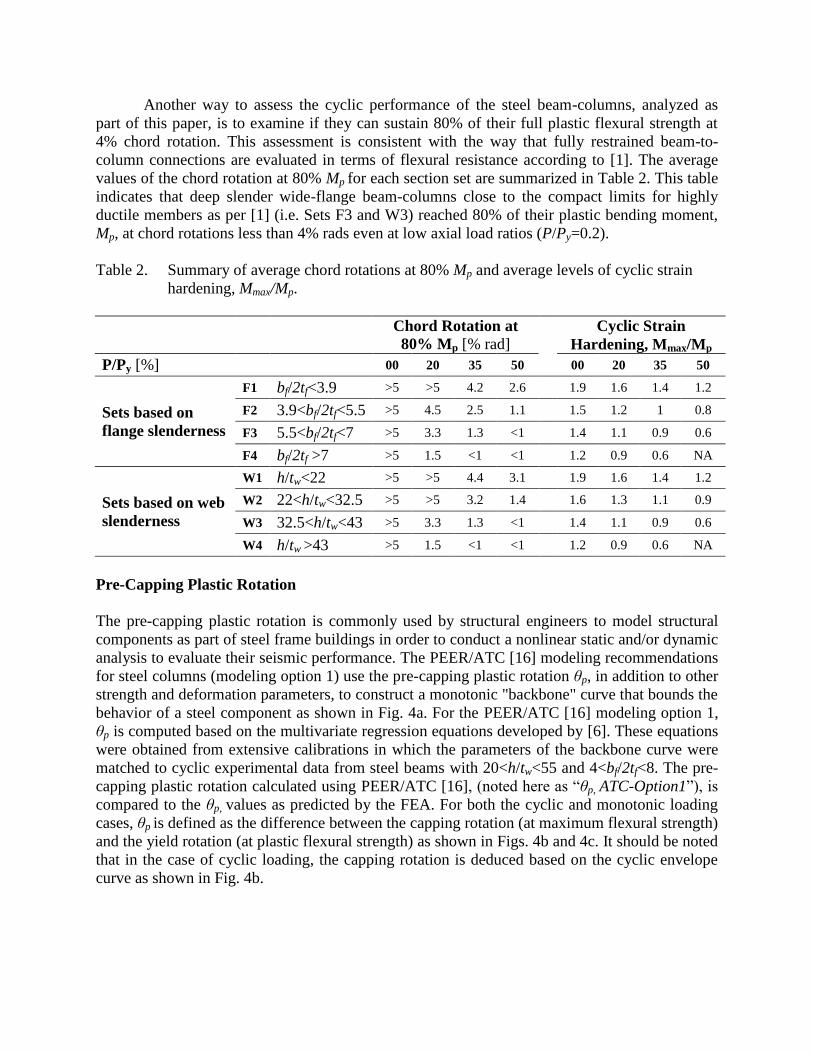
Figs. 5a and 5b show the θp, ATC-Option1 versus the pre-capping plastic rotation as
predicted by the FEA when the column is subjected to the loading cases MON-00 (noted as θp,
MON-00) and SYM-00 (noted as θp, SYM-00), respectively. For monotonic loading, the θp, ATC-
Option1 values match the θp, MON-00 values for low compactness sections (i.e., 32.5<h/tw<43
and 5.5<bf/2tf<7). However, for highly and moderately compact sections (i.e., h/tw<32.5 and
bf/2tf<5.5), the values of θp, ATC-Option1 are lower than the corresponding ones from θp, MON-
00. This is primarily attributed to the fact that θp, ATC-Option1 is calculated from equations that
are based on calibrations against cyclic and not monotonic data. Normally, the capping rotation
moves towards the yield rotation in such case compared to the monotonic one [6, 16].
In the case of cyclic loading, values of θp, ATC-Option1, by definition, are expected to be
larger than θp, SYM-00 values. However, this is not the case for set W1 as shown in Fig. 5b. The
same observation holds true for set F1. This is attributed to the cyclic strain hardening observed
in highly compact sections due to the delayed formation of flange and web local buckling. Also,
sets W1 and F1, represent sections with h/tw<22 and bf/2tf<3.9; this range of web and flange
slenderness is outside the valid range of the Lignos and Krawinkler [6] regression equations.
(a) (b)
Figure 5. Plastic rotation as calculated per PEER/ATC [16] versus the
plastic rotation predicted by the FE analysis: (a) MON-00; and (b) SYM-00.
-0.05 0 0.05Chord Rotation, [rad]
Mom
ent
[kN
.m]
p
Cyclic data
Mono. Backbone
-0.05 0 0.05
-5
0
5
Chord Rotation, [rad]M
om
ent
[kN
.m]
p
Cyclic data
Envelope curve
Mmax
0.05 0.1 0.150
1
2
3
4
Chord Rotation, [rad]
Mo
men
t [k
N.m
]
Mp
Mmax
p
0 0.05 0.1 0.15 0.20
0.05
0.1
0.15
0.2
p MON-00 [rad]
p A
TC
-Op
tio
n1
[ra
d]
Set W1
Set W2
Set W3
Set W4
0 0.05 0.10
0.02
0.04
0.06
0.08
0.1
p SYM-00 [rad]
p A
TC
-Op
tio
n1
[ra
d]
Set W1
Set W2
Set W3
Set W4

Axial Shortening
Steel columns subjected to inelastic lateral cyclic drift ratios experience axial shortening
primarily due to web local buckling. The level of axial shortening increases in the presence of
high compressive axial loads. The issue of axial shortening has been reported by MacRae et al.
[2] after conducting tests on 1.10m tall cantilever columns with 250UC73 sections (equivalent to
W10x49). Based on this data, MacRae et al. [17] developed empirical equations to predict the
column axial shortening as a function of the applied axial load level, P/Py and the cumulative
inelastic drift, ΣθH.
Fig. 6 shows the axial shortening ∆a, as a percentage of the column length, versus the
cumulative inelastic drift ΣθH for all the column sections that were analyzed as part of this paper.
The axial shortening, ∆a, is deduced by monitoring the axial displacement of the column's top
end. At any loading stage, the cumulative inelastic drift, ΣθH, is defined as the sum of absolute
peak drift values for all cycles following the yield drift (i.e. inelastic cycles). It should be noted
that at the second 4% drift cycle of the SYM protocol, the average value of the cumulative
inelastic drift, for all sections, is 0.7. This value for cumulative inelastic drift, ΣθH=0.7, is used
next as reference value for assessing the column axial shortening.
(a) SYM-00 (b) SYM-20
(c) SYM-35 (d) SYM-50
Figure 6. Axial shortening versus cumulative inelastic drift ratio.
0 0.5 1 1.5 2 2.50
5
10
15
20
25
Cummulative Inelastic Drift [rad]
Axia
l D
ispla
cmen
t [%
]
Set W1
Set W2
Set W3
Set W4
0 0.5 1 1.5 2 2.50
5
10
15
20
25
Cummulative Inelastic Drift [rad]
Axia
l D
ispla
cmen
t [%
]
Set W1
Set W2
Set W3
Set W4
0 0.5 1 1.5 2 2.50
5
10
15
20
25
Cummulative Inelastic Drift [rad]
Axia
l D
ispla
cmen
t [%
]
Set W1
Set W2
Set W3
Set W4
0 0.5 1 1.5 2 2.50
5
10
15
20
25
Cummulative Inelastic Drift [rad]
Axia
l D
ispla
cmen
t [%
]
Set W1
Set W2
Set W3
Set W4

Fig. 6a shows that, at 0% Py and ΣθH=0.7, the level of axial shortening is below 2% of the
total column length for all the seismically compact sections. This is attributed to the occurrence
of web/flange local buckling at chord rotations larger than 4% when subjected to zero axial load
(i.e., SYM-00). When an axial load of 20% Py is applied, a significant increase in column axial
shortening is observed (see Fig. 6b). At 20% Py and ΣθH=0.7, highly compact sections (i.e.,
h/tw<22 and bf/2tf<3.9) experience an average ∆a equal to 3% compared to 7% for low
compactness sections (i.e., 32.5<h/tw<43 and 5.5<bf/2tf<7). The column axial shortening
increases while the applied column axial load increases (see Figs. 6c and 6d). However, for axial
load ratios P/Py >35%, a further increase in axial load level has a minor effect on the column
axial shortening. This agrees with MacRae et al. [17] findings that axial shortening does not
increase after a critical axial load level.
Summary and Conclusions
The cyclic behavior of a range of wide-flange steel beam-columns was investigated
through detailed finite element (FE) analysis. The beam-columns are subjected to the SAC
symmetric lateral loading protocol, as well as, different levels of constant compressive axial
load. The main findings of the FE analysis are summarized as follows:
At 0% Py axial load, wide-flange sections with h/tw<22 and bf/2tf<3.9 experience high
levels of cyclic strain hardening. The maximum moment Mmax reaches about 1.9Mp
compared to 1.4Mp for sections with 32.5<h/tw<43 and 5.5<bf/2tf<7.
At P/Py = 20%, slender wide-flange beam-columns with 32.5<h/tw<43 and 5.5<bf/2tf<7
reach 80% of their plastic strength at chord rotations less than 4% rads.
Except for the load case SYM-50, highly compact wide-flange sections with h/tw<22 and
bf/2tf<3.9 are able to maintain 80% of their plastic bending resistance at chord rotations
larger than 4% rads.
The pre-capping plastic rotation based on PEER/ATC [16], modeling option 1, is shown
to be adequate for predicting the monotonic behavior of sections with 32.5<h/tw<43 and
5.5<bf/2tf<7. However, it is underestimated for sections with h/tw<32.5 and bf/2tf<5.5.
The pre-capping rotation based on PEER/ATC [16], modeling option 1, is underestimated
for sections with h/tw<22 and bf/2tf<3.9 undergoing the SYM-00 loading case.
At 20% Py and ΣθH=0.7 (corresponding to the second 4% drift cycle), highly compact
wide-flange sections with h/tw<22 and bf/2tf<3.9, experience an average axial shortening
∆a of 3% of the column length compared to 7% for slender sections with 32.5<h/tw<43
and 5.5<bf/2tf<7. At axial load levels P/Py>35%, the increase in axial shortening is minor.
It should be noted that the results presented here are dependent on the applied loading
protocols and the selected beam-column boundary conditions. The authors currently evaluate the
behavior of the same set of beam-columns for other lateral and axial loading protocols. The
findings from the extensive analytical study summarized herein will also be complemented by a
series of full-scale experiments on deep wide-flange beam-columns.
Acknowledgments
Council of Cana G
expressed i
References 1. AISC. Seismic provisions for structural steel buildings, -
IL, 2010.
2. MacRae, GA, Carr, AJ, and Walpole, WR. The seismic response of steel frames. Report No. 90-6, Department
of Civil Engineering, University of Canterbury, New Zealand, 1990.
3. Newell, JD and Uang, CM. Cyclic behavior of steel columns with combined high axial load and drift demand.
Report No. SSRP-06/22, Department of Structural Engineering, University of California, San Diego, 2006.
4. Popov, EP, Bertero, VV, and Chandramouli, S, Hysteretic behavior of steel columns. 1975: Earthquake
Engineering Research Center, University of California, 1975.
5. FEMA. State of the art report on connection performance. Report FEMA-355D, Federal Emergency
Management Agency, Washington, DC, 2000.
6. Lignos, DG and Krawinkler, H. Deterioration modeling of steel components in support of collapse prediction of
steel moment frames under earthquake loading. Journal of Structural Engineering 2011; 137(11): 1291-1302.
7. Clark, P, Frank, K, Krawinkler, H, and Shaw, R. Protocol for fabrication, inspection, testing, and documentation
of beam-column connection tests and other experimental specimens. Report No. SAC/BD-97, SAC Joint
Venture, 1997.
8. NIST. Evaluation of the FEMA P695 methadology for quantification of building seismic performance factors.
NIST GCR 10-917-8, NEHRP consultants Joint Venture, 2010.
9. G
resisting frames designed in seismic regions. Proc. of ASCE Structures Congress. PA, USA. 2013.
10. ABAQUS-FEA/CAE. 2011, Dassault Systemes Simulia Corp., RI, USA. © Dassault Systèmes, 2010.
11. MacRae, GA, Urmson, CR, Walpole, WR, Moss, P, Hyde, K, and Clifton, C. Axial shortening of steel columns
in buildings subjected to earthquakes. Bulletin of New Zealand Society for Earthquake Eng. 2009; 42(4): 275.
12. Elkady, A and Lignos, DG. Dynamic stability of deep slender steel columns as part of special mrfs designed in
seismic regions: Finite element modeling. Proc. of First International Conference on Performance-Based and
Life-Cycle Structural Engineering (PLSE). Hong Kong, China. 2012.
13. , - . Ameri
IL, 2010.
14. ASTM. Standard specification for general requirements for rolled structural steel bars, plates, shapes, and sheet
piling, American Society for Testing and Materials, West Conshohocken, PA: 2003.
15. Krawinkler, H, Zohrei, M, Lashkari-Irvani, B, Cofie, NG, and Hadidi-Tamjed, H. Recommendations for
experimental studies on the seismic behavior of steel components and materials. Report No. 61, The John A.
Blume Earthquake Engineering Center, Stanford University, California, USA, 1983.
16. PEER/ATC. Modeling and acceptance criteria for seismic design and analysis of tall buildings, PEER/ATC 72-
1. Prepared for Pacific Earthquake Engineering Research Center (PEER) by Applied Technology Council
(ATC): Redwood City, CA, 2010.
17. MacRae, GA, Hyde, K, Walpole, WR, Moss, PJ, Hyland, C, Clifton, GC, and Mago, N. Column axial
shortening effects in steel frames. Proc. of New Zealand Society for Earthquake Eng. Conference. Napier, New
Zealand. 2006.