cwe journal volume 7 number 1
DESCRIPTION
Current World Environment Journal, Volume 7 Number 1TRANSCRIPT
INTRODUCTION
Motor vehicles emit nitrogen oxides (NOx),carbon monoxide (CO), volatile organic compounds(VOC) and particulate matter (PM), which constitutea major source of air pollution in large cities. Toachieve sustainable development and asustainable transport we need a tool to evaluateprojects related to transportation, with goodaccuracy and in numerical form. With increasingtraffic and the increases in pollutants, Human willbe in risk from environmental issues that impacts ofthat on physical health, psychological and economiclosses are evident. Heavy traffic in large cities bythousands of car passage has increased the airpollution. Today, air pollution is one of the mainhuman issues and become more important eachday. In Iran, according to land use, topography, trafficbehavior, and traffic it is a very important problem.
To identify and fix this problem in urbanstreets, factors such as computation of pollutantslevel and their compatibility with standards areimportant and finally set up the executive works toreduce air pollution, are effective steps is to resolvethis problem. To achieve environmental goals, anddetermine the environmental issues for planners,
Current World Environment Vol. 7(1), 01-06 (2012)
Air Pollution Estimation fromTraffic Flows in Tehran Highways
KEIVAN SAEB¹, MARYAM MALEKZADEH¹ and SAEED KARDAR²
¹Department of Environment, Tonekabon Branch, Islamic Azad University, Tonekabon (Iran).²Department of Environment, Damavand Branch, Islamic Azad University, Damavand (Iran).
(Received: January 01, 2012; Accepted: February 19, 2012)
ABSTRACT
Urban areas confront with increases in air pollution because of increasing urbanization,expanding the use of vehicles and development of economic activities. In this research carbonmonoxide concentration as a pollutant analyzed and modeled within highways in Tehran. In thisregards factors affecting the concentration of atmospheric pollutants analyzed on the basis ofgeometric, atmospheric and traffic data at five stations in Tehran and finally models runs based onexisting methods. The model predictions results are match well with field data.
Key words: Air Pollution, Traffic Flows, Tehran Highways.
environmental impact studies in traffic managementplans and in the road design is considered and thepurpose is to determine the transportation requestin condition that the negative environmental effectsof that not be more than standards. Analysis ofcarbon monoxide pollution levels in places wheretraffic is the main source of air pollution is selectedas the main target of research.
It must be mentioned that the issue of airquality is essential in urban design and planningurban transportation. Although these analysis is notonly limits to predict concentrations of pollutantscaused by traffic in urban streets but it is so importantin these areas because this problem is moresignificant in urban streets.
In summary, in this study the effectivefactors on concentration of pollutants in theatmosphere surveyed in the vicinity of highways ofTehran, near the surface and sidewalk based onfield data in 32 points on 5 stations. Calculationshave been done in short-term (one hour) and usualtraffic conditions in these areas.
The final purpose of the research is toprovide a model for estimation carbon monoxide

2 SAEB et al., Curr. World Environ., Vol. 7(1), 1-6 (2012)
concentration in urban highways with goodaccuracy and set the acceptable amount of trafficand other features in the system by investigate thecauses of these pollutants and prediction of that.
Literature ReviewUnderstanding the characteristics of the
air flows besides and upper of streets is necessaryfor understanding the transmission and distributionperformance of pollutants in urban highways. Thereare three main methods for this problem: alldimensions measurement, reduce fieldmeasurements by using of physical models andmathematical models1.
Many studies about the Highways confirmthat the vortex flow in the streets will expand whenthe wind that blows in roof surface is perpendicularto the direction of the wind spread. The result of thisvortex flow is transmission of the pollutants inupstream and in the direction of the wind and thentransfer it back to the wind and finally increasingthe pollutants levels in the back side of wind2.
Jacko et al., Study the transmissionparameters of a point pollutant source at the centerof town using a wind tunnel model. They foundthat with increasing two times in average height ofbuilding, buildings with equal density, theconcentration of pollutants at ground level in urbanareas will double too. There are accurate studiesabout measurements of the wind profile in realurban highway by Oke & Nunez in 1977, Sheih in1986, and Nakamura in 1988. Generally, thesestudies show a form of a vortex in street, but thiscannot be true in all cases (especially at low windspeeds). Physically, studies of the wind tunnelmodel are simpler from study of all dimensions fromthe viewpoint of guidance and control. Howeverinaccurate boundary conditions and incorrectscaling may cause errors. Studies of Hoydysh in1988 and 1991 show the pollutants concentrationpattern depends on the path symmetry andapparent ratio of the block size. And concentrationof pollutants in the vertical direction is reducedexponentially. Also the concentration of pollutantsis more in the back of wind toward the face of wind3.
Numerical models used for the issue ofurban highways can be in several forms: some of
them simulate the fluid flow and contaminanttransmission and some are empirical models basedon observational data. Advances in computerhardware technology have provided newopportunities for the simulation of environmentalaspects.
Johnson et al.,, in 1990 and Shuzo et al.,,in 1992 investigate the wind flow as the fluid inurban highways and approved a number of windtunnel results, such as the wind vortex rotation whenthe roof-level wind flow is perpendicular to street3.
In 1973 Johnson et al.,, made an empirical modelbased on observed data in all dimensions in theState of California. The model predicates thedecrease of concentration from a linear sourceagainst the wind and linear decreases ofconcentration toward height level on the oppositeside of the wind. They found that the wind directionin roof-level controls the levels of CO concentrationpattern. Concentration of CO near the street surfacein the backside of wind is significantly higher towardthe opposite side4.
Lin and Niemeier (1998) used observedtraffic data to estimate hourly allocation factors anddisaggregated traffic volume into hourly values.These indirect methods inevitably lead toinaccuracies in emission modeling. In theory,numerical modeling of traffic flow on road canprovide every detail required for the calculation oftraffic emissions. Unfortunately, previous effortsfailed to do this because of road networkcomplexity5.
L. Xia, Y. Shao (2005) used a Lagrangiantraffic flow model. According to their study the trafficflow model is simple, but has been found to bequite efficient. With the specification of travelbehavior, their model was capable of simulatingtraffic flow on a road network. The model appliedsuccessfully to Hong Kong Island. The simulatedtraffic flows in three cross-harbour tunnels and atthree counting stations on the island for weekdaysand weekends were compared with observations.The temporal variations of traffic flow in the cross-harbour tunnels and at the counting stations werereproduced by the model at satisfactory level6.
3SAEB et al., Curr. World Environ., Vol. 7(1), 1-6 (2012)
METHODS
There are three appropriate methods forstudy of factors affecting the traffic pollutants levels[1]:1- Developing the two-stage models (diffusion
- distribution) that Distribution mechanismsimulates with the Navier-Stokes equationsand appropriate boundary conditions areconsidered (numerical modeling).
2- Developing experimental models based onwind tunnel and field observations(simulation wind tunnel using a small-scalemodel).
3- Developing empirical models based on trueunderstanding of all factors influencing theconcentration of pollutants and also the datacollected at different sites with a wide rangeof traffic and atmospheric conditions.
Methods 1 and 2 require accurate modelsto predict emission rates of pollutions based ontraffic parameters. Because there is not preparedaccurate diffusion models in Iran, two stagesmodeling is not applicable. Furthermore accuratemeasurements of parameters in emission models
is complicated and requires high cost. Alsocomparison of laboratory data and field data isdifficult and using wind tunnel simulation modelsrequires extensive laboratory facilities.
According to the purpose of this study andthe available facilities the first and second methodsare not recognized suitable. Therefore the thirdmethod that apply the effective factors and field dataare used and relationships between geometric,atmospheric and traffic conditions are analyzed.
This method has advantages over othermethods as follows [7]1. Because analyzing the levels of pollutants
and effective parameters are with eachothers, expanding the relations based onequal weights in the distribution andemission becomes possible.
2. In terms of costs these models that based onfield observations are the best option.
3. Empirical relationships are simple and notrequired powerful computer to estimateconcentrations of pollutants for purposes oftransportation planning.
4. When empirical relationships for evaluating
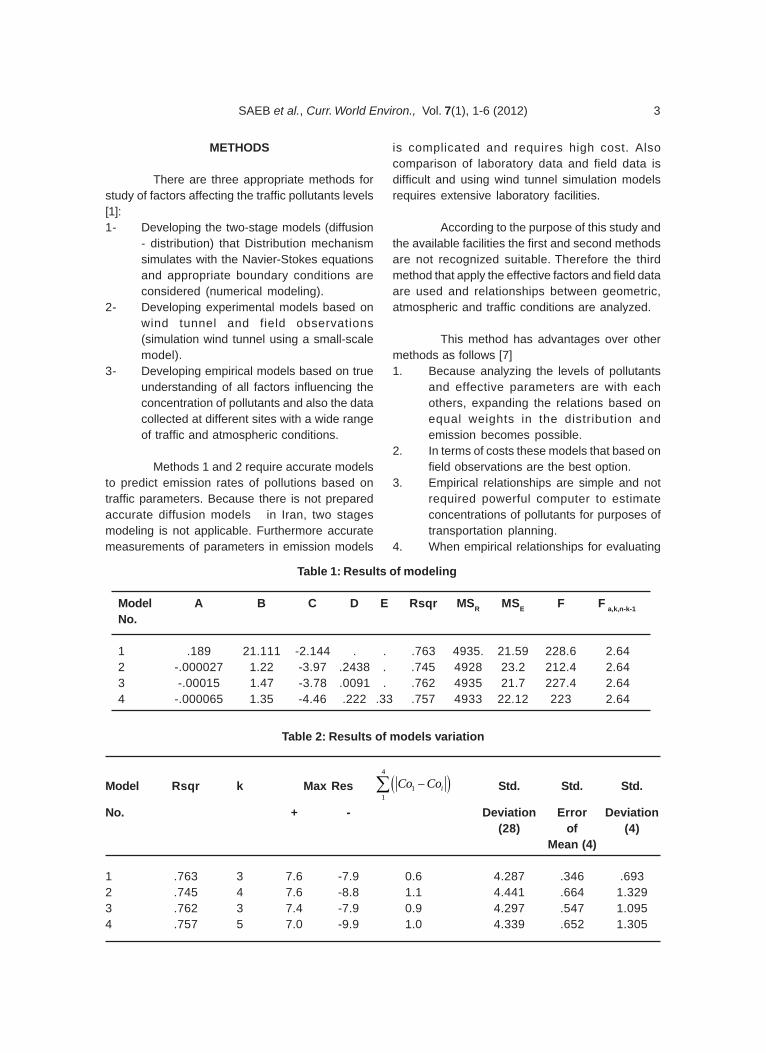
Table 1: Results of modeling
Model A B C D E Rsqr MSR MSE F F a,k,n-k-1
No.
1 .189 21.111 -2.144 . . .763 4935. 21.59 228.6 2.642 -.000027 1.22 -3.97 .2438 . .745 4928 23.2 212.4 2.643 -.00015 1.47 -3.78 .0091 . .762 4935 21.7 227.4 2.644 -.000065 1.35 -4.46 .222 .33 .757 4933 22.12 223 2.64
Table 2: Results of models variation
Model Rsqr k Max Res 4
11
iCo Co Std. Std. Std.
No. + - Deviation Error Deviation(28) of (4)
Mean (4)
1 .763 3 7.6 -7.9 0.6 4.287 .346 .6932 .745 4 7.6 -8.8 1.1 4.441 .664 1.3293 .762 3 7.4 -7.9 0.9 4.297 .547 1.0954 .757 5 7.0 -9.9 1.0 4.339 .652 1.305

4 SAEB et al., Curr. World Environ., Vol. 7(1), 1-6 (2012)
and selecting transportation projects areused less input data are require to othermodeling methods. Also these data areavailable in the planning of transportationand are easily accessible. Furthermore theexperimental models run just with a smallpart of inputs that the two-stage models arerequired.
Data collectingGenerally the factors affect the pollution
concentration in urban highways are divided intofour groups.1. Traffic parameters2. Geometric design3. Atmospheric condition4. Surroundings (background) concentration
There are define methods formeasurement in methods 1 through 3 and there isgeneral agreement about their digitizing. Butsurroundings concentration seems to be somecomplicated. The surroundings concentrations arethe amount of pollutant that exists in the air withouttraffic there. Distribution of residential and industrialareas near the areas under study will impact of thisissue7.
About the first three methods there aredistinct measurements methods and generalagreement to digitize it. But the Surroundingconcentrations seem to be some complex. Thebackground concentrations are the pollutants thatexist in the air without traffic condition. Distributionof residential and industrial areas near the areasunder study, affects this issue7.
Fig. 2: Negative and good correlating between Co concentration and wind normal speed
Fig. 1: Positive and good correlating between Co concentration and hourly traffic

5SAEB et al., Curr. World Environ., Vol. 7(1), 1-6 (2012)
The main focus of this research will be onthe first three groups of variables because thereason as follow:´ First, traffic is effective in pollution
concentration on the ground surface andnear the urban streets and at low altitudeareas.
´ Second, it is due to studies about the role oftraffic in the concentration of CO in TehranCity. According to studies, more than 90% ofthe CO gas production is arising fromtransportation in Tehran.
´ The third reason is related to the stationsselection. It is tried that the selected stationbe in commercial and residential areas, andaway from industrial areas that produce COgas.
The main problem with field data in thisstudy is requirement of taking the traffic, air pollutionand the atmospheric data in the same time.
The locations of existing measurementstations of “Tehran air pollution control” and“environmental protection organization” have beenchecked first. Because more of existing stationswere besides the crossroad and squares and someothers were set in wide area generally there wereno suitable stations that show the pollutionconditions of urban streets.
So used from portable samples.Furthermore portable samplings have someadvantages because some parameters like stationsituation and the height level of samples arecontrollable. High amount of traffic and highwayscondition takes into consider in sampling as wellas the other foresaid important conditions. ThereforeModares and Resalat highways selected for datameasurement.
Geometric variablesGeometric variables in stations were
measured in three dimensions: elevation,longitudinal and transverse. Data measurementshave taken at adjacent stations in different parts ofthe two highways. Geometric variables in thesestations are very close together, so the main focusis on the relationship between pollution levels, trafficparameters and meteorological conditions.
Meteorological variablesIn this study three variables analyzed that
includes: wind speed, wind direction andenvironment temperature. This information hasbeen taken from meteorological stations of Resalathighway. Meteorological variables at different hoursand days of the week were existed and in whichtime the data are collected the desiredmeteorological data is extracted too.
Model developmentIn order to develop a model to predict and
estimate well, firstly correlated pairs of variableswere analyzed. Based on this analysis, trafficvolume and wind normal speeds were identifiedas the most effective variables. Figures (1) and (2)shows the correlation between these variables andhourly concentrations of carbon monoxide.Correlation between traffic volume and the carbonmonoxide concentration is +0.814 and between thewind normal speed and the concentration of carbonmonoxide is -0.655.
The calibration of the previous modelsshows good agreement for SRI and Crompton &Gilbert models. In this stage through the followinganalysis and using SPSS software four combineforms were define and calibrated.
Traffic : the rate of traffic (vehicles of hours)W.Sinα: wind normal speed (m/s)Wt: total road width (m)Temp: temperature
To select the final model the ability ofmodels checked. As it can be seen from table (1)and (2) model No.1 suggested as the best modelsaccording to prediction ability and computationalerror.

6 SAEB et al., Curr. World Environ., Vol. 7(1), 1-6 (2012)
CONCLUSION
In order to determine a viable method forquantifying the contribution of traffic emission toregional air quality, all methods analyzed andaccording to the analyses developing empiricalmodels that apply the effective factors and field datahas advantages over other methods. The correlationbetween the variables and hourly concentrationsof carbon monoxide shows that the mainparameters influencing the distribution of carbonmonoxide concentration in the city streets are trafficvolumes and normal speed and the study shows
that the calibrated models SRI and Crompton &Gilbert are good in existing traffic, geometric andatmospheric conditions of Tehran. In addition fourintegrated traffic emission model developed andgood agreement has been found between themand field data therefore can accurately predictcarbon monoxide concentrations due to traffic andatmospheric conditions of Tehran. Finally the studyshows that these models have good ability and canbe use as a technique by traffic managers to reduceair pollution in polluted cities in Iran, to control thevolume of traffic with environmental standards.
1. Environmental Protection Agency, AppendixW to part 51 – Guideline on Air QualityModels (1995).
2. Shiran, G. R. “Area–Wide EnvironmentalCapacity Based on Air Pollution Criteria,Ph.D. Thesis , University of New South Wales,Sydney , Australia (1997).
3. A.A.Hassan and J.M.Crowther, Modeling offluid flow and pollutant dispersion in a streetcanyon, Environmental Monitoring andAssessment 52: pp 281-297 (1998).
4. C.M.N Riain, B.Fisher, C.J.Martin, andJ.Littler, Flow field and dispersion in a centralLondon street, Environmental Monitoring
REFERENCES
and Assessment 52: 299-314 (1998).5. Lin, K., Niemeier, D., Using multivariate
multiple regression models to improve thelink between air quality and travel demandmodels. Transportation Research 3(6), 375–387 (1998).
6. L. Xia, Y. Shao, Modeling of traffic flow andair pollution emission with application toHong Kong Island, Environmental Modeling& Software 20: 1175-1188 (2005).
7. Linaritakis, Factors affecting traffic – relatedair pollutant levels in urban streets, Ph.D.Thesis, University of London, UnitedKingdom (1987).

INTRODUCTION
The spotted oriental cucumber beetle E.chrysomelina (F.) is a notorious pest feeding onmany vegetable crops and attacks its most preferredplants specially members of the familyCucurbitaceae like pumpkin, sweet gourd, bittergourd, cucumber, Cucumis mello, Cucurbita pepoand Citrullus lanatus ( Talhoq, 1982 ).
The pest damages in adult and larvalstages during all vegetation of host plants. Itdamages mainly melons, cucumbers, pumpkins,and vegetable marrows. Watermelon is damagedin a lesser degree (Papointe and Shapiro, 1999 ;Lapointe , 2000).
The pest sometimes entirely consumesseedlings of the melons and gourds of late sowings,Beetles are more gluttonous during reproductiontime (Al-Allan et al., 2008). Damaged melon and
Current World Environment Vol. 7(1), 07-12 (2012)
Effect of Temperature and Humidity on the PopulationAbundance of Spotted Oriental Cucumber Beetle
Epilachna chrysomelina (F.) (Coccinellidae : Coleoptera)In Al - Qunfudah Western Saudi Arabia
SALEH A. AL-DIGAIL, AHMA I ASSAGAF and JAZEM A. MAHYOUB
Department of Biological Science, King Abdul-Aziz University, Jeddah (KSA).
(Received: May 18, 2012; Accepted: June 18, 2012)
ABSTRACT
The Melon Ladybird Beetle, Epilachna chrysomelina (Coleoptera: Coccinellidae) Fabricius,is one of the major phytophagous insects that feed on cucurbit plants. E. chrysomelina which isconsidered an economic pest in agriculture is a multi-habitat insect widely distributed throughoutthe world .It is also endemic along the Southern and the Western coast of Saudi Arabia due to theabundance of cucurbit plants (wild and domesticated) where it passes through all four developmentalstages . In this research it was found that temperature and humidity affect the insect biologicalactivities through their effect on insect reproduction and development. During some parts of theyear the insect is more abundant due to the favorable conditions of temperature and humidity forreproduction. The month of March was more favorable than February while January was the leastfavorable.
Key words: Epilachna chrysomelina (F.), The Melon Ladybird Beetle, Biological activities.
gourd fruits keep badly, decaying in 30-40 days(Shirai and Yara, 2001; Hiiesaar et al., 2005; Taylorand Schrader 2010 ) .
In Saudi Arabia, E. chrysomelina is one ofthe most injurious cucurbit attacking pests.Thebeetle is distributed throughout the countryspecially the South Western region( Abo-Thoria,1982 ; Omaker et al., 2009).
The present work was planned to evaluatethe effect of temperature and humidity on thepopulation abundance of spotted orientalCucumber beetle E. chrysomelina in Al- Qunfudahprovince Kingdom of Saudi Arabia.
MATERIALS AND METHODS
Study areaAl- Qunfudah province located on the
west coast of the Kingdom of Saudi Arabia is one of

8 Al-Digail et al., Curr. World Environ., Vol. 7(1), 7-12 (2012)
the largest cities of Makka Al Mukarrama Region inSaudi Arabia, overlooking the Red Sea on the west,and away from the holy city of Mecca 350 km to thesouth, and away from Jeddah, 360 km (Fig. 1). Itsgeographic coordinates are 19 07 42. 18" N and 4105 11. 75" E level.
Data collectionThe Cucurbit plant Momordia charantia
was chosen to study the abundance of E.chrysomelina L. throughout the year . The plantgrows naturally depending on the environmentalconditions including soil moisture ,however thebeetles were observed congregating on this 4preferred cucurbit plant feeding on its foliage ,specially when there is no cucurbit plants growingin the vicinity The choice on M. charantia was basedupon the following criteria :1. The continued abundant availability of the
host plant throughout the year.2. The plant tolerates environmental
fluctuations in (temperature, humidity anddryness of soil ).
3. The beetles thrive and nourish best on thisplant throughout the year as considered itpreferred host .
Method of calculating abundance of E.chrysomelina . The study started January 2009 upto December 2009 . Fifteen plants of Momordiacharatia , having the same size were chosen . Theplants were separated from each other at distancesof approximately 15 meters , giving a total studyarea of 150 meter squared , and each plant wasmarked by given a serial number . The plants werevisited monthly , recording number of insects presentthen, insects were collected by hand , during twoperiods , from 6. a.m. to 10. a.m. in the morning , andfrom 10. a.m. noon time . The monthly field visitstook place during the middle of the month , and thetemperature and RH% were registered using adigital metrological instrument , and alsotemperature and RH data were obtained from theMetrology and Environment Protection Department.
Data analysisData were analyzed using SAS statistics
software (version 6). Data were analyzed in orderto find relationship & correlation between climaticfactors, and the population numbers of the cucurbit
beetle E. chrysomelina Al- Qunfudah province.
RESULTS
The results showed a pronounced effectof the environmental factors as seen from the dailymean values of the temperature and R.H. on thedaily emergence of the insect for feeding, and itsbehavioral activities. The level of activity wasobserved as related to the differences in insectnumbers during certain periods of the year, hencethe maximum numbers were recorded in Marchthen February and April respectively with anaverage temperature of 22.72, 21.95, 25.21ºC andR.H. of 64, 66, 64.5% respectively, which representsthe optimum values for the beetles breeding andreproduction. The minimum population density ofthe insects was recorded during August, Septemberand October where the average temperature andR.H. reached 31.39, 29.02, 27.28ºC and RH 49,57, 57.5% respectively (Table 1).
During the rest of the year the averagepopulation density fall between the average range.The E. chrysomelina beetles were affected byvariation in the environmental conditions as regardsto their activity and the different plant growth stagesthroughout the year. Moreover they thrive well intemperatures ranging between 23ºC and 35ºC ,
Table 1: Mean temp. and Humidity during themonths of (Jan. - Dec. 2009)
Month Mean
Temperature(C°) Humidity(%)
January 23.17 62.5February 21.95 66March 22.72 64April 25.21 64.5May 28.06 65.5June 31.23 58July 30.32 54.5August 31.39 49September 29.02 57October 27.28 57.5November 27.51 61December 24.10 62

9Al-Digail et al., Curr. World Environ., Vol. 7(1), 7-12 (2012)
and R.H. between 30 and 70%. Out of these rangesthere was pronounced reduction in growth andreproduction rate, and increase in mortality andinhibition in egg hatching.
Generally, E. chrysomelina beetles wereabundant during January- May period, then theirpopulation numbers starts decreasing from Junetill October where it reached the minimumpopulation numbers (Fig 2 & 3).
The beetle population was abundantduring the morning period 6 a.m. to 10 am., andtheir numbers drop sharply from 10 to noon timewith a complete absence of the beetles after 12Oclock. The beetles were not 6 abundant after 10a.m. during July to October due to the sharp rise intemperature after this time .
In the following analysis of results,correlations were used to explain the relationship
between different climatic factors & abundance ofE. chrysomelina population in time & space usingdata collected at 6AM-12AM and 6AM-12AM.Pearson’s Correlation coefficient values suggestpositive correlation and highly significantrelationship between E. chrysomelina populationand temperature, negative correlation significantrelationship between E. chrysomelina populationand relative humidity (Table. 2).
The analysis of variance (Table 2)indicated a highly significant difference ( p<0.01)between temperature and number of eggs, and asignificant difference (p<0.05) between R.H.% andnumber of beetles at periods 6-10 a.m. and noontime.
This might give an indication that thefeeding activities of the beetle E. chrysomelina onleaves of the host plants is affected by temperatureand R.H. and the beetles were actively feeding early
Table 2: Pearson’s correlation values between climatic factors and E.chrysomelina density
Time 6AM-12AM 6AM-12AM
Parameters r-value p-value r-value p-value
Temperature -0.76444 0.0038** -0.76816 0.0035**Relative Humidity 0.63476 0.0266* 0.60005 0.0391*
* Significant
** high Significant
Fig. 1: Location of the study area in Al- Qunfudah City Kingdom of Saudi Arabia

10 Al-Digail et al., Curr. World Environ., Vol. 7(1), 7-12 (2012)
in the morning and their numbers decreased withincrease in temperature and when R.H. startsdecreasing . The beetles disappear completely after12 oclock (Table 2), which illustrates the
relationship between the beetle numbers on plantsand temperature degrees and R.H. throughout theyear .It is clear evident that the most suitable timefor the beetles feeding lies between 6 to 10 a.m.
Fig. 2: The graph showing the relationship between abundance of E. chrysomelin & temperature
Fig. 3: The graph showing the relationship between abundance of E. chrysomelin & humidity 8

11Al-Digail et al., Curr. World Environ., Vol. 7(1), 7-12 (2012)
during March , April and February , and least presentduring October . Indicated ( Table 1 ) to averages oftemperature and humidity during the year 2009.
DISCUSSION
It was clearly evident that E. chrysomelinais active during early morning hours and graduallydisappears with rise in temperature as wasmentioned earlier by Habeek et al., (1990) whoreported marked effects of the environmentalvariations of the beetle population and our resultswere in agreement with these findings. Such effectsare obvious from the influence of the daily meantemperature and R.H. on the presence of thesebeetles during their daily feeding in the field. Themaximum number of the beetle present was duringFebruary , March and April, where the temperatureand R.H. were at their optimum values 23°C and70% , and the minimum density was during August,September and October with a rise of temperatureto 36°C and the reduction of R.H. to35%.Abdelrahman ( 2005 ) mentioned that fixedtemperature affects growth and reproduction ofCoccinella undecimpunctata , suggesting that theoptimum temperature for this carnivorous insect andits development ranges between 25 to 30°C.
Taghizadah, ( 2008 ) repor ted thatincreasing temperature up to 40°C did not improvethe insect development .There are significantdifferences between the rates of temperaturedecrease and the increase in the development andgrowth of the beetle , a fact which plays a vital rolein the reproduction rate of the beetle and manifestedin the increase in their numbers during certainperiods of the year. The beetles appear feedingduring day on different parts of the plant . In theearly morning were observed on the upper surfaceof the leaf ,and later when temperature starts risinghiding under the lower surfaces of the leaves , andat noon observed congregating below the plantbetween branches and on the soil near the basesof their host plant. It has been observed that thebeetles prefer moist humid habitats in mostagricultural fields, however the second bestpreferred host plant was bitter gourd in the absenceof 11 cucumber, as an alternative host plant where
they complete their life cycle..This plant emitsvolatile odors which probably attracted thesebeetles. Moreover E. chrysomelina beetles candifferentiate between the different cucurbit plantsbecause they were never observed feeding on ,bitter melon plants .
Al-Allam , ( 2008 ) reported significantdifferences in egg hatching periods duringtemperature ranges between 28-30ºC , and nosignificant differences in the adult life span periodsat temperature 32°C. This might probably explainthe reduction in beetle population density as aresult of reproduction with increase in temperature.
The results indicated the absence of asignificant correlation between egg numbersproduced and R.H. , while the correlation is stronglysignificant with the number of eggs produced andtemperature . These results are in agreement withsome authors findings (Lapointe 2000; Abdel-Rahman 2005 ; Papointe and Shapiro 1999 ; Shiraiand Yara 2001; Yunis et al., 2004).
CONCLUSION
In general, as evident from the results theactivity of the pest is at its peak in the month ofMarch; therefore it is recommended that the cropmust be sprayed by insecticides during the monthof January and February to control the activity ofadult insects.
ACKNOWLEDGMENTS
The authors wish to extend their profoundgratitude and appreciation to Sayed MohammadAl Laithy for welcoming the conduction of this fieldstudy at his farm and thanks also goes to his 11fellow workers who have contributed in the manualwork near Al-Qunfotha town. Also deep thanks andappreciations were conveyed to the technical staffof the biological Science Department. Faculty ofScience .King Abdul Aziz University for theirappreciated efforts by giving a helping hand duringdata collection and the preparation of thismanuscript.

12 Al-Digail et al., Curr. World Environ., Vol. 7(1), 7-12 (2012)
REFERENCES
1. Abdel-Rahman, M. ( 2005 ) . Influence ofconstant temperature on the development ,and reproductive potential of the ladybirdbeetle , Coccinella undecimpunctata L. (Coleoptera : Coccinellidae ). 3rd InternationalConf. on IPM role in Integrated CropManagement and Impacts on Envi. And Agr.Products , 26-29 (2005), Geiza ,Egypt.
2. Abo – Thoria , N. General account ofagricultural pests in the King dom of SaudiArabia .Agricultural Research and WaterManagement . Riyadh , Saudi Arabia , 268(1982).
3. Al-Allan et al, Coccinella septempunctata L.(Coleoptera: Coccinellidae) Arab ScientistOrganization, ArabScinetist.org. (2008).
4. Habeek , D. H. ,Bennett, F. D. andJ.H.Frank.Classical biological control in the southernUnited States. Southern Cooperative SerierBull. No. 355 , IFAS Ed. ,Univ. Florida ,Gainesville ,FL. 197 (1990).
5. Hiiesaar , K. ,Metspalu, L. , Joudu, J. Jogar ,K. ( 2005 ). Influence of low temperatures ondevelopment of preimaginals of Coloradopotato beetles , Leptinotarsa decemlineata( Coleoptera : Chrysomelidae) 3rdInternational Conf. on IPM role in IntegratedCrop Management and Impacts on Envi. AndAgr. Products, 26-29 (2005), Geza ,Egypt.
6. Lapointe, S. L. ( 2000 ) . Thermal requirementsfor development of Diaprepes abbrivatus(Coleoptera :Curculionidae). Environ.
Entomol. 29: 150-156 (2000).7. Papointe ,S. L. and J. P. Shapiro. Effect of soil
moisture on development of Diaprepesabbrivatus ( Coleoptera : Curculionidae ).Florida . Entomol. 82: 291-299 (1999).
8. Omakar C. ; S. Rastogi ; P. Pandey. Effect oftemperature on reproductive attributes of theMexican beetle Zygogramma bicolorata (Coleoptera: Chrysomelidae ). Inter. Jour. ofTropical Insect Sci. 29: 48-52 (2009).
9. Shirai , Y. and Yara , K. Potential distributionarea of the Mexican bean beetle , Epilachnavarivestis ( Coleoptera : Coccinellidae ) inJapan , estimated from its high – temperaturetolerance . Appl. Entomol. Zool. 36(4): 409-417(2001).
10. Taghizaden , R., Y. Fathipour , and K. Kamali.Temperature-dependent development ofAcarophagous ladybird, Stethorus gilvifrons( Coleoptera : Coccinellidae ). J. Asia –PasificEntomol., 11(3): 145-148 (2008).
11. Talhoq , A.S. Applied Zoology in SaudiArabia , Anote on the EntomophagousInsects . Fnuna and Saudi Arabia , 4: 525-531 (1982).
12. Taylor, F. and R. Schrader ( 2010 ). Transienteffects of photoperiod or reproduction in theMexican bean beetle .Physio. Ento. 9(4): 459-464 (2010).
13. Yunis , L. H. ; K. F. Azzawi ; A. F. Khalifa . Appliedinsect science . First Ed. ,Faculty ofAgriculture , Iraq , 281– 290 (2004).

INTRODUCTION
Water uptake for agriculture is veryintensive in Souss Massa region (521Mm3 per year),where irrigation waters are almost exclusivelypumped from the water table which is beingdepleted by 2 to 3 meter per year 1. The climate isvery arid with rainfall of about 150-200 mm/yearconcentrated in winter and Evapotranspiration(ETo) of 1800 mm/year with more than 7 mm/day inthe Summer, average winter temperatures canreach 5-7°C whereas average summertemperatures can be as high as 32-36 °C 2-3 . Addingthe effect of the foreseen climate change, theavailable water volumes are expected to shrink by10-15% of the actual volumes in 2020 due to thefalling groundwater levels and the reduction of thestorage capacity of dammed lakes by siltation 4.The citrus sector in the Souss region occupies about33 000 ha which represents about 40% of the
Current World Environment Vol. 7(1), 13-22 (2012)
Shading Nets Usefulness for Water Saving on CitrusOrchards under Different Irrigation Doses
A. ABOUATALLAH1, R. SALGHI1* A. EL FADL2, B. HAMMOUTI3,A. ZARROUK 3, A. ATRAOUI2 and Y. GHNIZAR4
1Equipe de Génie de l’Environnement et Biotechnologie, ENSA, Université Ibn Zohr,BP1136 Agadir, Morocco.
2 Institut Agronomique et Vétérinaire Hassan II, IAVCHA, BP 121 Ait Melloul, Morocco.3 LCAE-URAC18, Département de Chimie, Faculté des Sciences, Université Mohammed
Premier, BP 4808, Oujda, Morocco.4 GPA Group, 325, Av Hassan II Agadir, Morocco.
(Received: March 12, 2012; Accepted: April 14, 2012)
ABSTRACT
This work treats a comparative study of deficit irrigation and shading nets impacts on thecitrus growth and fruit dropping, in order to save water without affecting physiological status andtrees performances. The first dose (100%) is calculated using reference evapotranspiration (ETo- calculated using weather station), and crop coefficient (Kc) which varies according to physiologicalstage; the second is a double-dose (200%) and the third is a half-dose (50%); This study hasshown that the application of half-dose using shade screens meets trees needs without causingadverse effect on crop performances; the soil water content and root hairs are well distributedlaterally, the bulb’s depth and 90% of roots are located at 0-50 cm horizons. Shading net enhancedfruit growth and has mitigated fruit dropping phenomena by H≈50% for the treatment F50%.
Key words: Water saving, Shade screens, Dose, Irrigation, Citrus.
whole citrus plantings in Morocco, and employingquasi permanent irrigation with very limited waterresources. This has led to the use of low volumeirrigation systems (i.e.; drip, microsprinklers etc.)by more than 80% of the citrus orchards 5.
To sustain agriculture, it is particularlyimportant to optimize crop yields by minimizinginputs, mainly water and nutrient application 6;Irrigation practices for water saving need to beadopted in intensive horticulture of Souss Massaregion, where there is strong competition for scarcewater supplies. While, Water efficiency is a keyconcept to solve water-shortage problems insemiarid areas 7, Shading nets structures in semi-arid and arid environments can be considered asan intermediate solution for increasing water useefficiency and reducing plant water stress 8. It offermany advantages and environmental benefits 9-12,this is why an increasing area of crops, including

14 ABOUATALLAH et al., Curr. World Environ., Vol. 7(1), 13-22 (2012)
citrus, is being grown under shading materials ofvarious types, and growers need to know how theseinfluence yield. Some authors reported thatshading nets are helping to reduce wind speedwithin the foliage by about 40% 13, keep lower valuesof maximum daily shrinkage 14, maintain high leafwater content and better LAI - Leaf Area Index 15,reduce irradiance at the Earth’s surface 16, decreasecrop transpiration by increasing stomatal diffusiveresistance in leaves 17 and reduce the daily sapflow 17-18. However the photosynthesis andintegrated daily net CO2 uptake is maintained athigh levels in shaded plants with respect to exposedtrees 20, The shade provided by the net do not affectyield and internal fruit quality (ratio of sugar to acid)but may increase fruit average weight and diameter14,21. Another common practice is the Improve ofwater-use efficiency by reducing the amount ofwater supply 25-27,31. Plants have developed variousmechanisms to withstand water stress, such ashigher root-shoot ratios, fewer and smaller leaves,concentrated solutes or increased activity ofoxidative stress enzymes in leaf cells 22,nevertheless, rootstock characteristics areimportant factors influencing plant responses towater deficit 23. It is well known that water stress incitrus reduces stomatal conductance, transpirationrate and net assimilation of CO2
24-27; Some authorssuggest that the Deficit Irrigation (DI) and regulateddeficit irrigation (RDI) strategies can be applied incommercial orchards not only in case of waterscarcity, but also as a tool to control vegetativegrowth improving fruit composition and reducingcosts associated with the crop management 22. Itwas possible to save up to 18% of water, applyingDI strategy, without any significant reduction in yieldand fruit weight 28, Mid-summer RDI strategyallowed 20% water savings, with a reduction in treegrowth but without any significant reduction in yield,fruit size nor in the economic return, and helped toimprove water use efficiency 29. Another author didfind that RDI with 50% of the crop ETc decreasedthe yield by 10% but wasn’t statistically significant30, it is important to draw attention to the fact thatfruit growth and flowering stages are the mostsensitive periods in relation to irrigation water deficitand yield loss 31, a loss of water takes place fromfruit to transpiring leaves during water stress32, fruitdropping may happen as a result of this endogencompetition 33 or just a natural selection to keep a
limited fruit number balanced to its reserves 34, thuswater-sever stress applied during the flowering andfruit-growth phases affect significantly the yield, thegrowth and reduces fruit size causing importanteconomic losses in orchards 35,39; but when thisdegree of stress is applied during the maturityphase, it improves mainly fruit-quality parameters(total soluble solids, and titrable acidity in juice)26,27,32,40 , other authors reported that DI and RDIdecrease fruit size by 4% and fresh weight by 10%,but enhance total soluble solids by 10% andtitratable acidity by 13% at fruit maturity 41. Althoughthe amount of irrigation water would have a relativeimportance, but other variables such as theirrigation strategy, would decidedly influenceprudent water management in semiarid areas 33,when using low watering frequency, Deficit irrigationreduces water use by 1250m3/ha, with similar yieldsin comparison to the fully irrigated trees 42. However,when reducing water supply, irrigation water salinityis very important factor that should be managedtoo, because it increases average crop root zonesalinity and may result in a negative effect on cropyield 43. This work aims to compare the impact ofthree Deficit Irrigation strategies (200%, 100% and50% doses) on performance and physiologicalstatus of “Afourer” mandarin, in order to streamlinethe water supply without adversely affecting thetrees performances; shading nets were then usedtowards their usefulness when combined with waterdeficit.
EXPERIMENTAL
The experiment took place at two plots of5 years old mandarin (Afourer) over an area of 8.5ha. Planting density was 833 trees per hectare (2 mbetween trees and 6 m between rows). While thefirst parcel has trees in open field, the second parcelwas under net. The plot is equipped with variousinstruments used for applied research and dripirrigation system. Each tree row has a singlepolyethylene pipe with self compensating onlinedrippers that are placed at 1 meter from one toanother on the pipe line and their flow is about 4 l/hour at a pressure varying within the range of 1 to 4bars, each tree has 2 drippers. The factor studied isthe amount of water applied. All the other productionpractices (fertilization, protection against pests anddiseases, weed control etc.) are optimal and were

15ABOUATALLAH et al., Curr. World Environ., Vol. 7(1), 13-22 (2012)
similar for the whole experimental plot. The threewater regimes corresponding to the three treatmentsstudied are defined based on Penman–Monteithevapotranspiration (ET) equation that predicts therate of total evaporation and transpiration from theearth’s surface using commonly measured weatherdata (solar radiation, air temperature, vapor content,and wind speed) 44. Citrus water requirement wasthen estimated using proposed FAO crop coefficient(Kc) which varies according to physiological stage45.
ETc (mm/day) = Kc x ETo (mm/day) ...(1)
The first dose is taken 100% of crop ETc,the second is a double-dose (200%) and the thirdis a half-dose (50%). The 100% dose computing isa function of the crop evapotranspiration lost duringthe day before, it was varying from 2.75 to 4 mm/day because of ETo variations en Kc changes (0.5during May and 0.6 from June).Thus, our different treatments were:´ Control with trees irrigated based on 100%
dose at open field (F100%)´ Treatment which received 200% dose at
open field (F200%)´ Treatment undergoing 50% dose at open
field (F50%)´ Control with trees irrigated based on 100%
dose under shading net (S100%)´ Treatment which received 200% dose
shading net (S200%)´ Treatment undergoing 50% dose shading
net (S50%)
Variety characteristicsThe mandarin variety called ‘Nadorcott is
well known under the names “Afourer” in Moroccoand Europ and under the name “W. Murcott’ and‘Delite’ in the United States. It is a Moroccanselection identified during 1981-82, among 18years old Murcott mandarins grafted on Troyercitrange. These trees were planted at theExperimental Station of INRA in Afourer - BeniMellal (Morocco). Afourer is a very attractive, easyto peel midlate season mandarin (peak maturityJanuary - February) which, when grown in isolatedconditions, can be virtually seedless. Production isexcellent with very little alternate bearing whengrown under commercial conditions 46. The variety,known worldwide for its high quality, has been
widely planted over the past decade as consumerdemand for internal and external highquality of fruit(flavor, aroma, appearance and profile templates),lowseeded, easy to peel mandarins has increased,its high productivity (30-60 t / ha), and early entryinto production (15 to 20 t / ha the third year afterplanting) and ease of peeling 47 .
Rootstock characteristicsCitrus macrophylla rootstock is sensitive
to cold and wet soils. However, it supports highlevels of chlorides and adapts to limestone soils.It’s tolerant to phytophthora, gummosis andresponds well to other root attacks Diaprepesabbreviature especially due to its ability to rapidlyregenerate damaged roots. It tolerates exocortis,but is sensitive to tristiza and the cachexia-xyloporose. Citrus macrophylla gives a good fruitset and a strong affinity with the lemon and limetrees. It tends to reduce the soluble sugar contentof oranges, mandarins and their hybrids 48.
Measurements and observationsCharacterization of soil water retention
using Richards’s apparatus: soil sampling was donein the first 70 cm profile and samples were taken atintervals of 20 cm of depth. Metal cylinders of 4.2cm in diameter and 4 cm in depth were used for insitu samplings.
Characterization of the root profile in thesoil: it allows architectural visualization of the rootsin the soil, in relation to the relative distance to thedrippers and to the tree trunk. A square-shapedscreen (1 m in each side) composed of elementaryopenings of 10 cm × 10 cm is placed against thevertical wall of the profile; roots located in eachopening were counted after their classificationaccording to their diameter ( Ø < 3 mm ; Ø ≥ 3 mm).Soil water content: Soil samples were used for thispurpose; sampling was performed at 15 dayintervals. A single sample is the mixture of 6samplings done at the same depth for each one ofthe six treatments. These profiles allow comparisonbetween treatments by comparing vertical andhorizontal distribution of water. Samples of soil weretaken using rings in order to determine the bulkdensity and soil characteristics at the Laboratory ofSoil Science at Agronomic and veterinary InstituteHassan II; the water content was calculated by

16 ABOUATALLAH et al., Curr. World Environ., Vol. 7(1), 13-22 (2012)
Fig. 1: Water retention curves (pF curves) at different depths ofthe soil (30, 50 and 70 cm) for the experimental orchard
Fig . 2: Spatial distribution of the soil watercontent on the open field treatments F200%,
F100% and F50%
Fig. 3: Soil moisture distribution on treatmentsunder shade S200%, S100% and S50%
Root profiles

17ABOUATALLAH et al., Curr. World Environ., Vol. 7(1), 13-22 (2012)
Fig. 5: Roots spatial distribution in the soil profile (Ø <3mm) made at 20 cm from tree trunk andjust underneath the irrigation pipeline for treatments under shade S200%, S100% and S50%; the
placement of the 2 drippers coincides with horizontal distances (±30cm).
Fig. 4: Roots spatial distribution in the soil profile (Ø <3mm) made at 20 cm from tree trunk andjust underneath the irrigation pipeline for open field treatments F200%, F100% and F50%; the
placement of the 2 drippers coincides with horizontal distances (small triangles ±30cm).
measuring the fresh weight and dry weight (afterdrying at 105 ° C for 24 hours).
Fruit growth: we randomly selected fourtrees per treatment; each one was marked with eightfruits for which the equatorial diameter wasmeasured weekly.
Fruit dropping intensity: the number ofdropped fruits has been counted three times a weekduring the month of May to compare its intensity forthe three treatments applied (200% x 50%) in thetwo plots under nets and on open field. Repetitionsand trees concerned were the same as those fromfruit growth measurements.
RESULTS AND DISCUSSION
Water retention curve or pF curveValues in Fig. 1 are relative to different soil
depths. The observed difference concerns waterretention capacity between the three soil depthsbecause of variations in soil micro porosity and soiltexture, which varies between the three horizons.The average curve of 50cm binding soil waterpressure potential with soil volumetric water contenthas a polynomial form: y = -0.746x2 – 1.146x + 34.21
Soil moisture is calculated from trendsusing equations at field capacity (HFC=pF2) and atpermanent wilting point (HPWP=pF4.2) 49-50,41
(Table 1). Available soil moisture is determined as

18 ABOUATALLAH et al., Curr. World Environ., Vol. 7(1), 13-22 (2012)
Fig. 6: Fruit size growth for all treatmentsunder shade and on open field.
Fruit dropping intensity
the interval between the water content at fieldcapacity and permanent wilting point 51.
Treatments at open fieldWe note a good water distribution into the
soil for the open field treatments F200% and F100%(Fig. 2); soil moisture never approaches the HPWP,but water have been lost until 70cm and 90cm ofsoil depth for treatments F100% and F200%respectively due to the high amount of water appliedin both two cases. A better lateral distribution tookplace on treatment F50%, however soil moisturewas below HPWP at the horizons of 40-60cm depth(Figure 2), indeed, deficit irrigation significantlyreduces the wetted soil volume 52; this can stronglyprevent the development of roots at these levels;we observed 95% of root hairs at only 30 cm of soildepth; the F50% dose seems to be insufficient forcitrus crops grown on open field.
Treatments under shadeWe note, again, a good water distribution
into the soil for the treatments under shade S200%and S100% (Fig. 3); but with high soil moisture atdeep horizons below 70 cm. similar soil floodingcauses less root hydraulic conductance in citrus,so a reduction in transpiration by 56% 53 . The soilwater content is well distributed laterally ontreatment S50% (Fig. 3), the bulb’s depth is about50 cm where the majority of roots are located; itseems that the shade screens helped to reduceevapotranpiration and to keep water into the soil.This result is in concordance with some otherauthors who founded sap flow in shaded trees islower than in exposed trees almost every day 18,19.
Root profiles.In this report, we are only presenting
results for the root hairs with diameter < 3 mm.
Fig. 7: Fruits cut number per tree for alltreatments under shade and on open field

19ABOUATALLAH et al., Curr. World Environ., Vol. 7(1), 13-22 (2012)
Table 1: Soil water retention, for the three studied horizons
Depths (cm) HFC (%) HPWP (%) RU (mm/cm) Da
30 20,06 11,3 13,86 1,58
50 18,67 10,5 12,7 1,55
70 17,05 8,5 12,52 1,47Average 18,59 10,10 13,03 1,53
Soil water content
Treatments at open fieldThe greatest number of roots was counted
on the open field treatment F200% (3293/m2),almost 90% of the feeder roots are concentrated atless than 60 cm depth; nevertheless, we could foundsome active roots until 100cm due to the very deepsoil water bulb (Fig. 4). Roots were better distributedfor the open field treatment F100% (2333/m2), thelast roots are found at 80 cm depth. These resultsconfirm what other authors say that the root systemarchitecture is largely affected by irrigation 54. Treesfrom treatment F50% developed very few root hairs(1625/m2) at superficial horizons only (95% at 30cmdepth); it means 50% compared to the F200%; otherauthor have found that root length density is reduced
by H”73% because of the continuous deficitirrigated 55; this root reaction is to be explained bythe restricted water supply which brings superficialsoil moisture; however, a good horizontaldistribution of these roots is observed, which provesthat soil humid bulbs overlap under the emitterswhich is also in relation with the loamy nature ofthe soil.
Treatments under shadeThe trees from the treatment S200%
developed deep roots until 90cm with a totalnumber of 3267/m2; nevertheless, almost 90% ofthe feeder roots are concentrated at less than 70cm depth. With a total of 2652/m2, roots were better
Table. 2: Root counts in the soil profile (Ø <3mm) made at 20 cm from treetrunk and just underneath the irrigation pipeline for the open field treatment F50%
Depth Horizontal distribution Counts%(cm)
0-10 10-20 20-30(*) 30-40 40-50 50-60 60-70 70-80 80-90(*)90-100
0-10 30 48 113 58 62 85 73 65 75 57 666 4110-20 42 58 74 43 39 68 67 68 75 87 621 3820-30 35 29 28 14 22 16 19 22 38 38 261 1630-40 12 8 11 4 0 3 10 13 16 0 77 540-50 0 0 0 0 0 0 0 0 0 0 0 050-60 0 0 0 0 0 0 0 0 0 0 0 060-70 0 0 0 0 0 0 0 0 0 0 0 070-80 0 0 0 0 0 0 0 0 0 0 0 080-90 0 0 0 0 0 0 0 0 0 0 0 090- 0 0 0 0 0 0 0 0 0 0 0 0100Total 119 143 226 119 123 172 169 168 204 182 1625 100
% 7 9 14 7 8 11 10 10 13 11 100
(*): Approximate placement of the 2 emitters.

20 ABOUATALLAH et al., Curr. World Environ., Vol. 7(1), 13-22 (2012)
distributed for the treatment S100% horizontally aswell as vertically, the last roots are found at 85 cmdepth (Fig. 5). Trees from treatment S50%, growingunder shelter, developed good number of root hairs(2516/m2); almost 90% of them are at 50cm depthand very well distributed horizontally (Fig. 5).
The comparison between open field trees andthose under shade brings to say´ Roots number and distribution are almost
the same for treatments 200% with deeperwater bulbs.
´ Roots are very well distributed for treatmentsreceiving 100% of their water requirements;
´ For treatments under 50% of water stress,the difference on root profiles is notable. Theroots number is greeter under shade (2516/m2 against 1625/m2) and well distributed; thismight be explained by a better distributionof the soil moisture in the different horizonsthanks to the less crop water requirementunder shade (Table 2 and 3).
Fruit sizeThe Fig. 6 and statistical analysis indicates
no significant difference between the three doses.In addition, the use of the shade screens coupledwith treatment 200% and 100% does not affect the
growth of fruit trees. But, when using the dose of50%, the fruit growth is enhanced under shadecompared to the open field; some authors reportedthat the best integrated daily water-use efficiencycorresponded to the shaded citrus treatments 56 .
Fruit dropping intensityFig. 7 shows that fruit drop is higher for the
dose of F200% with a total of 341 fruit droppedwhile, for treatment F50%; this value is only 176(≈50% less); however, other author found that apartial drying do not induce excessive fruit dropand crop yield is kept unaffected 57; Also, for alltreatments it was evident that fruit droppingphenomena depends a lot on the use or not of theshade screens that seems to reduce considerablythe rate of fruit drop especially for the treatments100% and 50%.
CONCLUSION
Better water use efficiency is no longer anaim of citrus growers but necessity for sustainabilityof agriculture in the Souss-Massa region. The useof the shading net helped to decrease fruit dropping,but had no effect on the fruit size growth. Rootsdistribution and soil moisture measurementsshowed that the 100% and 200% doses provided
Table. 3: Root counts in the soil profile (Ø <3mm) made at 20 cm from tree trunkand just underneath the irrigation pipeline for the treatment S50% under shade
Depth Horizontal distribution Counts%(cm)
0-10 10-20 20-30(*) 30-40 40-50 50-60 60-70 70-80 80-90(*)90-100
0-10 87 62 83 89 67 58 87 92 67 64 756 3010-20 83 65 79 43 73 72 63 77 111 63 729 2920-30 53 37 42 27 38 64 49 30 40 18 398 1630-40 24 22 14 16 12 23 29 33 27 5 205 840-50 8 14 23 13 27 32 22 22 14 8 183 750-60 22 13 15 5 19 25 10 5 8 6 128 560-70 12 15 18 8 11 7 9 3 0 6 89 470-80 3 5 6 2 0 0 5 3 4 0 28 180-90 0 0 0 0 0 0 0 0 0 0 0 090-100 0 0 0 0 0 0 0 0 0 0 0 0Total 292 233 280 203 247 281 274 265 271 170 2516 100% 12 9 11 8 10 11 11 11 11 7 100 -
(*): Approximate placement of the 2 emitters.

21ABOUATALLAH et al., Curr. World Environ., Vol. 7(1), 13-22 (2012)
the plant with excess water percolating into deeperhorizons, which was behind the establishment ofroots beyond 60 cm; in contrast, those onesconfined in the upper layers of 50 cm depth whentrees are under shade and irrigated using 50%
dose. We may conclude that adopting 50% of tree’swater requirements using net are a good way tomaximize irrigation water efficiency without affectingthe tree growth and their physiological state.
REFERENCES
1. Agence du Bassin Hydraulique du SoussMassa (ABHSM), Etude de révision du plandirecteur d’aménagement intégré desressources en eau des bassins du soussmassa, Document interne, (2006).
2. Le Houerou H. N., Ecologia Mediterranea.,15: 95 (1989).
3. Driouech F., Déqué M., Sánchez-Gómez E.,Global. Planet. Change., 72: 1 (2010).
4. Ministère de l’Aménagement du Territoire,de l’Urbanisme, de l’Habitat et del’Environnement du Maroc (MATUHE), FirstNational Communication, United NationsFramework Convention on Climate change,99 (2001).
5. Office régional de mise en valeur agricoledu Souss Massa (ORMVASM), Etude degestion intégrée des ressources en eaudans le Souss Massa., Document interne,(2007).
6. Edwards C. A., Agric. Ecosyst. Environ., 27 :25 (1989).
7. Tejero I. G., Zuazo V. H. D., Bocanegra J. A. J.,Fernández J. L. M., Sci. Hort., 128: 274 (2011).
8. Nicolás E., Barradas V. L., Ortuño M. F.,Navarro A., Torrecillas A., Alarcón J., Environ.Exp. Bot., 63: 200 (2008).
9. Castellano S., Scarascia G. M., Russo G.,Briassoulis D., Mistriotis A., Hemming S.,Waaijenberg D., Appl. Eng. Agric., 24: 799(2008).
10. Medany A. M., Hassanein M. K., Farag A. A.,Acta Hortic., 807: 121 (2009).
11. Hemming S., Swinkels G. L. A. M., CastellanoS., Russo G., Scarascia G. M., Agriculturaland Biosystems Engineering for aSustainable World., 42: 23 (2008).
12. Briassoulis D., Mistriotis A., Eleftherakis D.,Polym. Test., 20: 970 (2007).
13. Tanny J., Cohen S., Biosystems Eng., 84: 57(2003).
14. Nicolás E ., Torrecillas A., Dell’Amico J.,
Alarcón J. J., J. Plant Physiol., 162: 439(2005).
15. Cohen S., Raveh E., Li Y., Grava A.,Goldschmidt E. E., Sci. Hort., 107: 25 (2005).
16. Stanhill G., Cohen S., Agric. Forest Meteorol.,107: 255 (2001).
17. Muthuchelian K., Paliwal K.,Gnanam A.,Plant. Sci., 99: 539 (1989).
18. Alarcón J. J., Ortuño M. .F, Nicolás E., NavarroA., Torrecillas A., Agric. Water Manage., 82:387 (2006).
19. Nicolás E., Torrecillas A., Dell’Amico J.,Alarcón J. J., J. Plant Physiol., 162: 439(2005).
20. Medina L. C., Souza P. R., Machado C. E.,Ribeiro V. R., Silva A. B. J., Sci. Hort., 96: 115(2002).
21. Talamini do Amarante C. V., Steffens C. A.,Argenta L. C., Sci. Hort., 129: 79 (2011).
22. Lei Y. B., Yin C. Y., Li C. Y. Physiol Plant., 127:182 (2006).
23. Rodríguez-Gamir J., Ancillo G., Aparicio .,Bordas M., Primo-Millo E. , Plant Soil., 347:91 (2011).
24. Arbona V., Iglesias D. J., Jacas J., Primo-MilloE., Talon M., Gomez-Cadenas A., Plant Soil.,270: 73 (2005).
25. Garcia-Sanchez F., Syvertsen J. P., GimenoV., Botia P., Perez-Perez J. G., Physiol.Plantarum., 130: 532 (2007).
26. Perez-Perez J. G., Syvertsen J. P., Botia P.,Garcia-Sanchez F., Ann. Bot., 100: 335 (2007).
27. Gomez-Cadenas A., Tadeo F. R., Talon M.,Primo-Millo E., Plant Physiol., 112: 401(1996).
28. Velez J. E., Intrigliolo D. S., Castel J. R., Agric.Water Manage., 90: 197 (2007).
29. Ballester C., Castel J., Intrigliolo D. S., CastelJ. R., Agric. Water Manage., 98: 1027 (2011).
30. García-Tejero I., Jiménez-Bocanegra J. A.,Martínez G., Romero R., Durán-Zuazo V. H.,Muriel-Fernández J. L., Agric. Water

22 ABOUATALLAH et al., Curr. World Environ., Vol. 7(1), 13-22 (2012)
Manage., 97: 614 (2010).31. García-Tejero I., Durán-Zuazo V. H., Arriaga-
Sevilla J. and Muriel-Fernández J. L., Agron.Sustainable Dev., 31: 779 (2011).
32. Xu-Ming H., Hui-Bai H., Fei-Fei G., Sci. Hort.,83: 227 (2000).
33. Agusti M., Garcia-Mari F., Guardiola J. L., Sci.Hortic., 17: 257 (1982).
34. Goldschmidt E. E., Monselise S. P., Proc. Int.Soc. Citriculture., 2: 668 (1977).
35. García-Tejero I., Romero-Vicente R.,Jiménez-Bocanegra J. A., Martínez-GarcíaG., Durán-Zuazo V. H., Muriel-Fernández J.L., Agric. Water Manage., 97: 689 (2010).
36. Romero P., Navarro J. M., Perez-Perez J.,Garcia-Sanchez F., Gomez-Gomez A., PorrasI., Martinez V., Botia P., Tree Physio., 26: 1537(2006).
37. Gonzalez-Altozano P., Castel J. R., J. Hortic.Sci. Biotechnol., 74: 706 (1999).
38. Gonzalez-Altozano P., Castel J. R., J. Hortic.Sci. Biotechnol., 75: 388 (2000).
39. Ginestar C., Castel J. R., J. Hortic. Sci., 71:551 (1996).
40. Treeby M. T., Henriod R. E., Bevington K. B.,Milne D. J., Storey R., Agric. Water Manage.,91: 24 (2007).
41. Treeby M. T., Henriod R. E., Bevington K. B.,Milne D. J., Storey , Agric. Water Manage.,91: (2007).
42. García-Tejero I., Durán-Zuazo V. H., Jiménez-Bocanegra J. A., Muriel-Fernández J. L., Sci.Hortic., 128: 274 (2011).
43. Abu-Awwad A. M., Agric. Water Manage., 52:53 (2001).
44. Fares A., Safeeq M., Jenkins D. M.,Pedosphere., 19: 588 (2009).
45. Allen R. G., Periera L. S., Raes D., Smith M.,Crop evapotranspiration: guideline forcomputing crop water requirement. FAO,Rome, Italy, 301 (1998).
46. Milind S., Ladaniya A., Academic Press., 1:13 (2008).
47. Nadori E. B., Revue HTE., 132: 15 (2005).48. Hanson R. B., Orloff S., Peters D., Calif Agric.,
54: 47 (2000).49. Jabro J. D., Evans R. G., Kim Y., Iversen W.
M., Irrig Sci., 27, 223 (2010).50. Ratliff L. F., Ritchie J. T., Cassel D. K., Soil Sci
Soc Am J., 47 : 770 (1983).51. Castel J. R., Buj A., Irrig. Sci., 11: 121 (1990).52. Hutton R. J., Loveys B. R., Agric. Water
Manage., 98: 1485 (2011).53. Rodríguez-Gamir J., Ancillo G., González-
Mas M. C., Primo-Millo E., Iglesias D. J.,Forner-Giner M. A., Plant Physiol. Biochem.,49: 636 (2011).
54. Sokalska D. I., Haman D. Z., Szewczuk A.,Sobota J., Dereñ D., Agric. Water Manage.,96: 917 (2009).
55. Abrisqueta J. M., Mounzer O., Álvarez S.,Conejero W., García-Orellana Y., Tapia L. M.,Vera J., Abrisqueta I., Ruiz-Sánchez M. C.,Agric. Water Manage., 95: 959 (2008).
56. Alarcón J. J., Ortuño M. F., Nicolás E., NavarroA., Torrecillas A., Agric. Water Manage., 82:387 (2006).
57. Hutton R. J., Loveys .B R., Agric. WaterManage., 98: 1485 (2011).

INTRODUCTION
Due to recent developments in membranetechnology, the trend in the desalination industry isto use reverse osmosis (RO) for desalting seawater.Brackish water (BW) desalination using membranetechnology is also expanding as the salinity ofgroundwater increases. Selecting an appropriateprocess to meet specific needs at specific locationsis essential though the biggest challenge remainsin the capability to successfully operate these plantsonce installed due to peculiarities of sea andbrackish waters in the region1. Membrane filtrationin general and reverse osmosis (RO) in particularis applied in a wide range of fields, such aschemical, medical, textile, petrochemical,electrochemical, water treatment, biotechnologyand environmental industries2.
Fouling and scaling are the most seriousproblems in membrane processes. In sea/brackishwater applications, pretreatment of RO feed water
Current World Environment Vol. 7(1), 23-32 (2012)
Reverse Osmosis Pretreatment: Removalof Iron in Groundwater Desalination Plant in
Shupramant-Giza - A Case Study
AL-SAYED M. ALY¹, MAHMOUD M. KAMEL², A. HAMDY¹*,KHALED Z. MOHAMMED¹ and MOHAMED A. ABBAS¹
¹Egyptian Petroleum Research Institute (EPRI), Nasr City, Cairo (Egypt).²Chemistry Department, Al-Azhar University (Assuit Branch) (Egypt).
(Received: March 18, 2012; Accepted: May 20, 2012)
ABSTRACT
Reverse osmosis (RO) is being increasingly utilized throughout the world for desalinationdue to the latest improvements in RO membrane performance and its reduced cost compared tothermal desalination. In this paper, Different media and chemicals have been used for Iron removalto prevent membrane fouling of groundwater reverse osmosis plant located in Shupramant-Giza.The objective is to present field results of the reverse osmosis plant operation in order to evaluatethe reliability of this technology. The operating pressure and pressure drop increased significantlywithout an increase in the production capacity. Frequent shutdowns of the plant were observeddue to severe membrane fouling. The membrane was cleaned with different chemical solutions todissolve the deposits from the membrane surface. To achieve high cleaning efficiency, the flowrate of desalinated water and total dissolved salts (TDS) were studied.
Key Words: Reverse osmosis (RO); desalination; groundwater; fouling.
is the key step in designing the plants to avoidmembrane fouling and scaling1. At the present time,pretreatment technology is divided intoconventional pre-treatment and non-conventionalpre-treatment. Conventional RO pre-treatment hasbeen widely applied for sea and ground water ROplants to achieve the expected quality of feed waterto the RO membrane. But with the deterioration offeed waters and the consideration of the lessefficient conventional system, an increasing numberof plant owners were considering the use ofmembrane based pretreatments3.
Iron is found in surface and ground watersat varying concentration levels, usually up to 3–4mg/l and in some cases up to 15 mg/l4. Sharma ; etal., found that when present, even at lowconcentrations it can be linked to aesthetic andoperational problems such as bad taste and color,staining, as well as deposition in the waterdistribution system leading to incidence of highturbidity5. Also, iron promotes the growth of certain

24 ALY et al., Curr. World Environ., Vol. 7(1), 23-32 (2012)
types of chlorine-tolerant microorganisms in waterdistribution systems, thus causing increased costsfor cleaning and sterilizing systems in addition toodor and taste problems. The highest permitted limitof iron concentration for drinking water is 0.2 mg/l6.
Chemical cleaning of membrane meansremoving impurities by means of chemical agents.The first step of chemical washing is findingappropriate materials as cleaning agents. Thisdepends on feed composition and precipitatedlayers on the membrane surface and in most casesis performed using a trial and error method7. Thecleaning agents must be able to dissolve most ofthe precipitated materials and remove them fromthe surface of membrane with no surface damage8.
The FilmTec Corporation wasestablished in 1977 with the introduction of theFILMTEC FT30 reverse osmosis membraneswhich was the first commercially viable thin-filmcomposite polyamide membrane for brackishwater treatment. The FilmTec Corporation waspurchased by the Dow chemical company in 1985,a move that merged Dow’s sales and marketingstrength and expertise in polymer and membraneresearch with FilmTec’s membrane research,manufacturing and technical service resources9.This paper includes evaluation to compareperformance results during operation andoperating cost of conventional media filtration,which is one of the most important decision-makingbases for choosing feasible pretreatment methods.
Raw Water CharacteristicsThe raw water coming from two wells
contains ca. 2 g/l total dissolved solids,predominantly chloride and sodium ions. Theincrease in the salinity represents only dissolvedsalts. Iron and manganese often occur together ingroundwater but manganese usually occurs inmuch lower concentration than iron. Both iron andmanganese are readily apparent in drinking watersupplies. The highest permitted limit of ironconcentration for drinking water is 0.2 mg/l6. Thefeed water temperature is almost ranged in allseasons between 20 and 42°C. Raw water analysisby an Atomic Absorption Spectrometer (PerkineElmer Flame AAS 3110) is presented in Table1.
RO Plant CharacteristicsThe feed water is supplied with two feed
pumps with a specification: stainless steel 304, 20m3/h – 5 bar max, kw 5.5, IP 55, class F. Feed waterpumps are followed by dual media filter vessel. Thisvessel constructed of a fiberglass reinforcedpolyester resin for standard water conditioning usewith specific size (diameter 13 inches (330 mm)and height 54 inches (1372 mm)), maximumoperating pressure 150psi (10.34 bars), maximumoperating temperature 120o F (48o C), bed capacityin liters is 105 and the top opening of this vessel is2½ inches. Dual media filter vessel has two layersof filtration media – typical design includesanthracite10, with effective size: 0.6-0.8 mm, sand11,0.45-0.55 mm, and/or gravel, 2.0-3.0 mm, Table 2.
The vessel which used as media filter iscontrolled by automatic head conditioning controllerthat is a simple mechanical design, two valve bodydesigns, one for downflow regeneration and onefor upflow. Head controller has a choice of 7 or 12-day time clock or demand regeneration with eithermechanical or electronic meter. The continues flowrate up to 20 gpm with regeneration time availableup to 120 minutes and mounting base 2½ inches.
The high pressure pump with aspecification: stainless steel 304, 20 m3/h – 17 barmax, k w15, IP 55, HP 20 and class F, supplies thepretreated water to the three membrane pressurevessels (housings) of the RO plant. Each housingcontains one spiral wound polyamide membranes(Filmtec BW30-4040), Table 3. The membranenominal active surface area is 7.6 m2; its permeateflow rate is 9.1 m3/d and the minimum salt rejectionis 99.5%. Two flow meters are present to measurethe in-and-out water of RO plant. Finally, the ROplant was controlled by electrical control panel.
Pretreatment MethodsGranular Media Filtration
Direct filtration, using mono, dual-mediaor mixed-media filtration, is the most commontechnology used for the filtration of seawater priorto the RO system. Filtration depends primarily on acombination of complex physical and chemicalmechanisms, the most important being adsorption.As water passes through the filter bed, the

25ALY et al., Curr. World Environ., Vol. 7(1), 23-32 (2012)
suspended particles contact and adsorb (stick) ontothe surface of the individual media grains or ontopreviously deposited material13. To reach theexpected quality of filtrate, the size, surface charge,and geometry of both suspended solids and filtermedia are the most important parameters that needto be well designed.
Water Desalination Technical Manual(WDTM), Department of the U.S. Army 14, gave thefollowing design parameters for single, dual andmixed-media filtration: 1. Single-media filtration.Single-media filtration consists of one media. Thismedia is often small-grained silica sand; however,anthracite may be used after lime and lime-sodasoftening. Some desalination pretreatment systemsuse an alternate media such as greensand toremove iron and manganese compounds.Diatomaceous earth media is not recommendedfor primary filtration because of its characteristichigh head loss and short run times. 2. Dual mediafiltration. Dual media filtration consists of two mediawith different specific gravities. The differencecreates a two-layer separation effect: The use ofsilica sand or greensand for one layer; or the use ofanthracite for the other layer. The use of dual mediawill allow larger quantities of material to be filteredand will reduce head loss during operation. Theuse of two media types will provide a good coarse-to-fine filtration process for desalination facilities. 3.Mixed-media filtration. When three media are usedin filters, a better coarse-to-fine filtration pattern canbe obtained. High density silica sand, garnet, andanthracite are commonly used to provide the filterbed. The different media do not stratify completely.Instead, there is a small amount of intermixingamong the different layers. This gradual change inmedia size provides a gradient from coarse to fineand creates a media flow pattern necessary toachieve a very low silt density index.
In this case, Dual media filter have twolayers of filtration media – typical design includesanthracite, sand and/or gravel, Table3. The depthof the filter bed is typically a function of the mediasize and follows the general rule-of-thumb that theratio between the depth of the filter bed (l - inmillimeters) and the effective size of the filter media(d
e - in millimeters), l/de, should be higher than 1500.For example, if the effective size of the anthracite
media is selected to be 0.6 to 0.8 mm, the depth ofthe anthracite bed should be at least (0.6 mm ×1500= 900 mm to 0.8 mm × 1500= 1200 mm, i.e.,0.9-1.2 m)15.
In comparison to single sand filter media,dual filter media with anthracite over sand permitmore penetration of the suspended matter into thefilter bed, thus resulting in more efficient filtrationand longer runs between cleaning. Periodically,when the differential pressure increase betweenthe inlet and outlet of the pressure filter is 0.3–0.6bar, and about 1.4 m for the gravity filter, the filter isbackwashed and rinsed to carry away the depositedmatter. Backwash time is normally about 10-120min. Before a backwashed filter is placed back intoservice, it must be rinsed to drain until the filtratemeets the specification16.
Last, to protect the RO membrane fromthe breakthrough particles from media filtration,cartridge filters are usually recommended in thelast step of a pre-treatment sequence. The pore sizefrom 1 to 20 µm can be used based on differentproduced water quality from media filtration14.In this case, we used cartridge filter with pore size 5µm and length 20 inches. After filtration throughthese filters, the turbidity reduced from 3.87 NTU to0.24 NTU.
Scale InhibitionScale inhibitors (antiscalants) can be used
to prevent or control scaling. There are generallythree different types of scale inhibitors: sodium hexa-metaphosphate (SHMP), organophosphonates andpolyacrylates. According to FILMTEC ReverseOsmosis Membranes Technical Manual 17, SHMPis inexpensive but unstable compared to polymericorganic scale inhibitors. Hydrolysis of SHMP willnot only decrease the scale inhibition efficiency,but also create a calcium phosphate scaling risk.Therefore, SHMP is generally not recommended.Organo-phosphonates are more effective andstable than SHMP. They act as anti- foulants forinsoluble iron, keeping them in solution.Polyacrylates (high molecular weight) are generallyknown for reducing silica scale formation via adispersion mechanism. Dosage rates on allantiscalants should be based on the antiscalantmanufacturers. Overdosing should be avoided to

26 ALY et al., Curr. World Environ., Vol. 7(1), 23-32 (2012)
make certain that no significant amounts of cationicpolymers are present when adding an anionic scaleinhibitor18.
In this case study, injection of antiscalanthas done by chemical dosing pump (5 liters/7bars).Feed water pH was reduced from 6.78 to 6.52 by theeffect of Permatreat 510 antiscalant which is amixture of polymers and phosphonates. Thisantiscalant is specifically developed for groundwaterwith a high content of silica, and it is also effectivewith respect to precipitation of calcium salts(carbonate, sulfate and fluoride) and the fouling ofiron (iron reduced from 3.8 mg/l to 3.12 mg/l).
pH AdjustmentAcidity (pH) adjustment is an efficient way
to control scaling. By adding H+ as acid, theequilibrium can be shifted to keep salts dissolved.Adjustment chemicals to the pH include carbondioxide, sulfuric acid, and hydrochloric acid. Carbondioxide should not be used for pH adjustment oflime addition systems due to scaling problemassociated with lime pretreatment. Sulfuric acid iseasier to handle and in many countries morereadily available than hydrochloric acid; however,additional sulfate is added to the feed stream,potentially causing sulfate scaling13.
In this case, it should be known that thepH is always changed significantly and the pH mustbe returned to a neutral state for the final producedwater. At the beginning of the study, sulfuric acid isused. However, membrane fouling was observed.In order to stopping this fouling, the acid was thenswitched to hydrochloric for the remainder of thestudy. After the switch from sulfuric to hydrochloricacid, the plant worked very well, and the fouling isnot observed according to standard permeate flowrate (27.3 m3/d) and TDS (50 mg/l).
Iron Removal StrategiesIron, usually presents in groundwater as
divalent ion (Fe2+) and is considered as source ofmembrane scaling. The main target in our casestudy is the removal of iron in groundwater beforepassing through reverse osmosis membranes aspretreatment technique to avoid membrane fouling.Take in account that the antiscalant feeding beforemembranes is effective with respect to precipitation.It reduces iron concentration from 3.8 mg/l to 3.12
mg/l, but this iron level is still the main source ofmembrane problems.
In this case, various treatment methodshave been employed to enhance water quality byremoving iron.
Oxidation ProcessesAlternative processes have been
proposed in order to facilitate the operation and toallow the removal of high amounts of iron in thepresence, or absence, of dissolved organic matter.In both cases, a pH adjustment is necessary tomaintain iron in the dissolved state to avoidmembrane fouling.Ferrous iron is oxidized in airaccording to the following reaction:
Fe2+ + (1/4) O2 + H+ ”! Fe3+ + (1/2) H2O ...(1)
Potassium Permanganate and Depth FiltrationConventional treatment for iron removal
from groundwater consists of oxidation and depthfiltration. Oxygen or stronger oxidants, such aspotassium permanganate (KMnO4), are generallyused for Fe 2+ oxidation. The solid products ofoxidation (FeOOH.H2O) are then filtered through agranular bed, commonly green sand19. Thepotassium permanganate dose applied must becarefully controlled to minimize any excess passinginto supply which could give a pink color to thewater. Potassium permanganate oxidation tends toform a colloidal precipitates which may not be wellretained by the filters.
Chlorine and Depth FiltrationThe removal of iron along with chlorination
step and appropriate dose of chlorine will bediscussed. In particular membrane fouling causedby oxidized particles, was assessed in depth withvisualization of the membrane surfaces. As shownin Fig.1, the removal efficiency of dissolved ironincreased very rapidly and reached nearly 100%within 20 minutes with the appropriate dose ofchlorine, 2.75 mg/L. With a higher dosage ofchlorine 2.75 mg/L, there was no significantincrease in the removal of metal ions but moreserious membrane fouling occurred. The use ofchlorine may be inadvisable when treating waterscontaining organic substances due to the possibilityof disinfection byproducts (DBPs) formation.

27ALY et al., Curr. World Environ., Vol. 7(1), 23-32 (2012)
Manganese GreensandAn alternative filter media is manganese
greensand20, formed by treating greensand(glauconite), which is a sodium zeolite, withmanganous sulphate followed by potassiumpermanganate. Mn-greensand removes solubleiron by a process of ion exchange, frequently withthe release of hydrogen ions. The process istherefore pH dependent, being virtually ineffective
below pH 6.0 and very rapid at pH values above7.5. When the Mn-greensand is saturated it isregenerated by soaking the filter bed with weakpotassium permanganate solution. This procedureoxidizes iron on the surface of Mn-greensandthereby reactivating the exchange sites. It isreported that the exchange capacity is 1.45 g of Fe/l of Mn-greensand and that 2.9 g of potassiumpermanganate (as a 1% w/v solution) per liter ofMn-greensand is required for regeneration21.Alternatively, potassium permanganate iscontinuously applied to the bed by dosing it at thefilter inlet, which maintains Mn-greensand activeand catalyses the oxidation reaction. Mn-greensandthen acts as a filter medium in addition to catalyticoxidation of any residual soluble manganese andis usually capped with a layer of anthracite to achievelonger filter runs. Operating the bed after oxidationcapacity is exhausted will reduce its service lifeand may cause stain.
Oxidation and MicrofiltrationThis treatment is similar to the conventional
one except that depth filtration is replaced bymicrofiltration (MF). The expected advantage of thistreatment is to have a compact separation unit whichproduces high quality water from a wide range ofraw water quality. In the present study the MF ofiron oxide suspensions is removed22,23.
Table 1. Groundwater Composition
Ca++, mg/l 107Mg++, mg/l 72Na+ , mg/l 406K+, mg/l 8Mn++, mg/l 0.62Fe++, mg/l 3.8SiO2, mg/l 8.33HCO3, mg/l 199Cl–, mg/l 737SO42–, mg/l 297NO3
–, mg/l 7.66F–, mg/l 0.04pH 6.78Turbidity, NTU 3.87Temperature, ºC 20-42Conductivity, µS/cm 2677TDS, mg/l 1938
Table 2. Pretreatment Media Specifications
Color Sand and Anthracite Activated Manganesegravel carbon greensand
Light tan Black Black Blackto reddish
brown
Mesh size 18x35 14x30 12x40 16x60Effective size, mm 0.45-0.55 0.6-0.8 0.55-0.75 0.30-0.35Bulk Density, lbs./cu. Ft. 100 50 31 85Bed depth, inch 18-30 24-36 26-30 30Freeboard of bed depth,% 50 50 50 50Backwash flow rate, 15-20 12-18 10-12 10-12gpm/sq. ft.Backwash bed xpansion 20 20-40 30-40 40of bed depth, %Service flow rate, gpm/sq.ft. 1.5-2 5 5 3-5

28 ALY et al., Curr. World Environ., Vol. 7(1), 23-32 (2012)
Table 3. Filmtec BW30-4040 Specifications 12.
Membrane type Polyamide thin film compositeMax. operating temperature, oF (oC) 113 (45)Max. operating pressure, psi (bar) 600 (41)Max. feed flow rate, gpm (m3/h) 16 (3.6)Active area, ft2 (m2) 82 (7.6)Applied pressure, psig (bar) 225 (15.5)Permeate flow rate, gpd (m3/d) 2400 (9.1)Stabilized salt rejection, % 99.5Pressure vessel diameter, inch 4Pressure vessel length, inch 40Free Chlorine Tolerance, ppm <0.1
Table 4. Amberlite IR120Na Data Sheet 25.
Matrix Styrene divinylbenzene copolymerFunctional groups SulphonatesIonic form Na+Total exchange capacity ≥ 2.0 eq/LHarmonic mean size 600-800 µmMinimum bed depth 700 mmService flow rate 5 to 40 BV/hRegenerant NaClLevel (g/L) 80-250Concentration (%) 10Minimum contact time 30 minutes
Fig. 1. Removal efficiency of iron through 60 min. at different chlorine dosages.

29ALY et al., Curr. World Environ., Vol. 7(1), 23-32 (2012)
Finally, under certain conditions, thepresence of free chlorine and other oxidizingagents, in the oxidation processes, will causepremature membrane failure. Since oxidationdamage is not covered under warranty, FilmTecrecommends removing residual free chlorine andother oxidizing agents by another suitablepretreatment prior to membrane exposure24.
Ion exchange resinIon exchange resins are able to remove
many inorganic metal ions from groundwaterincluding iron. In this case, Amberlite IR120Na,strong acid cation exchanger was used, Table 4.
Ion exchanger was carried out in a vesselconstructed of a fiberglass reinforced vinylesterresin for standard water de-ionizing use withspecific size (diameter 13 inches and height 54inches), maximum operating pressure 150psi(10.34 bars), maximum operating temperature 150o
F (66oC), bed capacity in liters is 105 and the topopening of this vessel is 2½ inches. The totalhardness concentration averaging 528 mg/L waspassed through sodium charged strong acid cationexchange resin to reduce the hardness to less than5 mg/L. Amberlite IR120Na, also treat with othermetal ions like iron and so, the total exchangecapacity is become smaller. The resin was thenregenerated using commercially available extracoarse water-softening salt (NaCl). This processwas repeated several times to demonstrate that noirreversible fouling had occurred to resin.
Granular activated carbonActivated carbon 26 is prepared from a
char form material such as almond, coconut, andwalnut hulls, other woods, and coal. Activatedcarbon has the strongest physical adsorption forcesor the highest volume of adsorbing porosity of anymaterial known to mankind. It is a highly porousmaterial; therefore, it has an extremely high surfacearea for contaminant adsorption27. The objective ofthis topic was to determine the effectiveness ofgranular activated carbon (GAC) in removing ironfrom the groundwater. From these advantages forgranular activated carbon, in this case study, weused a single-media filter, Table3. The depth of theGAC media is estimated based on the averagecontact time in this media, which is recommended
to be 10 to 12 min. For example, if a filter is designedfor a surface loading rate of 4 m3/m2 h, the depth ofthe GAC media should be at least 0.66 m (4 m3/m2
h ×10 min/60 min per h=0.66 m to 4 m3/m2 h ×12min/60 min per h=0.8 m, i.e., 0.66 0.8 m)15. For thefollowing reasons28, we used the granular activatedcarbon in the adsorption of ferrous.
The van der Waals force that formsmultilayer adsorption was overcome by theadsorbate due to the high ambient temperature 29.With relatively high room temperature of about 30oCwhere the adsorption process occurs, thechemisorption was more dominant as compared tothe physisorption. The relatively high roomtemperature cause the chemical bond to occursbetween the metal ions. Furthermore desorptionwill also occur between adsorbate and activatedcarbon at high temperature which physicallybonded by the van der Waals force. Adsorbateswhich are physically adsorbed onto activatedcarbon receive sufficient energy from such hightemperature to overcome the van der Waals force.
Activated carbon has high adsorptioncapacity for Fe(II) as compared to others. This mayrelate to adsorbate characteristics in terms ofelectronegativity. The electronegativity of Fe(II) is1.8 . In fact, electronegativity is a measure of strengthfor element to attract electron. In this case, it wouldmeasure the strength of Fe(II) attach to negativecharge at activated carbon surface. According toprevious literature30, higher electronegativitiescorresponded to the higher adsorption levels ofmetal ions onto the GAC.
Another factor that contributes to differentGAC adsorption capacity on metal ion is ionicradius. Fe(II) has relatively smaller ionic radius thanthat of the others since Fe(II) has the higher attractivecharge in nucleus on the electron orbital 29. Thesmaller ionic radius of Fe(II) makes it easier topenetrate into the micropores of the GAC.
There were four major functional groupson the surface of activated carbon which arecarboxyl, carbonyl, hydroxyl, and lactonizedcarboxyl31. All these four functional groups werepromoted to attract cation to it and ion exchangewould occur. Therefore, the Fe(II) which has positive

30 ALY et al., Curr. World Environ., Vol. 7(1), 23-32 (2012)
charge would react and attach onto GAC surface’sfunctional groups with chemically bonded. However,the actual chemical reaction between the metal ionand functional groups on the activated carbonsurface was complex and difficult to understand.
In the case of iron, oxidation is followedby settling and filtration or filtration alone,depending on the concentration of iron in the water.In the presence of turbidity (and color) and whenthe Fe(II) concentration is greater than about 5 mg/l, settling or flotation would be assisted by acoagulant and/or a coagulant aid. Direct filtration isused when the iron concentration is less than about5 mg/l 32.
Post-treatment strategiesPost-treatment1 is limited to injection of
lime to increase the pH from 6.52 to 8.0 and chlorinefor disinfection.
Lime Post-treatmentLime has been added to neutralize the
final produced water. For excess lime injection, it isnecessary to raise pH to approximately 8. The highpH level produces good disinfection as a by-productand thus chlorination might be unnecessary aftersuch injection except for a small dose to provideresidual chlorine in the distribution system.Carbonation is necessary to remove the excesslime and reduce the pH after treatment.
DisinfectionGroundwater may be contains
microorganisms such as bacteria, algae, fungi, andviruses, which can cause serious biological fouling.There are various methods to prevent and controlbiological fouling such as the addition of chemicaloxidants (chlorine, bromine, iodine, or ozone),ultraviolet irradiation, biofiltration to removenutrients, and the addition of biocide. Because ofthe risk of oxidation of the membrane, the use ofoxidants must be monitored carefully to keep thechlorine well below 0.1 mg/L of free chlorineresidual. Sometime dechlorination upstream of themembranes is required through sulfite compoundaddition or passage through granular-activatedcarbon 18.
World Health Organization (WHO)33
considers: ‘it has been demonstrated that virus-freewater can be obtained from faecally polluted sourcewaters’ if the following chlorine disinfectionconditions are met.
The water has a turbidity of 1Nephelometric turbidity unit ( NTU) or less, Its pH isbelow 8.0, A contact period of at least 30 minutes isgiven; and, The chlorine dose applied is sufficientto achieve at least 0.5 mg/l free residual chlorineduring the whole contact period.
Sodium hypochlorite (NaOCl) was usedin our case study and the injection of hypochloritehas done by chemical dosing pump (5 liters/7bars)in dosage 1 mg/l. Typically iron should be less than0.2 mg/l. If at the point of chlorine application, theirlevels are too low to justify disinfection, the dosemust take their demand into account.
Membrane cleaningThe fouling of RO elements is unavoidable
with long-term operation. They can be fouled bybiological matter, colloidal particles, mineral scale,and insoluble organic constituents. Deposits buildup on the membrane surfaces during operation untilthey are causing loss in normalized permeate flow(product flow rate) and/or loss of normalized saltrejection [total dissolved salts (TDS)]. Elementsshould be cleaned whenever the normalizedpermeate flow drops by ≥10%, or the normalizedsalt passage increases by ≥10%, or the normalizeddifferential pressure (feed pressure minusconcentrate pressure) increases by ≥15% from thereference condition established during the first 48h of operation. Cleaning procedures are usuallygiven by the membrane manufacturers17.
In this case, the maximum operatingpressure required is 15.5 bar and maximumpressure drop is 1 bar increased to 16.5 and 1.5bar,respectively, without an increase in the standardpermeate (flow rate 27.3 m3/d and TDS 50 mg/l).Frequent shutdowns of the plant were observeddue to membrane fouling (permeate flow rate is18.7 m3/d and TDS is 580 mg/l).
In this case, both acidic and alkalinecleaners can be used. Acid cleaning to removemineral scale was done at pH 2 or lower with 0.2%

31ALY et al., Curr. World Environ., Vol. 7(1), 23-32 (2012)
(W) hydrochloric. Citric acid can also be used in thesame concentration. Alkaline cleaning to removeorganic fouling was done at pH 12, generally donewith 0.1% (W) sodium hydroxide 24,34. After resolvingthe fouling problem, membranes are cleaned withthe first option given by the manufacturer every sixmonths and the cartridge filters are replaced everythree months1.
CONCLUSIONS
In our case study iron was removed ingroundwater before passing through reverseosmosis membranes as pretreatment technique toavoid membrane fouling. Different pretreatmenttechniques are done to remove iron and save themembrane.
Many processes affecting the iron removalfrom the groundwater are applied in this case study.From the performance comparison between
conventional and specific pre-treatment methods,we concluded that, every applied method hasadvantages and disadvantages in application. Themost suitable pretreatment technique for ironremoval (concentration less than 5 mg/l) is agranular activated carbon (GAC) filter which hashigher adsorption capacity and leads to lowoperating cost.
ACKNOWLEDGMENTS
The authors express their appreciation toProf. Dr. Naglaa Ali and Prof. Dr. Yasser Moustafa,Egyptian Petroleum Research Institute (EPRI), fortheir assistance and revision of this paper. Also, theauthors wish to acknowledge the assistance andsupport of this study by Eng. Mohamed Amer,General Manager of Water Engineering TechnologyCo. (WETCO), which agent for each products ofJacobi Carbon, Clack and DOW.
REFERENCES
form no. 2354, replaces form 1785, Part no.A8029, 3 (2011).
11. Clack Corporation, Filter sand and graveldata sheet form no. 2352, replaces form 1824,Part no. A8071, 3 (2011).
12. Filmtec Reverse Osmosis Membranes,BW30-4040, Technical bulletin 609-00350-804
13. Chua K.T., Hawlader M.N.A. and Malek A.,Desalination , 159: 225, (2003).
14. Headquarters, Department of the Army,Washington, D.C., Water DesalinationTechnical Manual, (1986).
15. Voutchkov N., Desalination , 261: 354,(2010).
16. Voutchkov N.and Dietrich J., Pilot testingalternative pretreatment systems forseawater desalination in Carlsbad,California, Proceedings of World Congressin Desalination and Reuse, InternationalDesalination Association, SP05-095,Singapore, 11-16, (2005).
17. Filmtec Reverse Osmosis Membranes
1. Arras W., Ghaffour N., Hamou A.,Desalination 235: 170, (2009).
2. Bodalo-Santoyo A., Gomez-Carrasco J.L.,Gomez-Gomez E. and Montesinos A.M., ,Desalination ,160 : 151, (2004).
3. Wolf P.H., Siverns S.and Monti S.,Desalination, 182: 293, (2005).
4. Ellis D., Bouchard C. and Lantagne G.,Desalination . 130: 255, (2000).
5. Sharma S.K., Kappelhof J., GroenendijkM.and Schippers J.C., J. Water Supply Res.Technol., 50: 187, (2001).
6. EC-Official Journal of the EuropeanCommunities Council Directive 98/83/EC L.330: 32, (1998).
7. Madaeni S.S., Mohammadi T. andMoghadam M.K., Desalination 134: 77,(2001).
8. Lindau J.and Jonsson A.S., J. of MembraneScience 87: 71, (1994).
9. Redondo J.A. and Lomax I., Desalination,110 : 167, (1997).
10. Clack Corporation, Anthracite data sheet

32 ALY et al., Curr. World Environ., Vol. 7(1), 23-32 (2012)
Technical Manual,( 2004).18. Prihasto N., Liu Qi. and Hyun Kim S.,
Desalination, 249: 308, (2009).19. Lessard C., Ellis D., J. S &odes and C.
Bouchard, Environment, 32, (1999).20. Clack Corporation, manganese greensand
data sheet form no. 2349, replaces form 1564,Part no. A8041, 3, (2011).
21. Benefield, L. D. and Judkins, J. F. ,ProcessChemistry for Water and WastewaterTreatment. Prentice-Hall (1982).
22. Mourato D. and Smith C., Proc., 6th Workshopon Drinking Water, AQTE, Montr6al, 705-716,( 1994).
23. Cote P., Mourato D. , C.Gungerich, Russell J.and Houghton E., ISWA Conference,Membranes in Drinking and Industrial WaterProduction, Amsterdam ( 1998).
24. Filmtec Reverse Osmosis MembranesTechnical bulletin 609-22010/CH172-086-E.
25. Rohm and Haas Amberlite IR120Na, PDS0210 A.1997.
26. Clack Corporation, Activated carbon datasheet form no. 2348, replaces form 1795 &1564, Part no. A8009-12, 3, (2011).
27. Cheremisinoff N.P., Handbook of Water andWastewater Treatment Technologies,Butterworth-Heinemann, Boston, USA, 138:
140, ( 2002).28. Ahmad bin Jusoh, Cheng W.H., Low W.M. ,
Ali Nora’aini and Megat Mohd Noor M.J.,Desalination, 182: 347, (2005) .
29. Tam Y.K., Studying on Removal of Dye UsingGranular Activated Carbon, ScienceEngineering Department, Kolej University ofScience and Teknology Malaysia ( 2003).
30. Rockstraw D.A. and Dastgheib S.A., Carbon,40: 1843 (2002).
31. Keneth E.N. and Chang H.T., Effect ofSurface Functional Groups on the Coefficientof Freundlich Isotherm, Department ofChemical and Environmental Engineering,Illinois Institute of Technology, 1999, http://www.chee.lit.edu/ chang/index.html,Accessed 18 April ( 2004).
32. Ratnayaka Don D., Malcolm J. Brandt andMichael Johnson K., Water Supply (SixthEdition), CHAPTER 10: Specialized andAdvanced Water Treatment Processes, 365:423, (2009).
33. WHO ,Guidelines for Drinking-Water Quality,Vol. 1, Recommendations. 2nd Edn (1993).
34. Filmtec Reverse Osmosis MembranesTechnical bulletin 609-24010/CH172-120-E.

INTRODUCTION
The population of student learning Englishas a foreign language has been steadily increasingfrom year to year. To succeed in college, thesestudents must develop not only linguistics, but alsoacademic skills. These skills involve using Englishto acquire and articulate knowledge by readingacademic texts, writing acceptable academic prose,conducting and reporting research. In Indonesia,English is taught in schools since the students goto Junior high schools. However, many of them donot know how to speak and write English for somereasons. Some people from educational field saidthat the curriculum need to be changed, includingthe purpose of teaching them English, the textbook,and the methods. To meet the students’ academicneeds and help them develop strong Englishlanguage skills, there are a number of ways needto be applied. One of the techniques to improving
Current World Environment Vol. 7(1), 33-36 (2012)
Multimedia: A Technique inTeaching Process in the Classrooms
ASHVINI JOSHI
Sri Satya Sai College of Engineering, Bhopal (India).
(Received: March 20, 2012; Accepted: May 27, 2012)
ABSTRACT
One of the techniques to improving the students’ meets the academic needs and helpsthem developing English language skills is providing multimedia during the process of teachingand learning in the classroom. Multimedia classroom provide the students chances for interactingwith diverse texts that give them a solid background in the tasks and content of mainstreamcollege courses. The writing aims to find out some advantages of the use of multimedia in theclassroom. Also, the involvement of technology in the classroom can not denied giving positivepoint to improving the quality of teaching and giving more various techniques in teaching a foreignlanguage. The research uses a qualitative method giving a deeply description using multimedia inthe classroom. The difference between a traditional classroom and multimedia classroom hasbeen drawn in this writing. The writing shows that there are some advantages in teaching Englishusing multimedia as a technique in teaching process in the classroom. Through the media theteacher could give more opportunity to students to express their opinions and enjoy during thecourse. The highly presence and motivation also bring positive aspects to students so that theycan improve their skills.
Key words: Multimedia, Technology, Classroom.
the students is using multimedia in the process ofteaching and learning in the classrooms. Multimediause in classroom will provide opportunity forinteracting with diverse texts that give students asolid background in the tasks and content ofmainstream college courses. Furthermore, becauseeducational technology is expected to become anintegral part of the curriculum, EFL students mustbecome proficient in accessing and using electronicresources. This article describes the method thatcould help the students to develop their skills inEnglish through multimedia: print text, film, video,radio, computer, and Internet. As students, they mustbe dealt with the subject found in resource material;also they are able to choose the resources thatbest suitable the points they wish to make. However,the courses are not included research skills, makingresearch reports to challenging their Englishlanguage skills.

34 JOSHI, Curr. World Environ., Vol. 7(1), 33-36 (2012)
Multimedia ClassroomThe time it takes to earn the degree in
education today is based on an increasinglyoutdated model: so many hours in a classroomentitle a student to a receipt in the form of a grade,and so many receipts can be redeemed for acredential in the form of a degree... Education todayis just beginning to think of shifting the basis ofcertification from time served to skills andknowledge obtained.
Traditionally classroom situation isteachers stand in front of the students, givingexplanations, informing, and instructing. Theyusually use chalk to write something on theblackboard. These technique needs slightly to bemodified regarding with the development of thetechnology. The using of multimedia in classroomcannot be denied anymore. That will make possiblefor teachers giving more opportunity to studentsbeing happier and more enjoy during the course.Traditional classrooms have different settings fromthe multimedia classrooms. Students seat in rowsand a chalkboard in the front. The teacher isstanding in front of the class giving a lecture.Compared with traditional classrooms, multimediaclassrooms setting differ greatly from traditionalclassrooms. Traditional classrooms have the seatsin rows and a chalkboard in the front. In themultimedia classrooms, students’ seat can bemodified according to the situation needed. Insidethe classrooms, all the equipment is available andmakes the students feel comfortable to study. Theysit at wide tables in comfortable chairs and haveplenty of room to spread work. Furthermore, theyalso have the opportunity to move the furniturearound for group discussions. A large teachingstation is located at the front and to one side of theroom. Inside the station cabinet there are controlsfor the rooms built – in equipment. The use ofmultimedia described here makes use of print texts,film and Internet to develop and enhance linguisticsand knowledge. Through their interactions withmultimedia texts on topic of interest, studentsbecome increasingly familiar with academicvocabulary and language structures. As they pursuesustained study of one content area through focusdiscipline research, the students become activelyengaged in the process of meaning constructionwithin and across different media. Working though
the complex intermingling of meanings, embeddedwithin different texts encourages students to makeconnections as they build a wider range ofschemata, which are then available to help themgrasp future texts. Using print, film and Internet asresources for studying provides students withopportunities to gather information through stimulithat will stimulate their imaginations, engage theirinterest and introduce them to the raw materials foranalysis and interpretation of both language andcontext. Students develop solid foundation inseveral subject areas and become “content experts”in one. Thus they greatly increase their overallknowledge base, as well as their English languageand critical literacy skills, facilitating theirperformance in future college courses. Althoughvarious studies support the application ofmultimedia in the classroom, Liu, Jones and Hemstreet (1998) point out that the design of multimediais useful when technology is to have any effect onlearning. One of the main purposes of software inwriting is to facilitate the development of academicwriting skills for students through the use of theobjects matter for writing assignments. The programis presented as a simulation game to interest andmotivation. Students using the program foundthemselves in the virtual world of education.
The Computer InternetComputer technology has given us
Internet, which has various uses. Dealing witheducation, Internet presents the students a widerange of collection of English language texts inmany discipline departments. Before the generaluse of computers in colleges and universities toteach writing, students met in a traditional classroomand were taught to write standard essay. Instructionwas personified commonly by the teachers standingbehind a lectern or by the teacher marking errorson student texts (Blair, 1997). With the rapidproliferation of the personal computer, manyinstitutions of higher education created“computerized writing courses” emphasizing wordprocessing skills and collaborative critiquing;believing that using the technology “democratizesthe classroom discussion, allowing students totranscend the limits of the traditional Computertechnology has given us Internet, which is anelectronic medium in which both print and visualresources are invariably bound. At the click of a

35JOSHI, Curr. World Environ., Vol. 7(1), 33-36 (2012)
mouse, text resources present students with adiverse collection of authentic English languagetexts dealing with a wide variety of interdisciplinarytopics, and at each web page link, students havethe advantage of reading print texts with the benefitof immediate visual reinforcement provided bypictures and slide shows, facilitating thecollaborative effects of print and visual informationprocessing. Integrating the Internet yields theadditional benefit of increased student motivation.Students are eager to begin class and often arriveearly at the computer lab, logging on to the Internetand beginning research on their own. They alsooften stay after class to continue working on theInternet. Overall, students develop greaterconfidence in their ability to use English becausethey need to interact with the Internet entirelythrough reading and writing. Using the Internet forfocus discipline research not only teaches higherorder thinking skills, but also promotes critical andsocial literacy as students encounter a variety ofinformation, synthesizing that information throughcooperation and collaboration with their peers.Members of focus discipline groups generally formstrong multicultural friendship fostered by theircollaborative efforts throughout the semester.However, the general uses of computers are rarelyfound in traditional classroom. For instance,students attend the regular classes that were taughtto write the standard essay. With the technologyuse, the students do not only literate the ability toread and write but also to be able to understandmusic, video, hypertext and networkedcommunications. Whitaker (1995) points out clearlythat technology as something to expand humanpotential rather than substitute for it and whichenhances the thought process rather thancripples it.
The Print TextThe Print text used in presenting students
with sophisticated reading that contains cognitivelydemanding language and introduces a wide rangeof vocabulary. However, these texts may be difficultto understand. This is suggested to present inprinted and visual text. By reading print texts willthe benefit of immediate visual provided by picturesor slide show. In writing class of using multimedia,students watch the selected video novel. Afterwatching students are asked questions about the
video and assigned essay topics, then divided intobrainstorming groups. They discuss and developthe topics in their group. They then make roughdraft before presenting in front of other groups. It isobviously that in the multimedia classroom studentsare engaged to learn how to brainstorm, how touse groups for draft and how to critique otherpresentations .However, to benefit from the Internet,the students have to learn to navigate and thenevaluate the information found there. The studentsmust know how to use search engines, webbrowsers, and met sites evaluate information interms of its validity and reliability, as well as itsrelevance to the topic (Carlson, 1995). Therefore toguide the students in determining whether anInternet source is reliable and credible, studentsshould consider the source and time frame, as wellas the evidence supporting the informationprovided. As the students become morecomfortable surfing the Internet, they discover it canbe used to develop not only content area knowledgebut also to improve their language skills. They knowhow to compose an essay, using information fromthe sources they have found in the Internet; alsothey learn how to cite references in a bibliography.
A study conducted by Kasper (1997)illustrate that teaching English using multimediasuch as print, film, video, Internet to studentsencourage them to write a critical analysis onassignments. Overall, the students’ achievementincreased significantly. 92 % of the students passedon departmental reading and writing examinations.In addition, their feedback on discussions is verypositive. They express confidence in their ability touse English. They attribute this improvement to themultimedia model that the texts teach them Englishand provide helpful information in other coursesand the film and Internet help them make materialeasier to understand because they see, hear, andread about the topic.
The FilmFilm can be used to provide a visual
material. The students can read a print text andwatch the film later, according to Kasper and Singer(1997), the film can clarify comprehension,consolidate concepts and reinforce learning. It isexpected to the students to fully understand bothvisual and verbal comprehension. By watching the

36 JOSHI, Curr. World Environ., Vol. 7(1), 33-36 (2012)
complete film the students expected to understandvarious areas of academic discourse such aspsychology, environmental science and others tobroaden the verbal and written perspective (Kasperand Singer, 1997). A study case from FloridaInternational University (1994), has examined amultimedia classroom, the students watching thevideo novels Tom Jones (the new six part A & Eversion) and The Scarlet Pimpernel (AnthonyAndrews and Jane Seymour). After viewing it, theclass asked questions about the movie andassigned essay topics, to help them the teacherasked the students to brainstorm.
CONCLUSION
Through the interaction with multimedia,the students become increasingly familiar withacademic vocabulary and language structure.Connecting with the Internet will make the benefitof increased student motivation. Students are eagerto begin class and often arrive early at the computerlab, logging on the Internet and beginning researchon their own. They also often stay after class to
continue working on the Internet. Overall, studentsdevelop greater confidence in their ability to useEnglish because they need to interact with theInternet through reading and writing. Usingmultimedia provides the students to gatherinformation through media that encourages theirimaginations, interests. Also it using this technologycombined with the sense of teaching will create asuccessful teaching method.
In our imaginations, we enjoy and valueall the benefits of education on-demand. We wishthe future was here already because deep downinside, we all are lifelong learners. We just wantlearning to be easy, personalized. This vision isinviting, yet we must live and work in present time.And today, the reality stays apart from the dream.The challenge to educators is clear. We must alsoestablish rigorous standards of quality in theproducts, services, and solutions we offer to ouryouth. We must learn how to prepare all of ourstudents for lives that are becoming more and morecomplex. We must prepare our students to masterchange.
REFERENCES
1. Carlson, Earl R. “Evaluating the Credibilityof Sources: A Missing Link in the teaching ofCritical Thinking”, Teaching of Psychology,22(1): 39-41 (1995). City University of NewYork. (1994), Report of the CUNY ESL TaskForce, CUNY: Instructional Resource Center,New York. Kasper, Loretta F. (1997), “TheImpact of Content-Based InstructionalPrograms on the Academic Progress of ESLStudents”, English for Specific Purposes, vol.16. Pp. 309-20. Kasper, Strategies”,PostScript, vol. 16. No. 2, pp. 5-17. ^ RichardAblation, “Goldstein’s Light Works atSouthampton,” Variety, August 10, 1966. Vol.213, No. 12.
2. Eagle Computer, http://en.wikipedia.org/wiki/Eagle_Computer#Multi-Image_models,
retrieved 2010-06-27 3. Multi-Media Becomes Multi-Image, http://
www.avsquad.com/page8/page8.html,retrieved 2010-04-30
4. Vaughan, Stay, 1993, Multimedia: Making ItWork (first edition, ISBN 0-07-881869-9),Osborne/McGraw-Hill, Berkeley, pg. 3.
5. Variety, January 1-7, 1996.6. Stewart, C and Kowalski, A. 1997, Media:
New Ways and Meanings Loretta F andRobert Singer. (1997). “Reading, LanguageAcquisition, and Film (second edition),JACARANDA, Milton, Queensland, Australia.pp.102.
7. Jennifer Story, from Next Online,2002.8. Lynch P., Yale University Web Style Manual,
Http://info.med.yale.edu/caim/manual/sites/site_structure.heml

INTRODUCTION
The quality of drinking water is vitalconcern for mankind since it is directly linked withhuman health. People of rural areas located aroundTirupati are mainly dependent on ground water fordrinking and other domestic needs. Thus, in thispaper an attempt was made to assess the physicochemical analysis of drinking water in the view ofhealth of human beings living in this area.
EXPERIMENTAL
Drinking water of different pollutedlocations at Renigunta area near Tirupati wasstudied during the period from March 2011 to August2011. Electrical conductivity values were measuredusing Elico CM 180 conductivity bridge. Totalalkalinity was evaluated by titration with standard0.1M HCl using methyl orange and phenolphthalein
Current World Environment Vol. 7(1), 37-39 (2012)
Chemical Properties of Drinking Water ofRenigunta Near Tirupati, Andhra Pradesh,
India and its Impact on Human Health
S.V. DORAIRAJU 1, C. NARASIMHA RAO2,M. BUJAGENDRA RAJU2 and P.V. CHALAPATHI1*
1Department of Chemistry, S. V. Arts Degree and P. G. College, Tirupati - 517 502 (India).2Department of Chemistry, S.V. University, Tirupati - 517 502 (India).
(Received: January 25, 2012; Accepted: March 12, 2012)
ABSTRACT
This paper is an attempt to assess the effect of drinking water quality on health of thepeople living in Renigunta, an industrial area near Tirupati, Andhra Pradesh, India. Drinking watersamples were collected from 40 different locations of Renigunta and analyzed for physicochemicalparameters such as pH, hard ness, alkalinity, calcium, magnesium, iron, nitrates, chlorides,sulphates, electrical conductivity, total solids (TS), total dissolved solids (TDS), total suspendedsolids (TSS), dissolved oxygen (DO), chemical oxygen demand (COD) and bio chemical oxygendemand (BOD). The found values of physicochemical parameters were compared with the WorldHealth Organization water quality standards. Study of all these characteristics and correlationstudies indicate that in some of the studied areas water was polluted and not suitable for drinkingpurpose. The drinking water of the area needs some degree of treatment before consumption andprevention steps to be taken from contamination.
Key words: Drinking water, Physicochemical parameters, Electrical conductivity,Total dissolved solids, Hardness.
as indicators1. Standard procedures2-5 involvingspectrophotometry, flame photometry and volumetrywere used for the determination of water qualityparameters. All the chemicals used were of ARgrade.
RESULTS AND DISCUSSION
Most of the waters are slightly alkaline dueto presence of carbonates and bicarbonates. pHbelow 6.5 starts corrosion in pipes, therebyreleasing toxic metals such as Zn, Pb, Cd and Cuetc3. All the sampling points showed pH valueswithin the limit prescribed by WHO.
Hardness of water depends upon theamount of calcium and magnesium salts. Hardnessvalue in the studied area varied between 423-538mg/L. 6 sampling points showed higher hardnessvalues than the prescribed limit by WHO.

38 DORAIRAJU et al., Curr. World Environ., Vol. 7(1), 37-39 (2012)
Table 1: Average results of chemical parameters
Sampling pH Hardness Alkalinity Ca2+ Mg2+ Fe2+ NO3- Cl- SO4
2-
Point (mg/L) (mg/L) (mg/L) (mg/L) (mg/L) (mg/L) (mg/L) (mg/L)
S1 6.7 445 304 118 71 0.39 8 231 146S2 6.8 445 317 124 68 0.27 14 232 157S3 6.9 445 329 126 87 0.45 4.2 232 161S4 7.9 472 432 177 73 0.49 10.5 243 178S5 8 472 437 179 62 0.16 4.8 246 154S6 8.1 483 463 189 72 0.7 3.5 246 169S7 8.1 483 490 192 74 0.71 13.6 249 137S8 8.4 527 531 294 54 0.38 3.8 269 175S9 7.8 467 427 169 66 0.52 6.9 242 174S10 8.2 499 519 208 75 0.45 9.1 262 162S11 8.3 462 520 219 77 0.5 12.5 263 136S12 8.3 517 524 273 80 0.48 14.6 265 180S13 8.4 494 543 306 83 0.61 11 269 175S14 8.4 501 560 319 84 0.48 14.3 271 182S15 8.5 483 580 320 87 0.5 20.1 310 214S16 6.5 440 233 83 58 0.36 11.5 215 190S17 6.6 430 234 84 60 0.44 23 218 208S18 6.7 445 298 107 62 0.42 4.8 230 162S19 6.7 453 304 118 62 0.39 8.5 231 146S20 7 462 387 144 67 0.57 11.6 239 163S21 7.1 445 392 144 68 0.21 6.3 239 171S22 7.2 464 397 159 68 0.43 6.5 240 172S23 7.4 471 406 162 69 0.57 11 240 182S24 7.9 447 429 174 70 0.62 7.4 243 143S25 7.7 483 416 164 69 0.51 10 240 224S26 7.8 472 422 164 70 0.32 18.4 242 170S27 7.8 527 427 169 70 0.52 16.4 242 174S28 6.9 439 329 126 63 0.45 11.5 232 161S29 7 453 378 137 66 0.43 20.8 237 159S30 6.6 448 244 91 61 0.29 22.1 223 189S31 6.7 431 245 92 61 0.38 22.5 227 168S32 6.7 441 296 106 62 0.37 9.6 227 171S33 7.9 524 432 177 71 0.49 10 243 178S34 8 538 437 179 72 0.16 4.2 246 154S35 6.8 454 317 124 63 0.27 14 232 157S36 6.6 445 238 89 61 0.31 8.6 221 163S37 6.5 445 231 81 57 0.25 21.5 214 209S38 6.5 439 218 78 54 0.23 11 210 210S39 6.5 441 229 80 55 0.31 16 211 171S40 8.2 423 501 197 73 0.41 11 251 154WHO 6.5-8.5 500 250 75 50 0.3 45 250 200
Alkalinity is due to the presence ofbicarbonate, carbonate and hydroxide compoundsof calcium, sodium and potassium. Alkalinity itself
is not harmful to human beings4. Alkalinity value inthe studied area varied between 218-580 mg/L. 8sampling point showed alkalinity value within the

39DORAIRAJU et al., Curr. World Environ., Vol. 7(1), 37-39 (2012)
limit prescribed and 32 sampling points showedhigher alkalinity values than the prescribed limit byWHO
Calcium value in the studied area variedbetween 78-320 mg/L. All the sampling points showedhigher calcium values than the prescribed limit byWHO. If calcium is present beyond the maximumacceptable limit causes incrustation of pipes, poorlathering and deterioration of the quality of clothes.
Too high magnesium causes nausea,muscular weakness and paralysis in human bodywhen it reaches a level of about 400mg/L8.Magnesium value in the studied area variedbetween 54-87 mg/L.
DO value in the studied area variedbetween 2.3-5.7 mg/L. 9 sampling points showedhigher DO values than the prescribed limit by WHO.High amount of DO imparts good taste to water.BOD value in the studied area varied between 1.4-3.2 mg/L. All sampling points showed BOD valueswithin the limit prescribed by WHO. Ground waterwith high value of BOD is due to microbial activitiesrelated to the dumpsites.
When electrical conductivity value existsat 3000 µ mho/cm, the generation of almost all thecrops would be affected and it may result in muchreduced yield6. It is considered to be an indicationof the total dissolved salt content10. Conductivityvalue in the studied area varied between 1094-2400 µS/cm. 9 sampling points showed higherconductivity than the prescribed limit by WHO.
CONCLUSION
According to WHO, nearly 80% of all thediseases in human beings are caused by water11,12.The water quality parameters of the various areasof Renigunta, near Tirupati indicates that thedrinking water samples are contaminated and thequality is poor for drinking purpose. After purificationtreatment only this water can be used for drinking.The values of correlation coefficients will help inselecting proper treatment to minimize pollution.Drinking water pollution in the studied area shouldbe controlled by the proper environmentmanagement plan to maintain proper healthconditions of people.
REFERENCES
1. APHA . Standard methods for theexamination of water and waste water (19th
ed) (1996).2. Nagarajan S, Swaminathan M and
Sabarathinam PL, Poll. Res., 12(4): 245.(1993). Washington, DC: Public HealthAssociation.
3. M. Hussain, T.V.D.P. Rao, H.A. Khan and M.Satyanarayan. Orient. J. Chem., 27(4): 1679-1684 (2011).
4. A. Malviya, S.K. Diwakar and S.O.N. Choubey.Orient. J. Chem. 26(1): 319-323 (2010).
5. V. Magarde, S.A. Iqbal, S. Pani and N. Iqbal.Orient. J. Chem. 26(4): 1473-1477 (2010).
6. Trivedy R K and Goel P K, Chemical andBiological Methods for Water PollutionStudies, Environmental Publications, Karad,7: (1986)
7. Surve P R, Ambore N E and Pulle J S, Eco.Env. and Consv., 8(1): 87-90 (2005).
8. M.G. Adak, and K.M. Purohit, Poll. Res., 20:575 (2001).
9. C. H. Srinivas, Ravi Shankar Piska, C.Venkatesan, M. S. Sathya Narayana Rao, andR. Ravinder Reddy, Poll. Res., 19(2): 285(2000).
10. APHA, “Standard methods for theexamination of water and wastewater”,American Public Health Association,Washington D.C.,(1998).
11. G. Dilli Rani, M. Suman, C. Narasimha Rao,P. Reddi Rani, V. G. Prashanth, R. Prathibhaand P. Venkateswarlu, Current WorldEnvironment, 6 (1): 191-193 (2011) .
12. P. Venkateswarlu, M. suman and C.Narasimha Rao, Research Journal ofPharmaceutical, Biological and ChemicalSciences, 2(2): (2011), 464-469. Biologicaland Chemical Sciences, 2(2): 464-469(2011).

INTRODUCTION
Soil is a dynamic and complex system ofair, water, decomposing organic matter, living plantsand animals. In addition to this, soil consists of rockfragments, clays, sands and silts organized intodefinite pattern as dictated by environmentalconditions. The major factors involved in the processof soil formation are parent material, climate, time,topography and biota1. These factors are influencingthe mineralogical, mechanical and chemicalproperties of soils. The physical properties of thesoils greatly influences its uses and behaviortowards plant growth. This also influences thechemical and biological properties of the soils andit is of utmost importance in relation to plant growthas well as soil fertility.
Current World Environment Vol. 7(1), 41-48 (2012)
Mineralogical and Textural Characteristics of Soils fromSangamner Area, Ahmednagar District, Maharashtra, India
K. K. DESHMUKH
Sangamner Nagarpalika Arts, D.J. Malpani Commerce andB.N. Sarda Science College, Sangamner - 422 605 (India).
(Received: May 06, 2012; Accepted: June 12, 2012)
ABSTRACT
Studies were conducted to know the mineralogical and textural characteristics of soils inrelation to soil fertility status of Sangamner area, Ahmednagar district, Maharashtra. For thispurpose particle size distribution was determined from 62 surface soil samples collected from thearea. Representative ten sample clay fractions were subjected to X-ray diffraction analysis formineralogical characterization. Clay factions have been found to be dominated by illite which isgenerally facilitated due to high K2O content in soils. Montmorillonite present in the salt affectedsoils has the predominance of magnesium. Kaolinite, chlorite, halloysite were also detected. Thetextural analysis revealed the clay content varies from 9.51 to 53.61%. Clay and clay loam type ofsoils were found in the downstream part which is possibly attributable to inadequate drainageconditions prevailing in the area. The proportion of silt content was followed by sand and coarsesand. The textural classification of the soils showed 35.48% samples were clay, 22.58% sampleswere clay loam, 21% sandy clay, 16% sandy and 5 % sandy clay. This indicates that majority ofthe samples have clay and clay loam category. The present investigation suggested that adequatedrainage and leaching, crop rotation, blending of saline water with good quality of water, use ofmanures and mulching and desiltation of Ojhar weir can be adapted as measures to improve soilfertility of the area. Farmer’s participation has been looked as the best means of avoiding furtherdegradation of soils in the area.
Key words: Particle size distribution, Montmorillonite, Clay and clay loam,Textural triangular diagram, XRD diffractogram.
The mineral matter is a major componentof soil. The mineralogical information of soils isessential for understanding soil genesis and fordeveloping appropriate management practices forthe maintenance of soil fertility. The color of the soilis also largely caused by the presence of certainminerals. The interaction of soil clay with nutrientions, water and organic substances determines thesoil fertility, which in turn largely controlled by thequality and nature of minerals2. Therefore, tounderstand the utility of soils, it is very essential toknow the mineralogy. The mineralogy influencessoil fertility through its control on the type and qualityof plant nutrients which may be released byweathering. The shape of the particles affects theirpacking and thus related to soil structure3. The studyof minerals is the study of nature of soils. Many

42 DESHMUKH, Curr. World Environ., Vol. 7(1), 41-48 (2012)
Researchers4-9 have studied the clay mineralogyof normal and salt affected soils from different partsof the country.
Texture is probably the most important ofthe soil characteristics. Soil texture has profoundeffect upon the properties of soils including its watersupplying power, rate of water intake, aeration,fertility ease of tillage and susceptibility to erosion.It is a guide to the value of land. Land use capabilityand soil management practices are determined bythe texture10. Clays also acts as a major store ofplant nutrients and therefore many aspects of soilfertility are ultimately influenced by texture11.Voluminous research work has been conducted inthe area of textural characterization of soils12-15. Thesoils from the Sangamner area mainly derived fromthe Deccan basalts. The area is experiencing theproblems of salinization, alkalinsation,waterlogging etc due to over irrigation, excess useof chemical fertilizers, intensive cultivation withmodern production technology and establishmentof sugarcane and allied industries. Thereforeattempts have been made to study themineralogical and textural characteristics of soilsin order to know their fertility status from study area.
The study areaThe Sangamner area is located in the
Ahmednagar district of Maharashtra. Sangamneris a taluka headquarter which is located at adistance of 150 km from Pune on Pune-NashikNational Highway No. 50 (Fig.1). The area isdrained by the Pravara river which is a tributory ofGodavari. Pravara river originates in themountainous region of Western Ghats and flowsinto low-lying fertile alluvial plain in the downstreampart. Several dams and weirs have beenconstructed across Pravara r iver. Of these,Bhandardara dam is located in the source regionand the Ozar weir is in the downstream direction ofSangamner town. These dams and weirs have beenaugmenting the irrigational water needs of the area.Over 90% of the study area is practising intensiveagriculture. It should be noted that subsequent tothe establishment of co-operative sugar-mill atSangamner in 1967, the agriculture in the area haswitnessed rapid changes in the cropping pattern.The industrial units developed in the area generatelarge volumes of waste water which mixes with
surface and groundwater resources therebycontaminating them. At places, the lagoons usedfor storage of waste waters have causeddegradation of soils as well as water due toinfiltration of effluents. Thus, the soil resources arefacing severe threat from both irrigation practicesas well as from agro-based industry.
MATERIAL AND METHODS
Selected 62 surface soil samples (0-20cm)were collected (Fig 1) in cloth bags as per thestandard procedures16,17. 49 samples are fromirrigated and 13 from non –irrigated areas.Quartering technique was used for preparation ofsoil samples. The samples were dried in air andpassed through 2 mm sieve and stored in clothbags. The textural analysis was done by usingInternational Pipette Method10,18,19.
Out of 62 soil samples, representative 10sample clay fractions obtained by Internationalpipette method were subjected to X-ray diffractionanalysis for mineralogical characteristics. Sixsamples (S.No. S6, S 10, S 11, S 13, and S26) werefrom irrigated / salt affected zone whereas four(S.No. S29, S49, S56 and S59) were from non-irrigated area (Fig 1). For X ray diffraction analysissamples were powdered to 250 – mesh ASTM sieve.The characteristics of clay samples were recordedon PW172. X – Ray diffractometer using CuKαradiation operated at 30 KV and 30 mA (Cu). TheCuKα radiation wavelength was 1.542° A. Thescanning speed was maintained at 0.05° 2θ /s andchart speed was 5 mm/2θ starting with 2θ = 10degrees. For the identification of different peaks,Hanwalt’s method has been used in which peaksare composted with ASTM cards. The typical X-raydiffraction pattern of the clay fractions underinvestigation is shown in Fig 2.
RESULTS AND DISCUSSION
Mineralogical characteristics of soilsIt is observed from the fig 2 that the
important clay minerals identified in the clayfractions of the soil samples under investigationare illite, montmorillonite, kaolinite, chlorite andhalloysite.

43DESHMUKH, Curr. World Environ., Vol. 7(1), 41-48 (2012)
Table 1: Textural Characteristics of the soils from Sangamner area
S. Particle size distribution (%) Soil
No. Coarse sand Fine sand Silt Clay Class
S1 6.08 24.92 21.6 46.75 ClayS2 8.48 29.92 15.35 45.73 ClayS3 13.28 28.4 12.2 40.53 ClayS4 19.88 13.22 21.1 39.48 Clay loamS5 14.32 10.86 25.17 43.93 ClayS6 9.48 20.88 32.15 31.98 Clay loamS7 18.21 23.12 15 42.18 ClayS8 16.52 17.97 22.07 37.43 Clay loamS9 7.29 16.17 29.08 41.33 ClayS10 28.08 6.07 20.87 39.83 Clay loamS11 5.01 14.33 31.15 43.53 ClayS12 14.62 25.54 30.15 28.06 Clay loamS13 3.52 12.05 26.82 50.23 ClayS14 9.51 22.24 26.37 35.68 Clay loamS15 31.65 9.81 18.22 37.16 Clay loamS16 11.21 27.93 33.3 29.51 Clay loamS17 6.57 14.11 21.17 51.03 ClayS18 5.48 15.52 26.6 44.93 ClayS19 12.45 33.62 15.72 43.18 ClayS20 2.15 15.75 23.42 52.33 ClayS21 32.68 36.81 13.73 13.51 Sandy loamS22 27.67 16.6 19.35 31.71 Sandy clay loamS23 15.52 42.76 16.65 20.58 Sandy clay loamS24 22.02 42.79 12.42 18.11 Sandy loamS25 7.31 16.35 20.12 49.71 ClayS26 5.30 15.55 23.35 51.03 ClayS27 33.31 27.67 13.35 21.04 Sandy clay loamS28 18.25 28.51 19 29.09 Sandy clay loamS29 21.26 40.13 14.55 19.38 Sandy loamS30 32.78 20.06 12.65 29.26 Sandy clay loamS31 17.08 22.62 14.52 39.31 Sandy clayS32 6.292 19.91 23.4 42.61 ClayS33 7.127 11.35 20.65 53.16 ClayS34 3.22 22.71 28.15 37.56 Clay loamS35 10.17 19.6 10.67 51.57 ClayS36 13.28 33.29 24.4 32.73 Clay loamS37 6.647 23.56 15.57 48.06 clayS38 11.67 34.88 21.97 27.03 Clay loamS39 25.104 41.25 12.12 17.78 Sandy loamS40 19.086 33.56 18.35 22.91 Sandy clay loamS41 19.094 31.54 14.27 26.81 Sandy clay loamS42 9.935 37.28 23.426 24.61 Sandy clay loamS43 7.317 41.96 11.87 33.11 Sandy clay loamS44 11.983 32.76 14.87 34.93 Sandy clay loamS45 4.143 34.75 11.22 41.56 Sandy clay

44 DESHMUKH, Curr. World Environ., Vol. 7(1), 41-48 (2012)
S46 7.559 53.32 22.07 12.28 Sandy loamS47 9.139 51.83 16.15 18.01 Sandy loamS48 6.592 35.87 20.15 32.11 Sandy clay loamS49 12.846 36.87 16.05 28.36 Sandy clay loamS50 18.03 45.97 12.95 19.73 Sandy loamS51 4.33 19.39 22.52 48.58 ClayS52 11.28 50.03 16.93 17.91 Sandy loamS53 21.12 41.34 16.1 17.86 Sandy loamS54 10.372 26.884 18.12 40.36 Clay loamS55 3.696 29.51 23.87 38.68 Clay loamS56 6.117 33.33 20.27 33.68 Clay loamS57 4.23 31.55 12.37 45.26 ClayS58 2.199 28.66 13.75 46.93 ClayS59 4.777 28.35 10.87 46.56 ClayS60 19.932 49.24 7.875 19.51 Sandy loamS61 11.266 34.59 10.8 35.51 Sandy clayS62 6.595 29.1515 12.2 44.56 Clay
IlliteThe dominance of illite in all samples
reflected the alkaline nature of the soils along withhigh concentration of aluminum and potassium. Thisis further evidenced by the chemical analysis ofsoils20. Illite is identified by series of basalreflections at 1.99°A, 3.32° 2.57° A and 2.07° A,besides the weaker reflections at 1.52°A, 4.81° Aand 3.1° A. The presence of illite in the samples isindicative of the influence of olivence / enstatiticpyroxene dominated parent material. However, theformation of illite is more favoured due to high K2O
content of these soils20. This is possibly due toexcessive use of potash fertilizers.
MontmorilloniteThe XRD pattern of salt affected soils in
the area revealed the formation of montmorillonite(smectites). This can be attributed to alkalinecondition and availability of sodium andmagnesium. Such hyper alkaline condition can bedeveloped due to impeded drainage in the area1,21.Montmorillonite presence is seen as 100%reflection at 4.41° A and weaker reflections at 1.53°A
Fig. 1: Location map showing soil sampling stations in the study area

45DESHMUKH, Curr. World Environ., Vol. 7(1), 41-48 (2012)
drainage condition have accelerated the formationof smectite22. However, the normal soil showed lessproportion of montmorillonite indicating adequatedrainage and leaching of magnesium from the hostrock basalt.
KaoliniteIt is a major component in almost all the
soil samples from study area. It is represented bybasal reflection at 7.13 to 7.24° A and 3.55° A.However, in the presence of chlorite as in the caseof present samples, the above reflection interfereand coincide with the chlorite at 7.14 and 3.54°Arespectively. The other reflections were identifiedwith the lesser intensity at 2.43°A, 2.86, 2.57 and2.2°A. In the upland soils the dominance of kaolinitemight be attributed to the good internal drainage.The plagioclase feldspar has undergoneweathering to kaolinite at low pH. However, it isobserved that kaolinite reflection does not showany systematic variation in intensity.
ChloriteIt is represented by basal reflections at
7.14°A and weak reflection at 1.55°A. However,because of interference and coincidence ofreflections of chlorite with reflection of kaolinite, itwas rather difficult to distinguish between the peaksof kaolinite and chlorite in the soil samples understudy.
HalloysiteIt is the mineral, which belongs to kandite
group21. It is known to occur in two forms with basalspacing 10° A and 7° A as halloysite andmethahalloysite respectively. In the present study,100% intensity has been detected at 4.43° A and4.52° A, which indicated the presence of hydratedhalloysite in all the samples under study.
By and large, it can be inferred that theformation of illite in the area is generally facilitatedby the presence of cations like potassium andsodium in sufficiently large quantities. Themontmorillonite present in salt affected soils is dueto the predominance of magnesium or other alkalineearth cations. Kaolinite, chlorite and halloysite werealso detected in the soils samples. However, noremarkable difference was seen in the clay mineralcomposition in the soils from the area.
Fig. 2: XRD diffractogram for some clayfractions of representative soil samples
Fig. 3: Triangular diagram showing texturalclassification of soils from study area
to 3.48°A. Similarly, weaker reflections were alsoidentified in the range of 1.29° A to 7.73°A. Underalkaline conditions, the pyroxenes from basalt arebelieved to weather to clay of this type and finesand. The smectite type of minerals once formed,remain stable under alkaline conditions that candevelop impeded drainage. In the low lying area, itappears that slightly weathered parent materialsunder alkaline conditions, low Mg and poor

46 DESHMUKH, Curr. World Environ., Vol. 7(1), 41-48 (2012)
Textural characteristics of soils from theSangamner area
The textural characteristics of the soils arethe most important laboratory determinations madein the soil studies. It deals with the process ofdetermining the amount of individual soil separatesbelow 2 mm in diameter i.e. sand, silt and clay. Therelative proportions of these soil separates arereferred to as soil texture. The various relationshipsthat exist between plant and soil are controlled to agreat extent by soil texture1.
It is observed from the table 1, that majorityof the soils are in the clay and clay loam category.The clay content varies from 9.51 to 53.61 %.However, the clay and clay loam type of soils werereported predominantly from the downstream partand in the catchment of Ojhar weir (S. No. S1, S2,S3, S4, S5, S8, S9, S10, S12, S14, S15, S16 andS33). This is possibly due to inadequate drainagedue to unfavorable topography and siltation atOjhar weir. In addition to this, presence of alluvialdeposits showing low permeability has lead tohigher clay content.
The silt content of the soils ranged from10.8 to 33% However, higher values of slit werenoticed for the soils from irrigated tract and in theareas of lower elevation (S. No. S6, S9, S12, S13,S14 and S16).
The fine sand and coarse sand rangedfrom 6.076 to 59.24% and 3.696 to 33.31%respectively. The higher content of these sands wasrecorded in the vicinity and downstream part of Ojharweir (S.No. S21, S23, S24, S29, S39, S43 and S60).However, low values were found in the areas withflat topography (S, No.S5, S10, and S15) andcharacterized by alluvial lithology. Similarobservations were made by the researchers7,14,23,24
for the soils from the area which is in proximity tothe present study area. This inference is alsosupported by cation exchange capacity values20.
The distribution of particle size influencesthe moisture retention and transmission propertiesof soils. This is to say that, coarse textured soilshave low moisture retention and high permeabilitywhereas fine textured soils have high moistureretention and low permeability25. Considering this,
it can be said that the soils having high clay content(S. No. S2, S3, S4, S5, S7, S8, S9, S10, S16 andS20) will have low infiltration rate. The chemicalproperties of soils are expected to be influenced byclays than silt and sand particles. This is becauseclay fraction contains larger alumino – silicates andhas higher content of humus. Therefore, they arecharacterized by a higher charge density per unitsurface26. In the study area, high proportion of clayin some parts of study area can be considered asone of the important factors influencing the chemicalproperties of soils20.
Textural classification of the soilNatural field soils are always mixtures of
soil separates. The relative percentages of thevarious soil separates in a field are almost infinitein possible combinations. It is, therefore, necessaryto establish limits of variations among the soilsepa-rates so as to group them into textural classes.The determination of the textural class of a soil isbased on particle size analysis. The soil samplesfrom study area are separated into three sizefractions viz. sand, silt and clay. The quantity of eachfraction was measured and expressed as apercentage (by weight) of the soil. The distributionof the different sized particles was used fordetermining textural class of the soil with the helpof textural triangular diagram (Fig 3)10,16. On the basisof this, five tex-tural groups were obtained viz clay,clay loam, sandy loam, sandy clay loam and sandyclay from the study area (Fig 3).
Out of 62 soil samples, 22 soil samples(35.48%) were clay, 14 samples (22.58%) were clayloam, 10 samples (16.12%) were sandy loam, 12samples (20.96%) were sandy clay loam and 3(4.84%) were sandy clay. Thus, majority of thesamples in the area represent clay and clay loamtype of textural class. The distribution of varioustextural classes is depicted in Fig 3.
From the Fig, it is observed that the clayand clay loams were located in the central anddownstream part in the back-waters of Ojhar weir.(S.No. S1, S2, S3, S4, S5, S6, S7, S8, S9, S10, S12,S14, S15, S16, S17, S18, S34, S35, S36, S37, S38,S51, S57, S58, S59 and S62). This particular areais waterlogged due to flat topography and impededdrainage. Similar observations were also

47DESHMUKH, Curr. World Environ., Vol. 7(1), 41-48 (2012)
reported7,23,24 from adjoining areas in the samebasin. In nutshell, textural classification of soilprovides a basis for making judge-ment aboutvarious other properties important to overall soilbehavior in the area.
CONCLUSION
The studies carried out to knowmineralogical characteristics of the soils fromSangamner area have demonstrated theimportance of clay minerals in relation to soil fertility.The clay minerals identified by the XRD studies ofthe representative soil samples indicated presenceof illite followed by montmorillonite, kaolinite andhalloysite in the area. The formation of illite in thesoil is generally facilitated by the presence ofcations like potassium and sodium in sufficientlylarge quantities. The montmorillonite present in saltaffected soils has the predominance of magnesium.However, no remarkable difference was seen inthe clay mineral composition in the soils from thearea.
The textural analysis revealed thepredominance of clay to clay loam textural type ofsoils which are located in the downstream part i.e.in the catchment of Ojhar weir. This is possiblyattributable to inadequate drainage conditionsprevailing in the area. The five textural groups of
soils viz. clay, clay loam, sandy loam, sandy clayloam and sandy clay were identified in the area.Out of these, majority of the samples represent clayand clay loam type, which are located in thedownstream part of the river. The percentagedistribution of these textural classes is clay(35.48%), clay loam (22.58%), sandy clay loam(21%), sandy loam (16%) and sandy clay (5%). Thepresent investigation suggested that adequatedrainage and leaching, crop rotation, blending ofsaline water with good quality of water, use ofmanures and mulching and desiltation of Ojhar weircan be adapted as measures to improve soil fertilityof the area. Farmer’s participation has been lookedas the best means of avoiding further degradationof soils in the area.
ACKNOWLEDGEMENTS
The author is thankful to Dr. N. J. Pawar,Vice-Chancellor, Shivaji University, Kolhapur for hisvaluable guidance and constant encouragement.The author is also thankful to Head, Department ofEnvironmental Science, University of Pune andPost-Graduate Research Centre in Chemistry,Sangamner College, Sangamner for providingnecessary research facilities. The author is alsothankful to Head, Department of physics, Universityof Pune for providing X- ray diffraction analysis.
REFERENCES
S.B., J. Ind. Soc. Soil Sci., 44: 300-309 (1996).7. Durgude A.G., Morphology, characterization
and mapping of salt affected soilsAgricultural University, Rahuri, Ph.D. Thesis,Rahuri (1999).
8. Marsonia P.J., Polara J.V. and Hadiyal S.T.,Characterization and classification ofcultivated soils of Gujarat, An Asian J. of soilScience, 3(2): 287-288 (2008)
9. Meena R.B., Balpande S.S., Bahaulkar V.P.and Mandle M.G., Characterization andclassification of water logged soils of UpperWardha area of Maharastra, J. soils andcrops, 21(1): 90-94 (2011).
10. Gupta P.K., Soil, Water, Plant and Fertilizeranalysis, 2nd Edition, Agrobios Publishers,Jodhpur (2009).
1. Miller R.W. and Donahue R.L., Soils : Anintroduction to soils and plant growth,Prelatic Hall of India, Pvt Ltd, New Delhi(1992).
2. Thompson L.M. and Troen F.R., Soils and Soilfertility, 3rd edition McGrawhill Book Co. 137-161 (1973).
3. Jain V.K., Biofertilizers for SustainableAgriculture, Oxford Book company, Jaipur,(2009)
4. Colman S.M., Clay mineralogy of rinds andpossible implications concerning thesources of clay minerals in soils, Geology,10: 370 (1982).
5. Tewatia R.K. Singh N, Ghabm S.K. and SinghM., J. Ind. Soc. Soil Sci., 37: 687-691 (1989).
6. Pancharne T.K., Pal D.K. and Deshpande

48 DESHMUKH, Curr. World Environ., Vol. 7(1), 41-48 (2012)
11. Briggs D. Soils, Butterworths and Co-Publishers, London 129-134 (1977).
12. Maji B. and Bandopadhyaya B.K., J. Ind. Soc.Soil Sci., 43(1): 103-107 (1995).
13. Hopkins D.G. and Richardson J.L.,Hydrology, 7: 380-392 (1999).
14. Challa O.B.P., Bhaskar S.G., Anatwar and.Gaikwad M.S, Characterization andclassification of problematic vertisols in semi-arid ecosystem of Maharashtra plateau J. Ind.Soc. Soil Sci. 48 (1): 139-145 (2000).
15. Grace G. and Eta N.E., Research Journalof Chemistry and Environment, 15(2): 1-4(2011).
16. U.S. Salinity Laboratory Staff, Diagnosis andImprovement of saline and alkali soils,USDA, Handbook No. 60, U.S. Dept ofAgriculture, Washington D.C. (1954).
17. Hesse P.R., A textbook of soil chemicalanalysis, John Murry Publication, London,U.K. (1971).
18. Piper C.S., Soil and plant analysis, Hans.Publication Bombay (1966).
19. Jackson M.L., Soil chemical analysis,Prentice Hall of India, New Delhi (1973).
20. Deshmukh K.K. Impact of irrigation on theChemistry of the soils and groundwater from
Sangamner area, Ahmednagar district,Maharashtra, Ph.D. Thesis, University ofPune (2001).
21. Deer W.A. Howe R.A. and Zooman J. Anintroduction to rock minerals, Longmangroup, London, 250-269 (1980).
22. Singh A, Yadhav R.B. Tripathi S.B. and AryaR.L., Fertilizer News, 43(8): 45-50 (1998).
23. Shinde M.D., Study on soil characteristicsand effect on green algae from Pravaranagararea, Ahmednagar district, Ph.D. Thesis,University of Pune (1997).
24. Bharmbe P.R. and Ghonsikar C.P. Physico –Chemicals Characteristics of Soils inJayakwadi Command, J. Maharashtra Agri.University, 10: 247-249 (1985).
25. Richards L.A., Diagnosis and Improvementof saline soils U.S. Salinity Laboratory Staff,Agriculture Handbook No. 60, oxford and IBHPublishing Co. New Delhi (1968).
26. Orlov D.S., Soil Chemistry, Oxford and IBHpublishers, New Delhi (1992).
27. M. Zamani, Orient. J. Chem., 28(1): 491-497(2012).
28. R.V. Kumar, A. Arokiaraj and P.M.D. Prasath,Orient. J. Chem. 27(2): 567-571 (2011).

INTRODUCTION
The most important word in the progressof any industry is quality. By quality we mean anattribute of the product determines its fitness foruse. The range of these attributes is pretty wide –Physical, Chemical, aesthetic etc. A product mayhave several aspects of quality as well as an overall quality which is something more than the sum ofits individual quality aspects. Quality means a levelwhich in turn, depends on four M’s besides manyother factors which is materials, man power,machines and management.
Literature ReviewQuality assurance is the products used by our
society. Product consist of manufactured goods, such asautomobiles, computers, clothing, public transportationand health care. Quality assurance principles apply toboth manufactured goods and services.
It is essential that products meet therequirement of those who use them. Therefore, thedefinition of quality is that quality means fitness foruse. These are two general aspects of quality: qualityof design and quality of conformance. All goodsand services are produced in various grades orlevel of quality are international and consequently,the appropriate technical term is quality of design.
The quality of conformance is how will theproduct conforms to the specifications and
Current World Environment Vol. 7(1), 49-50 (2012)
The Position of Word “Quality” in Industrial Management
FARKHUNDA SAYYED¹ SHOYEB ALI SAYYED² and MUJAHIDA SAYYED³
¹Lord Krishna College of Technology, Indore (India).²Royal College of Technology, Indore (India).
³Department of Statistics, College of Agriculture, Ganjbasoda - 464 221 (India).
(Received: April 12, 2012; Accepted: May 27, 2012)
ABSTRACT
In This Paper we deal with the concept of the word quality with reference to industrialmanagement.
Keywords: Physicochemical, Pollutant, Industrial Wastewater in dheradun.
tolerance required by the design. Quality ofconformance is influenced a no. of factors, includingthe choice of manufacturing processes, the trainingand supervision of the work force, the type of thequality assurance system i.e. process controls testsinspection activities etc, used, the extent to whichthese quality assurance procedures are followedand the motivation of the work force to achievequality. To achieve quality of design requiresconscious decisions during the product or processdesign stage to ensure that certain functionalrequirements will be satisfactory met. Designingquality into the product in this fashion often resultsin a higher product cost. Quality of conformanceare often made by changing certain aspects of thequality-assurance system. Such as the types ofinspection in total costs, because it leads to reducedscrap, rework, and a smaller fraction of non-conforming products and services.
Quality is becoming the basic consumerdecision factor in many products and services. Thisphenomenon is widespread, regardless of whetherthe consumer is an individual an industrialcorporation, a military defence program, or a retailstore. Quality is a key factor leading to businesssuccess, growth and enhanced competitiveposition. There is a substantial return on investmentfrom an effective quality assurance program thatprovides increased probability to firms thateffectively employ quality as a business strategy.

50 Sayyed et al., Curr. World Environ., Vol. 7(1), 49-50 (2012)
Quality control determines what, when andhow much to inspect and what measures to take sothat defective items are not produced. It ispreventives rather than a corrective measure. Thecorrective action rests with the personnel.
Quality control is one of the importantfunctions of the management. It is a system set oftools and techniques by which products are madeto comply with the specification at minimum cost tothe firm. Quality control is concerned with makingthings right rather than discovering and rejectingthose made wrong.
Quality is not merely the responsibility ofquality control department. Quality control is anintegrated function. The quality of a product can bedirectly traced to the quality of production aids (tools,tigs and fixtures, measuring instruments); quality ofmanufacturing process and manufacturing facilitiesemployed; quality of workmanship, and the qualityof systems set to regulate and control work on theshop floor.
Quality control thus aims to produce, betterquality products at the least cost to the companyand inspection is one of the tools used by it toachieve this objective. Quality control andinspection are, therefore, closely related. The twofunctions were formerly combined, inspection beinga part of quality control or vice versa.
One simply way to control the quality is toconduct 100% inspection. However it will be verycostly and time consuming. Now a days statistics isused for quality control and this method is knownas statistical quality control and this method isknown as statistical quality control.
For ex. In the area of ever growingcompetition has become absolutely necessary for abusinessman to keep a continuous watch over thequality of the goods produced moving once boughtthe product, if the consumers feel satisfied withregard to its quality, price etc., a kind of goodwill forthe product is developed which helps to increasethe sales. However, if the consumers are not happywith the quality of the product and their complaintsare not given proper attention, it shall be impossiblefor the manufacturer, to continue in the market. Eitherhe would have to improve the quality or else beforced to quit the market to other producers who mightstart capturing the market by offering better quality.
CONCLUSION
Quality does not always imply the higheststandards of manufacturer for the standard requiredis often deliberately below the highest standardpossible. It is generally the consistency in qualitystandards which represents the most desirablesituation rather than the absolute standards whichis maintained.
With the use of quality control we can setupstandards of quality acceptable to the customer andeconomical to achieve and maintain and we canlocate and identify the process faults in order tocontrol the defectives, scrap and waste. With theuse of quality control we can take necessarycorrective measures to maintain the quality of theproducts and off course we can ensure that sub-standard products do not reach the customers andachieve better utilization of raw materials andequipments.
REFERENCES
1. Chiu, W.K. and G.B. Wetherill, “QualityControl Practices”, International Journal ofProduction Research, 13 (1975).
2. Duncan, A.J. “Quality Control and IndustrialStatistics” 4th Ed., Irwin, Homewood III (1974).
3. Jurnan, J.M. and F.M. Gryna, Jr. “QualityPlanning and Analysis” 2nd Ed., McGraw Hill,
New York (1980).4. Montgomerey, D.C. “Introduction to Statistical
Quality Control” John Willey and Sons, 2nd
Edition (1991).5. Sanigo, E.M. and L.E. Shirland “Quality
Control in Practice – A survey” QualityProgress Vol. 10 (1977).

INTRODUCTION
The rapid industrialisation has lead tosevere environmental threats through generationof large quantities of industrial wastes andhazardous sludges. The primary sources ofhazardous wastes in India and other developingcountries include waste generated within thecountry through different industrial units and wasteimported into the country as raw materials. A studycarried out on solid waste management in non-ferrous industries in India mentions alarming levelsof hazardous secondary zinc wastes and otherindustrial wastes that are threatening theenvironment1.
Hazardous waste means a solid waste ora combination of solid waste which by virtue of itsquality, concentration or physical or chemical orinfectious character may cause to an increase inmortality or serious illness or pose a potential
Current World Environment Vol. 7(1), 51-54 (2012)
Study on Application Potential of WasteCake from Secondary Zinc Industry
MOHD. AKRAM KHAN¹ and RAJNISH SHRIVASTAVA²
¹Principal Scientist, CSIR-AMPRI, Hoshangabad Road, Bhopal (India).²Director, National Institute of Technology (NIT), Hamirpur (India).
(Received: April 25, 2012; Accepted: June 07, 2012)
ABSTRACT
Zinc extraction process generates hazardous waste cake during the recovery of electrolyticgrade zinc and copper. The characteristics of the waste with reference to basic properties viz.ignitability, corrosivity, reactivity and EP toxicity are important parameters that define the magnitudeof hazard of a waste. The waste under study falls under Schedule-I of Hazardous Waste(Management & Handling) Rules, 2003. The Toxicity Characteristics Leachate Procedure (TCLP)test was carried out for extraction of waste cake leachate and subsequently toxic heavy metalspresent in the waste were estimated. The physic-chemical parameters along with particle sizeanalysis, differential thermal analysis and X-ray diffraction analysis were carried out which provideinformation on the major constituents present in the hazardous zinc waste cake before and afterstabilisation/stabilisation of the waste. The approach would be helpful in safe disposal and exploringapplication potential of zinc waste through adoption of suitable binder mechanism.
Key words: Hazardous waste, Zinc industry, Waste cake,Leachate, TCLP, Solidification / stabilisation.
hazard to human health or the environment whenimproperly treated, stored, transported or disposed2.India has witnessed nearly fivefold increase in itsindustrial production in the last few decades andpresently more than 500 medium and largechemical and allied industries are in operation3.The present study covers the industrial wastegenerated by secondary zinc industry located inthe western part of India and generates around5,000 TPA of the waste cake.
It is well known that production ofpesticides and herbicides used in agriculturalapplication produce wastes of hazardous / toxicnature. Similarly fluoride waste and by-products ofphosphate fertilizer industry also generatehazardous toxic wastes. Household sources ofhazardous waste include metallurgical scraps,secondary industry process waste cake, toxicpaints, solvents, caustic cleaners, batteries, drugsetc. These wastes contaminate the soil and ground

52 Khan & Shrivastava, Curr. World Environ., Vol. 7(1), 51-54 (2012)
water and adversely affect the natural eco-systemthrough percolation of heavy metals into the soiland natural water sources3.
The release of harmful chemicals / toxicwastes into the environment mainly throughindustrial, agricultural, household and transportroute results in air, soil and water pollution. Majorman made sources of pollutants are linked to miningand metal production, metal extraction, fossil fuelburning, coal mining, production of conventionalbuilding materials, chemical and pharmaceuticals,use of chemical fertilizers, municipal and industrialwaste dumps, incinerators and other specialiseddumping sites4. The locations par ticularlythreatened are areas which are alreadyenvironmentally overloaded and have no freeabsorption capacity areas with shallow groundwater and porous soil regions.
The manufacturing of different computercomponents involve many industrial processeswhich lead to generation of liquid wastes. A printedcircuit board generates spent electroplating baththat contains metal salts and the production of thecomputer chips use acids, caustic chemicals andsolvents. Hazardous waste is also generated byfiber optics and copper wire used in electronictransmission as well as magnetic disks, paper andphotographs for packaging and publicity.
The concepts relating to hazardous wastemanagement emerging day by day and undergoingreview and upgradation in India. The Governmentof India has promulgated the Hazardous Waste(Management & Handling) Rules, 1989 throughMoEF, New Delhi under the aegis of EnvironmentalProtection Act, 1986. The rules were modifiedthrough an amendment as Hazardous Waste (M&H)Amendment Rules, 2002. Based on the furthersuggestions received and considering the variousnew methodologies, Govt. of India notifiedHazardous Waste (Management & Handling)Rules, 2003 and suggested modifications inSchedule-I with the list of processes generatinghazardous wastes. It also mentions the secondaryproduction and / or use of zinc generating sludgeand filter press cake, zinc fines / dust / skimming inthe list5.
Classification of Hazardous WasteCharacterisation and classification of
hazardous waste is required for safety reasons toensure that incompatible wastes are identified andhandled separately. Wastes can be classified byusing relatively simple and inexpensive testmethods during waste collection and laboratoryanalysis. There are four main characteristics namelyignitability, corrosivity, reactivity and ExtractionPotential (EP) toxicity which determine whether awaste is classified as hazardous waste or not [5].They have been elaborated below:
IgnitabilitySolid waste exhibits the characteristics of
ignitability if a representative sample of that wasteis a liquid containing less than 50% water and lessthan 24% alcohol and the flash point is less than60 oC.
CorrosivitySolid waste exhibits the characteristics of
corrrosivity if a representative sample of waste isaqueous and has pH less than or equal to 2 orgreater than or equal to 12.5 or liquid and corrodessteel at a rate greater than 6.35mm (0.25 inch) perday under a temperature of 55oC.
ReactivityReactive wastes are those that are
extremely unstable under normal conditions withtendency to explode or give off dangerous gases.Standard methods to test reactivity currently do notexist and it is possible only to list their physicalpeculiarities. A solid exhibits the characteristics ofreactivity if a representative sample of the waste istypically unstable and readily undergoes violentchanges without deteriorating, reacts violently withwater and forms potentially explosive mixture withwater.
EP ToxicityThe EP toxicity is the measure of the
likelihood that waste will leach out toxic chemicals.A particular waste is considered toxic ifconcentrations of any of the heavy metals in itsextract are greater than standards mentioned asper the permissible limits of Hazardous Waste (M &H) Rules, 2003 [5].

53Khan & Shrivastava, Curr. World Environ., Vol. 7(1), 51-54 (2012)
MATERIAL AND METHODS
TCLP test was adopted in 1968 by the USEnvironment Protection Agency (USEPA) as areplacement of EP toxicity. The TCLP is also widelyused to evaluate the effectiveness of stabilisationof the waste. In this test method, the waste materialis crushed to a particle size smaller than 9.5 mmand mixed with a weak acetic acid as extractionliquid (pH 4.93) in a liquid to solid weight ratio of20:1 and agitated in a rotary extractor for a periodof 18 hours at the speed of 30 rpm and 22 oC 6. Thesample is filtered through 0.6-0.8 µm glass fiberfilter paper and the filtrate is defined as the TCLPextract. This extract is analysed for wide variety ofhazardous waste constituents including heavymetals of interest in the waste.
RESULTS AND DISCUSSION
The secondary zinc waste cake is neutralin nature with its pH around 6.3 and particle densityto be around 2.4 gm/cc. The moisture content variedin the range of 24 to 35%. The waste cake mainlyconsists of zinc, copper, manganese, lead and ironas predominant heavy metals present in the sample.
Particle Size AnalysisThe hazardous waste collected from the
rotary vacuum filter (waste cake) was dried andparticle size analysis was carried using standardsieves and using Laser Particle Size Analyser(Malvern make). The results show that the wastesample consists of clay sized particles upto 20%and silt size particles upto 52% of the total weight.
X-Ray Diffraction AnalysisX-Ray Diffraction Analysis was carried out
by Philips Diffractometer model 1710 using CuK
radiation and nickel filter at 40kV and 20mA. Theidentification of mineral phases was done with thehelp of mineral powder diffraction file JCPDS andASTM diffraction data. The major peaks identifiedin the waste sample are that of Gypsum with Mn
2O3
and lime in traces.
TCLP TestingLeachability test was carried out by using
Millipore make Zero Headspace Extractor (ZHE).The sample is agitated for 18 hours in a rotaryagitator for extracting the secondary leachate. Theprimary and secondary extracts were obtained at50 psi pressure with glacial acetic acid and NaOHsolution as extraction fluid at a pH of 4.93 [6]. Theleachate obtained is analysed for different heavymetals using Hitachi make Atomic AbsorptionSpectrophotometer. The analysis results for thewaste sample are as below:
Solidification is the process by which thesufficient quantities of solidifying materials areadded to the hazardous waste to result in asolidified and encapsulated mass of materials.Stabilisation is a process that uses additives toreduce the hazardous nature of the waste byconverting the waste and its hazardous constituentsinto a form to minimise the rate of contaminantmigration in the environment and to reduce the levelof toxicity. Many technologies have been proposedfor detoxifying the waste by processes that destroychemical bonds so that the toxic nature is minimised.
It is reported that approximately 0.5 milliontonnes of lead-zinc slag is generated annually andthis slag can be used upto the extent of 45% asblending component for the manufacture of PortlandSlag Cement7. This indicated that the waste cakehas potential for its reuse in different applications.
Table 1.1 Concentration ofheavy metals in the Waste Cake
Heavy Metals Concentration (%)
Zinc 3.10-3.40Copper 2.80-3.00Lead 4.10-4.40Manganese 3.30-3.80Iron 1.50-1.70
Table 1.2 Concentration of heavy metals inTCLP extract of Waste Cake
Heavy Metals Leachate Concentration (ppm)
Zinc 0.51-0.56Copper 1.62-1.85Lead 0.11-0.14Manganese 0.135-0.142Iron 0.062-0.071

54 Khan & Shrivastava, Curr. World Environ., Vol. 7(1), 51-54 (2012)
The hazardous secondary zinc waste was foundsuitable for encapsulation with different binders likefly ash, clay and their combinations in definedproportion. The results indicated that leachingproperties of heavy metals present in the waste cakegot arrested in the solidified-stabilised mass thusconverting them into non-hazardous form of waste.
CONCLUSIONS
The characteristics and categorisation ofhazardous waste is one of the important aspects ofthe hazardous waste management. The secondaryzinc extraction process produces waste cake that
falls in Schedule-I of Hazardous Waste (M&H)Rules, 2003. The hazardous waste can becharacterised by TCLP testing to identify theleachable toxic elements and can be solidified &stabilised by using different binder materials. Thenew material provides good alternative for safeutilisation and disposal of zinc waste cake.
ACKNOWLEDGEMENTS
The authors are extremely thankful toDirector, CSIR-AMPRI Bhopal for the permission tocarry out this work and for the facilities provided forthe research work.
REFERENCES
1. Agrawal A., Sahu K.K., Pandey B.D., Solidwaste management in non-ferrousindustries in India, Resources Conservation& Recycling, 42: 99-120, Elsevier Publication(2004).
2. LaGrega M.D., Buckingham P.L. and EvansJ.C., Hazardous Waste Management, Mc-Graw Hill International Edition (1994).
3. Toxic and hazardous waste disposal - AnIndian perspective, Nag P.J., ChemicalIndustry News, 1027-1029 (1996).
4. Stanley E. Manahan, Fundamentals ofEnvironmental Chemistry, Second Edition,Lewis Publishers (2001).
5. Hazardous Waste (Management &Handling) Rules, Ministry of Environment &Forests, Govt. Of India, notification dated 20th
May 2003 (2003).6. Toxicity Characteristics Leachate Procedure,
Millipore Information Booklet (2000).7. Assessment of Utilisation of Industrial Solid
Wastes in Cement Manufacturing, CentralPollution Control Board Report, MoEF, NewDelhi, (2006).
8. S. Katanyoon, W. Naksata, P. Sooksamiti, S.Thiansem and Orn-Anong Arquero. Orient J.Chem. 28(1): 373-378 (2012).

INTRODUCTION
Garnet crystallizes in cubic system andmostly in dodecahedron (rhomb-dodecahedron)and trapezohedron (tetragon-trioctahedron) crystalforms. General chemical formula of this mineral is:R3R’2(SiO4)3, which bivaliant cations (i.e. Mg2+, Fe2+,Mn2+, Ca2+) lie in R site and trivaliant cations (i.e.Al3+, Cr3+, Fe3+) in R’ site. Commonly, more than onecation lies in R and R’ sites and therefore garnetcrystals give rise to isomorphous (solid solution)series of minerals. If Al3+ is located in R’ site, thepyralspite group [( Fe2+,Mg2+,Mn2+ )3 Al2(SiO4)3] withalmandine [(Fe2+)3 Al2 (SiO4)3], pyrope [(Mg2+)3Al2(SiO4)3] and spessartine [(Mn2+)3Al2(SiO4)3] endmembers will form. If Ca2+ is located in R site, theugrandite group [(Ca2+)3(Al3+,Fe3+,Cr3+)2(SiO4)3] withgrossularite[Ca3Al2(SiO4)3], andradite [Ca3(Fe3+)2
(SiO4)3] and uvarovite [Ca3(Cr3+)2(SiO4)3] endmembers will form. Some other cations may alsobe emplaced in R and R’ sites [1, 2]. The garnet
Current World Environment Vol. 7(1), 55-59 (2012)
The Study of Metamorphic Rocks, Zonation and Isogradesin Garnet Rocks in the Hamadan Area
ZAHRA HOSSEIN MIRZAEI BENI and ZOHREH HOSSEIN MIRZAEI BENI
Young Research Club, Khorasgan (Isfahan) Branch, Islamic Azad University, Isfahan (Iran).
(Received: March 03, 2012; Accepted: April 15, 2012)
ABSTRACT
The study area is a part of the Sanandaj- Sirjan metamorphic belt. We can divideHamadan metamorphic rocks in three groups: regional metamorphic rocks, contactmetamorphic rocks and migmatites. In this area we can’t completely divide zonation ofcontact and regional metamorphic. In some places that contact metamorphic hasinfluenced to low degree regional metamorphic rocks, contact metamorphic zonationsare clearly appear, but when contact and regional metamorphic have a same degree orregional metamorphic has high degree than contact metamorphic, we can’t distinguishthem easily. In Hamadan area regional metamorphic zones are Chlorite± Biotite zone(we haven’t garnet rocks in this zone), Biotite± Garnet zone (divided in two sub zone,Biotite and Garnet zone), Andalusite zone, Staurolite zone, Staurolite± Andalusite zone,Sillimanite- Muscovite zone and Sillimanite- Potassium feldspar± Cordierite zone, alsocontact metamorphic zones are Cordierite zone and Cordierite- Potassium feldsparzone.
Key words: Contact metamorphic; Garnet; Isogrades;Metamorphic zonation; Migmatites; Regional metamorphic.
minerals chemistry in the study area are rich inalmandine.
Geological SettingThe study area is a part of the Sanandaj-
Sirjan metamorphic belt. The Alvand plutoniccomplex is the most important plutonic body thatregional and contact metamorphic rocks with lowto high grade are located around it. Themetamorphic sequence comprises pelitic,psammitic, basic, calc-pelitic and calc-silicate rocks.Pelitic rocks are the most abundant lithologies.Pelitic sequence is mostly made up of slates,phillites, micaschists, garnet schists, garnetandalusite (± sillimanite, ± kyanite) schists, garnetstaurolite schists, mica hornfelses, garnethornfelses, garnet andalusite (± fibrolite)hornfelses, cordierite (± andalusite) hornfelses,cordierite K-feldspar hornfelses and sillimanite K-feldspar hornfelses. Major plutonic rocks of this areaare granitoids, diorites and gabbroids, which

56 Beni & Beni, Curr. World Environ., Vol. 7(1), 55-59 (2012)
intruded by aplo-pegmatitic and silicic veins (Figure1).
Metamorphic zonation and isogrades of Garnetrocks in study area
In this area we can’t completely dividezonation of contact and regional metamorphic. Insome places that contact metamorphic hasinfluenced to low degree regional metamorphicrocks, contact metamorphic zonations are clearlyappear, but when contact and regional metamorphichave a same degree or regional metamorphic hashigh degree than contact metamorphic, we can’tdistinguish them easily.
The metamorphic reaction andthermobarometric studies of metamorphic rockshave shown that garnet mica schist forming at 4.3±0.5 Kbar and 568-586 ºC and garnet hornfelsesat 2.5 ±0.1 Kbar and 539-569 ºC [3].
Regional metamorphic rocksLow grade rocks (Chl zone)
The lowest-grade rocks are very finegrained black,green or cream colored slates andphyllites, interlayered with carbonate rocks andquartzites. Slates contain Quart, Sericite, Chlorite,Graphite, Iron oxides. Phyllites contain Quart,Muscovite, Chlorite, Plagioclase, +/-Garnet, +/-Biotite, as well as accessory Tourmaline, Calciteand Iron oxides. Samples of metamorphic reactionthat have shown in this zone are:
Kln + 2Qtz → Prl + H2O ...(4)
2Ms + 6Qtz + 2H+ → 3Prl + 2K ...(5)
Biotite and garnet zoneThese rocks are medium to coarse grained
and their common texture is lepidoporphyroblasticwith a usual crenulation cleavage. This zone dividedin two sub zone, biotite and garnet zone. They arecomposed of Quartz, Biotite, Garnet (up to 10 mmin size), Muscovite, Chlorite, with accessoryPlagioclase, Graphite, Tourmaline, Apatite, Calciteand Iron oxides (Figure 2). Common porphyroblastsare Garnet, Muscovite and Chlorite. Garnet crystalshave complex relationship to deformation, i.e. theyare pre-, syn- and post-tectonic. The metamorphicreaction and thermobarometric studies ofmetamorphic rocks have shown that garnet micaschist forming at 4.3 ±0.5 Kbar and 568-586 ºC [3].
Chl + Ms → Grt + Bt + Qtz + H2O ...(6)2Chl + 4Qtz → 3Grt + 8H2O ...(7)
Chiastolite zoneThese rocks are medium to coarsed
grained with a common lepidoporphroblastictexture. Their common minerals are Quartz, Biotite,Andalusite (up to 20 cm length), Garnet, Muscoviteand minor Graphite, Chlorite, Plagioclase,Tourmaline, Apatite, Sillimanite and Iron oxides(Figure 3).
Grt + Ms + Qtz And + Bt + H2O ...(8)
Staurolite zoneThese rocks are composed of Quartz,
Table 1: Minerals assemblage in metamorphic zonation
Sillimanite Staurolite Andalusite Garnet Biotite Chloritezone zone zone zone zone zone
................................................................................................................................................................... Quartz
............................................ Chlorite ........................................................................................................................................... Biotite............................................................................................................................................. Muscovite.................................................................................................................... Garnet............................................................... Andalusite ................................. Staurolite............................................................... Kyanite........................... Sillimanite

57Beni & Beni, Curr. World Environ., Vol. 7(1), 55-59 (2012)
Fig. 1: Simplified zonation map of theHamadan area [10]
Fig. 3: Mineral assemblage in Chiastolite zone
Figure 2: Mineral assemblage in Garnet zone.
Fig. 4: Mineral assemblage in Staurolite zone
Fig. 5: Mineral assemblage inSillimanite muscovite zone
Fig. 6: First mineral assemblage inSillimanite- potassium feldspar zone

58 Beni & Beni, Curr. World Environ., Vol. 7(1), 55-59 (2012)
Staurolite, Garnet, Biotite, Muscovite, Chlorite,Plagioclase, Graphite and Tourmaline (Figure 4).Their common texture is lepidoporphyroblastic withporphyroblasts of garnet, staurolite (up to 15 cm inlegnth).
Grt + Chl +Ms + Qtz → St + Bt + H2O ...(8)
Sillimanite muscovite zoneSillimanite andalusite schists contain
Quartz, Sillimanite (± andalusite), Biotite, Muscovite,Garnet, Plagioclase and Opaque minerals (Figure5).
Grt + Ms + Qtz →Sil + Bt + H2O ...(8).
Sillimanite- potassium feldspar zoneHigh grade schists and Migmatites are in
this zone. The high grade schists in the regionalmetamorphic sequence contain Sillimanite, Quartz,Biotite, Muscovite, Garnet, Plagioclase, Potassiumfeldspar, ±Andalusite,±Kyanite, ±Staurolite (Figure6).
Migmatites are a sequence of metatexite-diatexite rocks with various structures such asstromatic, schollen, schlieric and massive. Themelanosome mineralogy of the most of themetatexites is very similar to high grade Garnetsillimanite (± andalusite and kyanite) schists butCordierite-bearing interlayers occur, too (Figure 7).Leucosome of migmatites have granoblastictexture and contain Quartz, Plagioclase, Muscoviteand ±Garnet.
Bt + Ab + Sil + Qtz → Grt + Kfs + L
Contact metamorphic rocksProtoliths of the contact metamorphic rocks
are similar to those in the regional metamorphicsequence and include abundant metapelitic rocks.Two metamorphic zones are widespread aroundplutonic bodies.
Cordierite zoneThe major rock types in this zone are
Cordier ite hornfelses. This rocks haveporphrogranoblastic texture that containing Quartz,Biotite, Muscovite,contact Cordierite (± andalusite),Plagioclase, Garnet, Tourmaline and Opaque
Fig. 7: Second mineral assemblage inSillimanite- potassium feldspar zone
Fig. 8: Mineral assemblage in Cordierite zone
Fig. 9: Mineral assemblage in Cordieritepotassium feldspar zone

59Beni & Beni, Curr. World Environ., Vol. 7(1), 55-59 (2012)
minerals (Figure 8). garnet hornfelses forming at2.5 ±0.1 Kbar and 539-569 ºC [3].
Chl + H2O → Grt + H2O ...(7)
Cordierite potassium feldspar zoneThe typical mineral assemblage of these
rock is Quartz, contact Cordierite (Crd2), orthoclase,Biotite, minor Plagioclase, Garnet and Opaqueminerals (Figure 9).
Bt + Sil (± And) + Qtz → Crd + Kfs + H2O ...(7)
Minerals assemblage in metamorphiczonation are shown in table 1.
CONCLUSION
We can divide Hamadan metamorphicrocks in three groups: regional metamorphic rocks,contact metamorphic rocks and migmatites. In thisarea regional metamorphic zones are Chlorite±Biotite zone, Biotite± Garnet zone, Andalusite zone,Staurolite zone, Staurolite± Andalusite zone,Sillimanite- Muscovite zone and Sillimanite-Potassium feldspar± Cordierite zone, also contactmetamorphic zones are Cordierite zone andCordierite- Potassium feldspar zone.
REFERENCES
1. Locock, A., An Excel spreadsheet torecastanalyses of garnet end-member componets,and a synopsis of the crystal chemistry ofnatural silicate garnets. Computers andGeosciences. V, 34: 1769-1780 (2008).
2. Li Li, H., Kuang, X., Mao, A., Li, Y. and Wang,S., Study of local structures and opticalspectra for octahedral Fe3+ centers in aseriesof garnet crystals A3B2C3O12 (A = Cd, Ca;B = Al, Ga, Sc, In; C = Ge, Si). ChemicalPhysics Letters, 484: 387-391 (2010)
3. Sepahi, A. A., Whitney D. L. and Baharifar A.A., , Petrogenesis of andalusite-kyanite-sillimanite veins and their host rocks,Sanandaj-Sirjan metamorphic belt,Hamadan, Iran. J. Met. Geol, 22:119-134(2004).
4. Thompson, A.B., A note on the kaolinite-pyrophyllite equilibrium. Am. J. Sci, 268: 454-458 (1970).
5. Frey, M., Progressive Low grademetamorphism of a Black Shale Formation,Central Swiss Alps, with special reference
to pyrophyllite and margarite bearingassemblages. J. Petrol, 19: 95-135 (1978).
6. Whitney, D.L., Mechum, T.A. and Dilek, Y.R.,Progressive metamorphism of pelitic rocksfrom protolith to granulite facies. DutchessCounty, New York, USA: Constraints on thetiming of fluid infiltration during regionalmetamorphism. J. Met. Geol, 74: 163-181(1996).
7. Kretz, R., Metamorphic crystallization. JohnWiley and Sons, 507 (1994).
8. Yang, P. and Pattison, D., Genesis of monaziteand Y zoning in garnet from the Black Hills,South Dakota. J. Lithos, 88: 233-253 (2006).
9. Norlander, B.H., Whitney, D.L., Teyssier, C.and Vanderhaeghe, O., Partial melting anddecompression of the Thor-Odin Dome,Shuswap metamorphic core complex.Canada. Cord. Lithos, 61: 103-125 (2002).
10. Sepahi, A.A., Typology and petrogenesis ofgranitic rocks in the Sanandaj-Sirjanmetamorphic belt, Iran: With emphasis onthe Alvand plutonic complex. N. Jb. Geol.Palaton. Abn, 247: 295-312 (2008).

INTRODUCTION
Tetramethylammonium compounds havemany applications in science and biology. It isextremely difficult, if not impossible, to preparesingle crystals of tetramethylammonium saltssuitable for diffraction studies; the available methodsof preparation give microcrystalline powders thatare not suitable for X-ray single crystal diffraction.Scientists’ effort to find and use simple substitutedmethods for studying crystal habits oftetramethylammonium salts. One of the suggestedmethods is the use of infrared spectra and assigningof it by symmetry. The vibrational spectrum of thetetramethylammonium (Me4N
+) ion has been thesubject of several publications during the last fourdecade1-3. Many studies had been done on thevibrational spectra of tetramethylammonium saltsand ahowed that it possible to correlate of infraredspectral properties with C-H…X hydrogen bondingand crystal habit in tetramethylammonium salts
Current World Environment Vol. 7(1), 61-67 (2012)
Correlation of Crystal Parameter withVibrational Data of New Three Tetramethylammonium Salts
S. GHAMMAMY1*, SADJAD SEDAGHAT1 and H. SAHEBALZAMANI2
1Faculty of Science, Islamic Azad University, Malard Branch, Malard (Iran).2Departments of Chemistry, Faculty of Science, Islamic Azad University,
Ardabil Branch, Ardabil (Iran).
(Received: February 25, 2012; Accepted: March 25, 2012)
ABSTRACT
Examination of the solid state infrared spectra of the tetramethylammoniumcation in saltsshows correlation of infrared spectral properties with C–H···X hydrogen bonding and crystalhabits in these tetramethylammonium salts. The IR predicted crystal habits are comprised byexperimental and theoretical data. A good relation between three data has been found. The C–Hstretching region characteristic hydrogen bonding shifts in the above salts. In this research threecomplexes of tetramethylammoniumcation have been synthesized and the structures of themhave been analyzed by correlation of vibrational data with crystal structures. These correlationshows that crystal symmetry (Tetrahedral), cation distortion (undistorted), site symmetry (D2d),unite cell symmetry (D4h
7) for (CH3)4NPF6 and crystal symmetry (Tetrahedral), cation distortion(distorted), site symmetry (D2d), unite cell symmetry (D4h
7) for (CH3)4NOH and crystal symmetry(Tetrahedral), cation distortion (undistorted), site symmetry (D2d), unite cell symmetry (D4h
7) for(CH3)4NF.
Key words: Crystal parameter, Vibrational data, Tetramethylammonium salts.
such as Harmon et al., 4-6. On the base of thesestudies founds that the C-H stretching region givescharacteristic hydrogen bonding shifts in thetetramethylammonium salts; this effect is particularlyintense in the halideand hydroxidecompounds. TheC-H deformation modes in the 1400-1500 cm-1
region and N-C breathing band near 950 cm-1 showperturbations which can be qualitatively used toidentify crystal type, and which can be reasonablyexplained by site symmetry and factor groupanalysis considerations. Intensity changes in someabsorption can be empirically related to steric, sizeand packing effects. Infrared spectra are correlatedwith known crystal structures and bond distancesfor ten of the salts in this paper.
MATERIAL AND METHODS
All chemicals were of reagent gradequality such as(CH3)4NOHwas purchased fromMerck company. Tetramethyl ammonium
62 Ghammamy et al., Curr. World Environ., Vol. 7(1), 61-67 (2012)
fluoride,(CH3)4NFwas synthesized by reportedmethod7.
The substrates and the solvents wereused after drying and purifying by distillation byusual procedures. The middle fractions werecollected after rejecting the head and the tailportions. The IR spectra were recorded on aShimadzu model 420 spectrophotometer. The UV/Visible measurements were made on a Shimadzumodel 2100 spectrometer. Proton, 13C, 19F NMR werecarried out on a Bruker AVANCE DRX 500spectrometer at 500, 125, 470.66 MHz. All thechemical shifts are quoted in ppm using the high-frequency positive convention; 1H and 13C NMRspectra were referenced to external SiMe4 and 19FNMR spectra to external CFCl3. This salt wasestimated iodometrically after oxidizing thecompound with acidic persulphate solution.Fluoride content was determined gravimetrically asPbClF8-9. The percentage compositions of carbon,hydrogen and nitrogen were obtained from themicroanalytical Laboratories, Department ofChemistry, OIRC, Tehran.
Synthesis of tetramethylammonium compounds(CH3)4NPF6was prepared inside a glove
box purged with argon. PF5 was dissolved in dryacetonitrile (25 ml) in a polyethylene beaker and astoichiometric amount of tetramethyl-ammoniumfluoride was added with stirring at roomtemperature. Within 5 minutes a solution formedwhich upon refrigerating, gave solid (CH3)4NPF6,which was isolated by filtration. The solid waswashed with dry isopropanol and diethyl ether, anddried under vacuum for 1 hour. UV/Visible, 19F-NMR,13C-NMR and 1H-NMR were used forcharacterization of these compoundsformula.
For (CH3)4NPF6green microcrystallinewas obtained. The compound was finally dried invacuum over phosphorous penfluoride. The yieldof (CH3)4N[MoCl5F] was ca 98%. Satisfactoryelemental analysis was obtained.For (CH3)4NPF6,IR data and spectrum for cation and anions havebeen assigned to different modes, respectively.(Fig.1, Table 1)
For (CH3)4NOH,IRdata and spectrum forcation and anion have been assigned to differentmodes, respectively.(Fig. 2, Table 2)
For (CH3)4NF,IR data and spectrum forcation and anion have been assigned to differentmodes, respectively.(Fig. 3, Table 3)
Structure solution and refinementThe structure of crystallized compounds
have been solved by direct methods and refinedby full-matrix-least squares techniques on F2. Allnon-hydrogen atoms were refined anisotropically.The position of hydrogen atom was assigned anisotropic thermal parameter. Corrections for the LPas well as the empirical correction for absorptionusing the SADABS programs were applied. Allstructural calculations were carried out by usingthe SHELXTL V. 5.10 structure determinationsoftware. The intensity data were collected on aSIMENS SMART CCD diffractometer with graphite-monochromated Mo Ká radiation. The crystalstructure was solved by directed methods9.
RESULTS AND DISCUSSION
The crystal and molecular structure oftetramethylammoniumcompounds, have beendetermined at 130(2) K by X-ray diffraction. X-raydata clearly demonstrate inequality betweendifferent bonds that is responsible for the higherreactivity of these compounds over similar agentsin terms of the amount of solvent required, shortreaction times and high yields. The reason for thisinequality is due to the CH…N hydrogen bond thatforms between the methyl hydrogen of the cationand hydroxide or halide atoms of the anion10. Thistype of hydrogen bonding in tetramethylammoniumsalts has been studied by Harmon et al.The IRspectrum and hydrogen bonding of thesecompounds is similar to the othertetramethylammoniumsalts that show the existenceof hydrogen bonding.
Halo complexes of transition metals arealso as general purpose, stoichiometric oxidant insynthetic organic chemistry,and a variety of reactionpathways including both atom-transfer andelectron-transfer are involved12.
The results of chemical analyses ofthe(CH3)4NPF6green product revealed theoccurrence of C:H:N in the atomic ratio, while thatof chemical determination of the different state of

63Ghammamy et al., Curr. World Environ., Vol. 7(1), 61-67 (2012)
phosphorous by iodometry conspicuously showedthe presence of phosphorous. It may beemphasized that the chemical estimation ofoxidation state of a metal, capable of displayingvariable oxidation numbers, is particularly importantand crucial in assessing its actual oxidation statein a specific compound11.
Also magnetic susceptibilitymeasurements show that (CH3)4NPF6has two odd
electrons. Magnetic moment is 2.91BM that toconfirm to amount mentioned in sources forphosphorous compound and d2 electronicconfiguration of central metal.
The IR spectra of the (CH3)4NPF6recordedboth in KBr and in nujol media showed thecharacteristics of tetramethylammonium (CH3)4N
+
ion, and this part of the spectrum is similar to thatobserved for (CH3)4N
+ in the case of
Table 1: The frequencies (cm-1) and assignment of cation and anion of (CH3)4NPF6
υυυυυ, cm-1 Assignment Intensity υυυυυ, cm-1 Assignment Intensity
(CH3)4N+ (w) 1470 ν15 (s)1400 ν15 (m)1279 νrock (w)470 ν19 (m)446 ν19 (m)
3430 νCH3 + ½19 (w)3370 νCH3 + ½8 (m)3102 νCH3, asym. Str. (s)3015 ν13, νCH3, asym. Str (w)2990 ν14, νCH3, asym. Str. (s) PF6
-
2772 ν14, νCH3, asym. Str (w)2640 ν7 + ν16 (w) 935 νasP-F (s)2470 ν3 + ν8+ ν16 (w) 904 νsP-F (s)1838 ν8 + ν15 636 ν P-F (s)
Table 2: The frequencies (cm-1) and assignment of cation and anion of (CH3)4NOH
υυυυυ, cm-1 Assignment Intensity υυυυυ, cm-1 Assignment Intensity
(CH3)4N+ 1470 ν15 (s)1400 ν15 (m)1279 νrock (w)470 ν19 (m)446 ν19 (m)
3430 νCH3 + ν19 (w)3370 νCH3 + ν8 (m)3102 νCH3, asym. Str. (s)3015 ν13, νCH3, asym. Str (w)2990 ν14, νCH3, asym. Str. (s)2772 ν14, νCH3, asym. Str (w)2640 ν7 + ν16 (w)2470 ν3 + ν8+ ν16 (w)1838 ν8 + ν15 (w)

64 Ghammamy et al., Curr. World Environ., Vol. 7(1), 61-67 (2012)
Table 3: The frequencies (cm-1) and assignment of cation and anion of (CH3)4NF
υυυυυ, cm-1 Assignment Intensity υυυυυ, cm-1 Assignment Intensity
(CH3)4N+ 1470 ν15 (s)1400 ν15 (m)1279 νrock (w)470 ν19 (m)446 ν19 (m)
3430 νCH3 + ν19 (w)3370 νCH3 + ν8 (m)3102 νCH3, asym. Str. (s)3015 ν13, νCH3, asym. Str (w)2990 ν14, νCH3, asym. Str. (s)2772 ν14, νCH3, asym. Str (w)2640 ν7 + ν16 (w)2470 ν3 + ν8+ ν16 (w)1838 ν8 + ν15 (w)
tetramethylammoniumsalt. The additional bandshave been appeared and have been assignedrespectively [11].Which owe their origins to thepresence of coordintatedphosphorous and fluoridegroup at PF6
-ion. Table 1 shows the assignment of(CH3)4NPF6IR spectrum. Thus considering theresults of elemental analyses, chemically estimatedoxidation state phosphorous, electrochemicalanalyses and IR spectral studies it may be safelyinferred that the brown reduced product is(CH3)4NPF6 with the metal occurring asphosphorous.
This again lends support to our notion thatthe phosphorous of(CH3)4NPF6 is reduced to aMolibden species in the oxidations of organicsubstrates studied herein. Calculation of structureof PF6
- by DFT method shows the declined trigonalstructure.
Similar results have been found for(CH3)4NOHand (CH3)4NFcompound.
Infrared and Raman spectra oftetrahedral M(CH3)4 molecules have beendiscussed in considerable details.It is commonlyassumed that tetramethylammonium ion on theaverage has Td symmetry, and an approximatetetrahedral C4N skeleton has been establishedfor many (CH3)4N
+ salts by means of X-ray
crystallography. In this approximation, the 45degrees of vibrational freedom of the ion aredistributed on the symmetry species of point inthis way by: Ãvib=3A1+1A2+4E+4T1+7 T2. The Me4N
+
ion has 19 normal vibrations which belong to thefollowing irreducible representations of itssymmetry group Td: 3A1+A2+4E+4T1.From grouptheoretical it follows that of all these vibrations onlythose with T2 symmetry are infrared active, whereasin isotropic Raman scattering only the A1 modesand in anisotropic scattering only the E and T2
modes are allowed. Species of this type haveseven infrared active T2 bonds under Td symmetry,but formation of hydrogen bonding betweentetramethylammonium and suitable anions candistort Td symmetry of this cation. At this state theinfrared spectrum may be modified through theappearance of previously forbidden bands or thesplitting of bands can arise from the coupling ofthe vibrations of molecules in the same unit cell.By examination of the solid state infrared spectrumof tetramethylammonium ion salt it is possible topredict the lattice, the approximate size of theanion, the closeness of approach of the cation toeach other, the presence or absence of cation toanion hydrogen bonding and whether or not thecation is distorted from tetrahedral. The detailassignment of IR spectrum of tetramethylammonium compounds, show (Fig. 1, 2, 3). The IR

65Ghammamy et al., Curr. World Environ., Vol. 7(1), 61-67 (2012)
Fig. 1: The IR spectrum regions of the (CH3)4NPF6
Fig. 2:The IR spectrum regions of the (CH3)4NOH
Fig. 3: The IR spectrum regions of the (CH3)4NF

66 Ghammamy et al., Curr. World Environ., Vol. 7(1), 61-67 (2012)
specification of (CH3)4NPF6, and symmetrycorrelations shows that this compound iscrystallized such as (CH3)4NClO4 and must havethe same crystal habits and parameters.
The IR spectrum of the (CH3)4NOHandsymmetry correlations shows that this compoundis crystallized such as (CH3)4NCl and must havethe same crystal habits and parameters.The IRspectrum of the (CH3)4NFand symmetry correlationsshows that this compound is crystallized such as(CH3)4NClO4 and must have the same crystal habitsand parameters. The assignments of the IR spectrain tables 1, 2, 3 refer to the cation and anion spectra.The specification of the tetramethylammoniumcompounds, on the base of IR spectra splitting andHarmon regions shows Table 3.As told, if the infraredspectra of the tetramethylammonium ions incrystalline salts correlated with known crystalstructures, it might be possible to predict the crystalhabit of salts where diffraction data are not available.
CONCLUSSIONS
We published these three complexesseparately, but now we compare their spectroscopic dataespecially electronic transitions. As seen the numberand shapes of transitions completely different with threesimilar ions. The salts of [(CH3)4N] were synthesized inone step and characterized by elemental analysis, IR,UV/Visible, and 81F-NMR techniques. Production of thesecompounds show the ability of salts in bromide additionto transition metal and main group elementscompounds. The optimized structures are in goodagreement with the available experimentalresults.These correlation shows that crystal symmetry(Tetrahedral), cation distortion (undistorted), sitesymmetry (D2d), unite cell symmetry (D4h
7) for(CH3)4NPF6 and crystal symmetry (Tetrahedral), cationdistortion (distorted), site symmetry (D2d), unite cellsymmetry (D4h
7) for (CH3)4NOH and crystal symmetry(Tetrahedral), cation distortion (undistorted), sitesymmetry (D2d), unite cell symmetry (D4h
7) for (CH3)4NF.
ACKNOWLEDGMENTS
The authors wish to express their sincerethanks to Dr.Gh. RezaeiBehbahani and IslamicAzad University, for their assistance.
Tab
le 4
: IR
sp
ecif
icat
ion
of
tetr
amet
hyla
mm
on
ium
sal
ts
Com
poun
dC
lass
ific
atio
n o
f IR
Sp
ectr
um
Par
amet
ers
Cry
stal
line
Str
uct
ure
Par
amet
ers
Sym
met
ry
νννν ν s
C-H
δδδδ δ sym
C-H
νννν ν rot
νννν ν rock
CH
3νννν ν B
C
-Nr
ob
sd1
C-X
r ca
l2 C-X
0.5r
min
3 C-X
Cry
stal
4C
atio
n5
site
Un
it6
c
ell
(CH
3)4N
PF
6B
S-
-D
3.04
3.20
2.93
Tet
Un
dis
D2d
D4h
7
(CH
3)4N
OH
BD
--
T3.
783.
612.
75Te
tD
isD
2d
D4h
7
(CH
3)4N
FB
S-
-D
3.04
3.20
2.93
Tet
Un
dis
D2d
D4h
7

67Ghammamy et al., Curr. World Environ., Vol. 7(1), 61-67 (2012)
REFERENCES
1. Crosthwaite J. M., Muldoon M. J., Dixon J.K.,Anderson J. L. andBrennecke J. F., J. Chem.Thermodyn., 37: 559 (2005)
2. Ghammamy S. and Dastpeyman S. TransitionMetal Chemistry, 31: 482 (2006).
3. A. Wahab, Orient. J. Chem., 27(3): 1199-1202(2011).
4. Harmon K. M., Gennick I. and Madeira S. L.J.Phys. Chem.,78: 1845 (1974).
5. Mahjoub A. R., Ghammami S. and KassaeeM. Z.Tetrahedron Lett.,44: 4557 (2003).
6. Granier W., Vilminot S., Vidal J. D. and CotL.J. Fluor. Chem., 19: 123 (1981).
7. Antharjanam P. K. S., Jaseer M., Ragi K. N.and Prasad E.,J. Photochem. Photobiol. A:Chem., 203: 50 (2009).
8. Christe K. O., Wilson W. W., Wilson R. D., BauR. and Feng J.,J. Am. Chem. Soc., 112: 7619(1990).
9. Zhao D. Z., Fei R. and Scopelliti P., J.Inorg.Chem., 43: 2197 (2004).
10. Mahjoub A. R., Ghammami S., Abbasi A. R.,Hossainian A J. Chem. Res., 200: 48 (2000).
11. Ghammamy S. and RahnamaBaghy M.Russ.J. Inorg. Chem., 32:456 (2007).
12. Anouti M., Caillon-Caravanier M., Dridi Y.,Jacquemin J., Hardacre C. and LemordantD., J. Chem.Thermodyn., 41: 799 (2009).
13. Ghammamy S., Wing-Tak W.,Rahnamabaghy M., Mehrani K., Afrand H.and DastpeymanS.J. Coord. Chem., 61:3225 (2008).

INTRODUCTION
Highly swelling polymers, i.e. superabsorbent hydrogels, are hydrophilic, threedimensional networks that can absorb water in theamount from 10% up to thousands of times theirdry weight. They are widely used in variousapplications such as hygienic, foods, cosmetics,and agriculture1. This accounts for increase in theworldwide production of superabsorbent polymers(SAPs) from 6000 tons in 1983 to 450000 tons in1996 2-4. Nowadays, the worldwide production ofSAPs is more than one million tons in year. Hence,synthesis and characterization of superabsorbenthydrogels is the main goal of the several researchgroups in the world3-6.
Pectin is a naturally occurring biopolymerthat is finding increasing applications in thepharmaceutical and biotechnology industry. It hasbeen used successfully for many years in the foodand beverage industry as a thickening agent, a
Current World Environment Vol. 7(1), 69-77 (2012)
Synthesis and Investigation of a Novel pH- andSalt-Responsive Superabsorbent Hydrogel Based on Pectin
MOHAMMAD SADEGHI*, ESMAT MOHAMMADINASAB and FATEMEH SHAFIEI
Department of Chemistry, Science Faculty, Islamic Azad University, Arak Branch, Arak (Iran).
(Received: March 25, 2012; Accepted: April 13, 2012)
ABSTRACT
In the present paper, attention is paid to synthesis and investigates swelling behavior of asuperabsorbent hydrogel based on Pectin (Pec) and polyacrylic acid (PAcA). acrylic acid (AcA)was graft copolymerized onto Pectin backbones by a free radical polymerization technique usingammonium persulfate (APS) as initiator and methylene bisacrylamide (MBA) as a crosslinker. Aproposed mechanism for hydrogel formation was suggested and the structure of the product wasestablished using FTIR and SEM spectroscopies. Under the optimized conditions concluded,maximum capacity of swelling in distilled water was found to be 348 g/g. Absorbency of thesynthesized hydrogels was also measured in NaCl and CaCl2 salt solutions. Results indicated thatthe swelling ratios in compare to water decreased with an increase in the ionic strength of solution.In addition, swelling capacity was conducted in solutions with pH ranged from 1 to 13. The H-Pec-poly(sodium acrylate) hydrogel exhibited a pH-responsiveness character so that a swelling-deswelling pulsatile behavior was recorded at pHs 3 and 9.
Key words: Pectin, Hydrogel, pH- and salt-responsive, Acrylic acid monomer.
gelling agent and a colloidal stabiliser. Pectin alsohas several unique properties that have enabled itto be used as a matrix for the entrapment and/ordelivery of a variety of drugs, proteins and cells.
The modification of natural polymers is apromising method for the preparation ofsuperabsorbt hydrogels. Graft copolymerization ofvinyl monomers onto natural polymers is anefficient approach to achieve these materials.Superabsorbing resins were first developed with aview to utilizing agricultural materials, and are typedby the hydrolyzed starch-g-poly(acrylonitrile), H-SPAN6. Since then, starches from differentresources as well as other polysaccharides, forexample, cellulose 8, hydroxyethyl cellulose, agar ,sodium alginate and guar gum were graftcopolymerized to achieve water absorbingpolymers. Polyacrylonitrile (PAN), polyacryamide,and poly(acrylic acid) 10-11 have been frequentlygrafted, mostly onto starch, using different initiatorsespecially the ceric-saccharide redox system12.

70 Sadeghi et al., Curr. World Environ., Vol. 7(1), 69-77 (2012)
Radical polymerization, however, has severaldisadvantages. The reproducibility of this methodis poor, and there is little control over the graftingprocess, so the molecular weight distribution ispolydisperse. In addition, the necessity for inertgases (e.g., argon) to prepare an oxygen-freeatmosphere and the need for initiators, toxic and/or expensive monomers, and crosslinkers are otherdisadvantages of free-radical polymerizationreactions. These problems have been reviewed indetail 12-13. For the first time, Fanta et al. 14, with anew method, tried to synthesize of HSPANsuperabsorbent hydrogel. They indicated by asolubility test that crosslinks were formed duringgraft copolymerization, by coupling of the twogrowing PAN radicals, and during saponification,by the attack of Pectin alkoxide ions on the nitrilegroups as the initioation reaction of nitrilepolymerization in the early stages of saponification.The nitrile groups of PAN were converted to amixture of hydrophilic carboxamide and carboxylategroups during alkaline hydrolysis followed by insitu crosslinking of the grafted PAN chains. Theinitially formed oxygen–carbon bonds between thePectin hydroxyls and nitrile groups of the PANchains remained crosslinking sites. Then, Fantaand Doane 14 attempted to extend this idea to thepreparation of superabsorbent hydrogels by thesaponification of PAN in the presence of polyhydroxypolymers. Finally, Yamaguchi et al.115 reported thepreparation of superabsorbing polymers frommixtures of PAN and various saccharides oralcohols. In this investigation, we paid attention tothe synthesis and investigation of a superabsorbentbased on Pectin and PAcA. The effects of thevariables reaction on the swelling properties as wellas the salt and pH sensitivity of the hydrogels wereinvestigated.
EXPERIMENTAL
MaterialsPectin (chemical grade, MW 50000) was
purchased from Merck Chemical Co. (Germany).Acrylic acid (AcA, Merck) was used after vacuumdistillation. Ammonium persulfate (APS, Merck) andMethylene bisacrylamide (MBA, Fluka) were usedas received. All other chemicals were of analyticalgrade.Preparation of hydrogel
Preparation of hydrogelA facial one step preparative method was
used for synthesis of Pec-poly(sodium acrylate)hydrogel, Pec-poly(NaAcA), hydrogel. Pectin(0.50-1.5 g) was added to a three-neck reactor equippedwith a mechanical stirrer (Heidolph RZR 2021, threeblade propeller type, 50-500 rpm), including 35 mLdoubly distilled water. The reactor was immersedin a thermostated water bath. After completedissolution of Pectin to form a homogeneoussolution , a definite amount of APS solution (0.15 gin 5 mL H2O) was added to pectin solution and wasallowed to stir for 10 min. After adding APS, certainamounts of monomer (AcA 1.50 g in 5 mL H2O )was added to the pectin solution. MBA solution(0.08 g in 5 ml H2O) was added to the reactionmixture after the addition of monomer and themixture was continuously stirred. After 60 min, thereaction product was allowed to cool to ambienttemperature and neutralized to pH 9 by addition of1N sodium hydroxide solution. The hydrogel waspoured to excess non solvent ethanol (200 mL)and kept for 3 h to dewater. Then ethanol wasdecanted and the product scissored to small pieces.Again, 100 mL fresh ethanol was added and thehydrogel was kept for 24 h. Finally, the filteredhydrogel is dried in oven at 60oC for 10 h. Aftergrinding using mortar, the powderedsuperabsorbent was stored away from moisture,heat and light16.
Swelling measurements using tea bagmethod
The tea bag (i.e. a 100 mesh nylon screen)containing an accurately weighed powderedsample (0.5 ± 0.001 g) with average particle sizesbetween 40–60 mesh (250-350 m ) wasimmersed entirely in distilled water (200 mL) ordesired salt solution (100 mL) and allowed to soakfor 3 h at room temperature. The tea bag was hungup for 15 min in order to remove the excess fluid.The equilibrated swelling (ES) was measured twiceusing the following equation17:
...(1)
The accuracy of the measurements was±3%.

71Sadeghi et al., Curr. World Environ., Vol. 7(1), 69-77 (2012)
Fig. 1: FTIR spectra of pure pectin (a) and H-Pec-poly(sodium acrylate) hydrogel (b).
Absorbency at various pHsIndividual solutions with acidic and basic
pHs were prepared by dilution of NaOH (pH 13.0)and HCl (pH 1.0) solutions to achieve pH≥6.0 andpH<6.0, respectively. The pH values were preciselychecked by a pH-meter (Metrohm/620, accuracy±0.1). Then, 0.5 ± 0.001 g of the dried hydrogelwas used for the swelling measurementsaccording to Eq. 1.
pH-sensitivitypH-sensitivity of the hydrogel was
investigated in terms of swelling and deswelling ofthe final product at two basic (pH 9.0) and acidic(pH 3.0) solutions, respectively. Swelling capacity
of the hydrogels at each pH was measuredaccording to Eq. 1 at consecutive time intervals (50min).
Instrumental analysisFourier transform infrared (FTIR) spectra
of samples were taken in KBr pellets, using an ABBBomem MB-100 FTIR spectrophotometer (Quebec,Canada), at room temperature. The surfacemorphology of the gel was examined usingscanning electron microscopy (SEM). After Soxhletextraction with methanol for 24 h and drying in anoven, superabsorbent powder was coated with athin layer of gold and imaged in a SEM instrument(Leo, 1455 VP).

72 Sadeghi et al., Curr. World Environ., Vol. 7(1), 69-77 (2012)
Fig. 2: SEM photograph of the pure Pectin(a), and H-Pec-poly(sodium acrylate) hydrogel.Surfaces of hydrogel was taken at a magnification of 2000, and the scale bar is 10 ìm.
RESULTS AND DISCUSSION
Synthesis of hydrogelsA general reaction mechanism for Pec-
polyacrylic acid hydrogel formation is shown inScheme 1. At the first step, the thermallydissociating initiator, i.e. APS, is decomposed underheating to produce sulfate anion-radical. Then, theanion-radical abstracts hydrogen from one of thefunctional group in side chains (i.e. OH) of thesubstrate to form corresponding radical (alkoxideradicals). Then, these macroalkoxides initiatecrosslinking reaction between some adjacentpolyacrylic acid pendant chains. In addition,
crosslinking reaction was carried out in the presenceof a crosslinker, i.e., MBA, so that a threedimensional network was obtained.Scheme 1.
FTIR spectroscopyThe monomer grafting was confirmed by
comparing the FTIR spectra of the pectin substratewith that of the grafted products in Fig. 1. The bandsobserved at 1643 cm-1 and 1705 cm-1 can beattributed to C=O stretching in carboxamide andcarboxylate functional groups of crosslinker andgrafted acrylic acid monomers on to pectinbackbone respectively. The band observed at 1553

73Sadeghi et al., Curr. World Environ., Vol. 7(1), 69-77 (2012)
Fig. 4: On-off switching behavior as reversible pulsatile swelling (pH 9.0) and deswelling (pH 3.0)of the hydrogel.
Fig. 3: Effect of pH of buffered solution on swelling of H-Pec-poly(sodium acrylate) hydrogel.
cm-1 due to asymmetric stretching in carboxylateanion that is reconfirmed by another peak at 1411cm-1 which is related to the symmetric stretchingmode of the carboxylate anion20.
Scanning electron microscopyOne of the most important properties that
must be considered is hydrogel microstructure
morphologies. The surface morphology of thesamples was investigated by scanning electronmicroscopy. Fig. 2 shows an SEM micrograph ofthe polymeric hydrogels obtained from the fracturesurface. The hydrogel has a porous structure. It issupposed that these pores are the regions of waterpermeation and interaction sites of external stimuliwith the hydrophilic groups of the graft copolymers.
Sw
ellin
g, g
/gS
wel
ling,
g/g
Time (min)

74 Sadeghi et al., Curr. World Environ., Vol. 7(1), 69-77 (2012)
Fig. 5: swelling–deswelling cycle of the H-Pec-poly(sodium acrylate) hydrogel indistilated water and 0.9 wt% sodium choloride salt.
Fig. 6: swelling–deswelling cycle of the H-Pec-poly(sodium acrylate) hydrogel insodium choloride and calcium choloride solution(0.9 wt%) .
Effect of pH on Equilibrium SwellingSince the H-Pec-poly(sodium acrylate)
hydrogel comprise anionic carboxylate groups, theyexhibit sharp swelling changes at a wide range ofpHs. Therefore, the equilibrium swelling of H-Pec-poly(sodium acrylate) hydrogel was measured atvarious buffer solutions with pH ranged from 1 to13 (Fig. 3). Under acidic pHs, most of the carboxylate
anions are protonated, so the main anion-anionrepulsive forces are eliminated and consequentlyswelling values are decreased19. At higher pHs 5-9,some of carboxylate groups are ionized and theelectrostatic repulsion between COO- groupscauses an enhancement of the swelling capacity.Again, a charge screening effect of the counter ions(cations) limit the swelling at higher basic pHs(pHs>9).
Sw
ellin
g, g
/g
Time (min)
Sw
ellin
g, g
/g
Time (min)

75Sadeghi et al., Curr. World Environ., Vol. 7(1), 69-77 (2012)
pH-responsiveness Behavior of the HydrogelIn this series of experiments, the pH-
dependent swelling reversibility of the H-Pec-poly(sodium acrylate) hydrogel was examined intwo acidic and basic buffered solutions. Fig. 4 showsthe reversible swelling-deswelling behavior of thehydrogel at pHs 3.0 and 9.0. At pH 9.0, the hydrogelswells due to anion-anion repulsive electrostaticforces, while at pH 3.0, it shrinks within a few minutesdue to ½screening effect½ of excess cations. Thissudden and sharp swelling-deswelling behaviorat different pH values makes the system to be highlypH-responsive and consequently it may be asuitable candidate for designing controlled drugdelivery systems. This behavior has also beenobserved in the case of commercial acrylic acid-based SAPs15 as a standard crosslinkedpolyelectrolyte. Similar swelling-pH dependencieshave been reported in the case of other hydrogelsystems 21-22.
Salt-sensitivity of H-Pec-poly(sodiumacrylate) hydrogel
The swelling capacity of superabsorbenthydrogels could be significantly affected by variousfactors of the external solutions such as its valenciesand salt concentration. The presence of ions in the
swelling medium has a profound effect on theabsorbency behavior of the superabsorbenthydrogels. Many theories were reported in the caseof swelling behavior of ionic hydrogels in salinesolutions. The simplest one of the theories isDonnan equilibrium theory. This theory attributesthe electrostatic interactions (ion swelling pressure)to the difference between the osmotic pressure offreely mobile ions in the gel and in the outersolutions. The osmotic pressure is the driving forcefor swelling of superabsorbents. Increasing theionic mobile ion concentration difference betweenthe polymer gel and external medium which, inturn, reduces the gel volume, i.e. the gel shrinksand swelling capacity decreases (charge screeningeffect). In addition, in the case of salt solutions withmultivalent cations, “ionic crosslinking” at surfaceof particles causing an appreciably decrease inswelling capacity. For example, Castel et al.reported that calcium ion can drastically decreasethe swelling capacity for a hydrolyzed starch-graft-polyacrylonitrile, due to the complexing ability ofthe carboxylate group to include the formation ofintra- and inter-molecular complexes23.
In fact,Since the pectin-based hydrogelsare comprised poly(NaAA) chains with carboxylate
Scheme. 1: Proposed mechanistic pathway for synthesis of the pectin-based hydrogels.

76 Sadeghi et al., Curr. World Environ., Vol. 7(1), 69-77 (2012)
groups that can interact with cations, they exhibitvarious swelling capacity in different salt solutionswith same concentrations. The effect of cation onswelling can be concluded from Figure 5. In saltsolution, degree of crosslinking is increased andswelling is consequently decreased. Therefore, theabsorbency of the synthesized hydrogel is in theorder of H2O > NaCl. In the presence of the bivalentcalcium ions, the crosslinking density intensityincreases because of a double interaction of Ca2+þwith carboxylate groups leading to “ioniccrosslinking”. The swelling–deswelling cycle of thehydrogel in sodium and calcium salts are shown inFig. 6. In sodium solution, swelling of the hydrogelis increased with time. When this hydrogel isimmersed in calcium chloride solution, it deswellsto a collapsed form. When the shrinked hydrogel isimmersed in sodium chloride solution again, thecalcium ions are replaced by sodium ions. This ionexchange disrupts the ionic crosslinks leading toswelling enhancement. As a result, when hydrogelis treated alternatively with NaCl and CaCl2
solutions with equal molarity, the swellingreversibility of hydrogel is observed21-24.
CONCLUSION
A novel superabsorbent hydrogel, H-Pec-poly(sodium acrylate), was synthesized in anaqueous solution by graft copolymerization ofacrylic acid onto pectin. The maximum waterabsorbency in distillated water (348 g/g) wasachieved. Swelling measurement in NaCl saltsolutions shows a swelling-loss, in comparison withdistilled water. This behavior can be attributed tocharge screening effect and ionic crosslinking formono- and multi-valent cations, respectively. Inaddition, the swelling of hydrogels in solutions withvarious pHs, exhibited high sensitivity to pH, sothat the pH reversibility and on-off switchingbehavior makes the intelligent hydrogel as a goodcandidate for considering as potential carriers forbioactive agents, e.g. drugs.
REFERENCES
1. Buchholz, F.L., Graham, A.T. ModernSuperabsorbent Polymer Technology, NewYork: Wiley, (1997).
2. Cheng, H., Zhu, J.L., Sun, Y.X., Cheng, S.X.,Zhang, X.Z., Zhuo, R.X. Bioconjug.Chem.19: 1368-1374 (2008).
3. Chu, L.Y., Kim, J.W., Shah, R.K., Weitz, D.A.Adv. Funct. Mater.17: 3499-3504 (2007).
4. Chu, L.Y., Yamaguchi, T., Nakao, S.Adv.Mater. 14: 386-389 (2002).
5. Crescenzi,V., Cornelio, L.,DiMeo,C.Nardecchia, S.,Lamanna, R.Biomacromolecules. 8: 1844-1850 (2007).
6. J. Wu, J. Lin, M. Zhou, C. Wei, Macromol.Rapid Commun. 21: 1032-1034 (2000).
7. Eddington, D.T., Beebe, D.J.Adv. Drug Deliv.Rev. 56: 199-210 (2004).
8. J. Lin, J. Wu, Z. Yang, M. Pu, Polymers &Polymer Composites., 9: 469-471 (2001).
9. J. Wu, Y. Wei, J. Lin, S. Lin, Polymer. 44:6513-6520 (2003).
10. Hoffman, A. S. Polymeric MaterialsEncyclopedia;, Salamone, J. C.; Ed.; CRC
Press, Boca Raton, FL. 5: 3282 (1996).11. Kirk RE, Othmer DF. Encyclopedia of
Chemical Technology, Kroschwitz JI, Howe-Grant M. (eds). John Wiley & Sons: New York,4: 942 (1992).
12. Barvic, M.; Kliment, K.; Zavadil, M. J. BiomedMater Res.1: 313-323 (1967).
13. Chirila, T. V.; Constable, I. J.; Crawford, G.J.; Vijayasekaran, S.; Thompson, D. E.;Chen, Y. C.; Fletcher, W. A.; Griffin, B. J.Biomaterials., 14: 26-38 (1993).
14. G.F. Fanta, W.M. Doane, Grafted Starches,in: Modified Starches: Properties and Uses,Q.B. Wurzburg, (Ed.), CRC Press, BocaRaton (Florida), 149: (1986).
15. Yamaguchi, M.; Watamoto, H.; Sakamoto,M. Carbohydr Polym., 9: 15 (1988).
16. Pourjavadi A, Harzandi AM, HosseinzadehH.Eur. Polym. J. 40: 1363 (2004).
17. Flory PJ. Principles of Polymer Chemistry,Ithaca, Cornell University Press, New York,(1953).
18. Lim, D.W.; Whang, H.S.; Yoon, K.J. J Appl

77Sadeghi et al., Curr. World Environ., Vol. 7(1), 69-77 (2012)
Polym Sci, 79: 1423-1430 (2001).19. Hosseinzadeh, H.; Pourjavadi, A.;
Zohouriaan-Mehr, M. J.; Mahdavinia, G. R. JBioact Compat Polym, 20: 475-491(2005).
20. Silverstein RM, Webster FX. SpectrometricIdentification of Organic Compounds, 6th
Edn., Wiley, New York, (1998).21. G. R. Mahdavinia, A. Pourjavadi, H.
Hosseinzadeh, M.J. Zohuriaan-Mehr, Eur.Polym. J. 40: 1399-1407 (2004).
22. Chen J, Zhao Y.J Appl Polym Sci. 75: 808(2000).
23. Lim DW, Whang HS, Yoon KJ. J. Appl.Polym. Sci. 79: 1423 (2001).
24. Barbucci R, Maganani A, ConsumiM.Macromolecules; 33: 7475 (2000).

INTRODUCTION
Emissions of many air pollutants havebeen shown to have variety of negative effects onpublic health and the natural environment .Emissions that are principal pollutants of concerninclude: Hydrocarbons, Carbon monoxide(CO),Nitrogen oxides (NOx), Particulate matter, Sulfuroxide (SOx), Volatile organic compounds (VOCs).hydrocarbons are toxins. Hydrocarbons are a majorcontributor to smog, which can be a major problemin urban areas. Carbon Monoxide poisoning is alsoa major killer. By 1964, most new cars sold in theU.S. were so equipped, and PCV quickly becamestandard equipment on all vehicles worldwide(Rosen and Erwin, 1975).
Air pollution and cars were first linked inthe early 1950’s by a California researcher whodetermined that traffic was to blame for the smoggyskies over Los Angeles. At the time, typical newcars were emitting nearly 13 grams per milehydrocarbons (HC), 3.6 grams per mile nitrogenoxides (NOx), and 87 grams per mile carbonmonoxide (CO) (Milestones in AutomobileEmissions, 1994). Emission levels are dependent
Current World Environment Vol. 7(1), 79-85 (2012)
Investigation of Exhaust Emission Factors Based onVehicle Models
FARNAZ TAKIZAD
Department of Environment, Tonekabon Branch, Islamic Azad University, Tonekabon (Iran).
(Received: May 09, 2012; Accepted: June 10, 2012)
ABSTRACT
Hydrocarbon and Carbon monoxide emissions in passenger cars of Iran’s production is veryhigh. This research is trying to technical examination of three vehicle models (Pride, Peugeot 206and Samand) production of 2004, 2006 and 2008 check out amount of HC and CO emissions.MGT5 device was used to measure exhaust emission factors from this vehicle. The result of thisstudy indicate that Pride and 206 Peugeot production of 2006 and Samand production of 2004have most pollution in the production of HC. Most CO emissions was in vehicle production of 2004.Samand and Pride have lowest and most emissions, respectively. vehicles manufactured in 2008is close to Euro IV Standard. However, vehicles manufactured since 2004 are Euro II standard. byincreasing vehicle age was obsorved emissions increase.
Key words: HC and CO emissions, Vehicle, Pride, Samand, Peugeot 206.
upon many parameter including vehivle-relatedfactors such as model. Size, fuel type, technologylevel and milage, and opration factors such asspeed, acceleration, gear selection, road gradientand ambient temperature (Boulter et al, 2007). Thepower to move a car comes from burning fuel in anengine. Pollution from cars comes from by-productsof this combustion process (exhaust) and fromevaporation of the fuel itself (Automobile Emissions,1994).
Similarly, Ford Motor Company ChemistryDepartment Research Staff has instrumented a1992 Aerostar van with Fourier transform infra-redinstrumentation to measure approximately 20species of emissions (e.g., CO, CO2, methane, totalhydrocarbons, NO, and so forth) at high timeresolution while on the road (Jession, 1994). Dieselengines while they have many advantages, theyalso have the disadvantage of emitting significantamounts of particulate matter (PM) and the oxidesof nitrogen (NOx) and lesser amounts ofhydrocarbon (HC), carbon monoxide (CO) and toxicair pollutants (Manufacturers of Emission ControlsAssociation. 2009).

80 Takizad, Curr. World Environ., Vol. 7(1), 79-85 (2012)
Air pollution is the most seriousenvironmental problem in Tehran with exhaustemissions from spark-ignition engines accountingfor a major part of problem. The formation andaccumulation of deposits on the internal surfacesof engines could adversely affect the exhaustemission from vehicles. It is the perception thatsome of fuel additives can remove these depositsdue to their detergency. It is found that thedecarbonization process could reduce the exhaustCO and HC emissions, significantly. Emissions fromPeykan and Pride vehicles decreased considerablyafter decarbonization (Daryabeigi Zand et al, 2007).
Quoting from Office of Vehicle If youconsider the useful life of passenger cars in 20years, This means that the vehicles to get out beforethe 1982, Number 1541200 old car are the traffic inIran that make up The 40.21 percent of all passengervehicles. According to statistical surveys, The shareof cars in polluted air are approximately 60% andother emissions are about 40% (Khanfekr et al,2009). about 1.5 million tons of pollutants areproduced in Tehran every year. Carbon monoxidemakes up a large percentage of this material(Roshan Zamir and Eikani, 2004). Given that theshare of hydrocarbon and Carbon monoxideemissions in passenger cars of Iran’s production isvery high, This research is trying to technicalexamination of three vehicle models (Pride,Peugeot 206 and Samand) production of 2004,2006 and 2008 check out amount of HC and COemissions produced from this vehicle.
MATERIAL AND METHODS
Technical examination as an acceptedmethod was done around the world by governmentagencies or quasi-governmental for evaluation ofvehicles that consistent with defined standards ofsafety and pollution. This study was done 2011 andwas attempted using the data collected in previousyears by the center of vehicl technical examination.Three types of domestically produced cars (Pride,Peugeot 206 and Samand modeles years 2004,2006 and 2008) based on years of production andoperation were compared the amount of emissions.
MGT5 device was used to measureexhaust emission factors from gasoline-powered
vehicles such as CO2 - CO - HC - O2 - NO. If thevehicle is out of state or there is a defect inperformance ignition systems, exhaust pollutantswill go beyond the standard. This device consists ofa Propp that placed inside the vehicle exhaust andPumps. MGT5 device analysis the exhaust gasesby using a computer system and displays on themonitor or LED. Then the result of vehicle test isprinted. CO and HC emissions of exhaust gases ofvehicles, operating years and car model are theinput data of this study. It is worth noting that theamount of suffering to pass a technical examinationof the test are as follows: in Auto injector for the COgas approval number is up 2.5 and HC gas tonumber 250.
RESULTS AND DISCUSSION
Pay attention to Table1, between HCemission of Samand vehicle and 206 Peugeotproduction of 2004 is no significant difference. Itmeans, The amount of their pollution is closetogether but the difference emissions of Samand,Pride and 206 Peugeot, Pride in this year’sproduction is significant at level of 0.05 percent.between HC emission in vehicles produced 2006and 2008 is no significant difference exept of Prideand Samand cars production in 2008, thisdifference is significant because of Samand car isbe more modern.
Result of correlation measure the amountof CO emission of vehicle manufactured of 2004,2006 and 2008 showed that only betweenemissions of Peugeot 206 and Pride production of2008 are no significant difference. Between theamount of CO emission in other vehicelesproduction of different years in this study aresignificant different at level of 0.05 percent (table2). Kelly and Groblicki, 1993 found that duringmoderate to heavy loads on the engine, the vehicleran under fuel enrichment conditions, resulting inCO emissions 2,500 times greater than those atnormal stoichiometric operation (HC was 40 timesas great).
LeBlanc et al 1995 in their study appearcapable of adequately distinguishing the COemission effects associated with variations inengine and vehicle operations for individual vehicle

81Takizad, Curr. World Environ., Vol. 7(1), 79-85 (2012)
makes and models. However, it should be notedthat the large variability in vehicle-to-vehicle COemission response to changes in operating modesthat has been noted in ongoing studies indicatesthat a model based on vehicle speed andacceleration profiles alone may not providesufficient CO emission rate predictive capabilitiesfor the fleet.
97 percent of CO and 92.8 percent of HCin Tehran air caused by pollution from thetransportation sector in 1995 year (Department ofEnergy, 1996). in 2008 year, The share of HC andCO emissions from passenger cars was 59 percentand 88 percent, respectively in Iran (Department ofEnergy, 1999). Yli-Tuomi et al (2005) by researchon emissions of fine particles, NOx and CO from
Table 2: Correlation measures the amount of CO betweenPride, Peugeot 206 and Samand, production of 2004,
2006 and 2008 years by using the Pearson correlation test
Production 2004
Pride*206 Samand* Pride Samand* 206
Pearson Correlation 0.05 0.055 0.001Sig. (2-tailed) 0.01 0.031 0.05N 344 363 365
2006 productionPearson Correlation -0.051 -0.028 -0.035Sig. (2-tailed) 0.01 0.05 0.02N 397 392 402
2008 productionPearson Correlation 0.014 0.015 0.061Sig. (2-tailed) 0.056 0.042 0.022N 393 393 388
Table1: Correlation measures the amount of HC between Pride, Peugeot206 and Samand, production of 2004, 2006 and 2008 years by using the
Pearson correlation test.
Production 2004
Pride*206 Samand* Pride Samand* 206
Pearson Correlation -0.065 0.098 -0.04Sig. (2-tailed) 0. 01 0.05 0.417N 411 395 407
2006 productionPearson Correlation -0.024 -0.043 -0.07Sig. (2-tailed) 0.063 0. 053 0. 161N 395 391 398
2008 productionPearson Correlation 0.001 0.003 0.001Sig. (2-tailed) 0.093 0.04 0.098N 393 393 388

82 Takizad, Curr. World Environ., Vol. 7(1), 79-85 (2012)
Table 3:European emission standards for CO emission in passenger cars (g/km).
Euro I Euro II Euro III Euro IV Euro V Euro VI (future)July 1992 January 1996 January 2000 January 2005 September 2009 September 2014
2.72 (3.16) 1.0 0.64 0.5 0.5 0.5
on-road vehicles in Finland resulted: Relative tofixed site urban PM2.5, street air PM2.5concentrations of Cu, BC, Fe, and Zn were elevated.Weather and road conditions influenced PMconcentrations more than the differences betweenthe city and highway traffic environments.
Iran’s government in line withenvironmental protection and prevent air pollution,Timeline standards limit emissions of gasoline,diesel and dual burner vehicles, Domestic andimported and motorcycles be determined.Accordingly, the standards limit emissions of lightvehicles, semi-heavy and heavy vehicles in 2010and 2011 is Euro II, But the years 2012, 2013 and2014 the vehicles must earn Euro IV standard. Table3 shows european emission standards for COemission in passenger cars.
The results of Table 4 indicate that Prideand 206 Peugeot production of 2006 and Samandproduction of 2004 have most pollution in theproduction of HC. Most CO emissions was observedin vehicle production of 2004. Samand and Pridehave lowest and most emissions, respectively.
According to the results in table 4 can be said newercar models closer to international standards andwe see a reduction of gas emissions. Comparisonof CO emissions with Europe emissions standardscan be stated vehicles manufactured in 2008 isclose to Euro IV standard. However, vehiclesmanufactured since 2004 are Euro II standard. byincreasing vehicle age we have emissions increase.
Kuhns et al in 2004 resulted that Emissionfactors were related to vehicle age, weight classand fuel type by matching license IDs to the stateregistration data. No relationship was observedbetween PM (particulate matter) emissions and VSP(vehicle specific power). PM emission factors fromLDGV (light-duty gasoline vehicles) increased withvehicle age. Good agreement was observed for HCemission factors for vehicles less than 20 yearsold. CO emission factors were 2 times greater thanmeasured CO emission factors for vehicles lessthan 13 years old. Measured NO emission factorswere 50% greater than factors for vehicles 7–15years old but in good agreement for vehicles lessthan 7 years old. Measured PM emission factorsshowed a clear increase with vehicle age.
Table 4: The average HC and CO emissions during 2004, 2006 and 2008 yearsbetween three Production: Pride, Peugeot 206 and Samand
Mean Std. Error Mean Mean Std. Error Mean
HC Pride CO Pride2004 129.37 3.98 2004 0.91 0.0882006 142.12 3.68 2006 0.43 0.0292008 111.22 3.70 2008 0.27 0.020HC 206 Peugeot CO 206 Peugeot2004 75.66 2.87 2004 0.71 0.042006 89.89 4.63 2006 0.64 0.032008 79.15 2.77 2008 0.41 0.024HC Samand CO Samand2004 95.38 4.74 2004 0.69 0.0422006 88.63 5.58 2006 0.68 0.0452008 47.11 3.24 2008 0.24 0.023

83Takizad, Curr. World Environ., Vol. 7(1), 79-85 (2012)
Wang et al (2012) shows that trucks withhigh BC EFs do not usually have high NOx EFs,and vice versa, indicating that the current emissionstandards implemented in Beijing and nationwidehave only limited impact on NOx emissions
control.Therefore, effective multi-pollutant controlstrategies and in-use compliance programs areimperative to reduce the overall emissions from thetransportation sector.
Table 6: Correlation measures the amount of CO betweenproduction years (2004, 2006 and 2008) by using t test
in three modeles: Pride, Samand and 206 Peugeot
CO Pride2004*2006 2004*2008 2006*2008
Pearson Correlation 0.008 -0.025 -0.033DF 366 366 395t 5.6 6.697 4.33Sig. (2-tailed) 0 0 0
CO 206 PeugeotPearson Correlation 0.039 -0.029 -0.098DF 372 368 397t 6.3 6.233 5.334Sig. (2-tailed) 0 0 0
CO SamandPearson Correlation 0.004 0.023 - 0.054DF 390 389 390t 9.2 9.44 8.625Sig. (2-tailed) 0 0 0
Table 5: Correlation measures the amount of HC between productionyears (2004, 2006 and 2008) by using t test in three modeles:
Pride, Samand and 206 Peugeot
HC Pride2004*2006 2004*2008 2006*2008
Pearson Correlation 0.08 0.057 0.018DF 393 398 392t -2.42 3.801 5.783Sig. (2-tailed) 0.016 0 0
HC 206 PeugeotPearson Correlation -0.009 0.11 0.63DF 413 409 396t -2.161 -0.85 1.573Sig. (2-tailed) 0.031 0.039 0.001
HC SamandPearson Correlation -0.076 -0.019 0.032DF 390 389 390t 0.89 8.22 6.268Sig. (2-tailed) 0.037 0 0

84 Takizad, Curr. World Environ., Vol. 7(1), 79-85 (2012)
Another test that was used to measure theHC and CO emissions in three models of vehicle indifferent years was t test. This test was performedon a product in 2004, 2006 and 2008 years. Theresults showed that between HC emission invehicles manufactured in 2004, 2006 and 206Peugeot manufactured of 2004 and 2008 aresignificant difference at the level of 0.05 percent.This difference between models of vehiclesmanufactured of 2004 and 2008 , 2006 and 2008years was quite significant at level of 0.01 percent(table 5).pay attention to table 6, amount of COemission between 2004 and 2006, 2004 and 2008,2006 and 2008 years in Samand, Pride and 206Peugeot have significant different at level of 0.01percent. It is reason to reduce emissions of HC andCO in the newer cars.
Experimental results of (Horng Tsai etal,2000), indicate that the emissions of CO and THCfrom in-use motorcycles are significantly higher thannew ones, but not for NOx, and the emissions ofTHC from 2-stroke motorcycles are much higherthan 4-stroke ones. The emissions of VOCs (volatileorganic compounds) from in-use motorcycles arehigher than new motorcycles for all five drivingpatterns, and those from 2-stroke engines arehigher than 4-stroke motorcycles. Emission of VOCsin the modes of deceleration and idle accounts forthe most mass emitted during the test driving cycle.
There is reasonable agreement betweenthe different types of studies for emissions of NOx,but agreement for emissions of other pollutants isqualitative. Remote sensing studies indicate thatemissions of NO are normally distributed, whileemissions of CO and HC are skewed to a few highemitting vehicles. (Yanowitz. et al, 2000) indicatethat average emissions of PM, CO, and HC havebeen reduced during the past two decades, butaverage emissions of NOx have not changed. Thus,emissions regulations for PM have been somewhateffective, although the degree of PM reduction isless than expected based on changes in thestandards. Emission regulations have apparentlynot been effective at reducing in-use NOx. Incomparison, there are estimates that transit busesgenerate less than 5% of the vehicle miles traveledfor heavy-duty vehicles.
CONCLUSION
Today one of the important factorsaffecting the issue of vehicle emissions is receivingtax of the vehicles. in Europe and other developedcountries around the world receiving tax dependson their pollution. High consumption and highpolluting vehicles pay more taxes . for approachingemissions standards to international standardsshould be made legal with non-standard productsand with full compliance standardization of vehiclesand construction technical examination centerstrying to improve pollution problem in Iran.
REFERENCES
1. Automobile Emissions: An overview. U.S.Enviromental protection agency office ofmobile sources. EPA. 400-F-92-014 (1994).
2. Boulter, P.G., MeCare, I. S., Barlow,T. J., Areview of instantaneous emission models forroad vehicles. Transpor t ResearchLaboratory, Published project report per 267.Version: final (2007).
3. Daryabeigi Zand, A., Nabi bidhendi, G.,Mikaeili, A., Pezeshk, H., The influence ofdeposit control additives on exhaust CO andHCemissions from gasoline engines (casestudy: Tehran). Transportation Research PartD: Transport and Environment. 12(3): 189-
194 (2007).4. Department of Energy,. Understanding Iran’s
energy sector and provide basic data.Department of Environment. Iran. (1999).
5. Department of Energy,. 1999. Feasibility ofdeveloping an electric car in Iran. Office ofPlanning. Technical Faculty of TehranUniversity. Iran. (1999).
6. Horng Tsai, J., Chyun Hsu, Y., Cheng Weng,H., Yinn Lin, W., Tien Jeng, F., Air pollutantemission factors from new and in-usemotorcycles, Atmospheric Environment.34(28): 4747–4754 (2000).
7. Jession, G., Studies Relating On-Board

85Takizad, Curr. World Environ., Vol. 7(1), 79-85 (2012)
Emissions Measurements with EngineParameters and Driving Modes.Proceedings of the Fourth CRC-APRAC On-Road Vehicle Emission Workshop, SanDiego, Calif., 3(41): 3-58 (1994).
8. Kelly, N.A. and Groblicki, P.J., Real-WorldEmissions from a Modern ProductionVehicle Driven in Los Angeles. Journal ofthe Air & Waste Management Association,43: 1351–1357 (1993).
9. Khanfekr, A., Amroni Hoseini, M., Nemati, Z.,Arzani, K., Azadmand, M., Production ofcatalytic converters for hybrid vehicle Roaand comparison with catalytic convertersimport Iran Khodro. Environmental Scienceand Technology. 11(2): 87-95 (2009).
10. Kuhns, H. D., Mazzoleni, C., Moosmüller, H.,Nikolic, D., Keislar, R. E., Barber, P. W., Li, Z.,Etyemezian, V., Watson, J. G., Remotesensing of PM, NO, CO and HCemissionfactors for on-road gasoline and dieselengine vehicles in Las Vegas, NV. Scienceof The Total Environment. 322(1-3): 123–137(2004).
11. LeBlanc, D C., Saunders, F M., Meyer, M D.,Guensler, R., Driving pattern variability andimpacts on vehicle carbon monoxideemission. Transportation Research Board.
1472, ISSN: 0361-1981. 45-52 (1995).12. Manufacturers of Emission Controls
Association., Retrofitting Emission Controlsfor Diesel-Powered Vehicles. 1730 M Street,NW, Suite 206 , Washington, D.C. 20036(2009).
13. Rosen, E.D., Erwin, M., The Petersonautomotive troubleshooting & repair manual.Grosset & Dunlap, Inc.. ISBN 978-0-448-11946-5 (1975).
14. Roshan Zamir, S., Eikani, M. H., Research ofTehran air pollution. Third NationalConference on Iran’s energy. Iran (2004).
15. Yanowitz. J., McCormick. R L., and Graboski.M.S., In-Use Emissions from Heavy-DutyDiesel Vehicles. Environmental Science andTechnology ., 34(5): 729-740 (2000).
16. Yli-Tuomi, T., Aarnio, P., Pirjola, L., Makela,T., Hillamo, R. and Jantunen, M., Emissionsof fine particles, NOx and CO from on-roadvehicles in Finland. AtmosphericEnvironment 39(35): 6696-6706 (2005).
17. Wang, X., Westerdahl, D., Hu, J., Wu, Y., Yin,H., Pan, X., Zhang, M., 11-On-road dieselvehicle emission factors for nitrogen oxidesand black carbon in two Chinese cities.Atmospheric Environment. 46: 45-55 (2012).

INTRODUCTION
Contamination of heavy metals causes aserious problem for health and generally for man’slife. Discharge of these metals is caused as theresult of several activities such as production ofchemicals, dyeing, plastering, mining activities,extractive metallurgy, nuclear activities and otherindustries. These metals have a destructive effecton the animals, lakes and rivers (Sayeri, Hamoudi,& Yang, 2005). Human activities such as urban andindustrial sewages as well as atmosphericsediments and runoffs with unknown sources arethe main source of the existing metals in the rivers.They are also one of the major environmentalpollutants that are accumulated in the livingorganisms and cause serious hematologicaldiseases, brain damage, anemia and badperformance of kidneys. Recently, the existingheavy metals in different rivers have beeninvestigated (Wakida, Lara-Ruiz, Rodriguez-
Current World Environment Vol. 7(1), 87-91 (2012)
Detecting the Level of Contaminations Causedby Heavy Metals in the Zayandeh Roud River
and Clean up by Leaves of Beech Tree
MOHAMMAD KARIMI
Department of Chemistry, Budelkhand University Jhansi - 284 128 (India).
(Received: April 25, 2012; Accepted: May 28, 2012)
ABSTRACT
Zayandeh Roud is one of the most important rivers flowing in the central part of Iran. Itoriginates from the Kouhrang Mountains. This river passes through Chahar Mahal & Bakhtiari andEsfahan Provinces and finally flows into the Gavakhouni pond. The water of this river is used foragriculture, industry and potable water. Determination of contamination level of heavy metalsthroughout the river is important and has a major role in controlling the ecological conditions of itsenvironment. Clean up of the contaminations caused by heavy metals based on the naturalmethods including use of plants such as beech leaves will result in a healthy surrounding life whileleaving no negative effects. The reason for selecting the leaves of beech tree is the abundance ofthis plant in different parts of Iran as well as its easy preparaation for use. In the spring of 2011,contamination level of the river to Cu, Zn, and Pb metals was measured in 6 stations and threestages and the effect of using the leaves of beech tree on the absorption of heavy metals wasinvestigated.
Key words: Zayandeh Roud, Water Pollution, Heavy Metals, Heavy Metals Clean-up.
Ventura, Diaz, & Garcia-Flores, 2008). The toxicitycaused by heavy metals is an issue for which thereis much concern since it is very important forpeople’s health as well as for ecology. Furthermore,heavy metals may be accumulated in the soil intoxic levels due to long term use of untreatedsewages. In the soils irrigated by using sewage,heavy metals are accumulated in the surface. Whenthe soil capacity for keeping heavy metals isreduced due to frequent use of sewage, thesemetals flow into the underground water or into theexisting soil solution for absorption by plants. Hereis the beginning of the main risk and the transfer ofcontamination to the critical points should beavoided in a way (Sridhara, Kamalaa, & Samuel,2008). Several methods have been used to cleanup the contaminations caused by heavy metals andsome troubles have also been observed after theapplication of the said methods (Qureshi & Memon,2012). Efforts have been made in this study toinvestigate the acceptable reduction of heavy

88 Karimi, Curr. World Environ., Vol. 7(1), 87-91 (2012)
metals based on using the leaves of beech tree.One of the common techniques for measuring theconcentration of heavy metals is Flame AtomicAbsorption Spectrometry (FAAS). FAAS method isclassified as a single-element method whichrequires a longer time to analyze several elementsin a sample. Multi-element methods such as X-RayFlorescence (XRF) (Talebi, 1998), NeutronActivation Analysis (NAA) (Guéguen, Gilbin,Pardos, & Dominik, 2004), and Atomic EmissionSpectrometry using Inductively Coupled Plasma(ICP-AES) (Bruder, Lgrade, Lerosy, Coughanower,& Enguehard, 2002), are used for synchronous andcritical determination of heavy metals and providereliable results. In this study, ICP-AES method wasused as a multi-element technique to identify rareheavy metals in water.
In this study, the analysis of the selectedmetals (Zn, Pb, and Cu) in the Zayandeh Roud Riverat Esfahan Province (Central Part of Iran) and alsoclean up of the contamination of the aforesaidheavy metals by the leaves of beech tree wereinvestigated. It should be noted that Esfahanprovince is one of the most important industrialcenters of Iran. There are different industries in thisprovince including steel (the largest industry of thecountry), power plants, aluminum, wood productionfactories, electronic, computer, petrochemicalcomplexes and refineries. As a result, copper, zincand lead may leak into the water ecosystem ofZayandeh Roud River.
MATERIALS AND METHODS
Water samples were collected from 6stations along Zayandeh Roud River at Esfahan, Iran.The list and specifications of sampling points areshown in table 1. Sampling was made in the spring of2011 in three stages within one month. The tools forsampling and analyzing the rare metals werecompletely cleansed by acid before being used.Digestion of metals was performed based on USEPAmethod, 3010 (acidic digestion of extracts foranalyzing dissolved or completely recoverable metalsby FLAA or ICP spectroscopy) (US-EPA, 1991). Allreferences were of analytic type. Hydrochloric,hydrofluoric and nitric of the acids were used fordigestion of samples and preparation of standards.Standards solutions were used to determine the ICP
of the analyzed elements. Glass and Teflon containerswere treated in a 10% volumetric solution of nitricacid for 24 hours and were then washed by distilledand deionized water. The digested samples were keptin 15 ml polyethylene tubes in a cold room with atemperature of 4°C.
The samples were measured by using AA220 Spectrophotometer Varian Spectra and AtomicEmission Spectrometer with Inductive CoupledPlasma (ICP-AES) and were analyzed for threetimes for the existence of Cu, Pb and Zn metals.The analytic qualitative control involved dailystandard analysis as well as repeating the analysisof samples and blanks (Martin & Meybeck, 1979).
After preparing the samples andmeasuring the concentration of Cu, Pb and Znmetals, it was the turn for preparing the leaves ofbeech tree to be injected into the water samples.
The reason for selecting the leaves ofbeech tree is the abundance of this tree in differentparts of Iran and its positive effect in similar studiesfor absorption of other pollutant elements. A sampleleaf of beech tree is shown in figure 1.
In order to prepare the leaf of beech treefor injection into the water sample, 5 grams of thebeech leaf were dried in a container in atemperature of 70°C. Then, one gram of the driedmaterial was changed into ash by keeping in afurnace with a temperature of 450°C for 6 hours(Natarajan, et al., 2010). The ashes of the sampleswere poured into 100 ml polyethylene containersand 3 ml of nitric acid were added to them. Theywere then heated on a water bath with atemperature of 100°C to be completely digested.After digestion, the sample was removed from thewater bath and was completely cooled. The obtainedcombination was measured by using AA 220Spectrophotometer Varian Spectra and AtomicEmission Spectrometer with Inductive CoupledPlasma (ICP-AES).
In the next stage, 5 grams of beech leafwere injected into each of the water samplesprepared from the river. Samples were then takenfrom the solutions within 30, 60, 90, 120, and 150-minute time intervals and were measured.

89Karimi, Curr. World Environ., Vol. 7(1), 87-91 (2012)
RESULTS AND DISCUSSION
The results of measuring the samples ofriver water before injecting the leaf of beech treeare shown in tables 2 through 4. It should be notedthat the concentrations of heavy metals includingCu, Pb and Zn are determined on ppm basis.
Basic concentrations of the three ions Cu,Pb and Zn in the beech leaf are shown in table 5.
Average final reduction percentages forconcentration of each of the three ions of Cu, Pband Zn as absorbers after the use of beech leaf areshown in table 6.
Average reduction percentages for the
Table 1: List and specifications of sampling points
No. Station Position
1 Mourgan Southwest of Esfahan2 Keleh Between Esfahan and
Chadegan Dam3 Falavarjan Near Esfahan City4 Khajou Esfahan City5 Choum 7 km from Sedeh Waterfall6 Varzaneh Varzaneh City, 125 km from
South of Esfahan
Table 2. Concentrations of heavy metalsrelated to sample of first stage based on ppm
Station Cu Pb Zn
Mourgan 0.062 0.43 0.06Keleh 0.068 0.38 0.04Falavarjan 0.053 0.71 0.05Khajou 0.081 0.44 0.04Choum 0.064 0.36 0.05Varzaneh 0.091 1.42 0.08
Table 3. Concentrations of heavy metalsrelated to sample of first stage based on ppm
Station Cu Pb Zn
Mourgan 0.063 0.47 0.06Keleh 0.068 0.37 0.04Falavarjan 0.054 0.82 0.05Khajou 0.082 0.53 0.04Choum 0.064 0.47 0.05Varzaneh 0.092 1.39 0.07
Table 4. Concentrations of heavy metalsrelated to sample of first stage based on ppm
Station Cu Pb Zn
Mourgan 0.065 0.46 0.05Keleh 0.073 0.39 0.04Falavarjan 0.058 0.72 0.04Khajou 0.081 0.44 0.04Choum 0.064 0.34 0.05Varzaneh 0.092 1.31 0.06
Table 5: Concentrations of heavy metalsin the beech leaf based on ppm
Station Cu Pb Zn
Beech Tree Leaf 0/10 0/18 0/08
Table 6. Reduction percentage of each ofthe metals after the use of beech leaf
Station Cu Pb Zn
Reduction Percentage 39/69 51/89 29/91
concentration of the three ions of Cu, Pb and Znbased on the time are shown in figures 2 through 4.
As it can be seen, the concentrations ofthe three ions of Cu, Pb and Zn in the river waterhave different values based on the station; however,as we get close to the downstream of the river, theirconcentrations increase. As a vital lifeline in thecenter of Iran, Zayandeh Roud River has severalconsumptions including supply of potable waterand also necessary water for industries andagricultural activities (Nemati Varnosfaderany,Ebrahimi, Mirghaffary, & Safyanian, 2009). Rapidgrowth of population and agricultural and industrialactivities has resulted in the entry of a considerablevolume of toxic materials including heavy metalsinto the river. Absorption of heavy metals seems tohave been reduced in the recent years due to

90 Karimi, Curr. World Environ., Vol. 7(1), 87-91 (2012)
Fig. 1: A leaf of beech tree Fig. 2: Reduction Percentage of Cu
Fig. 4: Reduction Percentage ZnFig. 3: Reduction Percentage Pb
saturation of pollution. This issue can be observedin the downstream points of the river (Zhao, Qiana,Huang, Li, Xuea, & Hua, 2012); (Laia, Yang, Hsieh,Wu, & Kao, 2011); (Chahinian, et al., 2011).
After sampling and injection of beech leafinto the samples, it can be seen that considerablepercentages of the concentrations of heavy metalsare absorbed. These percentages were almost40% for copper, 52% for lead and 30% for zinc.Such reduction level seems acceptable consideringthe initial concentrations of the ions in the watersamples (Liu, Jiang, Zhang, & Xu, 2011); (Kertész,Bakonyi, & Farkas, 2006); (Shikazono, Zakir, & Sudo,2008).
CONCLUSION
Zayandeh Roud River, as the main sourceof water supply in the central plateau of Iran, hasseveral consumptions including potable, industrial
and agricultural waters. Population increase hasbeen followed by increased consumption of riverwater and the contaminations caused by suchconsumptions have had negative effects on itsquality. Considering the use of river water forirrigation of farming lands, high concentrations ofheavy ions will cause irreparable damages in thenear future. Therefore, one of the major concerns isto use a method for cleaning up the contaminationscaused by heavy metals which is cost effective fromeconomical and facilities viewpoints and above all,it lacks any secondary trouble. In this study, the effectof beech leaf on the absorption and reduction ofconcentrations of Cu, Pb and Zn ions wasinvestigated. Considering the suitable reduction ofconcentrations of Cu, Pb and Zn ions after the useof beech leaf, it is recommended to use the leaf ofbeech tree as an almost free and quite naturalsolution in case of any need to the cleaning up ofcontaminations caused by heavy metals includingCu, Pb and Zn.

91Karimi, Curr. World Environ., Vol. 7(1), 87-91 (2012)
REFERENCES
1. Bruder, V., Lgrade, F., Lerosy, M.,Coughanower, C., & Enguehard, F. (2002).Application of a sequential extractionprocedure to study the release of elementsfrom municipal solid waste incinerationbottom ash. Anal, Chim, Acta , 258-295.
2. Chahinian, N., Bancon-Montigny, C., Caro,A., Got, P., Perrin, J., Rosain, D., et al. (2011).The role of river sediments in contaminationstorage downstream of a waste watertreatment plant in low flow conditions:Organotins, faecal indicator bacteria andnutrients. Estuarine, Coastal and ShelfScience , 4.
3. Guéguen, C., Gilbin, R., Pardos, M., &Dominik, J. (2004). Water toxicity and metalcontamination assessment of a polluted river:the Upper Vistula River (Poland). AppliedGeochemistry .
4. Kertész, V., Bakonyi, G., & Farkas, B. (2006).Water pollution by Cu and Pb can adverselyaffect mallard embryonic development.Ecotoxicology and Environmental Safety ,4.
5. Kubiak, J. J., Khankhane, P. J., Kleingeld, P.J., & Lima, A. T. (2012). An attempt toelectrically enhance phytoremediation ofarsenic contaminated water. Chemosphere, 3.
6. Laia, Y., Yang, C., Hsieh, C., Wu, C., & Kao, C.(2011). Evaluation of non-point sourcepollution and river water quality using amultimedia two-model system. Journal ofHydrology , 2-3.
7. Liu, X., Jiang, S., Zhang, P., & Xu, L. (2011).Effect of recent climate change on Arctic Pbpollution: A comparative study of historicalrecords in lake and peat sediments.Environmental Pollution , 2-4.
8. Martin, J., & Meybeck, M. (1979). Elementalmass balance of material carried by majorworld rivers. Mar Chem .
9. Natarajan, S., Stamps, R. H., Ma, L. Q., Saha,U. K., Hernandez, D., Cai, Y., et al. (2010).Phytoremediation of arsenic-contaminatedgroundwater using arsenic
hyperaccumulator Pteris vittata L.: Effects offrond harvesting regimes and arsenic levelsin refill water. Journal of Hazardous Materials, 2-6.
10. Nemati Varnosfaderany, M., Ebrahimi, E.,Mirghaffary, N., & Safyanian, A. (2009).Biological assessment of the Zayandeh RudRiver, Iran, using benthicmacroinvertebrates. Biological assessmentof the Zayandeh Rud River, Iran, usingbenthic macroinvertebrates , 3-4.
11. Qureshi, I., & Memon, S. (2012). Synthesisand application of calixarene-basedfunctional material for arsenic removal fromwater. Appl Water Sci , 1-2.
12. Sayeri, A., Hamoudi, S., & Yang, Y. (2005).Applications of pore-expanded malodoroussilica, removal of heavy metal captions andorganic pollutants from waste water.
13. Shikazono, N., Zakir, H., & Sudo, Y. (2008).Zinc contamination in river water andsediments at Taisyu Zn–Pb mine area,Tsushima Island, Japan. Journal ofGeochemical Exploration , 3-6.
14. Sridhara, C., Kamalaa, C., & Samuel, D.(2008). Assessing risk of heavy metals fromconsuming food grown on sewage irrigatedsoils and food chain transfer Ecotoxicologyand Environmental Safety. EnvironmentalContamination and Toxicology .
15. Talebi, S. (1998). Determination of leadassociated with air- borne particulate matterby flame atomic absorption and wave-lengthdispersive X-ray fluorescence spectrometry.Environ. Anal. Chem.
16. US-EPA. (1991). Test Method for Evaluatingof Solid Waste. Cincinnati. OH: USEnvironmental Protection Agency.
17. Wakida, F., Lara-Ruiz, J., Rodriguez-Ventura,J., Diaz, C., & Garcia-Flores, E. (2008). Heavymetals in sediments of the Tecate River,Mexico. Environ Geol (54), 637-642.
18. Zhao, L., Qiana, Y., Huang, R., Li, C., Xuea,J., & Hua, Y. (2012). Model of transfer tax ontransboundary water pollution in China’sriver basin. Operations Research Letters , 2.

INTRODUCTION
The coordination chemistry of transitionmetals with ligands from the uranyl family hasbeenof interest due to different bonding modes shownby these ligands with both electron rich and electronpoor metal. In principle, the central transition metalatoms of different soft and hard Lewis acidity usuallyneed to be satisfied in the most suitablefashion.Schiff base metal complexes have beenwidely studied because they have industrial,antifungal, antibacterial, anticancer and herbicidalapplications.
Nitrogen-containing ligands such asSchiff bases and their metal complexes played animportant role in the development of coordinationchemistry resulting in an enormous number ofpublications, ranging from pure synthetic work tophysicochemical 1 and biochemically relevantstudies of metal complexes 2–6 and found wide rangeof applications. Other kinds of nitrogen-containing
Current World Environment Vol. 7(1), 93-100 (2012)
Synthesis, Characterization and Thermal Studiesof a N, N’- bis(2- hydroxy –alpha- methyl benzylidene)
Isobutyl Diamine Uranyl (VI) Nitrate[UO2 (HMBUD)]2+
SHAHRIAR GHAMMAMY* and SAJJAD SEDAGHAT
Department of Chemistry, Faculty of Science, Imam Khomeini International University, Qazvin (Iran).
(Received: December 20, 2011; Accepted: March 25, 2012)
ABSTRACT
N, N’- bis(2- hydroxy –alpha- methyl benzylidene) isobutyl diamineabbreviated as HMBUDwas synthesized and characterized. N, N’- bis(2- hydroxy –alpha- methyl benzylidene) isobutyldiamineUranyl (VI) nitrateprepared by reaction of nitrate salt of UO2(NO3)2.6H2O with HMBUD. Inthis research, some of the inorganic complexes of uranyl with N- donor ligands were synthesized.Complexes were characterized by FT-IR and UV, ¹HNMR, ¹³CNMR spectra, TG/DTGmeasurements and some physical properties. The results of simultaneous TG-DTG-DTA analysesof the complexes show the final degradation product for these complexes are UO3. Also theresults show chelation causes drastic change in the biological properties of the ligands and alsothe metal moiety. So the toxic effects of uranyl can be prevented by using chelating agent andcomplexation of the potentially multidentate ligands.
Key words: N, N’- bis(2- hydroxy –alpha- methyl benzylidene) isobutyl diamineUranyl (VI)nitrate,Synthesis, Thermal analysis, FT-IRand UV–Visible spectroscopy, Schiff bases.
ligands are well-known pyrimidine systems suchas purine analogues that exhibit a wide range ofbiological activities. Fused pyrimidine compoundsare valued not only for their rich and variedchemistry, but also for many important biologicalproperties. Among them, the furopyrimidine ringsystem, because of a formal isoelectronicrelationship with purine, is of special biologicalinterest. It has numerous pharmacological andagrochemical applications, namely, antimalarials,antifolates, and antivirus, as well as potentialradiation protection agents. Recently, somefuropyrimidines were shown to be potent ascularendothelial growth factor receptor 2 (VEGFR2) andepidermal growth factor receptor (EGFR) inhibitors.Because of the importance of furo (2,3-d) pyrimidinederivatives, several methodologies for synthesizingthem have already been developed. However, manyof the synthetic protocols reported so far prolongedreaction times, harsh reaction suffer fromdisadvantages, such as relying on multistep
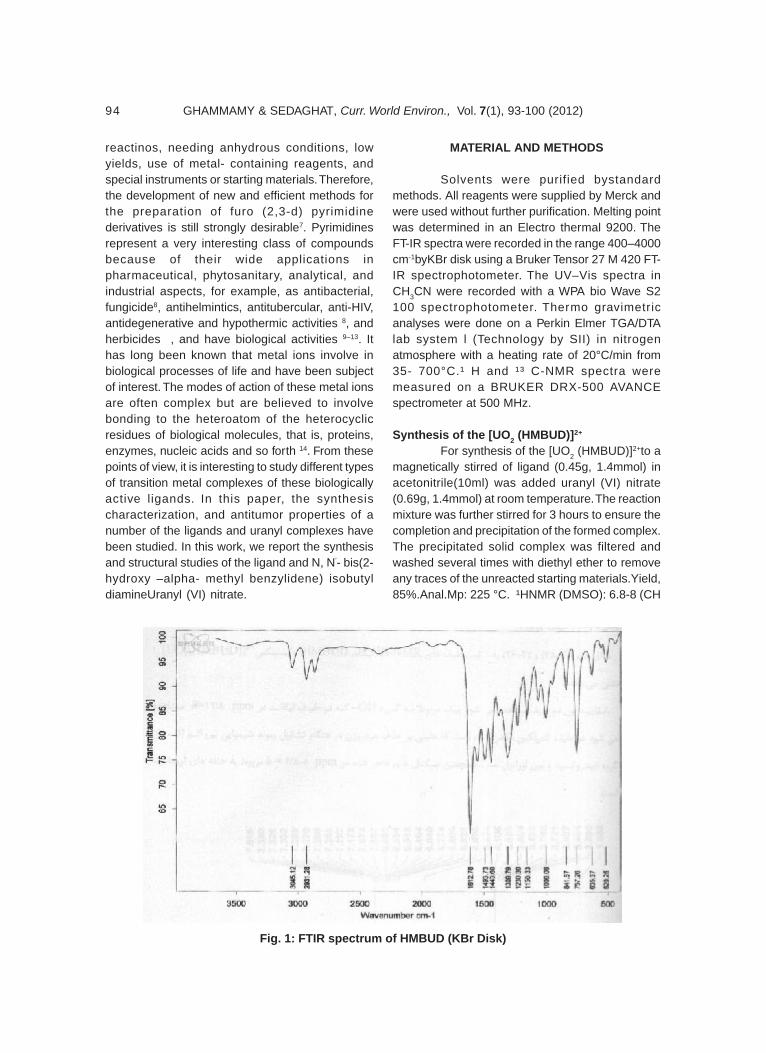
94 GHAMMAMY & SEDAGHAT, Curr. World Environ., Vol. 7(1), 93-100 (2012)
Fig. 1: FTIR spectrum of HMBUD (KBr Disk)
reactinos, needing anhydrous conditions, lowyields, use of metal- containing reagents, andspecial instruments or starting materials. Therefore,the development of new and efficient methods forthe preparation of furo (2,3-d) pyrimidinederivatives is still strongly desirable7. Pyrimidinesrepresent a very interesting class of compoundsbecause of their wide applications inpharmaceutical, phytosanitary, analytical, andindustrial aspects, for example, as antibacterial,fungicide8, antihelmintics, antitubercular, anti-HIV,antidegenerative and hypothermic activities 8, andherbicides , and have biological activities 9–13. Ithas long been known that metal ions involve inbiological processes of life and have been subjectof interest. The modes of action of these metal ionsare often complex but are believed to involvebonding to the heteroatom of the heterocyclicresidues of biological molecules, that is, proteins,enzymes, nucleic acids and so forth 14. From thesepoints of view, it is interesting to study different typesof transition metal complexes of these biologicallyactive ligands. In this paper, the synthesischaracterization, and antitumor properties of anumber of the ligands and uranyl complexes havebeen studied. In this work, we report the synthesisand structural studies of the ligand and N, N’- bis(2-hydroxy –alpha- methyl benzylidene) isobutyldiamineUranyl (VI) nitrate.
MATERIAL AND METHODS
Solvents were purified bystandardmethods. All reagents were supplied by Merck andwere used without further purification. Melting pointwas determined in an Electro thermal 9200. TheFT-IR spectra were recorded in the range 400–4000cm-1byKBr disk using a Bruker Tensor 27 M 420 FT-IR spectrophotometer. The UV–Vis spectra inCH3CN were recorded with a WPA bio Wave S2100 spectrophotometer. Thermo gravimetricanalyses were done on a Perkin Elmer TGA/DTAlab system l (Technology by SII) in nitrogenatmosphere with a heating rate of 20°C/min from35- 700°C.¹ H and ¹³ C-NMR spectra weremeasured on a BRUKER DRX-500 AVANCEspectrometer at 500 MHz.
Synthesis of the [UO2 (HMBUD)]2+
For synthesis of the [UO2 (HMBUD)]2+to amagnetically stirred of ligand (0.45g, 1.4mmol) inacetonitrile(10ml) was added uranyl (VI) nitrate(0.69g, 1.4mmol) at room temperature. The reactionmixture was further stirred for 3 hours to ensure thecompletion and precipitation of the formed complex.The precipitated solid complex was filtered andwashed several times with diethyl ether to removeany traces of the unreacted starting materials.Yield,85%.Anal.Mp: 225 °C. ¹HNMR (DMSO): 6.8-8 (CH

95GHAMMAMY & SEDAGHAT, Curr. World Environ., Vol. 7(1), 93-100 (2012)
Fig. 3: 1H- NMR spectrum of HMBUD
Fig. 2: FTIR spectrum of [UO2 (HMBUD)]2+(KBr Disk)
phenol), 2.7 (CH3), 3.1 (CH2), FT-IR (KBr, cm-1):1287s (ν C-N), 1622 s (ν C=N), 2929 br(ν OH), 572m (ν U-O), 464m (ν U-N), 921 s (ν O=U=O), UV-vis(DMSO): λmax 260nm(ε 22000), 320nm(å 10000),410nm(å 3600)(Figure 1-9). [UO2 (HMBUD)]2+issoluble in acetone, DMF and DMSO and insoluble
in water, methanol, Acetonitrile, dichloro methane,diethyl ether and hexane and little soluble inchloroform and ethanol.Figure 10, 11 showsChemical structures of HMBUD and [UO2
(HMBUD)]2+.

96 GHAMMAMY & SEDAGHAT, Curr. World Environ., Vol. 7(1), 93-100 (2012)
Fig. 4: 1H- NMR spectrum of [UO2 (HMBUD)]2+
Fig. 5: 13C- NMR spectrum of HMBUD
Analysis of HMBUD LigandAnal:%69. Calcd of C20H24N2O2; C;74.09,
H; 7.4, N; 8.63; found: C; 80.11, H. 8.20, N; 9.12.Mp192-194 °C, ¹HNMR (DMSO): 6.7-7.6 (CHphenol), 1.5 (CH3), 3.6 (CH2), 12.8 (OH), FT-IR (KBr,cm-1): 1309s (ν C-N), 1612 s (ν C=N), 2931br(ν
OH), UV-vis (DMSO): λmax 268nm(ε 28000), 355nm(ε10000). HMBUDis soluble in acetonitrile, DMSO,chloroform, dichloro methane and diethyl ether andinsoluble in acetone, water, methanol, ethanol andhexane and little soluble DMF.

97GHAMMAMY & SEDAGHAT, Curr. World Environ., Vol. 7(1), 93-100 (2012)
Fig. 6: UV/ Vis spectrum of HMBUD(DMSO, 5×10⁻⁴ M)
Fig. 7: UV/ Vis spectrum of [UO2 (HMBUD)]2+(DMSO, 5×10⁻⁴ M)
RESULTS
Preparation of Ligand and complexIn this paper, we report a new method of
the synthesis of N, N’- bis(2- hydroxy –alpha- methylbenzylidene) isobutyl diamineUranyl (VI) nitrate.The compound was obtained by reaction ofUO2(NO3)2.6H2O and HMBUDand was synthesized
through a one-step reaction. Our procedure forproducing compound has some advantages. Forexample, there is no side product in preparing [UO2
(HMBUD)]2+ in our method, the reaction is quite fastand does not require any severe conditions suchas high pressure or high temperature, and it is notsensitive to air.Compounds were characterized byseveral techniques using FT-IR, UV-Visible and

98 GHAMMAMY & SEDAGHAT, Curr. World Environ., Vol. 7(1), 93-100 (2012)
Fig. 9: Chemical structure of HMBUD
Fig. 8: Thermal analysis data of [UO2 (HMBUD)]2+
NMR spectra Thermal analysis were studied forthese compounds. The [UO2 (HMBUD)]2+has225 °Cmelting points respectively. It is soluble in acetone,DMF and DMSO and insoluble in water, methanol,Acetonitrile, dichloro methane, diethyl ether andhexane and little soluble in chloroform and ethanol.The spectral data of the complexes have goodrelationship with the literature data.The IR spectraof the Schiff base show characteristic bands due toν(OH), ν(C=N) and ν(C-N) in the region 2931cm-1,
(1612, 1309) cm-1respectively. The strong band inthe region 1612, 1309cm-1 in the IR spectra of theSchiff base are assigned to ν( C=N), ν( C-N)respectively. In the case of U(VI) complex weobserved the following changes. The bandsappeared around 572, 464, 921, 1287, 1622,2929cm-1 due to ν(U-O), ν(U-N), ν (O=U=O), ν (C-N), ν(C=N), ν (OH) IR spectra of ligand (HMBUD)show a broad medium intensity band in the region2931cm-1due to OH.

99GHAMMAMY & SEDAGHAT, Curr. World Environ., Vol. 7(1), 93-100 (2012)
Fig. 10: Chemical structure of [UO2 (HMBUD)]2+
Thermo gravimetric analysesThe thermal properties of these
compounds were investigated by thermo grams(TG, DTG andDTA). Figure 9shows TGA and DTAcurves for[UO2 (HMBUD)]2+. In the temperaturerange from 300-410°C, 60% weight losing wasobserved which was related to the loss ofmostpartsof compound.
DISCUSSION
In this research, some of the inorganiccomplexes of uranyl with N- donor ligands were
synthesized. Complexes were characterized by FT-IR and UV, ¹HNMR, ¹³CNMR spectra, TG/DTGmeasurements and some physical properties. Theresults of simultaneous TG-DTG-DTA analyses ofthe complexes show the final degradation productfor these complexes are UO3.
ACKNOWLEDGMENTS
We gratefully acknowledge the financialsupport from the Research Council of ImamKhomeiniIslamic Azad University and manytechnical supports that provided byTarbiatModarres University.
REFERENCESES
1. VidmarR.J.IEEE Trans.Plasma Sci., 21: 876(1992).
2. Murthy A.S.N. andReddy A.R.Journal ofChemical Sciences, 90: 519 (1981).
3. RazakantoaninaV.N.K. and Phung P.Parasitology Research,86: 665 (2000).
4. Royer R.E. and Deck L.M. Journal ofMedicinal Chemistry,38: 2427 (1995).
5. Flack M.R. and Pyle R.G. The Journal ofClinical Endocrinology & Metabolism,76:1019 (1995).
6. BaumgrassR. andWeiwadM. Journal of
Biological Chemistry, 276: 47914 (2001).7. TeimouriM.B. and Bazhrang R. Bioorganic &
Medicinal Chemistry Letters, 16:3697(2006).
8. TeimouriM.B. Tetrahedron, 62: 10849 (2006).9. GrevyJ.M.,TellezF. Inorganica ChimicaActa,
339: 532 (2002).10. BernalteA. andBarrosF. J. Polyhedron, 18:
2907 (1999).11. Lemma K. andBerglund J. Journal of
Biological Inorganic Chemistry, 5: 300(2000).

100 GHAMMAMY & SEDAGHAT, Curr. World Environ., Vol. 7(1), 93-100 (2012)
12. Campbell M.J.M. Coordination ChemistryReviews,15: 279 (1975).
13. Padhy´eS. andKauffman G.B. CoordinationChemistry Reviews, 63: 127 (1985).
14. Erwin B. and OmoshileC. Journal of the
Chemical Society Perkin Transactions, 2:1333 (1995).
15. Zhao G. andLin H. Journal of InorganicBiochemistry, 70: 219 (1998).

INTRODUCTION
Geometrical EffectsWhen the ball passes through undersized
hole, plastic deformation (ip) takes place, this plasticdeformation of the hole may be due to manyvariables. It has been confirmed experimentally thatinterference (if) and plastic deformation (ip) havegot a linear relationship i.e. they are proportional toeach other.
If deviation is defined as the difference ofball diameter and hole diameter after ballizing theexperiment also establishes that this deviation isalso proportional to the amount of interference,velocity of movement of ball, and hardness of thebase material. In the graphs all the dates aredepicted which are gathered during experiments.In the experiments hardened steel balls were usedfor Aluminium and Mild steel bushes.
Current World Environment Vol. 7(1), 101-108 (2012)
Study and Analysis of Geometric Effect of Ball BurnishingProcess of Different Materials and Evaluation of Forces and
Strain for Ballizing Process
PAWAN K. UPADHYAY1, A. R. ANSARI2 and PANKAJ AGARWAL3
1Department of Mechanichal Enggineering. NIIST., (India).2Department of Mechanichal Enggineering S.S.C.T (India).
3Department of Mechanichal Enggineering (India).
(Received: May 12, 2012; Accepted: June 20, 2012)
ABSTRACT
The process consists of forcing an oversized ball of a hard material through a pre-machines hole in softer material .The interference between the ball and the hole causes the holeto expand such that its deformation is partly plastic and partly elastic. The elastic deformation ofthe hole is recovered due to elastic spring back whereas the plastic deformation results in a slightpermanent increase in the hole diameter after ballizing. Ball burnishing or Ballizing is a productionprocess for improve the accuracy and surface finish of holes. This process is a mass productionprocess for sizing and finishing holes. The sizing and finishing of holes depends upon the interferenceadopted for ballizing process. This paper is an attempt toward comparing surfaces effects ,Estimationof deflection, deformation, radial strain, stress and finished dimensions of Mild steel and Aluminium.
Key words: Ballizing, Alluminum Alloy, Alloy steel, C.L.A., Elastic Pressure,Plastic Deformation, BHN, Machining, Surface roughness, Technology devices and equipment.
We get a finished desired diameter of hole,after the ball of definite diameter is passed from theinitial diameter. These data of initial and finaldiameters of hole and diameters of ball are basedon the data accumulated by trial and errorexperimentation as discussed earlier.
By dividing with D (the diameter of ball)we have made the values of interference andplastic deformation.Non-Dimensional these non-dimensional quantities are plotted which give alinear relationship as shown.
Construction of mathematical Models &equations
When the linear relationship is combinedwith the Hertz’s theory of contact stress of elasticbodies the equation is obtained in the form
Y = m. x + cLet d1 = initial diameter of hole

102 UPADHYAY et al., Curr. World Environ., Vol. 7(1), 101-108 (2012)
db = initial diameter of balland df = final diameter of holeafter ballizing.
Then i f = interference = db-di andpermanent plastic deformation = ip = df-di.
During the process, the ball and hole bothwill under go elastic deformation, although ball ishardened and bush is made of a softer material.
There fore interference =if = ip + eh + eb ...(1)
If we plot if against X axis and ip against yasix we get.
ip=m.if + C ...(2)
Wherem = slope of the line andC = a constant, which is an
intercept on y axis.
For perfect elastic deformation ip = 0 andfor this
if = eb + eh
Also if = 0 eb = 0ip = eh
From above we getm = eh/eb +eh and C = -eh
hp f h
h b
ei i ee e
...(3)
EXPERIMENTAL
From experimental observations value ofm and C can be obtained.
Referring to figs it is seen that the slope mof the linear relationship line is of the order of unity.However from the authors model it was proposedthat.
This suggests that the value of eB isnegligible. Thus it can be inferred that if the value of
eB = 0
Hence m =1
The author has observed in his study ofballizing experiments that during the travel of theball, the bush indicates a marked bulge and theball bas less likelihood of strain. It may be pointedout that for excessively thick walled bushes the valueof eB cannot be adopted as zero.
A detailed theoretical model can bedeveloped for estimating the values of strain eH.This model is based on the Classical contact stressanalysis founded by H. Hertz and presented in nextsection. In Ballizing there is almost rectangular stripcontact between ball and the hole. A comparison ofexperimental results with Authors model is indicatedin fig. .
Evaluation technique and methodology (ForStrains)Mathematical Model for strains in Ballizing
Referring the fig. is the length of contactand 2b is the breadth or width of contact. Theinterference between the ball and the hole wallgives rise to say pressure P per unit length.
The max. deflection is obviously occurringalong xx.
We have to find an expression for this max.deflection.
It is true that the uniform pressure P alongthe line contact will give rise to semi ellipticalpressure distribution as shown in the side view overthe width of contact.
Adopting a simplified assumption that thepressure distribution is uniform of intensity q insteadof semi elliptical (Based on Timoshenko andGoodier. Theory of Elasticity) a model is developedin this article.
Load Distributed over a part of theBoundary of a semi- infinite solid referring to

103UPADHYAY et al., Curr. World Environ., Vol. 7(1), 101-108 (2012)
FIg. 1:
Fig. 2:
diagramDeflection at o due to load q.s. dψ. ds on
the element is, processing on the lines.
Estimation of deflection due to pressure
and the total deflection due to distributed pressureis.
(4 is used because there are 4 quadrantsand the integral is only for the Ist quadrant) since ƒ

104 UPADHYAY et al., Curr. World Environ., Vol. 7(1), 101-108 (2012)
Fig. 4:
Fig. 5:
Fig. 6:
ds is the length of the chord for area
OAB, O ≤ ψ1 ≤ tan-1 b/aƒ ds = 2d. Sec ψ1
Similarly for area OBC, ≤ ψ2 ≤ tan-1 a/b
ƒ ds = b. Sec. ψ2
Where
Fig. 3:

105UPADHYAY et al., Curr. World Environ., Vol. 7(1), 101-108 (2012)
Fig. 7:
Fig. 8:
(Formula for calculation of deflection)Substituting in the expression for w,
q = Pave
For calculating the radial strain in the wallof the hole
b = width of strip of contact and iscalculated by the equations
...(5)
Where adopting δ = i f /2
Thus the radial strain in the wall of thehole Ballizing.
RESULT AND DISCUSSION
a.Evaluation and analysis of different interference

106 UPADHYAY et al., Curr. World Environ., Vol. 7(1), 101-108 (2012)
and with help of Fig.
Calculation for Radial StrainAluminium Bushes
It is observed that with 150 and 50 micronsinterference respectively the final diametersobtained are 15.08 mm and 15.16 mm respectively.In the two bushes of 180 microns interference, fromvery rough surface as shown in fig. the final surfacefinish obtained was of 0.29 CLA, which indicatesthat a very good surface finish is obtained
In the two bushes, in which interferencewas kept only 50 microns, the surface finish wasnot so good as it gave the C.L.A. value as 0.65 .
Calculation for Radial StrainFor Mild steel Bush with 80 Microns
interference
E = 1.96 x 10⁶ kg/sq mc p = 9903 kg/sq cm2 a = π R1 = 5.677 cm. µ = 0.3 R1 = 0.9 cmR2 = 1.8 cm and b = 0.0042 cm
The value of eH calculated from theequation 3 which is
eH = 0.5 x 10⁻³ cmTaking D = 1.8 cm
Making it non dimensional
30.5 101.8
HeD
= 0.3 x 10⁻³
For Aluminum Bush of 180 micronsinterference
E = 0.675 x 10⁶ kg/cm2 µ = 0.34R1 = 0.9 cm R2 = 1.8 cm2a = 2 p R1 = 5.677 cm. b= 0.0114 c,p = 3342.70 kg/ sqcm
The value of eH calculated from theequation
eH = 2.41 x 10⁻³ cm
The intercept on the Y axis is 1.35 micronsaccording to authors model and aimed at adoptingequal to 1.
A value of 50 microns has been adoptedfor strain calculations in the case of steel, whereasan interference of 150 microns is adopted forAluminum because of sinking in tendency ofAluminum, under the load of an indenting ball.
Fig. indicate comparison between authorsmodel and Experimental results.
. Linear Relationship(a) For M.S. ip/D = 0.989 (if/D) - 0.49275 x 10⁻³
(b) For Aluminum : ip/D=0.9644 (if/D) - 2.2 x 10⁻³ more,
with high interference.
Test result show that in the harder pointsin other
DISCUSSIONS
On the result of investigation followingConcluding remarks can be made1. From C.L.A. equation as well as C.L.A. plots
it is clearly seen that improvement in surfacefinish is obtained material and moreinterference, axial load has increased.However, load is found to be independent ofvelocity.
2. Temperature does not rise so much duringballizing that it may affect the surface finish.
3. After, ballizing internal diameters of busheswere measured; which established the factthat ballizing is a microsizing process.
4. There is very slight increase in diameterwhen interference is less. Keeping the sameoversized ball.
5. Theoretically as well as experimentally it isconfirmed that if ballizing is done with moreinterference high velocity and on moderateBHN value, improved surface finish isobtained.
6. Small circular contacts will be observed on

107UPADHYAY et al., Curr. World Environ., Vol. 7(1), 101-108 (2012)
the entire circumference as shown in Fig.6.1.
7. Co-relation factor for C.L.A. equation is0.9583 whereas for load equationcorrelation factor is calculated to be 0.8677.
8. Both the results show values are quite highand curve fitting is satisfactory in both thecases.
9. Variation of load on the length of bush shownthat, nearly at the center of the bush lengththe load is maximum.
10. Vibration in he load curve may be due tovariation in the geometry accuracy whileboring.
Objectives of the Proposed workSizing of bushes and final results will be
of utility to industries.This will help in achieving high precision
by selecting appropriate “Ball-Tube” combination.(a) determination of optimum interference for
best surface finish.(b) Proposing Mathematical models based on
the theory of elasticity (Hertz contact stressequations) and theory of plasticity involvingslip line field solutions.
(c) Strain models – Graph between ip and if.
(d) Axial force models (calculation of F forballizing)
(e) A comparison of the Mathematical Modelsof the Ballizing process with experimentalInvestigations.
(f) Surface finish evaluations using qualitativeand quantitative measures.
Some of the application are listed below1. Honned and Lapped surfaces can be further
smoothened.2. Sizing and finishing of cross hole recesses.3. Hallize can pre-stress the bores.4. Slight tapers can be removed.5. Holes of gears, arms, valves, plates, levers,
and chain links can be ballized.6. Good results can be obtained by ballizing
for the following materials.7. Stainless steels, even Nickle chromium
Alloys8. Lead, Chromium, Copper and even some
non-metals.9. Sintered iron, sintered brass i.e. powdered
metals.10. Case hardened surfaces can also be
ballized, but these should be free from hardchromium layer.
Calculations applies equally for the β linestarting at any points in AB wide range of applicationand being used as a noble process (ballizing), ithas some Observations, Concluding remarks canbe made are listed below : 1. Interference (i
f) should never exceed 2xof the hole diameter.2. It has given very good results for bores
ranging from 0.5 mm to 125 mm diameter.3. The length to diameter ratio has also been
recommended length should not be morethan 10 times or less than 1/10 of the borediameter.
4. Wall thickness should also be greater than1/10th of bore diameter.
5. Ballizing gave good results for holediameters of 1.5 mm to 25 mm.
6. Part to be ballized should not be harder than45 Rc. The balls must be more hard than 65Rc. (65 Rockwell C scale).
7. Materials should be homogeneous.8. Wherever ballizing length is more,
arrangement, for pressing or pulling the ballthough the bore has to be devised.
9. Porous, spongy or parts that wave hard spotsdue to casting, ballzing does not give uniformsurface finish,
10. Although some cast parts are successfullyballized.
11. Every curved tubing cannot be ballized.12. Parts that have case hardened layer upto
0.4 mm, can be ballized, but beyond 0.4 mmcase hardened depth, ballizing connot becarried out successfully.
13. When heat treatment is done after ballizing,sizing and finishing of the ballized hole getdisrupted.
14. It has given a relationship of Ball over sizeand bore undersize to obtain the finaldiameter desired.
15. It has established that in a particular softmaterial (Medium Carbon Steel)
16. When ballizng is done with a hard materialball the required bore diameters can beobtained as mentioned in the diagram (Fig. )

108 UPADHYAY et al., Curr. World Environ., Vol. 7(1), 101-108 (2012)
REFERENCES
1. Gazen, G.A. : Sizing and Finishing Holes byBallizing Tooling and production, (2003).
2. Agrwal, A.S. : ‘Ballzing process for burnishingholes’ Dissertation for P.G. Diploma inProduction Engineering (Royal College ofScience and Technology Glasgow, U.K.).(1992)
3. Fedrov, V.B. : Residual stresses and fatiguestrength with centrifugal ball strain hardening.Trans. Of Ural polytechnical Institute, 112:(1991)
4. Enlimash and orgstankinprom : Improvinggear efficiency by Burning Machine andTooling, 3: 54 (1999).
5. Kononenko, V.T. and shamlin, V.Yu. : ‘Carbideburnishing unit for broaches’, Machine andTooling, 8: 35 (2005).
6. Ryzhov, E.V. ‘Increasing contact stiffness byvibratory burnishing’ machine and tooling.,1: 59 (2002)
7. Vestnik Mashinostroeniya : ‘Self CenteringThree Roller Attachment with Instrument tocheck Burnishing Forces’. RussianEngineering Journal, 57(7): 59-69 (2007).
8. Vestnik Mashinostroeniya : ‘Calculating the
Depth of plastic Deformation whenStengthening parts by Plastic surfaceDeformation’. Russian Engineering Journal,Vol.59(1): 19-23 (2009).
9. Vestnik Mashinostroenita and M.M. zhasimov: The principal feature of Machining MethodsInvolving plastic surface Deformation ,Russian Engineering Journal , 60(3): 33-34(2000).
10. Papcheff , D.D. : The formation of the micro-proflle on burnished workpiece’ ,Microtechnic , XXI(2) (2002).
11. Kudryavtsev , I. V. : Surface PlasticDeformation and its practical application’,Russian Engineering Journal 1: 25 (2002).
12. Investigation of some effects of Ballizing onAluminium and Mild Steel. First Indian Engg.9-13 (1987).
13. Investigation of Elastic and plastic forces inBallizing process [Ball Burnishing] forAluminium and Mild steel. First Indian Engg.9-13 (1987).
14. Investigation of surface Effects in Ballizingon Aluminum and Mild Steel. First IndianEngg. (1988).

INTRODUCTION
Clean air is considered to be a basicrequirement of human health and for the well-being.However, air pollution continues to pose asignificant threat to health worldwide (WHO 2005).The state of air pollution is often expressed as AirQuality (AQ). Air pollution has implications in anumber of contemporary issues including: humanhealth, (e.g. respiratory, cancer, allergies.),ecosystems (e.g. crop yields, loss of biodiversity),national heritage (e.g. buildings), and regionalclimate (aerosol and smog formation) (Monks et al,2009).
The World Health Organization estimatedthat 2.4 million people die each year from causes
Current World Environment Vol. 7(1), 109-115 (2012)
Status of Air Pollutants after Implementation of CNG in Delhi
PALLAVI SAXENA*, RICHA BHARDWAJ¹ AND CHIRASHREE GHOSH¹
*Department of Environmental Biology, University of Delhi, Delhi - 110 007 (India).¹Environmental Pollution Laboratory, Department of Environmental Biology,
University of Delhi, Delhi-110007 (India).
(Received: March 03, 2012; Accepted: April 09, 2012)
ABSTRACT
Air pollution kills more than 5.9 million people annually, with more than 90 per cent of thesedeaths in capital city of India, Delhi. For improving the status of air pollution in Delhi, various policiesand laws have been implemented. But even after the implementation of CNG, there was nosignificant change of pollutants (NOx, O3, SPM, RSPM & CO) except SO2. The objective of ourstudy is whether CNG conversion has impinged on the primary pollutant and tropospheric ozonepollution profile and for the improvement in the quality of air in post CNG period. To carry out theanalysis, daily ambient air quality secondary data (Jan 2002-Dec 2009; Source-CPCB) of all theabove discussed pollutants were used. For generating own data, NOX and O3 monitoring werecarried out at four different sites viz. Site I (Yamuna Biodiversity Park, away from traffic intersection),Site II (Traffic intersection at outside YBP, outer ring road, Gandhi vihar), Site III (Aravalli BiodiversityPark, away from traffic intersection) and Site IV (traffic intersection at outside ABP, ring road,Vasant vihar) during monsoon season (Aug-Sept, 2009). The concentration of ozone was higherat sites which are at traffic intersection (Site II & IV) than those which are away from trafficintersection (Site I & III). The results however, do not indicate an all round improvement in ambientair quality of Delhi. Hence, our short term study suggests that after the implementation of CNG inDelhi there is no remarkable improvement in the status of the pollutants and moreover, the siteswhich are near to traffic intersection possess high concentration of pollutants than the sites whichare away from traffic intersection.
Key words: tropospheric ozone, air pollution, NOx, CNG, traffic intersection, Delhi.
directly attributable to air pollution with 1.5 millionof these deaths are only due to indoor air pollution(WHO 2002). In Eastern Canada vehicular emissionare the major contributor to Canada’s air whereNOx emissions contributes to 8% and 5%contributes to total PM and SOx emissions speciallyduring bad smog days (Environment Canada’sPerformance Report 2003). Biomass burningconstitutes an important anthropogenic NOx sourcein the tropics and subtropics of America, Africa andin South Asia. Due to high population density andhigher economical growth rates, emission of thesegases are increasing in Asia and more so in centraland South Asia (Lelieveld and Crutzen 1994).China is the largest contributor of pollutant amongAsian countries where increase in NOx growth rateis found to be about 7% per year (1990 to 1994)

110 SAXENA et al., Curr. World Environ., Vol. 7(1), 109-115 (2012)
(WMO 1998). In India, most of the cities areexperiencing rapid urbanization and the majorityof the country’s population is expected to be livingin cities within a span of next two decades (CPCB2010). Under National Air Quality MonitoringProgramme (NAMP) 2008, annual average for SO2
has not been exceeded in both the industrial (80%)& residential areas (93%) which is less than 20 ìg/m3. Decreasing trend of SO2 may be due to variousinterventions that have taken place in recent yearssuch as reduction of sulphur in diesel, use of cleanerfuel such as CNG in Delhi etc. Also there has beena change in domestic fuel used from coal to LPGwhich may have contributed to reduction in ambientlevels of SO2. The total emission of NOx in India is inthe range of 3.4 to 4.6 Tg/year. The average annualconcentration of NO2 is reported to be 71µg/m3 inresidential areas whereas 91µg/m3 in industrialareas during 2008. Various interventions have beentaken place to mitigate ambient NO2 levels but atthe same time number of vehicles has beenincreased exponentially which is one of the majorsources of NO2 emission. During the same year i.e.2008, the annual average concentration of RSPMis reported to be more in industrial areas (351 µg/m3) as compared to residential areas (278 µg/m3).The reason for high particulate matter levels maybe vehicles, gensets, small scale industries,biomass incineration, re-suspension of traffic dust,commercial and domestic use of fuels, etc. (CPCB2008-09). In Delhi, the contribution of vehicularpollution has increased only in past 2-3 decades,earlier it was partly 23% in 1971 rose to 43% in1981 and became 63% in 1991 (WWF 1995). Therewere 2.5 million vehicles registered in Delhi during1996, while this number has reached 4.17 millionin 2004 (MORTH 2004). Vehicular pollutionaccounts significantly to the total pollutiongenerated in Delhi (Gurjar et al, 2004). After theimplementation of CNG, only SO2 concentrationsdevelop a decreasing trend, whereas the NOxconcentration seems to be increasing. Theexplanation for increasing NOx concentrationseems to be related with the significant increase intotal number of vehicles each year in Delhi andwith the higher flash-point of CNG (540 °C)compared to that of diesel (232–282 °C). At such ahigh temperature, more nitrogen from the aircompresses and reacts with oxygen in thecombustion chamber of CNG driven vehicles and
thus produces more NOX. A study conducted byCPCB (2009) shows that 97% of hydrocarbon (HC),76% of CO and 50% of NOx emission comes in airfrom vehicular activity and hence a fall/increase inthe levels of these pollutants can be related to theCNG implementation. As per the studies done byvarious agencies, it has been observed that evenafter the implementation of CNG there is noimprovement in the status of the pollutants exceptSO2. Therefore, the objective of our present study isbased on whether CNG conversion has impingedon the primary pollutant and tropospheric ozonepollution profile and for the improvement in thequality of air in post CNG period (2002-2009) atsecondary data collection site (ITO-X) andgenerated data collection sites i.e. Site I (YamunaBiodiversity Park, away from traffic intersection),Site II (Traffic intersection at outside YBP, outer ringroad, Gandhi vihar), Site III (Aravalli BiodiversityPark, away from traffic intersection) and Site IV(traffic intersection at outside ABP, ring road, Vasantvihar). The data collected on generated sites wasonly performed in monsoon season (Aug-Sept,2009).
MethodologyThe secondary data of the air pollutants
(NO2, SO2, SPM, RSPM, CO & O3) were collectedfrom ITO-X site in the last 7 years (2002-2009) fromCPCB website (www.cpcb.nic.in). For generateddata, four sites were selected which are distinct onthe basis of two zones: Riverine zone [Site I -Yamuna Biodiversity Park (YBP), near Gandhi vihar,Delhi and Site II - Traffic intersection outside YBP,near Gandhi vihar, outer ring road, Delhi] and Hillyzone [Site III - Aravalli Biodiversity Park (ABP), insideVasant Vihar, Delhi and Site IV – Traffic Intersectionoutside ABP Vasant Vihar, Ring Road, Delhi]. Thesampling was done during monsoon season (Aug-Sept, 2009) for regularly 7 days with time interval of8 hrs of both the pollutants one primary (NO2) andsecondary (O3). High Volume Sampler (Model No:ENVIRO APM 430), was used to measure NO2 atSite I & III. The instrument has been kept at the height10 m above the ground. Simultaneously the hourlymetrological data were also recorded at these sitesat all the four selected sites with the help of pocketweather monitor (Kestrel, K3000-342127,USA). Forthe measurement of ground level ozone (O3), ozonesensor (Model No: Aeroqual,Series 500), was used

111SAXENA et al., Curr. World Environ., Vol. 7(1), 109-115 (2012)
for regularly 7 days for 8 hrs at all the sites (Site I –IV).
RESULTS AND DISCUSSION
For secondary data collection, primarypollutants which CPCB has been taken into accountare NO2 ,SO2 ,SPM ,RSPM & CO and one of thesecondary pollutants viz.O3. The trend of fluctuationof primary and secondary pollutants in last 7 years(2002-2009) at ITO-X site has been compiled andtaken in Fig.1(a-f). The highest concentration of NO2
(126.66µg/m3) was reported in the year 2008 andin other reported years, either it crosses permissiblelimit (80µg/m3) or hovered around it (taken in Fig.1a). So, it is quite interesting to note that even afterthe implementation of CNG programme in Delhi,NOx level is still showing increasing trend. It maybe due to diesel vehicles whose sale in Delhi hasregistered an increase of 106% since 1999. Thesevehicles emits 3 times more NOx than petrolvehicles. Surprisingly, emission from a poorlymaintained CNG fleet can also increase NOxbecause advanced testing facilities are notavailable for accurate NOx measurements (CSE2004). Taken in Fig.1b), the concentration of ozonewas highest (48.44µg/m3) in the year 2009.However, it did not cross the threshold level (80µg/m3) for plant species as prescribed by NCLAN(National Crop Loss Area Network). Increase inozone level may be due to the increase in precursorgases (NOx, CO, VOCs) (Leone and Seinfeld 1984).The profile of SO2 (Taken in Fig.1c) shows highestconcentration (22.57 µg/m3) in the year 2007.Interestingly, SO2 is the only pollutant which showssignificant decrease in the level after
implementation of CNG programme. Here only,Government’s mitigation policy measures thatappears to have had a positive impact on air quality.The reduction of sulphur dioxide in the ambient airis due to the lowering of suphur content of dieseland petrol which converts SO2 to sulphates ( a fineparticle) (Narain and Krupnick 2007) . We can noticetaken in Fig. 1d, the highest concentration of CO (3028.228µg/m3 ) which was observed in the year2002 and in other years (2002- 2009) either itcrosses or have approached the threshold value (2000µg/m3). Taken in Fig.8e highest concentrationof SPM ( 597.34 µg/m3) was recorded in the year2009 and also in case of RSPM highestconcentration ( 301.87µg/m3 ) was also recordedin the year 2009 (Taken in Fig.8f). In other yearstheir concentration crossed their respectivepermissible limits (200µg/m3) for SPM and (100µg/m3) for RSPM. After the implementation of CNGprogramme, these pollutants are not showingdecreasing trend, rather their concentration isincreasing due to poor three-wheeler technologywhich includes poor quality of piston rings as wellas the improper maintenance of air filters (Narainand Krupnick 2007).
For generated data collection, asdiscussed in methodology section, four sites weretaken into account. Yamuna Biodiversity Park (YBP)is designated as ‘away from traffic intersection’ (SiteI) with dense vegetation monitoring site. Thenitrogen dioxide (NO2) and ground level ozone (O3)monitoring was done during daytime (10:00a.m-6:00p.m) in monsoon month (20th -27th Aug’ 2009).Take in Fig.2, it is clearly depicted that the averageconcentration (for 7 days) of NO2 was found to be
Table 1 : Meteorogical parameters observed at four Sites
Parameters Site I Site II Site III Site IV
Ambient 32.45-30.4 32.4 - 30.3 34.2 - 27.8 35.8 - 32.4Temperature
(0C)
Relative Humidity 41.2 - 29.28 35.42 - 23.14 80 - 51.57 31.0 - 23.8 (%)
Wind speed 1.48 - 0.22 0.23 - 0.9 0 - 0.5 1.8 - 1.2 (Km/hr)

112 SAXENA et al., Curr. World Environ., Vol. 7(1), 109-115 (2012)

113SAXENA et al., Curr. World Environ., Vol. 7(1), 109-115 (2012)
Fig. 2: Comparison of average concentration ofNO2 & O3 in August 2009 at YBP (Site I)
Fig. 3: Comparison of average concentration ofO3
in August 2009 at YBP & traffic intersectionoutside YBP (Site I & Site II)
Fig. 4: Comparison of average concentration ofNO2 & O3
in September 2009 at ABP (Site III)
Fig. 5: Comparison of average concentration ofO3
in September 2009 at ABP & trafficintersection outside ABP (Site III & Site IV)
2.92 µg/m3 and for O3 was 23.25 µg/m3. The highestconcentration of NO2 (4.16 mg/m3) was recordedon 23rd Aug’09 (4th day) and for O3 (27.1µg/m3) on26th Aug (6th day). Moreover, from their diurnalprofile, it has also been noticed that the high peaksof ozone were found at 12:00 hrs (26.87µg/m3)and at 14:00 hrs (30.98µg/m3). During the monsoonmonth, recorded concentrations of NO2 and O3
depicted that the peak levels were under thepermissible limit for both the pollutants i.e. NO2
(80µg/m3) and O3 (80µg/m3). This observation canbe supported in the earlier study at the same site(Saxena and Ghosh 2009) where they have alreadyreported lower values of pollutant (ozone) duringmonsoon month as compared to summer andwinter months. It is obviously due to the scavenging
action of rain. Besides this, Table 1 also shows thatrecorded onsite meteorological data at Site I, wherewind speed was little higher than other sites thiscan be a reason for the dispersion of pollutantswhich ultimately resulted in decrease in theconcentration of NO2 & O3. At Site II (Trafficintersection outside YBP, Gandhi Vihar, outer ringroad) has high density of vehicles (particularlyheavy load trucks and buses) with less vegetation.During monsoon month, the ground level ozone(O3) was monitored during daytime (10:00a.m.-6:00p.m) (10th Aug -17th Aug’2009). Taken in Fig.3,it was clearly depicted that the averageconcentration (for 7 days) of O3 was 27.07 mg/m3.The highest concentration of O3 (31.26mg/m3) (6th
day) and the lowest was 22.25 mg/m3. Moreover,

114 SAXENA et al., Curr. World Environ., Vol. 7(1), 109-115 (2012)
from their diurnal profile, it has also been noticedthat the high peaks were found at 13:00 pm(38.99mg/m3) and 15:00 hrs (41.75mg/m3). Therecorded concentrations of O3 depicted that thepeak levels were also crossing the permissible limit.This is due to the fact that as compared to Site I,Site II had shown comparatively higherconcentrations of ozone due to high emission ofprecursor gases from the heavy traffic flow as thissite is located near outer ring road and comprisedof heavy vehicles like trucks and buses, whichaccelerates the photochemical reactions. Ingeneral, as per previous studies (Saxena andGhosh 2010), there were high concentrations ofozone in summer as well as in winter months butthis study analyzes the concentration of ozone inmonsoon season, that’s why the reported valueswere generally less due to the scavenging actionby rain (Chan and Kwok 2001). Moreover, in caseof tropospheric ozone there is non-availability ofsufficient solar radiation and the diurnal amplitudeof ozone which is found to be very small duringmonsoon months (Lal et al, 2000; Saraf et al, 2003and Jain et al, 2004). Recorded onsitemeteorological data at Site II (Table 1), was alsoclearly reported that due to increase in the rate ofwind speed there is dispersion of pollutants whichultimately resulted in decreasing in theconcentration of O
3 in monsoon period. AravalliBiodiversity Park (ABP) is designated as ‘away fromtraffic intersection’ (Site III) with dense vegetationmonitoring site. This site is closest to residentialarea of Vasant Vihar. The nitrogen dioxide (NO2)and ground level ozone (O3) monitoring was doneduring daytime (10:00a.m-6:00p.m) in monsoonmonth (22nd -28th Sept’ 2009). Take in Fig.4, it wasclearly depicted that the average concentration (for7 days) of NO2 was found to be 5.72 mg/m3 and forO3 was 19.70 mg/m3. The highest concentration ofNO2 (9.54 mg/m3) was recorded on 25th Sept’09 (4th
day) and for O3 (24.47 µg/m3) on 28th Sept (7th day).Moreover, from their diurnal profile, it has also been
noticed that the high peaks of ozone were found at14:00 hrs (21.54µg/m3) and 16:00 hrs (22.98µg/m3). The recorded concentrations of NO2 and O3
depicted that the peak levels were under thepermissible limit of both NO2 (80µg/m3) and O3
(80µg/m3) during the monsoon month. The valuesof O3 are generally higher in summer and wintermonths at this site (Saxena et al, 2009) as perprevious studies but our present study wasconducted during monsoon month that’s why it hassomewhat lower values of ozone due to thescavenging action of rain, besides this site was alsoaway from traffic intersection area, therefore on siteemission was less which ultimately gave rise tolow concentration of pollutants (Lal et al, 2000). AtSite IV (Traffic intersection outside ABP, VasantVihar, ring road) is a densely vegetative area about3 km away from Site III (ABP) located near Vasantvihar at ring road with heavy traffic flow (particularlytwo- wheelers and buses). The ground level ozone(O3) was monitored during daytime (10:00a.m.-6:00p.m) in monsoon month (15th Sept – 21st
Sept’2009). Taken in Fig.5, it was clearly depictedthat the average concentration (for 7 days) of O3
was 21.74 µg/m3. The concentration of O3 rangefrom 24.55µg/m3- 19.54 µg/m3 (on 5th and 3rd day).Moreover, from their diurnal profile, it has also beennoticed that the high peaks of ozone were found at13:00 hrs (28.99µg/m3) and 15:00 hrs (35.15µg/m3). The recorded concentrations of O3 depictedthat the peak levels were at below the threshold orpermissible limit. Thus, the present study concludesthat even after the implementation of CNG there isno remarkable progress in the variation of airpollutants except SO2 in the last 7 years (2002-2009). Our generated data also suggests thatvariation in ozone concentration was very sitespecific. Concentration of secondary pollutantozone was higher at site II & IV which are kerbsidearea, facing heavy traffic flow in comparison tovegetative site (site I & III).
REFERENCES
1. WHO Air Quality Guidelines for ParticulateMatter, Ozone, Nitrogen dioxide and SulfurDioxide. World Health Organization,Geneva, Switzerland 2: 1-212 (2005).
2. Monks PS, Granier C, Fuzzi S, Stohl A,Williams ML, Akimoto H, Amanni M,Baklanov A, Baltensperger U, Bey I, BlakeN, Blake RS, Carslaw K, Cooper OR,

115SAXENA et al., Curr. World Environ., Vol. 7(1), 109-115 (2012)
Dentener F, Fowler D, Fragkou E, Frost GJ,Generoso S, GinouxP, Grewe V, Guenther V,Hansson HC, Henne S, Hjorth J,Hofzumahaus A, Huntrieser H, Isaksen ISA,Jenkin ME, Kaiser J, Kanakidou M, KlimontZ, Kulmala M, Laj P, Lawrence MG, Lee JD,Liousse C, Maione M, McFiggans G, MetzgerA, Mieville A, Moussiopoulos N, Orlando JJ,O’Dowd CD, Palmer PI, Parrish DD, PetzoldA, Platt U, Po¨ schl . Pre´voˆt ASH, ReevesCE, Reimann S, Rudich Y, Sellegri K,Steinbrecher R, Simpson D, Brink H, ThelokeJ, Van der Werf GR, Vautard R, Vestreng,V,Vlachokostas Ch, Glasow R AtmosphericComposition Change Global and RegionalAir Quality. AtmosEnviron .43: 5268–5350 (2009) .
3. WHO World Health Report: Reducing Risks,Promoting Healthy Life. World HealthOrganization,Geneva, Switzerland l.1:191(2002).
4. Environment Canada’s Performance ReportGround Level Ozone: Occurrence andTransport in Eastern North America. US-Canada Air Committee 2: 1-50 (2003).
5. Lelieveld J, Crutzen PJ Role of Deep CloudConvection in the Ozone Budget of theTroposphere. Science 264: 1759-1761(1994).
6. WMO Scientific Assessment of OzoneDepletion. Meteorological Organization,Global Ozone Research and MonitoringProject- WMO, Geneva, Switzerland 2: 1-45(1998).
7. Central Pollution Control Board (CPCB) IndiaStatus of the Vehicular Pollution ControlProgramme in India. 1: 1-65 (2010).
8. Central Pollution Control Board (CPCB)India National Ambient Air Quality Status.1:1-85 (2008-2009).
9. WWF Delhi Environmental Status Report,An Information Handbook for Citizen Action.World Wide Life Fund for Nature, India l.1: 1-100 (1995).
10. Ministry of Road Transport and Highways,Motor transport statistics, MORTH.Government of India, New Delhi, Retrievedon 26th March 2006 from http: morth. nic.in/mts.htm (2004).
11. Gurjar BR, Van Aardenne JA, Lelieveld J,
Mohan M Emission Estimates and Trends(1990–2000) for Megacity Delhi andImplications. Atmos Environ 4: 5663 5681(2004).
12. CSE Report Right to Clean Air Campaign:Advocating Ways to Reduce Air Pollution. 2:1-219 (2004).
13. Leone JA, Seinfeld, JH Analysis of theCharacteristics of Complex ChemicalReaction Mechanisms: Application toPhotochemical Smog Chemistry. Environ. Sci.Technol 184: 280-287(1984) .
13. Narain U, Krupnick A The Impact of Delhi’sCNG Program on Air Quality Resources ofthe Future, DP 07-06 (2007) .
14. Saxena P, Ghosh C Comparative Variationof Tropospheric Ozone and its PrecursorGases at Traffic Intersection sites in Delhi.Evn Poll Cont J 12(6): 73-76 (2009).
15 Saxena P, Ghosh C Comparative Variationof Ground level Ozone Pollution before andafter the Implementation of CNG in Delhi.As J Chem 10: 7498-7506 (2009).
16. Chan LY, Kwok WS Roadside SuspendedParticulates at Heavily Trafficked Urban Sitesof Hong Kong- Seasonal Variation andDependence on Meteorological Conditions.Atmos Environ 35: 3177-3182(2001).
16. Lal S., Naja M, Subbaraya BH SeasonalVariations in Surface Ozone and its PrecursorOver an Urban Site in India. Atmos Environ34: 2713-2724 (2000).
17. Saraf N, Beig G, Schultz M TroposphericDistribution of Ozone and its Precursor Overthe Tropical Indian Ocean. J Geo Phy Res108: 4-9.
18. Jain SL, Arya BC, Kumar A, Ghude SD,Kulkarni PS Observational Study of SurfaceOzone at New Delhi, India. Int. J. Rem. Sens.24: 25-33 (2004).
19. Saxena P, Kumar S, Ghosh C PatternChange in the Concentration of GreenhouseGas, Tropospheric Ozone at two Distinct Sitesin Delhi during Post CNG Era. In Proceedingsof CETAS International Conference onChanging Environmental Trends andSustainable Development, GuruJambheshwar University, Hisar, India. 67-71(2009).

INTRODUCTION
Biomedical waste management hasrecently emerged as an issue of major concern notonly to hospitals, nursing home authorities but alsoto the environment. the bio-medical wastesgenerated from health care units depend upon anumber of factors such as waste managementmethods, type of health care units, occupancy ofhealthcare units, specialization of healthcare units,ratio of reusable items in use, availability ofinfrastructure and resources etc.1
The proper management of biomedicalwaste has become a worldwide humanitarian topictoday. Although hazards of poor management ofbiomedical waste have aroused the concern worldover, especially in the light of its far-reaching effectson human, health and the environment.2
Now it is a well established fact that thereare many adverse and harmful effects to theenvironment including human beings which arecaused by the “Hospital waste” generated during
Current World Environment Vol. 7(1), 117-124 (2012)
Need of Biomedical Waste Management System inHospitals - An Emerging issue - A Review
PRAVEEN MATHUR, SANGEETA PATAN* and ANAND S. SHOBHAWAT
Department of Environmental Science, MDS University Ajmer - 305 009 (India).
(Received: April 24, 2012; Accepted: May 27, 2012)
ABSTRACT
Medical care is vital for our life and health, but the waste generated from medical activitiesrepresents a real problem of living nature and human world. Improper management of wastegenerated in health care facilities causes a direct health impact on the community, the health careworkers and on the environment Every day, relatively large amount of potentially infectious andhazardous waste are generated in the health care hospitals and facilities around the world.Indiscriminate disposal of BMW or hospital waste and exposure to such waste possess seriousthreat to environment and to human health that requires specific treatment and management priorto its final disposal. The present review article deals with the basic issues as definition, categories,problems relating to biomedical waste and procedure of handling and disposal method of BiomedicalWaste Management. It also intends to create awareness amongst the personnel involved in healthcare unit.
Key words: Hazardous waste, Biomedical Waste Management, Health care unit.
the patient care. Hospital waste is a potential healthhazard to the health care workers, public and floraand fauna of the area. The problems of the wastedisposal in the hospitals and other health-careinstitutions have become issues of increasingconcern. 3
DefinitionAccording to Biomedical Waste
(Management and Handling) Rules, 1998 of India“Any waste which is generated during thediagnosis, treatment or immunization of humanbeings or animals or in research activitiespertaining thereto or in the production or testing ofbiologicals. 4
The Government of India (notification,1998) specifies that Hospital Waste Managementis a part of hospital hygiene and maintenanceactivities. This involves management of range ofactivities, which are mainly engineering functions,such as collection, transportation, operation ortreatment of processing systems, and disposal ofwastes. 4

118 MATHUR et al., Curr. World Environ., Vol. 7(1), 117-124 (2012)
One of India’s major achievements hasbeen to change the attitudes of the operators ofhealth care facilities to incorporate good HCWmanagement practices in their daily operations andto purchase on-site waste management servicesfrom the private sector. (Bekir Onursal, 2003)
World Health Organization states that 85%of hospital wastes are actually non-hazardous,whereas 10% are infectious and 5% are non-infectious but they are included in hazardouswastes. About 15% to 35% of Hospital waste isregulated as infectious waste. This range isdependent on the total amount of waste generated(Glenn and Garwal, 1999).5
Classification of Bio-Medical WasteThe World Health Organization (WHO)
has classified medical waste into eight categories:´ General Waste´ Pathological´ Radioactive´ Chemical´ Infectious to potentially infectious waste´ Sharps´ Pharmaceuticals´ Pressurized containers
Sources of Biomedical WasteHospitals produce waste, which is
increasing over the years in its amount and type.The hospital waste, in addition to the risk for patientsand personnel who handle them also poses a threatto public health and environment.
Major Sources• Govt. hospitals/private hospitals/nursing
homes/ dispensaries.• Primary health centers.• Medical colleges and research centers/
paramedic services.• Veterinary colleges and animal research
centers.• Blood banks/mortuaries/autopsy centers.• Biotechnology institutions.• Production units.
Minor Sources• Physicians/ dentists’ clinics• Animal houses/slaughter houses.
• Blood donation camps.• Vaccination centers.• Acupuncturists/psychiatric clinics/cosmetic
piercing.• Funeral services.• Institutions for disabled persons
Problems relating to biomedical wasteA major issue related to current Bio-
Medical waste management in many hospitals isthat the implementation of Bio-Waste regulation isunsatisfactory as some hospitals are disposing ofwaste in a haphazard, improper and indiscriminatemanner. Lack of segregation practices, results inmixing of hospital wastes with general waste makingthe whole waste stream hazardous. Inappropriatesegregation ultimately results in an incorrectmethod of waste disposal.
Inadequate Bio-Medical wastemanagement thus will cause environmentalpollution, unpleasant smell, growth andmultiplication of vectors like insects, rodents andworms and may lead to the transmission of diseaseslike typhoid, cholera, hepatitis and AIDS throughinjuries from syringes and needles contaminatedwith human.6
Various communicable diseases, whichspread through water, sweat, blood, body fluids andcontaminated organs, are important to be prevented.The Bio Medical Waste scattered in and aroundthe hospitals invites flies, insects, rodents, cats anddogs that are responsible for the spread ofcommunication disease like plague and rabies. Ragpickers in the hospital, sorting out the garbage areat a risk of getting tetanus and HIV infections. Therecycling of disposable syringes, needles, IV setsand other article like glass bottles without propersterilization are responsible for Hepatitis, HIV, andother viral diseases. It becomes primaryresponsibility of Health administrators to managehospital waste in most safe and eco-friendlymanner6.
The problem of bio-medical wastedisposal in the hospitals and other healthcareestablishments has become an issue of increasingconcern, prompting hospital administration to seeknew ways of scientific, safe and cost effective

119MATHUR et al., Curr. World Environ., Vol. 7(1), 117-124 (2012)
Fig. 1
management of the waste, and keeping theirpersonnel informed about the advances in this area.The need of proper hospital waste managementsystem is of prime importance and is an essentialcomponent of quality assurance in hospitals.
Need of biomedical waste management inhospitals
The reasons due to which there is greatneed of management of hospitals waste such as:1. Injuries from sharps leading to infection to
all categories of hospital personnel andwaste handler.
2. nosocomial infections in patients from poorinfection control practices and poor wastemanagement.
3. Risk of infection outside hospital for wastehandlers and scavengers and at timegeneral public living in the vicinity ofhospitals.
4. Risk associated with hazardous chemicals,drugs to persons handling wastes at alllevels.
5. “Disposable” being repacked and sold byunscrupulous elements without even beingwashed.
6. Drugs which have been disposed of, beingrepacked and sold off to unsuspecting
buyers.7. Risk of air, water and soil pollution directly
due to waste, or due to defective incinerationemissions and ash3.
Biomedical Waste Management ProcessThere is a big network of Health Care
Institutions in India. The hospital waste like bodyparts, organs, tissues, blood and body fluids alongwith soiled linen, cotton, bandage and plaster castsfrom infected and contaminated areas are veryessential to be properly collected, segregated,stored, transported, treated and disposed of in safemanner to prevent nosocomial or hospital acquiredinfection. 1. Waste collection2. Segregation3. Transportation and storage4. Treatment & Disposal5. Transport to final disposal site6. Final disposal
Biomedical Waste Treatment and DisposalHealth care waste is a heterogeneous
mixture, which is very difficult to manage as such.But the problem can be simplified and its dimensionreduced considerably if a proper managementsystem is planned.

120 MATHUR et al., Curr. World Environ., Vol. 7(1), 117-124 (2012)
Incineration TechnologyThis is a high temperature thermal
process employing combustion of the wasteunder controlled condition for converting theminto inert material and gases. Incinerators can beoil fired or electrically powered or a combinationthereof. Broadly, three types of incinerators areused for hospital waste: multiple hearth type, rotarykiln and controlled air types. All the types canhave primary and secondary combustionchambers to ensure optimal combustion. Theseare refractory lined.7
Non-Incineration TechnologyNon-incineration treatment includes four
basic processes: thermal, chemical, irradiative, andbiological. The majority of non-incinerationtechnologies employ the thermal and chemicalprocesses. The main purpose of the treatmenttechnology is to decontaminate waste by destroyingpathogens. Facilities should make certain that thetechnology could meet state criteria for disinfection. 9
Autoclaving´ The autoclave operates on the principle of
the standard pressure cooker.´ The process involves using steam at high
temperatures.´ The steam generated at high temperature
penetrates waste material and kills all themicro organism
´ These are also of three types: Gravity type,Pre-vacuum type and Retort type.
In the first type (Gravity type), air isevacuated with the help of gravity alone. The systemoperates with temperature of 121 deg. C. and steampressure of15 psi. for 60-90 minutes. Vacuum pumpsare used to evacuate air from the Pre vacuumautoclave system so that the time cycle is reducedto 30-60 minutes. It operates at about 132 deg. C.Retort type autoclaves are designed much highersteam temperature and pressure. Autoclavetreatment has been recommended for microbiologyand biotechnology waste, waste sharps, soiled andsolid wastes. This technology renders certaincategories (mentioned in the rules) of bio-medicalwaste innocuous and unrecognizable so that thetreated residue can be land filled. 8
Microwave Irradiation´ The microwave is based on the principle of
generation of high frequency waves.´ These waves cause the particles within the
waste material to vibrate, generating heat.´ This heat generated from within kills all
pathogens.
Chemical Methods´ 1 % hypochlorite solution can be used for
chemical disinfection
Plasma PyrolysisPlasma pyrolysis is a state-of-the-art
technology for safe disposal of medical waste. It isan environment-friendly technology, which convertsorganic waste into commercially useful byproducts.The intense heat generated by the plasma enablesit to dispose all types of waste including municipalsolid waste, biomedical waste and hazardouswaste in a safe and reliable manner. Medical wasteis pyrolysed into CO, H2, and hydrocarbons whenit comes in contact with the plasma-arc. These gasesare burned and produce a high temperature(around 1200oC).9
Biomedical Waste Management RulesSafe disposal of biomedical waste is now
a legal requirement in India. The Biomedical WasteManagement & Handling) Rules, 1998 came intoforce on 1998. In accordance with these rules, it isthe duty of every “occupier” i.e. a person who hasthe control over the institution or its premises, totake all steps to ensure that waste generated ishandled without any adverse effect to human healthand environment. It consists of six schedules.Schedule ISchedule IISchedule IIISchedule IVSchedule VSchedule VI
Schedule IVLabel for Transport of Bio-Medical Waste
Containers/BagsDay ………… Month ………….......Year ………......Date of generation ……………….............................Waste category No ……..Waste class

121MATHUR et al., Curr. World Environ., Vol. 7(1), 117-124 (2012)
Schedule 1. Categories of Bio-Medical Waste
Option Treatment & Disposal Waste Category
Cat. No. 1 Incineration /deepburial Human Anatomical Waste (human tissues,organs, body parts)
Cat. No. 2 Incineration /deep burial Animal Waste Animal tissues, organs, Bodyparts carcasses, bleeding parts, fluid, bloodand experimental animals used in research,waste generated by veterinary hospitals /colleges, discharge from hospitals, animalhouses)
Cat. No. 3 Local autoclaving/ micro Microbiology & Biotechnology wastewaving/ incineration (wastes from laboratory cultures, stocks or
specimens of micro-organisms live orattenuated vaccines, human and animalcell culture used in research andinfectious agents from research andindustrial laboratories, wastes fromproduction of biological, toxins, dishesand devices used for transfer of cultures)
Cat. No. 4 Disinfections (chemical Waste Sharps (needles, syringes, scalpelstreatment /autoclaving/micro blades, glass etc. that may causewaving and mutilation shredding puncture and cuts. This includes both
used & unused sharps)Cat. No. 5 Incineration / destruction & drugs Discarded Medicines and Cytotoxic
disposal in secured landfills drugs (wastes comprising of outdated,contaminated and discarded medicines)
Cat. No. 6 Incineration , autoclaving/micro Solid Waste (Items contaminated withwaving blood and body fluids including
cotton, dressings, soiled plaster casts,line beddings, other materialcontaminated with blood)
Cat. No. 7 Disinfections by chemical Solid Waste (waste generated fromtreatment autoclaving/micro disposable items other than the wastewaving& mutilation shredding. sharps such as tubing, catheters,
intravenous sets etc.)Cat. No. 8 Disinfections by chemical treatment Liquid Waste (waste generated from
and discharge into drain laboratory & washing, cleaning , house-keeping and disinfecting activities)
Cat. No. 9 Disposal in municipal landfill Incineration Ash (ash from incineration ofany bio-medical waste)
Cat. No. 10 Chemical treatment & Chemical Waste (chemicals used indischarge into drain for production of biological, chemicals, usedliquid & secured in disinfect ion, as insecticides, etc)landfill for solids
(Source- The Bio Medical Waste (Management and Handling) Rules, 1998)

122 MATHUR et al., Curr. World Environ., Vol. 7(1), 117-124 (2012)
Waste description
Sender’s Name & Address Receiver’s Name &AddressPhone No …..........…... Phone No .......……………Telex No …...................Telex No ……..........………Fax No ……………....... Fax No ………...........……..Contact Person ……...................................................Contact Person ………In case of emergency please contactName & Address:Phone No.
Note: Label shall be non-washable and prominentlyvisible.
Schegule-VStandards for Treatment and Disposal Of
Bio-Medical Wastes Standards For Incinerators
Schegule-VISchedule for Waste Treatment Facilities
like Incinerator/ Autoclave/ Microwave System.10
(Source- The Bio Medical Waste (Management andHandling) Rules, 1998).
Benefits of Biomedical Waste Management´ Cleaner and healthier surroundings.´ Reduction in the incidence of hospital
acquired and general infections.´ Reduction in the cost of infection control
within the hospital.´ Reduction in the possibility of disease and
death due to reuse and repackaging ofinfectious disposables.
´ Low incidence of community andoccupational health hazards.
´ Reduction in the cost of waste managementand generation of revenue throughappropriate treatment and disposal of waste.
´ Improved image of the healthcareestablishment and increase the quality oflife.
Schedule II: Colour Coding and Type Of Container for Disposal of Bio-Medical Wastes
Colour Type Waste Treatment Options as perCoading of Containers Category Schedule 1
Yellow Plastic bag Disinfected 1,2,3,6 Incineration/deep burialRed Disinfected 3,6,7 Autoclaving/Micro waving/
Container/Plastic bag Chemical TreatmentBlue/White Plastic bag/puncture 4,7 Autoclaving/Micro waving/chemicalTranslucent proof container treatment and destruction/shreddingBlack Plastic bag 5,9,10 (solid) Disposal in second landfill
Schedule III: Label for Bio-Medical Waste Containers/Bags

123MATHUR et al., Curr. World Environ., Vol. 7(1), 117-124 (2012)
Recommendations1. For the use of incinerator Training should be
given to some number of persons from staff.2. Specific fund should be allocated for the use
of incinerator.3. Every hospital should have special boxes to
use as dustbin for bio-medical waste.4. Bio-medical waste should not be mixed with
other waste of Municipal Corporation.5. Private hospitals should also be allowed to
use incinerator, which is installed, in govt.hospital. For this purpose a specific fee canbe charged from private hospitals.
6. Special vehicle i.e. bio-medical wastevehicle should be started to collect wastefrom private hospitals and private medicalclinics and carry it up to the main incinerator.
7. As provided by bio-medical waste rules, thewhole of the waste should be fragmentedinto colours due to their hazardous nature.
8. Bio-medical waste Management Board canbe established in each District.
9. Either judicial powers should be given to themanagement board or special court shouldbe established in the matters of environment pollution for imposing fines and awardingdamages etc.
10. Housekeeping staff wear protective devicessuch as gloves, face masks, gowned, whilehandling the waste.
11. There is biomedical waste label on wastecarry bags and waste carry trolley and alsoposter has put on the wall adjacent to thebins (waste) giving details about the type ofwaste that has to dispose in the baggage asper biomedical waste management rule.Carry bags also have the biohazard symbolon them.
CONCLUSION
Medical wastes should be classifiedaccording to their source, typology and risk factorsassociated with their handling, storage and ultimatedisposal. The segregation of waste at source is thekey step and reduction, reuse and recycling shouldbe considered in proper perspectives. We need toconsider innovative and radical measures to cleanup the distressing picture of lack of civic concernon the part of hospitals and slackness ingovernment implementation of bare minimum ofrules, as waste generation particularly biomedicalwaste imposes increasing direct and indirect costson society. The challenge before us, therefore, is toscientifically manage growing quantities ofbiomedical waste that go beyond past practices. Ifwe want to protect our environment and health ofcommunity we must sensitize our selves to thisimportant issue not only in the interest of healthmanagers but also in the interest of community.
REFERENCES
1. Mandal S. K. and Dutta J. , Integrated Bio-Medical Waste Management Plan for PatnaCity, Institute of Town Planners, India Journal6-2: 01-25 (2009).
2. Singh V. P., Biswas G., and Sharma, J. J.,Biomedical Waste Management - AnEmerging Concern in Indian HospitalsIndian, Journal of Forensic Medicine &Toxicology, Vol. 1, No. 1. (2007-12).
3. Hem Chandra, Hospital Waste anEnvironmental Hazard and Its Management,(1999).
4. Govt. of India, Ministry of Environment andForests Gazette notification No 460 dated
July 27, New Delhi: 1998: 10-205. Glenn, Mc.R & Garwal, R. Clinical waste in
Developing Countries. An analysis with aCase Study of India, and a Critique of theBasleTWG Guidelines (1999)
6. CEET: Biomedical Waste Management-Burgeoning issue (2008)
7. Gravers PD. Management of HospitalWastes- An overview. Proceedings ofNational workshop on Management ofHospital Waste,(1998)
8. Thornton J., Tally MC, Orris P., Wentreg J.Hospitals and plastics Dioxin prevention and

124 MATHUR et al., Curr. World Environ., Vol. 7(1), 117-124 (2012)
Medical Waste Incineration; Public HealthReports. 1996; 1:299- 313.
9. Surjit S. Katoch Biomedical WasteClassification and Prevailing ManagementStrategies, Proceedings of the InternationalConference on Sustainable Solid WasteManagement, p. p.169-175 (2007).
10. The Bio Medical Waste (Management andHandling) Rules, (1998).
11. Dr. Saurabh Sikka, Biomedical Waste in
Indian Context.12. Shalini Sharma* and S.V.S.Chauhan,
Assessment of bio-medical wastemanagement in three apex Governmenthospitals of Agra,Journal of Environmental Biology, 29(2), p.p 159-162 (2008)
13. Bekir Onursal, Health Care WasteManagement in India. The world Bank(2003).

INTRODUCTION
The life on the earth depends on the water.Everything originated in the water and sustain bywater. It is most common abundant, indispensable,inorganic component of the earth’s environment,constitutes living matter predominantly. It is a primeresource and physiological necessity to mankind.
This work include the sample collectiontechnique, collection, preservation and handlingof collected sample. The collected samples wereanalyzed for the determination of Physico-chemicalparameter i.e. colour, temperature, Eh, pH, specificconductivity, total solid, dissolved solids, acidity totalhardness, alkalinity, TDIC, TOC, DO, BOD, COD &Phenols1-2.
Analysis of cadmium, chromium, nickel,copper, iron, lead, zinc, manganese, magnesium,arsenic, calcium & vanadium ions performed with thehelp of Flame Atomic Absorption spectroscopy13-14.
Carbonates, bicarbonates, sulphide,sulphate, phosphate, total-N, nitrate-N, nitrite-N,organic nitrogen and chlorides are analyzed usingstandard method.
Current World Environment Vol. 7(1), 125-131 (2012)
Physico-chemical Characterization of Water Body withSpecial Reference to Battery, Power Sources and
Metal Plating Effluents
DHANANJAY DWIVEDI1 and VIJAY R. CHOUREY2
1Department of Chemistry, PMB Gujarati Science College, Indore - 452 001 (India).2Government Holkar Autonomous Science College, Indore - 452 001 (India).
(Received: April 03, 2012; Accepted: May 20, 2012)
ABSTRACT
The World is facing a tremendous set of environmental problems which are due to thecontaminated ground water and hazardous waste effluents coming out of process industries dueto advanced industrialization in different field. Thus, it is essential to rectify this problem.
Key words: Water bodies, Battery, power sources, Metal plating effluents.
EXPERIMENTAL
The samples collected from the effluentsat the time of mixing into the river khan wereanalyzed to determine various physico-chemicalparameter and to study the preserve of cations andanione. As there are no. of different resourced whichare discharging continuously their effluents in theriver. Due to this a separate study was carried outon the effluents of each source at the function pointand tabulized accordingly work is performed onthe effluents discharge by,i. Battery and power sourced effluents.ii. Metal plating effluents.
For the determinants of undertakenparameters, a set of four sample from each sourceon each data as given in the table were analyzedfor the year 2005-06 and results are summarizedin the subsequent tables.
RESULTS AND DISCUSSION
Battery & power sourcesThe effluent contains toxic cations viz. Vi,
Cd, Zn, Pb & traces of v. The major fractionsconstituted from this industry is lead it’s highestconcentration was found in March and April. The

126 DWIVEDI & CHOUREY, Curr. World Environ., Vol. 7(1), 125-131 (2012)
Table 1:Battery and Power Sources : Analysis of physico chemical characteristics of effluents
Date 9-Jan-05 15/4/2005 28-Jul-05 8-Nov-05
SS→→→→→P↓ I II III IV I II III IV I II III IV I II III IV
1 Bf - - Bf - - - Bf - - - Bf - - - Bf2 23 22 20.8 21.2 31 29 29.2 27 31 31 30.3 30.3 28.7 28.4 23 23.93 5.2 5.4 7.1 7.1 4.9 4.9 6.9 6.7 4.4 4.6 7.3 7.3 4.4 4.5 7 6.94 49 49 37 37 48 48 57 57 61 59 30 30 61 58 32 355 13.5 13.8 14.3 14.3 13.2 13.6 12.3 13.2 14.1 13.4 12.6 12.8 14 12.9 12.9 13.56 300 281 123 164 12.2 109 90 98 211 184 121 136 142 113 111 1137 82 73 42 45 72 69 52 66 52 45 66 73 61 58 53 598 382 342 161 211 192 178 142 163 262 232 184 211 201 169 163 1729 nd - - - nd nd - - nd - - - nd - - -10 - - - - nd nd - - nd - - - nd - - -11 610 559 200 241 702 663 212 242 601 579 163 221 542 511 142 18112 13 9.6 1.6 2.1 3.9 3.5 1.3 1.5 18 12.4 1.6 3 2.1 1.69 1.4 2.813 nd - - - - - - - nd - - - - - - -14 19 2.2 2.6 2.3 3.3 3.3 2.9 2.9 2.6 2.8 3.3 4 3.1 3 3.2 3.215 581 532 301 322 642 611 361 415 512 470 282 293 483 478 288 30616 341 320 158 173 411 386 141 159 353 340 166 160 301 304 152 14817 390 362 162 181 260 253 140 149 470 449 138 162 456 429 134 16118 321 301 162 178 342 318 181 192 311 302 136 152 262 242 146 15819 nd - - - - - - - - - - - - - - -20 38 26 19 15 41 34 30 25 26 12 9 12 36 30 14 1921 nd nd - - - - - - - - - - 36 30 14 1922 132 109 61 85 52 46.9 42 47 161 149 53 66 111 91 56 6523 6.2 4.2 - 0.7 4.2 3.2 nd 0.6 10 7.7 - 0.6 8.2 6.7 0.5 0.624 12 8 0.9 1.1 2 1.8 0.4 0.6 8.1 6 0.6 0.9 6.2 5.4 0.6 125 262 242 200 180 300 280 254 216 220 176 110 122 298 235 186 21126 nd - - - - - - - - - - - - - - -27 nd - - - - - - - - - - - - - - -28 2.8 1.8 1.2 1.4 4.2 3.,9 2.6 1.9 2.9 1.9 1.4 1.2 4 3.6 2.8 1.229 1 0.7 0.46 nd 1.7 1.5 0.9 1 0.9 0.6 nd 0.11 1.3 1.2 0.8 0.930 nd - - - nd - - - nd - - - - - - -31 11 6.9 0.4 1.5 4.1 3.1 0.6 0.8 8.2 5.3 0.8 1.2 4.2 3.2 0.6 1.832 0.4 0.8 - 0.6 nd - - - nd - - - 1.4 1 - 0.633 7.5 3.9 - 1.2 11 8.3 0.3 1.4 1.8 0.7 0.2 0.3 2.6 1.3 0.3 0.434 7.3 5.6 0.8 2.9 6.1 4.2 0.8 1.1 4.8 3.3 0.5 2.9 2.8 2.2 0.5 1.135 6.2 5.2 0.4 1 18 10 0.9 2.3 5.3 3.8 0.3 0.8 3.3 2.8 0.2 0.836 nd - - - nd - - - nd - - - nd - - -37 nd - - - nd - - - nd - - - nd - - -38 6.6 4.8 - 1.5 1.4 0.4 - - nd - - - 4.3 3.3 - -39 1.3 4.1 2.8 2.9 13 11 8.1 11 11 6.6 3 3.6 4.2 2.8 1.9 2.140 0.6 0.03 0.9 nd 0.02 nd - - nd - - - nd - - -41 nd - - nd - - - nd - - - nd - - -

127DWIVEDI & CHOUREY, Curr. World Environ., Vol. 7(1), 125-131 (2012)
Table 2: Battery and Power Sources : Analysis ofphysico chemical characteristics of effluents
Date 28-Nov-05 10-Mar-06 20-Jun-06 20-Sep-06
SS→→→→→P↓ I II III IV I II III IV I II III IV I II III IV
1 bn - - - bf - - - bf - - - bf - - -2 26 24 22.6 22.2 27.1 26 26.2 25.9 38.5 36.9 33 33.3 38 37 30.8 30.93 4.7 4.9 7.1 6.9 5.1 5.2 6.8 6.7 4.8 4.9 6.9 6.9 4.8 4.8 7.1 6.94 54 50 58 55 50 49 52 56 54 62 58 55 62 61 58 555 14.1 14.5 13.2 13.6 13.6 13.5 13.8 13.9 14.2 12.1 13.2 13.9 12.1 12.1 13.2 13.96 241 216 131 145 145 133 96 102 156 143 98 108 192 168 128 1297 71 63 39 58 58 49 38 72 66 62 33 43 79 66 39 428 311 283 162 201 201 180 133 172 221 239 129 43 268 256 158 1769 nd - - - nd - - - nd - - - nd - - -10 562 540 242 284 641 610 262 232 654 642 282 292 512 484 211 23911 17 13 2.3 3.2 12 9.3 2 2.5 16 12.8 2.4 3.2 21 16 2.7 3.412 nd - - - nd - - - nd - - - nd - - -13 2.4 2.8 3.6 3.4 3.2 3.6 2.8 2.8 3.4 3.4 3.2 3.2 2.8 2.9 3.1 3.114 nd - - - nd - - - nd - - - nd - - -15 312 297 177 189 419 407 166 161 393 381 161 169 328 314 179 19216 573 563 373 391 711 681 390 456 581 577 381 412 543 521 332 35617 342 328 173 192 282 261 163 172 372 356 155 172 400 376 163 18818 312 310 182 189 362 341 214 131 372 346 212 229 402 373 186 20119 nd - - - nd nd - - nd - - - nd - - -20 nd - - - nd nd - nd - - - nd - - -21 nd - - - nd nd - - nd - - - nd - - -22 156 134 53 72 61 60 - 46 81 73 47 47 140 126 41 5123 6 3.8 - 0.4 4 2.8 - 0.5 5.3 2.7 0.2 0.4 6.2 4.6 0.5 0.424 12 7 0.8 0.6 3.4 2.2 0.9 1.9 1.4 0.5 0.6 9.6 8.3 0.6 0.925 nd - - - nd - 42 - nd - - - nd - - -26 nd - - - nd - 0.4 - nd - - - nd - - -27 nd - - - nd - 0.6 - nd - - - nd - - -28 nd - - - nd - - - nd - - - nd - - -29 6.6 3 1.4 1.6 5.3 3 2.7 3 8 7.3 4.8 5 6 4.4 3.2 3.830 nd - - - nd - - - nd - - - nd - - -31 9 6.8 0.8 1.3 5.6 4.4 0.2 1.2 6.3 5.2 0.6 1.6 6.2 4.9 0.8 1.232 2.2 1.6 0.8 1 nd - - - nd - - - 2.1 1.6 0.5 133 14 9.3 0.6 2.2 8.2 6.6 0.2 1 6.2 5.2 0.8 1.2 6.2 4.8 0.6 1.634 5.8 4.4 0.8 2.2 8.1 6.3 1.1 3.6 8.3 6.7 1.3 4 5.3 4.6 0.6 1.835 7.2 5.9 0.2 1.2 13 9.2 0.6 1.8 9.2 6.2 0.3 1.2 4.2 3.6 0.6 0.836 nd - - - nd - - - nd - - - nd - - -37 nd - - - nd - - - nd - - - nd - - -38 3.9 2.9 0.8 1.6 2 1.4 0.6 1.2 2.4 - 0.6 0.8 1.6 1.2 1 1.239 17 9 3.4 4.2 13 11 9 6.4 9 6.6 5 6.5 14 15 9 1140 0.04 nd - - - - - - 0.1 - - - nd - - -41 nd - - - - - - - nd - - - nd - - -

128 DWIVEDI & CHOUREY, Curr. World Environ., Vol. 7(1), 125-131 (2012)
Table 3 :Battery and Power Sources : Analysis ofphysico chemical characteristics of effluents
Date 09-Jan-05 15-Apr-05 28-Jul-05 08-Nov-05
SS→→→→→P↓ I II III IV I II III IV I II III IV I II III IV
1 G - - - G - - - T - - - G - - -2 21 20 20 21.1 25 26 28 28.1 29 27.9 27.4 27.2 27.4 26.6 25.6 26.33 3.9 4.8 6.8 6.8 5 5.8 6.8 6.8 4.8 5.8 8 8 5.1 5.6 6.6 7.34 67 49 56 57 47 38 58 55 43 37 57 58 48 40 54 545 15.2 13.2 13.2 13.4 13.6 15.6 13.2 12.9 13.8 14.7 12.8 12.6 13.3 15.3 13.4 12.86 999 901 316 482 2901 2631 1211 2051 661 606 291 436 796 719 291 4627 236 201 126 222 701 472 392 242 331 304 181 294 251 261 141 3058 1236 101 441 711 3601 3101 160 2291 990 910 471 730 1045 981 431 7649 101 93 241 246 716 669 601 616 211 193 211 206 171 156 201 21010 69 63 451 451 531 476 366 401 96 85 411 418 76 75 341 35311 nd - - - nd - - - nd - - - nd - - -12 nd - - - nd - - - nd - - - nd - - -13 0.8 0.66 0.5 0.2 1.1 0.9 0.3 0.2 0.66 0.5 - 0.3 0.5 0.33 - -14 2.6 2.7 3.3 3.1 1.5 1.7 2.1 1.8 2.6 2.8 3.5 3.4 2.9 3.1 3.2 3.215 471 463 163 236 496 471 171 241 411 393 181 206 526 493 171 24116 171 153 153 113 181 171 101 121 156 148 107 111 161 153 108 12117 171 162 142 160 202 148 161 168 150 139 122 124 311 292 132 16418 150 126 115 110 625 606 131 196 121 99 92 96 62 43 90 9619 - - - - nd nd - - - - - - nd - - -20 - - 0.2 - - 1.5 4 1.3 - - - - nd 0.8 0.5 0.221 44 38 92 104 282 241 201 221 59 50 101 123 50 42 98 12022 34 30 110 112 252 215 165 81 36 32 23 129 28 26 109 11423 nd - - - nd - - - nd - - - nd - - -24 0.1 0.1 - - 0.3 - - - 0.6 - - - 0.1 - - -25 26 25.3 15 16 28 19 12 18 30 18.4 12 12.8 15 12.1 12.5 12.626 nd - - - 9.2 6.2 5 5.4 nd - - - nd - - -27 7.1 6.3 4.5 5 - - - - 8 7.2 4.8 5.3 6 5.1 3.2 428 13 10.8 4.2s 6.3 4.2 3.2 3.8 4 7.4 6.2 4.4 6 8 9 4.6 6.229 15 1.4 1.4 3.8 7 5.1 0.9 2 14 11 4.1 4.4 9.1 8 2.5 3.130 1 0.7 nd 0.3 1.3 1.2 - 1 0.6 0.5 0.2 0.26 0.5 0.3 0.2 0.231 5.3 3.3 0.4 1.2 16 9.3 - 4.1 5.8 5 0.6 2.1 7.6 6.1 0.3 2.832 nd - - - 2.1 2.2 0.3 1 4.1 1.3 1.7 2.1 1.7 4.3 1.6 2.933 21 16.4 0.7 3.2 20 9 1.6 1.9 10 6 0.8 3.6 6 4.9 1.1 2.234 20.1 16.3 7 9.9 15 11.3 4.1 10 25 20 7.3 8.9 10.1 9.1 5 5.935 1.5 0.6 0.1 0.2 0.5 0.2 - 0.1 1 0.5 - 0.2 0.8 0.3 0.3 0.336 18 13 0.7 5.1 30 17 7.2 12 20 15.2 0.6 8.3 22 15 0.3 0.837 nd - - - nd - - nd - - - nd - - -38 0.48 0.3 nd - nd - - - nd - - - nd - - -39 101 81 75 79 101 83 41 63 181 121 103 95 221 197 141 16340 nd - - - nd - - - nd - - - nd - - -41 nd - - - nd - - - nd - - - - - - -

129DWIVEDI & CHOUREY, Curr. World Environ., Vol. 7(1), 125-131 (2012)
Table 4: Battery and Power Sources : Analysis of physico chemical characteristics of effluents
Date 28-Nov-05 10-Mar-06 20-Jun-06 20-Sep-06
SS→→→→→P I II III IV I II III IV I II III IV I II III IV
1 G - - - T - - - T - - - G - - -2 27 25.5 24.2 25 28 26.2 26 26 40 40 39 38.9 31 30 28 27.6
3 4.8 5.4 7.2 7.1 4.9 5.2 6.9 6.8 4.9 6 6.5 6.6 4.6 6.2 7.9 7.94 62 46 59 58 49 49 58 55 49 49 53 52 53 -51 -40 -405 12.2 13.9 12.6 13.2 13.5 13.5 13.2 13.2 13.5 13.5 12.8 13.1 14.1 12.4 14.3 14.3
6 2001 1582 502 711 2402 2160 1002 1600 2604 2500 1201 1701 1601 1313 362 6617 901 981 311 571 699 411 240 290 128 605 270 291 401 331 241 2318 2901 2561 812 1281 3100 2561 1240 1893 2734 3100 1461 1990 2003 1640 602 992
9 302 272 392 405 606 578 411 465 732 501 285 312 316 284 410 42810 nd - - - - - - - nd - - - nd - - -11 nd - 0 - - - - - nd - - - nd - - -
12 171 161 311 327 427 416 382 392 492 470 384 397 211 196 340 37213 2.7 2.9 3.3 3.3 1.8 2.1 2.4 1.9 2.1 1.8 2.8 2.4 3.1 3.2 3.7 3.714 nd - - - nd - - - nd - - - 0.82 - - -
15 175 171 111 111 166 148 121 1239 152 138 116 127 186 176 109 12216 471 460 189 189 601 566 185 266 560 520 181 271 511 495 185 24417 201 192 156 173 181 136 173 175 186 164 171 178 162 153 146 148
18 216 201 85 104 401 380 110 136 445 210 151 165 162 149 89 9219 nd - - - nd - - - nd - - - nd - - -20 nd - - - nd - - - nd - - - nd - - -
21 111 97 111 123 152 131 183 176 149 131 149 197 103 92 113 12622 79 71 156 162 321 286 201 217 352 313 236 201 66 59 149 15423 nd - - - nd - - - nd - - - nd - - -
24 0.8 - - - nd - - - nd - - - nd - - -25 21 19 14.6 16 21 16.8 14 19.3 24 21.6 14 15 27 25.2 10 1326 nd - - - 7 5 6 6.1 12 8.3 6.4 6.5 nd - - -
27 nd - - - nd - - - nd - - - 14 12.3 8 8.928 9 7.7 4.6 6.9 5.4 4.5 4 4.3 5.6 5.2 4.8 6 6 4.6 5 5.329 10 8 1.2 1.9 8 5.9 1.2 2.6 6 4.6 1 2.2 7 5.5 1.9 2.1
30 0.3 0.3 0.05 0.2 1.3 1.2 0.9 1 0.8 0.5 0.1 0.3 0.6 0.05 0.08 0.1631 10 7 1 2.8 9.1 6.2 2 2.6 7 4.3 3.6 2.8 5 3.9 0.2 1.632 2 1.7 0.3 0.9 3 2 0.4 0.9 1 0.6 0.2 0.3 5.1 4 1 1.6
33 12 7.6 0.6 3.2 12 8 0.5 2.4 9 4.3 0.4 1.1 5 5 0.5 2.234 8 6 3 3.6 20 16 5.6 8.2 25 18 5.8 14.2 12 8.5 3.9 5.335 0.8 0.6 0.2 0.3 0.5 0.3 - 0.2 0.9 0.4 - 0.2 0.9 0.5 0.3 0.4
36 7 4.6 0.3 2.1 0.9 7.1 6.1 5.2 13 7 0.3 4.2 6 3.9 0.1 1.737 nd - - - nd - - - nd - - - nd - - -38 0.02 - - - 0.6 0.02 - - 0.5 0.3 - 0.2 0.02 - - -
39 100 96 90 102 40 28 49 49 61 50 42 47 180 181 161 18040 nd - - - nd - - - nd - - - nd - - -41 nd - - - nd - - - nd - - - nd - - -

130 DWIVEDI & CHOUREY, Curr. World Environ., Vol. 7(1), 125-131 (2012)
values decreased largely in downstream. Ni wasfound in the range of 11.0.4 ppm, with a decreasingtrend with season and year. Vanadium was identifiedfrom the residence of oil fired boilers and flue, liner,vanadium in water may be accounted for teachingfrom residence.
The discharge from battery industriesrelated particularly with the recyclic activity,contributes the major fraction of the toxic materialsto the water of river khan. The COD, values werehigh owing to in organic chemicals. DO & BODvalues followed decreasing trend towardsdownstream.
The efficient acidic in nature havingpH<4.4 Though the quantity of discharge is lessbut it’s effects are considerably harmful to aquaticbiota.
Among the major anions identified formthe effluents were carbonated, sulphates, chloridesand phosphates.
The organic content was found to be highwhich are characteristics of the TDC values depictedas in the table (2T1 - 2T8). Apart from these, phenolswere identified from the effluent of transformer andpolymer processing wastes which are dumped inthe vicinity of river Khan and related site.
Metal Plating/RefiningBecause of diversified applications the
waste effluent from electroplating contributed avariety of toxic and hazardous anions viz.carbonates, chlorides, sulphates and also thecations viz. copper, cadmium, zinc and nickel etc.The effluents directly taken from source differ inappearance owing to different processes.
Effluent was acidic in nature at source,which had slightly shifted to neutral after beingdischarged into the stream and at the downstreampH remained < 7.1.
Concentrations of total solids existed highin the effluent. The concentration at the source washighest in April and March. About 75% of total solidswas present in dissolved state and remaining is insuspended form. Thus the dissolved solids
increased total solids in suspended form. Thus thedissolved solids increased total solids in April.
The COD values increased with totalsolids while the BOD values does not reveal anysignificant observation.
Among cations chromium (o.5-30 mg/L)(0.3-13mg/L during Jan. 05-Nov. 05 and Nov. 05-Sept. 06 respectively and cadmium (at source)ranged (1.9-21mg/L) during Jan. 05 - Nov. 06 and(0.5 - 12 mg/L) during Nov. 05 - Sept. 06. Indownstream the concentrations of chromium werealso found very high and may be explained in termsof high sulphates and due to the low sedimentationproperty of chromium. In contrast to chromium,cadmium reduced completely in downstream. The
P- Parameter SS-Sampling Site I to IV1. Color 21 Bicarbonate2. Temperature °C 22 Carbonate3. pH 23 Phenol4. Eh in MV 24 Phosphate5. Specific Conductivityin MS 25 Total N6. Dissolve Solids 26 Nitrate-N7. Suspended solids 27 Nitrite-N8. Total Solids 28 Organic-N9 Alkalinity 29 Iron10 Total Hardness 30 Copper11 Acidity 31 Nickel12 T.O.C. 32 Manganese13 T.D.I.C. 33 Cadmium14 D.O. 34 Zinc15 C.O.D. 35 Lead16 B.O.D. 36 Chromium17 Chloride 37 Magnesium18 Sulphate 38 Vanadium19 Sulphite 39 Calcium20 Sulphide 40 Tin41 Arsenic
Mean concentration (except colour, temperature & pH)
expressed in Mg./L
G - Gray, T - Turbid, Bf - Buff, n.d. - Not Detected
presence of ions in the source needs specialattention as it concerts more Cr(VI) to Cr (III) resultingin high dissolved concentration of Cr (III). Apart fromthese, nickel and zinc were also contributed fromother pools constituting a mined effluent.

131DWIVEDI & CHOUREY, Curr. World Environ., Vol. 7(1), 125-131 (2012)
The metal refining processor alsodischarge highly toxic forms of metallic speciessuch as vanadium, lead etc. High levels of leadwere detected in the out coming effluents. Theresults of analysis is given in table from (2T9-2T16).
CONCLUSIONS
The effluents coming into water body(Pond) is characterized to be highly acidic in naturehaving pH<4.4. Though the quantity of dischargefrom industrial unit is less but it’s effects areconsiderably harmful to aquatic biota. The wasteeffluents from electroplating contributed a varietyof toxic and hazardous anions as discussed on thebasis of available date of study.
REFERENCES
1. U.S. Mineral year book Bureau of Mines. U.S.Govt. Printing Office, Washington D.C. (1960-1979).
2. Niragu J.O. Fisher R.P. Nature, 279: 409-11(1979).
3. Toxic metals in Soil Plant System (Ede S.M.Ross). Wiky and Wons New York, 3-25 (1994).
4. Zantoponlos N.V. Bull. Znviron, ContaminToxicol. 62: 691-699 (1999).
5. APHA Standard methods for examination ofwater and waste 20th Ed., American PublicHealth Association, Washington D.C.,(1995).
6. Meeker E.W. and Wagner E.C. 2nd Eng.Chem. Anal. Ed. 5: 396, (1993).
7. Booth R.L. and Thomas R.F. Environ Sci. Tech.7: 523 (1973).
8. Tessier A et. al. Anal. Chem, 51: 844-51
(1979).9. Gupta V., Agrawal J., Purohit M., Res. J. Chem.
Environ, 11(1): 40 (2007).10. Orhan, Y., and Byu-Kgungor The removal of
Hearey Metals by using, Agricultural WasteWater, Water Sci, Technol, 28: 247 (1993).
11. Larren L., and Aamand Degradation ofherbicides in two sandy aquifers underdifferent red ox conditions. 44(2): 231-236(2001).
12. V. Magarde, S.A. Iqbal, N. Iqbal and I.Zaafarany, Orient. J. Chem., 27(2): 703-711(2011).
13. P. Sannasi, S. Salmijah. Orient. J. Chem.,27(2):
14. V. Magarde, S.A. Iqbal, S. Pani and N. Iqbal.Orient. J. Chem. 26(4): 1473-1477 (2010).

Current World Environment Vol. 7(1), 133-138 (2012)
Physicochemical Determination of Pollutants in Wastewater in Dheradun
SACHCHIDA NAND SINGH1, GAURAV SRIVASTAV and ARUN BHATT*
Department of Chemistry S.G.G. ( P.G.) College, Dobhi, Jaunpur - 222 149 (India)Department of Biotechnology G.B. Pantt Engineering College Gurdahuri, Pauri Garhwal, (India).
(Received: April 03, 2012; Accepted: May 13, 2012)
ABSTRACT
Wastewater was collected from the Dheradun industrial area situated in capital of uttrakhand.Samples were collected between the periods of November 2010 to Aug.2011 determine thefollowing parameters, pH, temperature, turbidity, chemical oxygen demand (COD), Biologicaloxygen demand(BOD), dissolved oxygen (DO), conductivity, total dissolved solid (TDS), totalsuspended solid (TSS), sulphate, nitrate, nitrite and phosphate. In addition, metals (copper, cobaltChromium, iron, manganese, magnesium, nickel cadmium, lead, sodium, potassium and calciumwere determined. Levels of pH, conductivity, temperature, nitrate, nitrite, sulphate ,phosphate,TSS, TDS, DO, BOD and COD were higher than the maximum permissible limits set by Bureo ofIndian Standard Delhi. The concentrations of the metals in the wastewater were higher limits set byW.H.O. and the maximum contaminant levels (MCL Thus, the wastewater around the Dheradunindustrial highly polluted. Domestic and industrial waste should be properly disposed and orrecycled. Relevant agencies should make continuous effort to control, regulate and educatepopulace on indiscriminate waste disposal from domestic and industries within the study area.Physicochemical Determination of Pollutants in Wastewater.
Keywords: Physicochemical, Pollutant, Industrial Wastewater, Dheradun.
INTRODUCTION
Heavy metals are present in food in veryminute quantities; the existence is due to their rolein body metabolism, it has been establish thatwhatever is taken as food might cause metabolicdisturbance if it does not contain the permissibleupper and lower limits of heavy metals. Thus, bothdeficiency and excess of essential micro-nutrients(iron, zinc and chromium) may produce undesirableeffects (Konofal et al., 2004; Kocak et al., 2005).Effect of toxic metals on human health and theirinteractions with essential heavy metals mayproduce serious consequences (Abdulla andChmielnicka, 1990).From this viewpoint, metalssuch as iron, lead, chromium, nickel, arsenic andcadmium are considered suitable for studying theimpact of various foods on human health. Arsenicoccurs naturally in food at concentration levels,which are rather essential.
Wastewater discharge from sewage andindustries are major component of water pollution,
Contributing to oxygen demand and nutrientloading of the water bodies, promoting toxic algalblooms and leading to a destabilized aquaticecosystem (Morrison et al, 2001; DWAF and WRC,1995). High or low pH values in a river have beenreported to affect aquatic life and alter toxicity ofother pollutant in one form or the other (DWAF,1996c). Low pH values in a river for examples impairrecreational uses of water and effect aquatic life. Adecrease in pH values could also decrease thesolubility of certain essential element such asselenium, while at the same time low pH increasesthe solubility of many other element such as Al, B,Cu, Cd, Hg, Mn and Fe (DWAF, 1996c).High nitrateconcentrations are frequently encountered intreated wastewater, as a result of ammoniumnitrogen. High nitrate levels in wastewater couldalso contribute to eutrophication effects, particularlyin freshwater (OECD, 1982). Many workers havebeen reported to have potential health risk fromnitrate in drinking water above threshold of 45 mg/l, which may give rise to a condition known asmethaemoglobinemia in infants and pregnant

SINGH et al., Curr. World Environ., Vol. 7(1), 133-138 (2012)
women (Speijer, 1996).Biological oxygen demand(BOD) measure the amount of oxygen requires bybacteria for breaking down to simpler substancesthe decomposable organic matter present in anywater, wastewater or treated effluent. It is also takenas a measure of the concentration of organic matterpresent in any water. The greater the decomposablematter present, the greater the oxygen demand andthe greater the BOD values (Ademoroti, 1996;Standard methods, 1998). Electrical conductivity ofwater is a useful and easy indicator of its salinity ortotal salt content. Wastewater effluents often containhigh amounts of dissolved salts from domesticsewage. High salt concentrations in waste effluentshowever, can increase the salinity of the receivingwater, which may result in adverse ecologicaleffects on aquatic biota (Ademoroti, 1996).Vegetables are staple part of human meals takenas food in raw and cooked forms In view of thecontinues used of wastewater for the irrigation ofvegetable crops in these area of Dheradun, thisstudy is aimed to assess the levels of somephysicochemical parameters in wastewatersamples from the Dheradun .
MATERIALS AND METHOD
Sample area and Sampling PointsWastewater samples were collected from
the Dheradun industrial area for the analysis ofphysicochemical parameters. Measurement pointsfor the sampling were designated as N1 to N4.Wastewater samples were collected at thedischarge point from old ancient walled citydesignated as N1; 200metres away from the ancientwalled city (N2); and at 500metres along the Sabon–Gari discharged point from the ancient walled city(N3); N4 was located at Selaqui Paonta sahib Road.
Sample CollectionWastewater samples were collected in
plastic containers previously cleaned by washingin non-ionic detergent, rinsed with tap water andlater soaked in 10% HNO
3 for 24 hours and finallyrinsed with deionised water prior to usage.
During sampling, sample bottles wererinsed with sampled water three times and thenfilled to the brim at a depth of one meter below thewastewater from each of the four designated
sampling Points (N1 to N4). The samples werelabeled and transported to the laboratory, stored inthe Refrigerator at about 4°C prior to analysis.Wastewater were also collected for Analysis.Samples were collected between the periodsNovember 2010 to Aug.2011
Determination of Physicochemical pollutantindicators
All field meters and equipment werechecked and calibrated according to themanufacturer’s Specifications. The pH meter wascalibrated using HACH (1997) buffers of pH 4.0,7.0 and 10.0. Dissolved oxygen (DO) meter wascalibrated prior to measurement with theappropriate traceable calibration solution (5%HCl)in accordance with the manufacturer’s instruction.The spectrophotometers (HACH DR2010) foranions determination were checked formalfunctioning bypassing standard solutions of allthe parameters to be measured; Blank samples(deionized water) were passed between every threemeasurements of wastewater samples to check forany eventual contamination or abnormal responseof equipment .The dependent variables analyzedwere pH, temperature, dissolved oxygen, totaldissolved solid, nitrate, sulphate, phosphate andheavy metals concentration. Standard methodswere followed in determining the above variables(APHA, 1998). In-situ measurements for some ofthe parameters, pH and temperature (°C) weremeasured using WTW pH Electrode Sen Tix 41.Dissolved oxygen was measured with JenwayModel 9070 waterproof meter. Conductivity /TDSmeter (Hach model C0150) was used to measurethe conductivity and total dissolved solids of thewater samples. The power key and the conductivitykey of the conductivity/TDS meter were switchedon, and the meter was also Temperature adjusted;the instrument was calibrated with 0.001M KCl togive a value of 14.7µS/m at25ºC. The probe wasdipped below the surface of the wastewater andsurface water. Time was allowed for the reading tobe stabilized and reading was recorded. The keywas then changed to TDS key and recorded. Theprobe was thoroughly rinsed with distilled waterafter each measurement. Levels of turbidity and totalsuspended solid of the wastewater samples weredetermined using standard procedures approvedby AOAC (1998).The biological oxygen demand

SINGH et al., Curr. World Environ., Vol. 7(1), 133-138 (2012)
determination of the wastewater samples in mg/l wascarried out using standard methods described byAdemoroti (1996). The dissolved oxygen content wasdetermined before and after incubation. Sampleincubation was for 5 days at 20°C in BOD bottle.
Physicochemical Determination ofPollutants in Wastewater Dheradun Industrialarea.BOD was calculated after the incubationperiods. Determination of chemical oxygen demandwas carried out using closed reflux method asdescribed by Ademoroti (1996).
Digestion of Wastewater Samples for HeavyMetals Determination
The wastewater samples were digestedas follows. The sample, 100cm³ was transferred intoa beaker and 5ml concentrated HNO3 was added.The beaker with the content was placed on a hotplate and evaporated down to about 20ml. Thebeaker was cool and another 5ml concentratedHNO3 was also added. The beaker was coveredwith watch glass and returned to the hot plate. Theheating was continued, and then small portion ofHNO3 was added until the solution appeared lightcoloured and clear. The beaker wall and watch glasswere washed with distilled water and the samplewas filtered to remove any insoluble materials thatcould clog the atomizer. The volume was adjustedto 100cm³ with distilled water (Ademoroti, 1996).Determination of heavy metals in the wastewater
samples was done using Atomic AbsorptionSpectrophotometer (AAS, Unicom 969) asdescribed in the manufacturer’ instruction manual.
Elemental Analysis of Digested SamplesDetermination of heavy metals (copper,
cobalt chromium, iron, manganese, magnesium,nickel Cadmium, and lead) was made directly oneach final solution using Perkin-Elmer Analyst 300Atomic Absorption Spectroscopy (AAS) asdescribed by Floyd and Hezekiah (1997). Flameemission Spectrometer (FES) Gallenkamp(FGA330) was used to determine sodium (Na),potassium (K) and Calcium (Ca).
Determination of Nitrate, Nitrite, Sulphate andPhosphate in the Wastewater Samples
The concentration of nitrate, nitrite,sulphate and phosphate were determined usingDR/2010 HACH Portable Data LoggingSpectrophotometer. The spectrophotometers werechecked for malfunctioning by passing standardsolutions of all the parameters to be measured;blank samples (deionized water) were passedbetween every three measurements of watersamples to check for any eventual contaminationor abnormal response of equipment.
Nitrate as nitrogen was determined by thecadmium reduction metal method 8036[StandardMethods, 1976, DWAF, 1992]. The cadmium metal
Table 1: Concentration of Physicochemical Parameters in wastewater samplesfrom Dheradun Industrial area waste water, Uttrakhand state
Parameters Sampling N1 N2 N3 N4Points
pH 9.94±1.32 8.94±2.03 10.34±1.43 9.54±0.54Temp(°C) 32.34±0.32 31.11±0.11 36.34±2.94 33.34±1.44Turbidity (NTU) 36.33±2.13 34.23±2.32 42.22±3.10 33.34±2.01COD (mg/l) 564.32±5.43 512.45±7.21 698.11±6.45 531.05±9.23BOD (mg/l) 254.11±2.32 223.43±4.23 341.11±4.34 245.22±2.77DO (mg/l) 7.43±0.76 6.22±0.23 8.43±0.56 6.56±0.49TDS (mg/l) 2321.23±33.23 2210.21±22.32 2655.43±16.33 2456.22±18.90TSS (mg/l) 1237.12±12.45 1131.23±14.32 2673.22±17.32 2673.22±17.32Conductivity (µScm-3) 1123.41±10.21 1021.17±14.32 1534.21±12.43 1477.32±14.32Sulphate (mg/l) 172.32±0.83 154.33±1.02 252.21±1.32 212.22±0.77Nitrate (mg/l) 223.21±1.21 211.43±0.34 284.33±1.74 234.56±1.92Phosphate (mg/l) 110.45±0.42 103.23±0.11 164.22±0.56 153.22±0.67

SINGH et al., Curr. World Environ., Vol. 7(1), 133-138 (2012)
in the added reagent reduced all nitrate in thesample to nitrite; while sulphate was determinedby using Sulfa Ver methods 8051 [Standardmethods,1976., DWAF, 1992].126 J.C.Akan, F.I.Abdulrahman, G.A.Dimari and V.O.OgugbuajaThelevels of the physicochemical parameters arepresented in Table 1. From the results of this studythe levels of pH varied between 9.94±1.32 and8.94±2.03 for point N1 and N2, and 10.34±1.43to9.54±0.54 for point N3 and N4 in the wastewaterrespectively. Generally point N3 shows the highestconcentration followed by N1, while point N2 showsthe least concentration. The mean pH valuesrecorded for all the sampling point were above theWHO pH tolerance limit of between 6.00 – 9.00 forwastewater to be discharged into channel intostream with exception of point N2.
Physicochemical Determination ofPollutants in Wastewater along Dheradun Industrialwaste water, Uttrakhand state.
Temperature is basically important for itseffect on other properties of wastewater. Average
Temperature of wastewater underinvestigation is 42.34±0.32ºC for N1; 41.11±0.11ºCfor N2; 46.34 ±2.94 ºC for N3 and 43.34±1.44 ºC forN4. The results indicate that some reactions couldbe speeded up by the discharge of this wastewaterinto stream. It will also reduce solubility of oxygenand amplified odour due to anaerobic reaction (lessoxygen). These values were higher than WHOstandard of 40°C for discharged of wastewater intostream. Similarly turbidity values were in the meanof36.33±2.13NTU for N1; 34.23±2.32NTU for N2;42.22±3.10NTU for N3 and 33.34±2.01NTU forN4.The values obtained for turbidity in the entiresampling points under study were higher than WHOstandard of 5 NTU for discharged of wastewaterinto stream.
The conductivity values were1123.41±10.21 µScm-3 for N1; 1021.17±14.32µScm-3 for N2;1534.21± 12.43µScm-3 for N3 and1477.32±14.32µScm-3 for N4 (Table 1). Conductivityof water which is a useful indicator of its salinity ortotal salt content is high in the wastewater from thedheradun industrial wastewater channel. This resultis not surprising, since wastewater from domestic
sewage often contain high amounts of dissolvedsalts. The mean conductivity values for all thesampling point were higher than the WHO guidelinevalues of 1000µScm-3 for the discharge ofwastewater through channel into stream .The totalsuspended solids (TSS) concentrations were1237.12±12.45 for mg/l N1;1131.23±14.32 mg/l forN2; 2673.22±17.32mg/l for N3 and 2673.22±17.32mg/l for N4 (Table 1).Literature classifiedwastewater TSS as follows: TSS less than 100 mg/l as weak, TSS greater than 100mg/l but less than220 mg/l as medium and TSS greater than 220 mg/l as strong wastewater. Results of the study showthat wastewater from the wastewater channel canbe classified as strong Wastewater and cannot bedischarged into stream.
The mean concentration of Total dissolvedsolid (TDS) in the Dheradun industrial wastewaterchannel wastewater channel are presented in Table1. The concentration of TDS is 2321.23±33.23 mg/l for N1; 2210.21±22.32 mg/l forN2; 2655.43±16.33mg/l for N3 and 2456.22±18.90mg/l for N4. Thesevalues obtained for TDS in all the sampling pointswere higher than WHO standard of 2000 mg/l forthe discharged of wastewater into surface water.The concentrations of nitrate, sulphate andphosphate in all the sampling points variedbetween211.43±0.34 to 284.33±1.74 mg/l fornitrate; 154.33±1.02 to 252.21±1.32 mg/l forsulphate and103.23±0.11 to 164.22±0.56 mg/l forphosphate respectively (Table 1). Highconcentration of nitrate, sulphate and phosphatewere observed in point N3, while lowconcentrations were observed for pointN2. Thelevels of nitrate exceeded the WHO limits of 45mg/l and South Africa guideline of 0.25 mg/l for nitratein wastewater, while sulphate was below the WHOlimit of 250 mg/l for the discharged of waste waterinto river. The levels of phosphate in the entiresampling point were higher than the WHO limit of5mg/l for the discharged of wastewater into river.The levels of nitrate may give rise to128 J.C.Akan,F.I.Abdulrahman, G.A.Dimari and V.O. Ogugbuajamethaemoglobinemia, also the levels of nitratereported in this study in addition to phosphate levelscan cause euro phication and may pose a problemfor other uses. Dissolved oxygen (DO) valuesobtained for point N1 to N2 varied between6.22±0.23 to8.43±0.56 mg/l as shown in Table 1.

SINGH et al., Curr. World Environ., Vol. 7(1), 133-138 (2012)
The DO is a measure of the degree of pollution byorganic matter, the destruction of organicsubstances as well as the self purification capacityof the water body. The standard for sustainingaquatic life is stipulated at 5mg/l a concentrationbelow this value adversely affects aquatic biologicallife, while concentration below 2mg/l may lead todeath for most fishes (Chapman, 1997). The DOlevel at point N1 to N4 was above these levels .Anindication of organic oxygen demand content ofwastewater can be obtained by measuring theamount of oxygen required for its stabilization eitheras BOD and COD. Biological Oxygen demand(BOD) is the measure of the oxygen required bymicroorganisms whilst breaking down organicmatter. While Chemical Oxygen Demand (COD) isthe measure of amount of oxygen required by bothpotassium dichromate and concentrated sulphuricacid to breakdown both organic and inorganicmatters. BOD and COD concentrations of thewastewater were measured, as the two wereimportant in unit process design. The wastewaterhas an average COD concentration of 512.45±7.21to698.11±6.45 mg/l for point N2 to N4 (Table 1).BOD concentration of the wastewater obtained forpoint N1 to N4 ranged between 223.43±4.23 to341.11±4.34 mg/l respectively. The concentrationsof BOD and COD in all the sampling point werehigher than the WHO values of 50 mg/l and 1000mg/l for the discharged of wastewater into stream. HighCOD and BOD concentration observed in the wastewater might be due to the use of chemicals, whichare organic or inorganic that are oxygen Demandin nature .The results for elemental concentrationin wastewater samples from the dheradun industrialwastewater channel wastewater channel fordifferent sampling points are presented in Figure 1.The composition of metals in the wastewater
samples ranged from 2.87 to 5.22 mg/l for Mn; 4.57to 7.45 mg/l Mg; 2.32 to 3.78 mg/l Cu; 1.00 to3.58mg/l Cd; 1.23 to 2.87 mg/l Pb; 2.34 to 5.23 mg/l Co;14.56 to 21.45 mg/l Fe; 1.56 to 4.33 mg/l Cr;11.65to 18.45 mg/l Ni; 20.91 to 32.94 mg/l Na; 19.43 to27.34 mg/l K and 9.56 to 16.93 mg/l Ca for point N1to N4. The concentrations of heavy metals in thewastewater channel are in the following order Na>K> Fe> Ni> Ca> Mg> Co> Mn> Cr> Cu> Cd> Pb.From the result of these study the concentrations ofall the parameters study (Table 1) are in thefollowing order N1>N2<N3>N4.This variation isdue to the fact that point N1 is the discharged pointfrom Bindal bridge and decrease towards point N2.While the high values at point N3 is due to thedischarged of wastewater from Pharma city into theDheradun industrial which might increase theconcentration of these parameters, and finallydecreases toward point N4 due to sedimentationand dilution .Physicochemical Determination ofPollutants in Wastewater along Dheradun Industrialwaste water, Uttrakhand state.
CONCLUSION
From the data collected from this research,the physicochemical parameters monitored in pointN1, N2, N3 and N4 showed high levels of all theparameters. This must be as a result of the nature ofWastewater from the Pharma city and Sara industry.Point N3 showed the highest concentration of thephysicochemical parameter, while point N2 showsthe lowest values. WHO, this high values is due tothe used of untreated wastewater from the industrialarea for the Irrigation of these vegetables.Accordingly, wastewater from all the samplingpoints are polluted as can be observed from theresults obtained.
REFERENCES
1. Abdulla, M. and Chmielnicka, J. New aspectson the distribution on the distribution andMetabolism on essential trace elements afterdietary exposure toxic metals. Biol. Trace-Element Res. 23: 25-53 (1990).
2. Ademoroti, C.M.A. Standard method for waterand Effluents Analysis. Foludex press Ltd,
Ibadan pp. 22-23, 44-54, 111-112 (1996).3. Anikwe, M.A.N. and Nwobodo, K.C.A. Long
term effect of municipal waste disposal onsoil properties and productivity of sites usedfor urban agriculture in Abakaliki, Nigeria.Bioresources Technol. 83: 241-251 (2006).
4. AOAC. Official methods of analysis of the

SINGH et al., Curr. World Environ., Vol. 7(1), 133-138 (2012)
Association of Official Analytical Chemist.Alexandria, VA: Association of OfficialAnalytical Chemists. 432-444 (1998).
5. APHA. Standard methods for theexamination of water and wastewater. 18thEdition. American Public health Association,Washington, DC pp 45-60 (1998).
6.. Chapman, D. Water Quality Assessment. AGuide to the use of Biota, Sediments andwater in Environmental Monitoring. SecondEdition. E& FN Spon, London. File: A//:\Hydrology and Water Quality of LakeMerced.htm (1997).
7. DWAF Analytical Methods Manual, TR 151.Department of Water Affairs and Forestry,Pretoria (1992).
8. DAWF and WRC (1995) South Africa WaterQuality Guideline 1: Domestic water use(2nd edn) Department of Water Affairs andForestry, Pretoria.
9. DWAF, South Africa water quality Guidlines.7: Aquatic Ecosystems (1st Edn) Departmentof water Affairs and forestry, Pretoria (1996c).
10. Floyd, W.B. and Hezekiah .S. Analysis ofcoal ash by atomic absorption spectrometricand spectrophotometric methods. In: Methodfor sampling and inorganic Analysis of Coal.USA. Geological Survey Bulletin 1823Golightly D.W and Simon F.O. (Ed). 1-20(1997).
11. HACH. Water Analysis Handbook, 3rdedition, HACH Company, Loveland,Colorado, USA (1997).
12. Hunt, J. and Turner, M.K. A survey of nitriteconcentrations in retail fresh vegetables.Food Additive and Contaminations. 11(3):327-332 (1994).
13. Kenneth Helrich, Official Method of Analysisof AOAC 5th Edition.AOAC Inc. ArlingtonUSA Pp56-58. 22 (1990).
14. Kocak, S., Tokusoglu, O. and Aycan, S. Someheavy metal and trace essential elementDetection in canned vegetable foodstuffs bydifferential pulse polarography (DPP),Electronic J. Environ. Agric. Food Chem. 4:871-878 (2005).
15. Konofal, E., Lecendreux, M., Arnulf, I. andMouren, M.C. Iron deficiency in children withattention-deficit/hyperactivity disorder. Arch.
Pediatr. Adolesc. Med. 158: 1113-1115(2004).
16. Liu, W.H., Zhao, J.Z., Ouyang, Z. Y., Soderlund,L. and Liu, G.H. Impacts of sewage irrigationon heavy metals distribution andcontamination in Beijing, China. Environ. Int.J. 31: 805-812(2005).
17. Morrison, G. O., Fatoki, O.S and Ekberg, A.Assessment of the impact of point sourcepollution from the Keiskammahoek sewagetreatment plant on the keiskamma river.Water. SA., 27: 475-480 (2001).
18. Muchuweti, M.J., Birkett, J.W., Chinyanga, E.,Zvauya, R., Scrimshaw, M.D., and Lester, J.N. Heavy metal content of vegetablesirrigated with mixture of wastewater andsewage sludge in Zimbabwe: Implicationsfor human health. Agric. Ecosyst. Environ.112: 41-48 (2006).
19. OECD, Eutrophication of waters: Monitoring,Assessment and Control. Technical Report,organization for economic Co operation andDevelopment, Paris (1982).
20. Radojevic,M. and Bashkin, V.N. PracticalEnvironmental Analysis. The Royal Societyof Chemistry, Cambridge pp 466 (1999).
21. Santamaria, P., Elia, A., Serio, F. and Todaro,E. A suevey of nitrate and oxalate content inretail fresh vegetables. J.Sci. Food. Agric. 79:1882-1888 (1999).
22. Sharma, R.K., Agrawal, M., and Marshall, F.Heavy metal contamination of soil andvegetables in suburban areas of Varanasi,India. Ecotoxicol. Environ. Safety. J. Doi:10.1016/jecenv (2007).
23. Speijers, G.J.A. Nitrate in Toxicologicalevaluation of certain foot additive andcontaminats in food, ed, by WHO, FoodAdditive Series 35, Geneva, pp 325-360.
24. Standard Methods. Standard method for theexamination of water and wastewater(14thedn) Jointly published by the AmericanPublic Health Association, America WaterWorks Association and Water PollutionControl Federation, Washington, DC. Pp 68-165 (1996).
28. Zhou, Z.Y., Wang, M.J. and Wang J.S. Nitrateand nitrite contamination in vegetables inchina. Food. Rev. Int. 16: 61-76 (2000).

INTRODUCTION
Fresh Water is essential to existence oflife. Water of acceptable quality is essential notonly for drinking and domestic purposes but alsofor agriculture, industrial and commercial uses.Surface water is collection of water on the groundor in a stream, river, lake, wetland, or ocean. Surfacewater is naturally replenished by precipitation andnaturally lost through discharge to evaporation andsub-surface seepage into the groundwater. A lakeis a large body of water surrounded by land andinhabited by various aquatic life forms. Lakes aresubjected to various natural processes taking placein the environment, such as the hydrological cycle.Due to tremendous population growth of the city(from just over 0.1million in 1951 to about 1.8millions in 2007) and rapid urban development,lakes are facing various environmental problemsresulting in deterioration of its water quality. Thearea of the study selected, to estimate the waterquality and levels of water pollution, is the Shahpuralake of Bhopal city. It is located in the southern partof the city. It is manmade reservoir formed in 1974-75, under the Betwa irrigation project. The wastewater inflow keeps the lake perennial and the overflowing water flows through a nala to join kaliyasot
Current World Environment Vol. 7(1), 139-144 (2012)
Physico-Chemical Studies of Water Quality of ShahpuraLake, Bhopal (M.P) with Special Reference to Pollution
Effects on Ground Water of its Fringe Areas
TRIVEDI SONAL and H. C. KATARIA
Department of Chemistry, Government Geetanjali Girls PG (Autonomus) College, Bhopal (India).
(Received: March 15, 2012; Accepted: April 15, 2012)
ABSTRACT
Indiscriminate and wasteful water consumption and improper waste disposal practiceshave led to deterioration in the water quality be it surface or ground water. Shahpura is an in-landurban surface water body which is fed by Bhopal city waste water and effluent from adjoiningShahpura and Chunabhatti townships thereby converted into a polluted lake. This is a maidenattempt to highlight the spread of polluted surface water into the ground water aquifer which issupports the drinking water supplies to a large population of Bhopal.
Key words: Groundwater, Physico-chemical analysis, Pollution, Sanctuary, Water Quality.
river which flows into river Betwa. Various physico-chemical parameters were studied to assess thewater quality status and the extent of deteriorationin the water quality of lake. The degradation of lakehas occurred not only due to waste water effluentinflow but also by saltation, domestic sewage,immersion of idols and other activities around thelake. Thus the lake is subjected to enormousanthropogenic stress; the overall impact hasresulted in the deterioration of the water quality,accumulation of toxic chemicals and sediments,shrinkage of lake area and above all, loss of theaesthetic value. It is well known that hydrologicenvironment is composed of two interrelatedphases; ground water and surface water. Impactsinitiated in one phase eventually affect the othersystem. The polluted lake water may enter intoaquifer or ground water body of fringe areas,specially the downstream areas by percolation andinfluent seepage. The natural quality of hand pumps,bore wells and drinking water resources tend to bedegraded in the fringe areas of lake. Severalinvestigations and research studies have beenmade on water quality and increasing pollution levelof the water body. They all indicate the alarmingcontamination of the lake which is very high ascompared to the standard guidelines, revealing that

140 TRIVEDI & KATARIA, Curr. World Environ., Vol. 7(1), 139-144 (2012)
nutrient load in the lake is very high andhypereutrophic conditions are prevailing. Henceperiodic monitoring and preventive measures arerequired to save the lake from eutrophication.Although, few work has been done to understand thestatus of the lake, no study has been made on thepollution effects of the lake on the ground water qualityof the adjoining areas. The polluted lake water mayenter into aquifer or ground water body of fringe areasspecially the downstream areas by percolation andinfluent seepage. At least sixty thousand populationresides in the fringe area and is dependent on theground water, moreover the Chunabhatti area actsas a ground water sanctuary for the town as thedrinking water is supplied to the different parts of thecity through the water tankers filled from the tube wellsdaily. Therefore the assessment and monitoring of itswater quality is very important. Hence a serious needis felt for the study of the water quality which couldprove beneficial for the large number of people.
METHODS
To study the water quality status ofShahpura lake, thirteen surface water qualitymonitoring stations were chosen at different pointsof the lake and sixteen ground water qualitymonitoring stations in the fringe area (where sourcewater is mainly ground water) were finalized. Themethods of water analysis were used as prescribedby APHA (American Public Health Association) waterenvironment federation and National EnvironmentEngineering Research Institute (NEERI), Nagpur.Water samples were collected during the winterseason, 2011 from the selected stations. The analysisof the following physico-chemical parameters wascarried out: pH, Electrical Conductivity(EC - µmho/cm), Total Dissolved Solids(TDS - mg/L), Ammonia(mgNH3-N/L), Nitrate (mgN/l), Total Phosphorus(mgP/L), Iron (mg/L), Fluoride (mg/L), ChemicalOxygen Demand (COD - mg/L), Dissolved Oxygen(DO – mg/L ), Total Hardness (T.Hard. - mgCaCO3/L), Calcium (mg/L), Magnesium (mg/L), Chloride(mg/L), Sulphate(mg/L), Carbonate (mg/L),Bicarbonate (mg/L) and Coliforms.
RESULTS AND DISCUSSIONS
The physico-chemical data collected fromdifferent sampling stations Table 1 and 2.
Tab
le 1
: Wat
er q
ual
ity
resu
lts
– S
urf
ace
wat
er s
hah
pu
ra la
ke
Sta
tion
phE
CT
DS
Am
mo
Nit.
Iron
fluor
iTo
t.PC
OD
D O
T.H
ard
. ca
lciu
mag
nes
i ch
lo s
ulp
ha
car
bo
Bic
arb
SW
17.
67
88
44
59.
004.
70.
350.
50.
101
30
4.0
32
067
.036
.08
75
40.
0030
1.8
SW
27.
99
80
58
010
.00
7.6
0.35
1.0
1.00
74
0.8
28
070
.326
.01
08
78
1.8
25
2S
W3
7.5
78
05
00
4.00
5.0
0.18
0.5
1.9
22.0
4.2
27
575
.021
.898
.068
.00.
0024
5.6
SW
48.
28
10
48
80.
124.
00.
220.
91.
008.
03.
62
95
78.4
.22
.49
86
02.
8123
7.1
SW
58.
17
80
50
01.
002.
20.
110.
70.
2025
.25.
24
29
276
.024
.51
02
62
4.13
27
7S
W6
8.2
85
04
69
0.37
8.00
0.20
0.9
0.8
36.0
7.0
29
875
.524
.59
27
70.
002
77
SW
78.
07
50
48
10.
054.
50.
340.
20.
3067
.06.
32
84
71.0
25.8
82
35
2.6
290.
0S
W8
8.3
65
53
69
1.00
2.4
0.23
0.1
0.5
14.0
6.0
22
049
.021
.46
95
44.
1517
5.5
SW
98.
07
40
47
40.
055.
50.
150.
200.
541
.05.
02
90
73.6
27.2
87
61
3.5
276.
7S
W10
8.1
72
04
61
2.00
4.0
0.15
0.10
.0.
2012
.05.
52
30
73.2
10.7
85
67
3.83
204.
1S
W11
8.4
78
05
01
0.05
5.2
0.15
0.4
1.00
26.0
4.00
28
072
.222
.48
24
67.
925
9.9
SW
128.
38
78
49
90.
055.
00.
130.
50.
4024
.05.
52
90
73.0
26.2
10
45
58.
1627
4.0
SW
138.
47
65
49
00.
055.
10.
150.
40.
522
.05.
42
73
79.2
19..4
10
64
96.
1325
9.2
All
the
surf
ace
wat
er s
ampl
es s
how
ed p
ositi
ve t
ests
for
mic
roor
gani
sms
(Col
iform
s).

141TRIVEDI & KATARIA, Curr. World Environ., Vol. 7(1), 139-144 (2012)
Tab
le 2
: W
ater
Qu
alit
y re
sult
s - G
rou
nd
wat
er o
f fri
ng
e ar
ea
Sta
tio
pH
EC
TD
SN
itr
Tota
lPIr
onFl
uori
CO
DT.
Har
Cal
ciu
Mag
nC
hl
Sul
Ch
lB
icar
T c
oli.
GW
18.
38
40
53
810
.10.
000.
040
0.43
32.2
38
710
4.5
30.0
80
33
14.4
318.
4+
veG
W2
8.2
80
44
52
4.1
0.20
0.35
00.
261.
23
12
80.5
26.7
72
52
5.4
290.
5-v
eG
W3
8.0
81
65
12
4.9
0.17
0.35
00.
886.
02
98
80.0
23.5
80
66
0.00
346.
5-v
eG
W4
8.3
79
25
07
0.2
0.10
0.16
00.
7822
.03
93
76.0
49.0
88
74
12.2
031
4.3
-ve
GW
58.
41
25
07
36
3.8
0.00
0.29
20.
161.
23
90
113.
636
.21
54
12
410
.533
9.5
+ve
GW
68.
28
40
48
02.
50.
000.
150
0.43
24.0
31
267
.035
.08
45
05.
027
4.7
-ve
GW
77.
76
70
42
92.
50.
100.
132
0.18
1.0
30
470
.431
.16
24
51.
4925
0.5
-ve
GW
88.
37
14
42
91.
00.
200.
070
0.52
1.0
32
270
.435
.58
83
34.
2028
1.7
+ve
GW
98.
09
40
60
24.
20.
000.
050
0.22
22.0
36
295
.030
.11
18
58
0.00
385.
4+
veG
W10
8.3
63
84
08
4.9
0.90
0.04
00.
3139
.93
22
89.6
23.8
37
43
5.41
288.
5+
veG
W11
8.0
58
63
28
0.9
0.20
0.11
00.
3838
.41
86
41.6
19.9
68
29
3.09
164.
8+
veG
W12
7.8
84
55
46
2.7
0.00
0.03
00.
002.
63
58
108.
820
.97
28
60.
0036
1.1
+ve
GW
137.
87
45
47
71.
70.
000.
156
0.32
7.1
26
258
.428
.21
08
82
1.38
32.5
+ve
GW
148.
31
02
06
53
6.2
0.10
0.12
60.
414.
84
68
104.
850
.01
42
45
5.80
459.
2-v
eG
W15
8.3
82
45
28
7.6
0.10
0.12
70.
481.
04
24
120.
030
.16
24
514
.69
343.
5-v
eG
W16
8.4
66
64
27
8.4
0.00
0.13
50.
221.
02
40
68.0
41.3
36
34
4.29
287.
5-v
e

142 TRIVEDI & KATARIA, Curr. World Environ., Vol. 7(1), 139-144 (2012)
Fig. 1: Description of sampling stations
Sampling stations - Surface water of Shahpura lake
S.NO Sampling Location
station1 SW1 Main untreated kotra drainage(Source water ,upstream of lake)2 SW2 Confluence point of drainage nalla from charimli area behind PCB3 SW3 Near Dhobighaat behind PCB(high algal growth)4 SW4 Near slum area Infront of academy of administration(slum area)5 SW5 Near Shahpura park6 SW6 Confluence of shahpura sewage nala7 SW7 Near Waste weir(outlet)8 SW8 The shahpura lake(near fishing point)9 SW9 Near amrapali Residential colony10 SW10 Near hanuman temple (downstream of waste weir)11 SW11 Near Earthen bund(Downstream of lake)12 SW12 earthern dam(near Sluice gate)13 SW13 waste weir Nalla downstream of lake ,near canalSampling stations - fringe areas of the Shahpura lake1 GW1 Tubewell of BSNL premises (upstream of lake)2 GW2 Tubewell of NCHSE premises (upstream of lake)3 GW3 Behind PCB (upstream of lake)4 GW4 Building upstream catchment area (eastern side of lake)5 GW5 Tubewell of rainbow treat restaurant, MP tourism, Manisha market6 GW6 Shallow dugwell (near waste weir, downstream of earthen dam)7 GW7 Tubewell, C- sector, shahpura8 GW8 Tubewell, Kashish restaurant, Kolar road9 GW9 Sardarji Tube well, chunna bhatti (100m from SW-11)10 GW10 Dugwell , Jugal kishore, chuna bhatti village11 GW11 Tubewell, Jugal kishore, Chunabhatti village12 GW12 Tubewell,aranyawali colony ,800m from SW-11(fringe area)13 GW13 Tube well amaltas phase I(100m from SW-12)downstream14 GW14 Tubewell,amaltas phase I-(250m from SW-12)downstream15 GW15 Tubewell amaltas phase II (500m fromSW-11)fringe area16 GW16 Tubewell,,new friends colony(near canal ,,chunabhattt II)

143TRIVEDI & KATARIA, Curr. World Environ., Vol. 7(1), 139-144 (2012)
pHpH range of 6.5 to 8.5 is normally accepted
as per guideline suggested by WHO. In this studypH values were found in the range of 7.5 to 8.5 inthe water samples. This shows that pH wasobserved to be slightly alkaline. Higher pH favorsthe fish production in reservoir. Electr icalconductivity- Higher the concentration of acid, baseand salts in water, a higher will be the EC. In thisstudy the value of EC was found above themaximum permissible limit of 500µmho/cm, indrinking waters as recommended by WHO. Totaldissolved solids- It is an important parameter indrinking water quality standard. It develops aparticular taste to the water and at higherconcentration reduces its potability Water with morethan 500mg/l TDS usually has a disagreeably strongtaste. High TDS levels generally indicate hard water,which can cause scale buildup in pipes, valves andfilters..Similar high TDS values were found inground water layers of Bhanpur ,Bhopal by ManishaSonel et al.TDS values in all the samples was foundabove the WHO permissible limit of 200mg/l .It canbe concluded that water is hard at these locations,which necessitates the softening of water prior toits use. In this study The groundwater samples haveshown higher values of hardness. Dissolvedoxygen and COD-maximum permissible limit forDO as per WHO is 4.6-6.0mg/l it was found withinthe admissible limit in all the water samples. In thepresent study high COD values were found whichdepicts the pollution of water source due to pollutantsof organic origin. Nitrate and Phosphate. The worldhealth organization(WHO) has recommended thelimit of 10mg/l nitrate nitrogen(NO3-N) for drinkingwater which is equivalent to about 45mg/l of nitrate(N03)and the same is also accepted in India by theICMR In a previous study, by Dixit S., et al., the lakewas found to be highly eutrophic. The Phosphatecontent of the lake water studied was found in therange of 6.05 to 9.21 ppm. The Nitrate content ofthe water was found in the range 2.02 to 15.22ppm.Sharp rise in nitrate content was found from 2003to 2004, showing the increasing anthropogenicinfluence on the lake. The raw sewage is the sourceof nitrates and phosphates in the water. The UnitedStates Public Health Standards limit for phosphatesin drinking water is 0.1ppm(De,2002,p.p231-232).The phosphate content in the lake water is alarming
and very high as compared to the standardguidelines, which reveals that nutrient load in thelake is very high and hypereutrophic conditions areprevailing Fluoride, Chloride and Sulphate. Thevalue of 0.8 to1.0mg/l of F has been recommendedby WHO (1970.) Values in all the sample was foundin the permissible range. It was observed that thechloride and sulphate concentration in all thesamples collected was below the recommendedconcentration of 250mg/l and150mg/l respectively.
CONCLUSION
In general the surface water of shahpuralake has shown lesser values of the parameterspH, total hardness, EC, TDS in comparison to thegroundwater samples. However, the nitrates andmicroorganisms (coliform bacteria) showed veryhigh values in lake water. Studies carried out inpresent investigation revealed that one of the mostimportant causes of water pollution is unplannedurban development without adequate attention tosuitable management of sewage and wastematerial. It is summarized that propagation ofpollution front in groundwater aquifer of the fringearea of Shahpura Lake is governed by the hydraulicgradient enhancing influent seepage fromShahpura Lake. The alarm bell therefore rings atthe doorstep with the fear of polluting theChunaBhatti groundwater sanctuary whichsupports tens of hundreds of water takers from thetube wells of the fringe area of Shahpura lake forwater supply in different parts of Bhopal city. Alsothe entire population of ChunaBhatti Townshipdepends on the water supply from Tubewells/Borewells. It is therefore, recommended that thisgroundwater supply from Tube wells should be usedas drinking water only after pre-treatment. It mayalso not be out of context that all the in-lets of cityeffluents/waste water should be suitably treatedbefore flowing into Shahpura lake.
ACKNOWLEDGEMENT
I am grateful and indebted to chemists ofGround water survey, water quality Laboratory,Kolar road, Bhopal for providing lab facilities andguidance time to time.

144 TRIVEDI & KATARIA, Curr. World Environ., Vol. 7(1), 139-144 (2012)
1. Adholia,U.N., Studies on hydrology of riverBetwa and its fishery resources. PhDThesis,vikram university, Ujjain (1981).
2. APHA.Standard method for examination ofwater and waste water American publichealth association, Washington.D.C. (1989)
3. Dixit.S and Tiwari.S. Impact assessment ofHeavy metal pollution of Shahpura lake,Bioline international-International Journal ofEnvironmental research, university ofTehran, 2(1): 37-42 (2008).
4. Dixit Savita, Gupta S.K, Tiwari Suchi.,Nutrientoverloading of fresh water lake of Bpl. India.,EGJ-Electronic green Journal, 1(21) UCLALibrary, UC Los Angeles (2005).
5. Dhote Savita. Role of macrophytes inimproving water quality of an aquaticecosystem,shahpura lake,Bpl. J. Applied.Science. Envion. Manageme. 2(4):133-135(2005)
6. Jain.S.K,et al ,Assessment of quality ofground water pollution arising from varioussources. Journal of Indian water resourcessociety. 28(3): 9-13 (2008).
7. H a n d a . B . K . W a t e r , G r o u n d w a t e rcontamination in India,. National workshopon Environmental aspects of groundwaterdevelopment, Kurukshetra, India., (1994).
8. Kataria,H.C.et al., Studies of water quality ofDahod dam, India, Poll Res.,25(3): 553-556(2006).
REFERENCES
9. Kataria,H.C., A biochemical analysis ofdrinking water of Raisen district (M.P). Asian.J. Chem. Revs. 5(1-2): 66-68 (1994).
10. Kudesia V.P. Water pollution, Pragatiprakashan, Meerut, (1995).
11. Lunkad.s.k,Kurukshetra university,Risingnitrite levels in ground water and increasingN-fertilizer consumption,BHU-JAL news,journal of CGWB, 9(1): 4-10 (1994).
12. Manisha Sonel,et al ,Physico-chemical andbacteriological studies of ground waterlayers in Bhanpur, Bhopal(M.P).,CurrentWorld Environment, 5(2): 379-382 (2010)
13. Nayar Renu and Tiwari Deepak. Studies onthe physico-chemical characteristics ofground water of korba. Current worldEnvironment.J., 3(1): 175-180(2008)
14. NEERI, Manual on water and waste wateranalysis. National EnvironmentalEngineering Resources Institute, Nagpur.340 (1986).
15. Savita Dixit and suchi Tiwari,Effect ofreligious practices on water quality ofShahpura Lake, M.P, India, WaterInternational., 32(1): 889-893 (2007)Available online-24 feb 2011.
16. Anoop-Chandra, P.N. Saxena, SayeidaGhazala Imam and Geetesh Chandra,Orient. J. Chem. 27(3): 1193-1198 (2011).
17. Abdul Rahim and Syed Hussain, Orient. J.Chem. 27(3): 1273-1275 (2011).

INTRODUCTION
A pesticide is a chemical substance usedfor preventing, destroying, repelling or mitigating apest, which can be an insect; rodent, bind, weed orfungus, as well as micro organism like bacteria andviruses. Pesticides can be broadly classified asinsecticides, herbicides, fungicides, rodenticides,and antimicrobials, with many subclasses. Themajor insecticide groups are the organochlorines,organophosphates, carbonates and pyrethroids.Pesticides are considered hazardous chemicalsand improved the regulation of pesticidesparticularly in developed countries, a health riskremains. Both the potency of primary factor affectingthe level of risk.
The use of pesticides provided animportant socioeconomic benefit to the areas ofagriculture and food productions. Pesticideproduction is market driven with high investment inindustrialized countries. In the U.S, 77% of allpesticides are used. In developing countries, publichealth programs represent an important use ofpesticides in the control of vector borne diseaseslike malaria. Countries in Africa, Asia and central
Current World Environment Vol. 7(1), 145-150 (2012)
Analysis of Pesticide Residues in Winter Fruits
RAVI KANT KANNAUJIA*, CHITRA GUPTA, FAROOQ WANI and ROHIT VERMA
Department of Chemistry , Budelkhand University Jhansi - 284 128 (India).
(Received: May 08, 2012; Accepted: June 20, 2012)
ABSTRACT
Fruit samples of winter fruits (apple, grapes, banana cheeku, papaya, lemon) forpesticideresidues employing a multiresidue analysis by gas liquid chromatography.All the fruitsamples showed the presence of residues with one or other group of pesticides.Some samplesexceeded the quantification limit.The increasing interest in the pesticides in fruit samples is justifiedfrom the enological point of view.In this paper pesticide mobility on fruit samples was studied.Outof nine pesticides tested for most of the sample show very high levels of malathion ,while otherpesticides residues are with in the established tolerance,BHC endosulphan dieldrin are with inlimits.thus consumer intake of pesticides from fruit samples studied in this work should be reducedbywashing fruits with water .In this paper multiresidue determination of pesticides are discussedusing GLC.HNMR.IR.
Key words: Pesticides GLC HNMR IR fruits residues.
South America are highly dependent on pesticides.Other areas in which pesticides are used includeforestry, gardening and lawn care horticulture andlivestock and to a large extent domestic use in home.In the U.S pesticides are used in around 70 millionhomes. Usage of OCP’s have been prohibited inmost of countries, but 70% of banned pesticideslow cost, in India DDT was banned for use inagriculture in 1985, but still 7500 metric tons peryear is used here.
The problems of pesticides residues incrops has been attracting growing attention the useof organic insecticides for the control of insect oncrops has become common during the past fewyears.
The detection and identification ofpesticides in our environment is a problem ofincreasing public interest.
Pesticides residues in food has become aconsumer safety issue. The consumer has a right toknow how much pesticide gets in corporate in thefood he eats. At many laboratories expandedresearch programmers have been instituted to
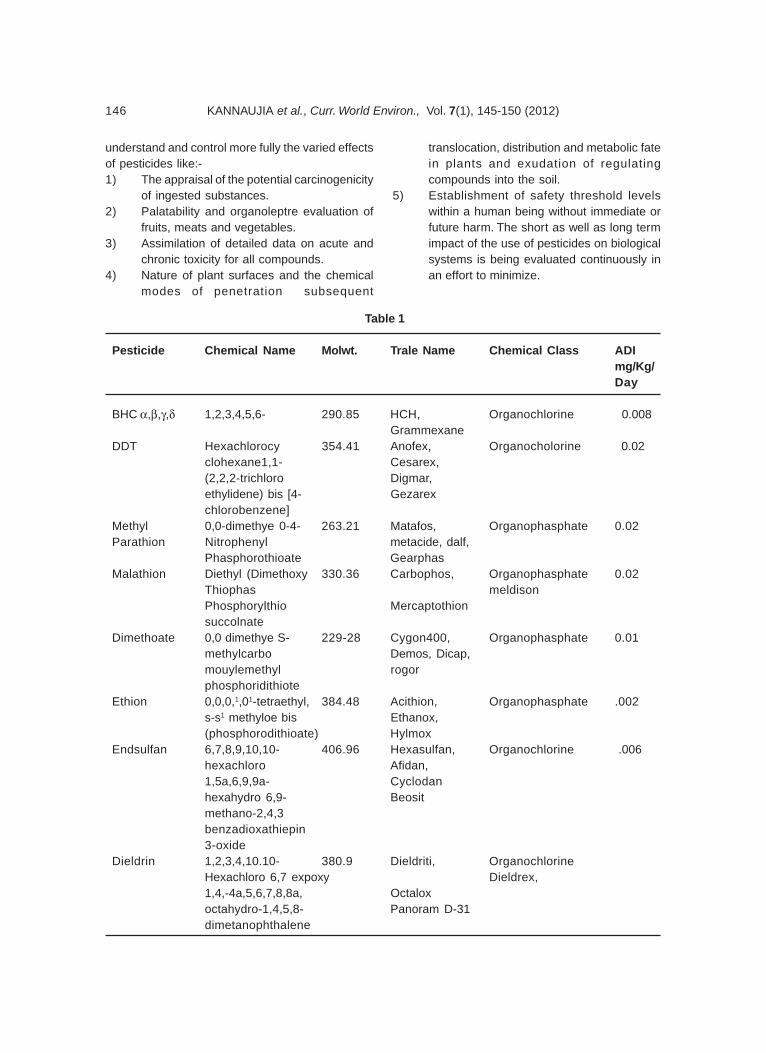
146 KANNAUJIA et al., Curr. World Environ., Vol. 7(1), 145-150 (2012)
understand and control more fully the varied effectsof pesticides like:-1) The appraisal of the potential carcinogenicity
of ingested substances.2) Palatability and organoleptre evaluation of
fruits, meats and vegetables.3) Assimilation of detailed data on acute and
chronic toxicity for all compounds.4) Nature of plant surfaces and the chemical
modes of penetration subsequent
translocation, distribution and metabolic fatein plants and exudation of regulatingcompounds into the soil.
5) Establishment of safety threshold levelswithin a human being without immediate orfuture harm. The short as well as long termimpact of the use of pesticides on biologicalsystems is being evaluated continuously inan effort to minimize.
Table 1
Pesticide Chemical Name Molwt. Trale Name Chemical Class ADImg/Kg/Day
BHC α,β,γ,δ 1,2,3,4,5,6- 290.85 HCH, Organochlorine 0.008Grammexane
DDT Hexachlorocy 354.41 Anofex, Organocholorine 0.02clohexane1,1- Cesarex,(2,2,2-trichloro Digmar,ethylidene) bis [4- Gezarexchlorobenzene]
Methyl 0,0-dimethye 0-4- 263.21 Matafos, Organophasphate 0.02Parathion Nitrophenyl metacide, dalf,
Phasphorothioate GearphasMalathion Diethyl (Dimethoxy 330.36 Carbophos, Organophasphate 0.02
Thiophas meldisonPhosphorylthio Mercaptothionsuccolnate
Dimethoate 0,0 dimethye S- 229-28 Cygon400, Organophasphate 0.01methylcarbo Demos, Dicap,mouylemethyl rogorphosphoridithiote
Ethion 0,0,0,1,01-tetraethyl, 384.48 Acithion, Organophasphate .002s-s1 methyloe bis Ethanox,(phosphorodithioate) Hylmox
Endsulfan 6,7,8,9,10,10- 406.96 Hexasulfan, Organochlorine .006hexachloro Afidan,1,5a,6,9,9a- Cyclodanhexahydro 6,9- Beositmethano-2,4,3benzadioxathiepin3-oxide
Dieldrin 1,2,3,4,10.10- 380.9 Dieldriti, OrganochlorineHexachloro 6,7 expoxy Dieldrex,1,4,-4a,5,6,7,8,8a, Octaloxoctahydro-1,4,5,8- Panoram D-31dimetanophthalene

147KANNAUJIA et al., Curr. World Environ., Vol. 7(1), 145-150 (2012)
Table 2: Pesticide residues, in water fruits mg/Kg.
Sample αααααBHC βββββ and dimetha δδδδδ BHC Methyl Malathion Endsuffan DDTDieldrinγγγγγ BHC noate Parathion
Apple - 0.05 - - - 2.46 - - -Pomegranate - 0.01 - - - 1.70 - --Black grapes 0.02 0.03 - 0.02 - 2.37 0.02Green Grapes - - 0.01 - - 3.05 0.10 -0.01Banana - - - - - 1.03Papaya 0.01 - 0.02 - - 4.190.01Cheeku - - 0.01 - 4.34 0.01Coconut 0.03 - 3.25Lemon - 5.66 0.31 0.01
Potential or latent hazards whilemaximizing the benefits derived by marking formincreased agricultural production andcommunicable disease eradication.
The use of pesticides has not permittedthe control of diseases transmitted by insects butalso has led to increased food production and betterhealth.
EXPERIMENTAL
Selection of fruit samples were based ontheir availability in winter. The samples werepurchased in Jhansi. The fruits sold here are boughtfrom the near bus stand in Jhansi. The fruit sampleswas analyzed in the form, that is offered to theconsumer. For example apple, Cheeku, Papayaand grapes were analyzed with peels whereasbanana, pomegranate and coconut were analyzedwithout peels. Lemon was analyzed with peals as itis used in making pickles in the form each samplesize taken 1 kg out of which a representativesubstance weighting 20gram was randomly takenand the pesticides were extracted for 8-10 hr at therate (4-5) cycles per hr, in hexane in a soxheltextractors. The rotary evaporators. The concentratecontained aqueous as well as organic residue.
The organic part was extracted in hexanewith the help of a separating funnel and a pinch of
sodium sulphate was added to it. The solution thusobtained was filtered and concentrated again. Tothis 5 ml of hexane was added and the sample thusprepared was analyzed for the presence of 9pesticides by gas chromatograph (Perkin Elmer-Auto system XL) with the selective electron-capturedetector (ECD). This detector allows the detectionof contaminants at trace level concentration in thelower ppm range in the presence of multitude ofcompounds extracted from the matrix to which thesedetectors do not resend. The column used was PE-17, length 30m. ID 0.25 film 0.25 mm with a 2 ml/min flow. The carrier gas and the make up gas wasnitrogen employing the splitting mode. The oventemperature was kept at 190-2800C with a ramp of50c/min. The lam plies were calibrated (retentiontime, are a count) against a 10 ppm standard mixedsolution of all 9 pesticides. Each peak ischaracterized by its retention time and the responsefactor in ECD. Sample results were quantitated inppm automatically by the GC software.
One GC injection (30 min) was requiredin order to cover all 9 pesticides included in aanalysis. Hamilton micro syringes injection of thepesticide dissolved in hexane as solvent weremade directly onto the coated silanized columnsolid support, there by eliminating the possibility ofcatalytic degradation by metallic surfaces.Pesticides were identified according to theirretention time. For accurate result the concentration

148 KANNAUJIA et al., Curr. World Environ., Vol. 7(1), 145-150 (2012)
of the standard was kept same. The multiresiduemethod which can detect all 9 pesticides in oneanalytical run was preffered. This method ischaracterized by a broad scope of application goodrecoveries and sensitivity and low solventconsumption, coupled with good analytical qualitycontrol. The presence of marathon, DDE in therespective sample were further confirmed by HNMR(Joel, 400 MHZ) and IR (Bruker) Spectral studies.HNMR and IR spectra of the standard pesticidewas taken separately and compared with that ofthe sample containing those particular pesticides.
The study including the following parametersFruit sample, place of origin, Methods used
and Pesticides tested for Table 1 andconcentrations found for each pesticides table 2.Where the No. of Pesticides-1) a BHC2) g and b BHC3) Dimethanoate4) Methyl Parathion5) Malathion6) Endosulphama7) DDE8) Dieldrin
9) Ethion10) DDT
CONCLUSION
The high levels of malathion is alarming.We have analyzed for only 9 pesticides where asthe presence of many others can not be ignored.Out of necessity the field of residue analyticalchemistry has emerged as a devoted specificallyto the determination of sub microgram concentrationlevels of pesticides to confirm the toleranceestablished by law for pesticides in or onagricultural forage and food crops and animalproducts. The area associated with the nature,persistence and concentration level of pesticidesresidues on produce need to be critically examinedby academic, industrial and government agenciesto ensure man’s future well being.
ACKNOWLEDGMENTS
Authors are thankful to Dr. RekhaLagarkha (Co-ordinator), Department of ChemistryBundelkhand University, Jhansi for providing thenecessary fulfill facilities.
1. Agency for Toxic substance and DiseaseRegistry (ATSDR). Toxicological profile forHCB Atlanta, GA USA: U.S Department ofHealth and Human Services, Public HealthService, ATSDR, (1997).
2. Agency for Toxicsubstance and DiseaseRegistry (ATSDR). Toxicological profile forHCB. Atlanta, GA, USA: US department ofHealth and Human services, Public HealthService, A TSDR, (2002).
3. Agnihotri N.P Dewan RS Dixit A.K Residuof insecticides in food commodities in foodcommodities from Delhi. 1. Vegetables.Indian J. Entromal 36: 160-162 (1974).
4. American Cancer Society. Cancer facts andfigures. Available at Bailey RE. GlobalHexachlorobenzene emissionschemosphere, 2001; 43: 167-82 (2003).
5. Ballschmitter K, Wittlinger R.interhemispheric exchange of
REFERENCES
h e x a c h l o r o c y c l o h e x a n e s ,Hexachlorobenzene, polychlorobiphenyls,and 1,1,1,-trichloro 2,2-bis (pchlorophenyl)ethane in the lower troposphere environ Sci.Technol., 25: 1103-1(1991).
6. Barber J. Sweetman A, Jones KHexachlorbenzene, sources, environmentalfate and risk characterization. Euro Chlor.
7. Barkatina E.N., and Zastenskaya I.A organochlorine pesticides and polychlorinatedbiphenyls in fish and fish products consumedby the poplutation of the republic of Belarus.
8. Benazon N. Hexachlorobenzene emission /releases inventory for Ontario 1988, 1998and 2000., Draft Report for environmentCanada, (1999).
9. Bounias M. Etilogical factors and mechanisminolved in relation ships between pesticideexposure and cancer., J environ Biol, 24(2003).

149KANNAUJIA et al., Curr. World Environ., Vol. 7(1), 145-150 (2012)
10. Braune BM. Norstorm RJ. Dynamics oforgano chlorine compounds in hearing gulls.III: tissue distribution and bioaccumulationin Lake Ontario gulls. Environ Toxicol Chem.9; 8: 957-68 (1989).
11. Brook G. Hunt G. Source assessment forhexachlorobenzene Radian corporation,final report prepared for the U.S. EPA,Research Traingel Park. NC, USA, (1984).
12. Budavari S, ed. Merck Index: Anencyclopedia of chemicals, drugs, andbiological, 11th edition. Rahway, NJ, USA:Merck & Co, Inc, (1989).
13. Burns JE, Miller FM, Gomes E, Albert R:hexachlorobenzene exposure fromcontaminated DCPA in vegetablesspraymen. Arch Environ Health, 29: 192-4(1974).
14. Cohen M, Commoner B, Eisl H, Bartlett P,Dickar. A, Hill C, et al. Quantitative estimationof the entry of dioxins, furans andHexachlorobenzene into the Creat Lakesfrom, airborne and waterborne sources. May,In: Deposition of Air pollutants to the GreatWaters-3rd Report to Congress. Office of AirQuality planning and standards. ResearchTriangle Park, NC, USA: U.S EPA, (1985).(Cited in/4/)
15. Companhia de Technologia e SanementoBasico de Sao Paulo (Sao Paulo StateCompany for Sanitation and technology)CETESB (2001).
16. Compendium of common pesticide names.Classified list of pesticides.
17. Currier MF, Mc claims CD, Barna-Lloyd G.Hexachlorobenzene blood levels and thehealth status of men in the manufacture ofchlorinated solvents. J Toxicol Health 6: 367-77 (1980).
18. Davis DL, Bradlow HL can environmentalestogens cause breast cancer? Sci am , 243(1995).
19. Dellinger B; Taylor PH; Tirey DA.Minimization and control of hazardouscombustion biproducts, cincinnati, OH, USA:U.S. Environmental Protection Agency, RiskReduction Laboratary (EPA 600/S2-90/039),(1991).
20. Deutscher RL, Cathro KJ. Organochlorineformation in magnesium electrowinning cells
chemosphere; 43:147-55 (2001).21. Dr. L martin Jerry WHO collaborating Center
for Cancer Control Calgary, Canada Cancer:A global concern. The epidemiology ofcancer.
22. Ecobichon DJ. Toxic effect of pesticides in;Klassen DC, Doull J, eds. Casarett anddoull’s tozicology; the basic science ofpoisons. 5th Edition, New york, NY USA; McGraw-Hill, 689 (1996).
23. Ecobichon DJ. Toxic effects of pesticides. In :Klassen CD, Doull J, eds. Casaett and Doull’stoxicology. The Basic of Poisons. 5th Edition.New York, NY, USA: McGraw-Hill., 643- 689(1996).
24. FAO/WHO, joint FAO/WHO food standardsprogramme. Codex maximum limits forpesticide residue. Vol. XIII. 2nd ed Romeltaly ,(1986).
25. Food and Agriculuture Organization /Worldhealth organization. Hexachlorobenzeneevalution session of the codex committeeon pesticide residues (JMPR), (1970).
26. Government of Canada.Hexachlorobenzene. Priority substance listassessment report. Canadian EnvironmentalProtection Act,(1993).
27. Grimalt JO, Sunyer J. Moreno V.. Amaral OC,Sala M, Rosell A, et al. Risk excess of son-tissue sarcoma and thyroid cancer in acommunity exposed to airborneorganochlorinated compound mixtures witha high hexachlorobenzen content. Int JCancer 1994: 56 (2003).
28. Gullett BK, Touati A, Hays MD. PCDD/F, PCB.HxCBZ, and PM emission factors for fireplaceand wood stove combustion in the San.1996 Francisco Bay Region. Environ Sci.technol 37: 1758-65 (2003).
29. IARC’s mission cancer research for cancercontrol available at Information from thewebsite the pesticide managementeducation programmes (PMPS) at edu/profiles/inse………amphus/).
30. International program on chemical Safety(IPCS). Hexachlorobenzene EnvironmentalHealth Criteria 195. Geneva, CH: WHO(1997).
31. International Register of potentially Toxicchemicals (I RPTC). Treatment and disposal

150 KANNAUJIA et al., Curr. World Environ., Vol. 7(1), 145-150 (2012)
methods for waste chemicals. Geneva, CH:IRPTC, United Nations EnvironmentProgram 985: 102.
32. Jaga K. what are the implications of the
interactions between DDT and estrogenreceptors in the body? Med hypotheses(2002).

INTRODUCTION
From the literature survey it is known thatno investigation has been done on the quality ofunderground water in Chalisgaon Taluka of JalgaonDistrict of Maharashtra State. Seven villages areselected for this study situated in North - East of theJalgaon district on the right bank of Girna river at adistance of 12 Kms from Chalisgaon town on statehighway No. 211. The area under investigation is anotable cotton, sugarcane & banana producingcentres and all the crop fields of this area are beingirrigated by Girna right canal surface water andunderground water as per availability of waterresources Generally double and at some places
Current World Environment Vol. 7(1), 151-156 (2012)
Seasonal Variation in Ground Water Quality atNorth Zone of Chalisgaon Taluka, Dist. Jalgaon (Maharashtra)
P.J. PARMAR
Department of Chemistry, Nanasaheb Y.N.Chavan College, Chalisgaon - 424 101 (India).
(Received: May 20, 2012; Accepted: June 27, 2012)
ABSTRACT
This study deals with assessement of Physico - Chemical Characterisations of groundwater around Chalisgaon Taluka of Jalgaon district in Maharashtra. The study has been carriedout to examine its suitability for drinking, irrigation and industrial purpose. Rapid urbanizationwhich caused ground water pollution has affected the availability and quality of ground water dueto its over exploitation and improper waste disposal. Groundwater pollution caused by humanactivities like runoff fertilizers, pesticides used in agricultural field, release of industrial wastewater, percolation of surface water etc.
In the present study, attempts were made to investigate some Physico - ChemicalParameters of groundwater samples collected from seven wells at a distance of five to ten kmsalong north side of right Girna canal and Girna river from different locations of seven villages ofChalisgaon Taluka were studied in the span of June 2010 to Feb. 2012. The parameters pHstudied includes temperature, electrical conductivity, total alkalinity, total hardess, calcium,magnessium, chloride, free CO2 total dissolved solid, dissolved oxygen. The study was carriedout in each season for two consecutive years. The range of pH was found to be 7.45 to 9.19 whichindicates that the water is alkaline. Other parameters are in the normal range but show variationsdrastically with the change in season. Detail variation in the range of values of parameters andpossible causes are discussed. In case of underground water it was found that, conductivity,alkalinity and hardness were high and much over the permissible limits. The effect of long termcontinuous extensive irrigation by underground water and application of increasing amount ofchemical fertilizers and insecticides over years on water and soil quality on this area have beendiscussed.
Key Words: Physico-Chemical Characters, Underground water,Well water and Canal water.
triple cropping are possible due to adequateirrigation facility for certain crops. The people ofthis locality reported that, for increasing the yield,the application of fertilizers and pesticides is alsoincreasing since last 15 years, but the yield is notsatisfactory and thus deterioration of undergroundwater quality can not be ruled out. Hence presentstudy has been under taken in order to assess theunderground water quality of these villeges nearthe girna right canal.
EXPERIMENTAL
Seven villages of Chalisgaon blocks onthe sides of Girna (right) canal and Girna river are

152 PARMAR, Curr. World Environ., Vol. 7(1), 151-156 (2012)Ta
ble
1:
Sea
son
al V
aria
tio
n in
the
un
der
gro
un
d w
ater
qu
alit
y at
No
rth
sid
e G
irn
a C
anal
(Rig
ht)
, C
hal
isg
aon
Tal
uka
Dis
t. Ja
lgao
n, M
ahar
ash
tra
Sta
te J
un
e 20
10 to
Feb
. 201
1.
S.
Par
amet
erR
ainy
Sea
son
Win
ter S
easo
nS
umm
er S
easo
nM
in.
Max
.N
o.S
amp
le S
tatio
nS
amp
le S
tatio
nS
amp
le S
tatio
n
12
34
56
71
23
45
67
12
34
56
7
1.
Tem
pera
ture
26.2
26.4
26.0
26.6
26.3
26.8
27.5
27.0
27.1
27.2
27.0
27.0
26.9
27.1
28.6
28.8
28.7
28.8
28.7
28.9
28.9
26.0
28.9
2.
PH8.
428.
258.
568.
228.
318.
238.
498.
177.
457.
487.
57.
627.
547.
579.
129.
199.
138.
948.
988.
779.
157.
459.
193
.C
ondu
ctiv
ity17
0015
0011
0018
0016
0018
0014
0012
011
013
010
014
011
014
015
013
014
012
010
012
011
010
018
004
.To
tal D
isso
lved
Sol
ids
800
700
700
800
700
700
800
200
500
800
400
600
300
700
700
800
600
600
700
800
700
200
800
5.
Dis
sovl
edO
xyge
n1.
81.
61.
91.
81.
51.
41.
52.
83.
53.
09.
012
.68.
612
.73.
03.
54.
88.
18.
28.
35.
71.
512
.76
.F
ree
CO
21.
671.
591.
57ND
1.67
1.67
1.65
12.5
12.9
12.7
13.9
13.7
13.5
13.9
6.1
6.3
6.7
6.9
6.8
6.4
6.5
ND13
.97
.To
tal H
ardn
ess
104
115
138
124
102
119
113
190.
622
1.5
244
200.
630
031
431
718
.39
18.4
726
.75
22.0
419
.24
19.5
20.1
718
.47
317
8.
Tota
l Alk
alin
ity59
0.4
550.
358
0.8
624.
356
2.4
627.
156
5.2
705.
450
8.18
710.
687
050
8.18
475.
257
5.35
599.
655
0.2
625.
653
2.8
508.
1859
2.4
570.
147
5.35
870
9.
Mag
essi
um20
.14
18.5
25.6
24.1
219
.24
26.2
122
.746
.26
42.5
041
.90
58.9
836
.40
46.0
029
.20
22.3
523
.75
26.3
124
.27
21.5
529
.15
27.2
219
.24
58.9
810
.C
alci
um33
.66
32.5
029
.66
30.6
428
.05
31.1
228
.70
96.2
928
.85
28.8
537
.730
.46
20.5
244
.56
35.5
27.2
538
.47
32.3
434
.08
40.0
835
.720
.52
96.2
911
.C
hlor
ide
195.
8520
5.15
157.
6718
8.01
207.
6919
3.03
197.
1150
.58
47.5
546
.43
11.8
247
.92
23.6
535
.70
109.
1613
5.4
189.
0315
1.03
183.
7114
3.54
157.
1011
.82
207.
69
Res
ults
in
mg
/L,
pH
loga
ritha
nic
Sca
le, C
ondu
ctiv
ity (
mm
ho /c
m )
Tem
pera
ture
0 C N
D -
No
dete
ctio
n.R
ainy
Sea
son
-Jul
y 20
10
to
Oct
ober
20
10W
inte
r Sea
son
-Nov
embe
r 20
10 t
o F
ebru
ary
2011
Sum
mer
Sea
son
-Mar
ch 2
011
to J
une
2011
selected for the present study namely 1 Dadpimpri2 Umberkhede3 Mehunbare 4 Bhaur5
Vadgaonlambe6 Dhamangaon and7 Khedgaon.
The selection of wells from these villegeswere at a distancd of about 05 Kms from eachsampling point along the north side of the canal.The underground water samples were collectedfrom deep wells from these villeges on the basis oftheir agricultural importance. While collecting thesamples; the electrical pumps were run for oneminute and then water sample was collected inscrew cappled polythene can previously cleanedand washed with deionised water and again rinsedwith the same water sample several times.
The Underground water samplescollected in the spell of June 2010 to Feb. 2012 ineach rainy, winter and summer seasons. The waterfrom wells of at a distance of about 5 to 6 km. northto the canal which on irrigation given good yieldwas also collected for reference.
RESULTS AND DISCUSSION
Various water samples are collected fromdifferent sampling stations during every season wasanalysed. Eleven Physico- Chemical Parametersof water samples were determined and recorded.The termperature of the sample was noted at thesample spot during collection. At the same time thedissolved oxygen was fixed by the ChemicalProcess Methodology for water analysis by Dr.Mohan S. Kodarkar (1992). Other parameters likeelectrical conductivity, pH, total alkalinity, totaldissolved solids, Total hardness, calcium,magnessium, chloride, free CO2 were measuredwith in time span of three hours from sampling. Theparameters were analysed by prescribed standardmethod given in (APHA and AWWA 1995, Trivedi &Goel 1986,Jackson 1958, & Kotaian and SreedharReddy 2003).
A complete chemical analysis maydetermine the suitability of ground water for drinkingagriculture irrigation and industrial purpose. Theanalysis of ground water sample includes thedetermination of concentration of the inorganicconstituents present in addition to the measurementof pH. electrical conductance, total dissolved solids

153PARMAR, Curr. World Environ., Vol. 7(1), 151-156 (2012)
Tabl
e 2
: S
easo
nal
Var
iati
on
in th
e u
nd
erg
rou
nd
wat
er q
ual
ity
at N
ort
h s
ide
Gir
na
Can
al (R
igh
t),
Ch
alis
gao
n T
alu
ka D
ist.
Jalg
aon
, Mah
aras
htr
a S
tate
Ju
ne
2011
to F
eb. 2
012
S.
Par
amet
erR
ainy
Sea
son
Win
ter S
easo
nS
umm
er S
easo
nM
in.
Max
.
No.
Sam
ple
Sta
tion
Sam
ple
Sta
tion
Sam
ple
Sta
tio
12
34
56
71
23
45
67
12
34
56
7
1.
Tem
pera
ture
27.8
27.7
28.0
28.3
27.8
28.1
27.5
25.9
25.7
25.8
26.0
25.0
26.2
26.1
28.1
28.5
28.6
28.2
28.3
28.4
28.7
25.0
28.7
2.
PH8.
248.
428.
318.
268.
478.
18.
07.
927.
888.
238.
448.
518.
638.
218.
577.
888.
757.
758.
758.
308.
377.
888.
75
3.
Con
duct
ivity
1600
1000
1500
1700
1400
1300
1600
140
130
140
130
110
100
150
110
140
100
110
120
100
1700
100
1700
4.
Tota
l Dis
solv
ed S
olid
s70
070
070
080
080
080
060
050
040
030
060
070
070
080
070
030
080
060
080
070
060
030
080
0
5.
Dis
sovl
ed O
xyge
n2.
110.
41.
981.
811.
21.
251.
7013
.412
.512
.313
.813
.812
.78.
88.
48.
18.
98.
31.
2513
.89
8.5
1.25
13.8
9
6.
Fre
e C
O2
1.9
1.3
1.7
1.4
1.3
1.2
1.6
8.1
8.2
11.5
8.2
9.1
8.7
8.8
8.3
8.4
4.3
3.2
1.2
11.5
4.5
1.2
11.5
7.
Tota
l Har
dnes
s11
011
512
011
711
910
910
72.
482.
4029
824
4.1
194.
332
13.
1012
011
511
912
113
112
412
711
032
1
8.
Tota
l Alk
alin
ity65
3.4
575.
262
4.3
593.
462
5.5
570.
756
9.1
701.
972
1.9
735.
086
075
3.7
71
3.12
850.
0790
.460
1.2
635.
597
4.4
589.
352
8.2
750.
452
8.2
774.
4
9.
Mag
essi
um33
.86
32.9
529
.95
29.7
529
.95
30.7
037
.10
58.6
040
.55
43.2
557
.24
58.8
035
.45
35.0
36.1
035
.60
35.4
429
.75
58.8
032
.734
.10
29.7
558
.80
10.
Cal
cium
29.2
430
.532
.16
28.0
127
.45
31.3
828
.349
.56
35.2
27.2
922
.56
21.2
415
.414
.22
27.2
529
.536
.11
33.4
437
.02
35.0
430
.214
.22
49.5
6
11.
Chl
orid
e91
.18
11.7
106.
719
0.45
171.
316
4.1
150.
268
.34
135.
712
1.4
131.
7114
1.97
196.
4117
5.3
102.
1417
4.4
145.
6 18
1.78
149.
4
141.
6413
9.26
8.34
190.
45
Res
ults
in
mg
/L,
pH
loga
ritha
nic
Sca
le, C
ondu
ctiv
ity (
mm
ho /c
m )
Tem
pera
ture
0 C N
D -
No
dete
ctio
n.
Rai
ny S
easo
n-
July
201
1
to O
ctob
er
2011
Win
ter S
easo
n-
Nov
embe
r 20
11 t
o F
ebru
ary
2012
Sum
mer
Sea
son
-M
arch
201
2 to
Jun
e 20
12

154 PARMAR, Curr. World Environ., Vol. 7(1), 151-156 (2012)
and other minor constituents. Each of theseproperties is useful in evaluating the chemicalcharacter of underground water. This water qualityis also influenced by meteorological factors suchas rainfall, evaporation etc. Therefore, it needs aconstant monitoring of chemical parametersthrough out the year. In the present study,underground water from seven wells tappingvarious aquifer formation in area have beensampled and analysed for a period of two years inrainy, winter and summer season.
The variation in the concentration of mejorion is shown in table 1 and 2 From these figures it isevident that the concentration of all the ions in winterseason were low and exhibiting increasing trendin rainy and summer seaons. The reason for thesechanges could be the dissolution of salts andminerals which are present in soil due to the rise inwater table during winter period. Kripanidhi (1984)have reported similar trends in ground water of atypical hard rock terrain and pollution in villageswell in Karnataka State, India respectively.
Physico - Chemical Parameters of groundwater samples of north side of canal from varioussampling points are given in table -1 along withminiumum and maximum values while these ofwater sample of a long distance towards north sideof canal are given in Table 2.
It was found that the termperature of wellsof the villeges of Chalisgaon Taluka varies withinabout 30C during June 2010 to Feb. 2012 andaverage temperature of seven wells was 27.420Cin all seasons for both the years. Various chemicaland biological reactions in water depends to greatextent on temperature. The observed values oftemperature indicates that the water quality wouldbe certainly affected by this parameter. The pH ofwater varies between 7.45 to 9.19 . It is observedthat except in winter, pH.of all remaining sampleswas high particularly in summer, but on an averagepH of all samples was in desirable limit asprescribed for drinking water standard (ICMR pH =8.5). The average pH of all water samples fromsampling stations were within the maximumpermissible limit. It is known that pH of groundwater does not reported by causes any severehealth hazard reported by (Pujan & Sinha 1999)
The specific conductivity of samples understudy varies between 100 to 1800m mho / cm. themaximum permissible limit of this parameter fordrinking water is 300m mho / cm but averagespecific conductivity exceeds this limit because ofit’s high values during each rainy season. In rainyseason due to floods containing high electrolytesin water the conductivity of samples increasesdrastically ( reported by - Pujari & Sinha 1999).
The sandard TDS in the water shouldbelow 1000 mg / L to consider it as non saline andvalues of water above this limit makes its non-palatable ( reported by - Pujari and Sinha 1999).The permissible limit of TDS of drinking water is500 mg / L ( WHO). This observation shows that theTDS is higher in comparision to WHOrecommendation but was non saline and palatable.
According to (kudesia 1985) good waterquality have solubility of oxygen 7.0 and 7.6 mg / Lat 3o0C and 350C respectively but except in rainyseason all the sample showed higher values ofD.O. Low values of D. O. in rainy season can be dueto high values of conductivity of water.
Free CO2 content in well water is due torain from plant roots and decaying vegetation( reported by - Pujari and Sinha 1999). The factorsresponsible for solubilisation of CO2 aretemperature, pressure, pH and total alkalinity (reported by - Johnson 1996) The free CO2 contentsof water of different wells varies from 0 to 13.9 mg /L. However, the permissible limit of free CO2 hasnot yet been prescribed.
Hardness has no known adverse effecton health ( reported by - Pujari and Sinha 1999)However maximum permissible level has beenprescribed for drinking water is 500 mg / L by WHOAccording to same classification water havinghardness upto 75 mg / L is classified as soft water76-150 mg / L is moderately soft water, 151-300mg / L as hard water (reported by - Twort 1974) onthe basis of this observations the results showsthat, 1. All the water samples in rainy season were
moderately soft.2. Most of the observation in winter season
showed that water was of moderately hard

155PARMAR, Curr. World Environ., Vol. 7(1), 151-156 (2012)
level.3. In summer of 2010-2011 the observation
showed that the water samples were soft butin summer of 2011-2012 water wasmoderately soft.
The total alkalinity of well water in terms ofCaCO3 varied between 475.35 to 870. Thesevalues of total alkalinity were comparatevely largein quantity as compared to those reported by andPujari and Sinha in 1999. Rajaramohanpur andSilguri (2003), but it itself is not harmful to humanhealth rather it provide buffering action. The waterfor domestic use having alkalinity less than 100 mg/ L is safe ( reported by - Goel & Trivedi 1986). Thehigh content of alkalinity is evident in this particulararea.
Present investigation shows theconcentration of calcium in the water samples inthe range of 20.52 to 96.29 mg / L. during yearJune 2010 to Feb. 2011 and in the ragne of 14.22to 49.56 during June 2011 to Feb. 2012. Accordingto Ohle W. (1956), the waters above. Calcium values25 mg. / L are classified as calcium rich. Thus asper the recommendations of ohle w. most of thewater samples are ‘Calcium rich’. The observedvalues of magnessium were between 19.24 to58.98 mg / L during June 2010 to Feb. 2011 and29.75 to 58.80 mg / L. during June 2011 to Feb.2012. This observations shows that maximumcontent of magnessium occured during winter.According to ISI and WHO standards the desirablemaximum permissible values of magnessiumcontent s for drinking water prescribed by 80 mg /L, 50mg / L and 30 mg / L 150 mg / L respectivelyResults of present investigation shows that themagnessium contents in mejority of samples doesnot exceed the limit as prescribed by ISI as well asWHO.
Chlorine contents in water samples werein small quantity in rainy season and in very smallquantity in winter season. According to WHO, themaximum permissible limit for chloride is 500 mg /L and since the values observed in present studyare well below this level it has not imparted the testfor water. This investigation of Physico- ChemicalParameters of water samples indicate that
Dissolved oxygen is well below the permissible limitbut total alkalinity and total specific conductivityexceed the permissible limit. All remainingparameters are well within the limit. This indicatesthat no doubt water is contaminated butcontamination is not of greater extent so far due tothe agricultural practices followed by the people.Hence on the basis of above favourable results,water from these area are best suited for drinkingirrigation & industrial application.
A study of Physcio- Chemicalcharcterisation of underground water at a distancedof 5 to 10 Km. north to canal taken in winter seasonshows the correlation with the data of winter seasonof underground water from sampling sites near thecanal. This study indicates that north side ofunderground water does not have any impact ofcanal on its Physico - Chemical Characters.
Mechanism controlling the chemistry of groundwater
Conway (1984), Garham (1961), Garrelsand Christ (1965, 1966), Gibbs (1970) andRamesam and Barua (1973) have discussed indetail the mechanism controlling the chemistry offresh water. The hydrochemical studies are beingused to establish the relationship of watercomposition to aquifer litholgoy. This helps not onlyto explain the origin and distribution of disssolvedconstituents but also to elucidate the factorscontrolling the groundwater chemistry. As per theclassification of Gibbs (1970), the major naturalmechanisms controlling world surface groundwater chemistry are admospheric preciptitation,rock weathering evalovation and fractionalcrsytalization.
ACKNOWLEDGEMENTS
Auther is thankful to the Management ofR.S.S.P. Mandal Ltd., Chalisgaon, Dist. JalgaonSanstha’s Nanasaheb Y. N. Chavan Arts, Science,and Commerce College, Chalisgaon, Dist. Jalgaon(424101), for providing necessary laboratoryfacilities. Thanks are also due to The Managementand Principal of the same college for overall helpand constant encouragement throughout thepresent investigation.

156 PARMAR, Curr. World Environ., Vol. 7(1), 151-156 (2012)
REFERENCES
1. APHA and AWWA, Standard methods for theexamination of water and water and wastewater, 16th edition, Washington D.C. (1995)
2. Bandela N. N, Physico - chemical projects ofBarual Dam of Kandhar, Theiss submitted toDr. B. A. M. University, Aurangabad. (1998)
3. Kotaish B and Sreedhar Reddy S, Indian J.Environ. and Ecoplanm. 7(1): 43-46 (2003)
4. Conway E. J, Mean geo-chemical data inrelation to oceanic evolution. Proc. IrishAcad., 48: 119-159 (1984).
5. Garham E, Factors influencing suply of majorions to inland water special reference toatmospheric; Bull Geo Soc Amer, 72: 795-480 (1965)
6. Garrels R. M. and Christ C. L. SolutionsMinerals and Equilibria, Harper row, NewYork (1965)
7. Gibbs R.J., Machanism Controlling waterchemistry, 170: 1088-1090 (1970)
8. Gopal Krishna Pujari and Sinha B. K, Journalof Env. and Pollution, 71-76 (1999)
9. ICMR standards, standard methods forexamination of water (1985)
10. ISI and WHO, Indian Standards of drinkingwater specification, Bureau to IndianStandards New Delhi, 2-4, BIS 10500 (1992)
11. Jackson M. L., Soil Chemical Analysis,Prentice Hall Pvt. Ltd., New Delhi, India.(1958)
12. Kudesia V. P., Water Pollution, PragatiPrakashan, Meerut (1985)
13. Kripanidhi K. V. J. R. Mechanism of Groundwater pollution in village wells, GeologicalSociety of India, 25: 301- 302 (1984)
14. Mohan S. Kodarkar, Methodology of wateranalysis., (1992)
15. Ohle W, ‘ Bioactivity production and engergyutilization of lakes’ Limnal and Ocenog., 1:139-149 (1956).
16. Raja Rammohanpur Siliguri, J. Environ Biol,24(2): 125-133 (2003).
17. Trivedi R. K and Goel P. K, Chemical andBiological methods for water pollutionstudies, Environment publications, Karad(1986)
18. Twort, A.C., Hoather R.C and Law F. M. Watersupply, Edward Ornold Pub. Ltd., Londan(1974).
19. WHO, Guideline for drinking water quality,recommendation World HealthOrganization, Geneva 1: (1984).
20. Chavan T. P., Physico - ChemicalCharacteristics of Water and Soil, Ph.D.Thesis Dr. B. A. M. University, Aurangabad(2000).
21. Shah, A. R., Physico- Chemical aspects ofpollution in river Jhelum (Kashmir) during(1981-83). In Trivedy, R. K. Edited Ecologyand Pollution of Indian rivers 163- 207(1988).
22. Raymahashay, B.C. Geochemistry ofbiocarbonates in river water, Great Soc. ofIndia, 27: 114-118 (1986)
23. Pujari and Sinha B. K. Journal of Environmentand Pollution, 6(i): 71-76 (1999).(Technoscience Publication )
24. Prasad, B.V. and Rameshchandra P., GroundWater Quality in an Industrial Zone. A casestudy, Poll. Res. 16(2) : 105-107, (1997)
25. Pandhe, G. M., Dhembare A.J. and Patil R.P., The Physichemical Characteristic andquality of water from the Pravara area,Ahemadnagar District, Maharashtra, J. Aqua.Biol. 10(1) : 43-48 (1995).
26. G.S. Kabwania and Radhey Shyam. Orient.J. Chem. 28(1): 547-552 (2012).
27. K.C. Gupta and Jagmohan Oberoi. Orient. J.Chem. 26(1): 215-221 (2010).

Current World Environment Vol. 7(1), 157-161 (2012)
A Comparative Study on the Toxicity of a Synthetic Pesticide,Dichlorvos and a Neem based Pesticide,
Neem-On to Labeo rohita (Hamilton)
BILAL AHMAD BHAT1*, IMTIYAZ AHMAD BHAT1,SANTOSH VISHWAKARMA1, ALOK VERMA2 and GEETA SAXENA1
¹Department of Zoology, Govt. Science and Commerce College Benazir, Bhopal - 462 008 (India).²Department of Zoology, Govt. College Lateri vidisha - 464 114 (India).
(Received: February 15, 2012; Accepted: March 29, 2012)
ABSTRACT
Fish and other organisms are affected by pesticides which pollute the natural waterthrough agricultural runoff. Fishes are common bioindicators of water pollution. In the presentstudy bioassay of synthetic pesticide, Dichlorvos and a plant origin natural pesticide, Neem-Onwas separately done on Labeo rohita. Data obtained from the toxicity tests were evaluated usingthe Probit Analysis Statistical Method. The 96h LC50 of Dichlorvos and Neem-On was found to be16.71ppm, 42.66ppm respectively. The fish exhibited erratic swimming, copious mucus secretion,loss of equilibrium and hitting to the walls of test tank prior to mortality. In this study, Neem-On wasless toxic to fish as compared to Dichlorvos. Plant based pesticides are biodegradable and aretarget specific than the highly persistent broad spectrum synthetic chemicals. Therefore, use ofplant based pesticides is less disastrous and more ecofriendly.
Key words: Dichlorvos, Neem-On, Labeo rohita, Toxicity, 96h LC50
INTRODUCTION
Increased used of pesticide results in theexcess inflow of toxic chemicals, mainly in to theaquatic ecosystem (Baskaran et al., 1989;Kalavanthy et al., 2001). The aquatic environmentis currently under threat by the indiscriminate useof synthetic pesticides by the human activities andcausing high risk to non-target organisms (Kumaret. al., 2010). Among different classes of pesticides,organophosphates are more frequently used,because of their high insecticidal property, lowmammalian toxicity, less persistence and rapidbiodegradability in the environment (Singh et al.,2010). Dichlorvos is recommended for applicationas a high or a low volume spray on crops such aspaddy, wheat, soyabean, apple, sugarcane,mustard, sunflower and cashew. The EnvironmentProtection Agency (EPA) has classified dichlorvosas toxicity class 1 highly toxic (URL: 1). Severalspecies of fish are susceptible to deleterious effects
when exposed to heavy metals, pesticides and otherenvironmental stressors (Khangrat et al., 1988;Areechon and Plump, 1990).
To overcome the hazardous effects ofthese organic pesticides, recent emphasis is onthe use of natural pesticides, which are usually ofplant origin. Some plants contain compounds ofvarious classes that have insecticidal, piscicidal andmolluscicidal properties. Unlike synthetic chemicalpesticides, which leave harmful residues in theaquatic environment (Koesomadinata, 1980;Cagauan, 1990; Cagaun and Arce, 1992) botanicalinsecticides are believed to be moreenvironmentally friendlier because they are easilybiodegraded and leave no residues in theenvironment. Azadirachtin derived from neem(Azadirachta indicaA. Juss) is a very effective andextensively used pesticide. Pesticides based onazadirachtin may have direct adverse effects onaquatic organisms and their toxicity depends on

158 BHAT et al., Curr. World Environ., Vol. 7(1), 157-161 (2012)
various factors. It has been reported that neemextracts in aquatic environments are lethal tobenthic populations and drastically decrease thenumber of organisms in the food web and nutrientcycling process (Goktepe et al., 2002; El-Shazlyet al., 2000). Pesticides containing bioactivecompounds from the neemplant, Azadirachta indicaJuss are reported to be target specific andcomparatively less toxic.
However little work has been done on thetoxic effect of neem based pesticides on fish. It ispossible to substitute organic pesticides with thepesticides of plant origin. Hence the present studywas carried out to evaluate the comparative effectof organophosphate pesticide Dichlorvos andneembased pesticide Neem-On to Labeo rohita(Ham.).
MATERIAL AND METHODS
Healthy and active adult Labeo rohita wereobtained from Patra fish farm barkhedi Bhopal (M.P).They weighed 55g±1g and their length was in therange 15cm±1. They were brought to laboratorycarefully in oxygen filled polythene bags in cardboard boxes to avoid any injury and disinfected bygiving a bath for five minutes in KMno4 solution.Thereafter, they were transferred to glassaquariums filled with dechlorinated water. Thefishes were acclimated to the laboratory conditionsfor at least 20 days prior to the experiment. Duringacclimatization fishes were fed daily withcommercial fish food which was given at morninghours. Water was replaced every 24h after feedingin order to maintain a healthy environment for thefish during acclimation and experimental period.
This ensures sufficient oxygen supply for the fishand the environment is devoid of any accumulatedmetabolic wastes. Dead fishes when ever locatedwere removed immediately to avoid fouling of thewater.
Water quality characteristics weredetermined and maintained. Nuvan (dichlorvos 76%EC) manufactured by Syngenta India ltd. 14, J. Tataroad, Mumbai and Neem-On Manufactured by JaiKissan Agro Pvt. Ltd., Sangam nagar, Indore, (M.P.)purchased from local market were used forevaluation of their toxicity to fish. . For determiningLC
50 concentration different stock solutions wereprepared, separate glass aquariums were takenand different concentrations of Dichlorvos andNeem-on were added from the stock solution.Simultaneously a control set was run with theexperiment. During assay no food was administeredto fishes. The LC50 concentration for 96h wascalculated by probit analysis method of Finney’s(1971). The control, Neem-On and Dichlorvosexposed fish were kept under continuousobservation during experimental periods.
RESULTS
The 96h LC50 value of Dichlorvos andNeem-On was found to be 16.71ppm and42.66ppm respectively. The LC50 concentration for96h was calculated by probit analysis method ofFinney’s (1971). Table 1 and 2 shows the relationbetween the Dichlorvos, Neem-On concentrationand the mortality rate of Labeo rohita and the graphsbelow show the plot of Finney’s probits againstlog10 conc. for calculating LC50 value of both thepesticides.
Table 1: For Dichlorvos
Conc.(mg/L) Log10Conc. Total No. No. Dead %Mortality Probit.
14 1.1461 10 0 0% -15 1.1761 10 16 10% 3.7216 1.2041 10 3 30% 4.4817 1.2304 10 6 60% 5.2518 1.2553 10 8 80% 5.8419 1.2788 10 10 100 % -

159 BHAT et al., Curr. World Environ., Vol. 7(1), 157-161 (2012)
Table 2: For Neem-on
Conc.(mg/L) Log10Conc. Total No. No. Dead %Mortality Probit.
Control 10 0 0 -40 1.6021 10 0 0 -41 1.6128 10 1 10 3.7242 1.6232 10 3 30 4.4843 1.6335 10 6 60 5.2544 1.6435 10 8 80 5.8445 1.6532 10 10 100 -
After exposure of both the pesticides, theLabeo rohita showed behavioral changes, theyaggregated at one corner of aquarium, irregular,erratic and darting swimming movements and lossof equilibrium. They slowly became lethargic, hyperexcited, restless and secreted excess mucus allover their bodies. The fish exhibited peculiarbehavior of trying to leap out from the pesticide
medium which can be viewed as an escapingphenomenon. They often spiral rolled at intervalsand finally the fishes sank to bottom with their leastoperculum movements and died with their mouthopened. However, the behavioral changes weremore prominent for the synthetic pesticideDichlorvos as compared to Neem-on.
Graph of Dichlorvos
Log10 concentration
Pro
bit V
alue
Graph of Neem-0n
Pro
bit V
alue
Log10 concentration

160 BHAT et al., Curr. World Environ., Vol. 7(1), 157-161 (2012)
DISCUSSION
Newer biological pesticides aredeveloped to replace deleterious chemicalpesticides. Even though chemical pesticides aretarget specific and effective, their impact on theenvironment is mostly deleterious. Plant basedpesticides contain active principles with low half-life period and their effects on the environment arenot too detrimental (Sharma et al., 1995). In thepresent study, the pesticide containing azadirachtinis less toxic to fish compared to Dichlorvos. The96h LC50 of Dichlorvos is 16.71 ppm. Whereasazadirachtin is much higher 42.66ppm indicatingthe less toxic nature of the plant based pesticide.Das et al., 2002 have studied the acute toxicity ofneem in the fingerlings of Indian major carps i.e.,Labeo rohita, Catla catla and Cirrhinus mrigala andthe 96h LC50 values were found to be 2.36, 2.04and 2.78ppm respectively. Hassanein et al., 2007reported the 96h LC50 value of a neem biopesticide(Triology) on the grass carp fish, Ctenopharyngodonidella and was found to be 112ppm. Cagauan et al.(2004) showed that the lethal concentration ofneem to Nile tilapia Oreochromis niloticus L. was12.4 ml/L and mosquito fish Gambusia affinis Bairdand Girard was 8.31 ml/L and the corresponding96 h LC50 values were 2.57 and 3.0 ml/L ). TheLC50 values of Dichlorvos has been reported byvarious workers as in Cyprinus carpio 6gm it was0.34ppm for 96h (Verma et al., 1981) in Cirrhinusmrigala it was 9.1ppm for 96h (Velmurugan et al.,2009) and in Ctenopharyngodon idella it was
13.1ppm for 24h (K.S Tilak and Swarna Kumari2009).
Comparison of the LC50 values clearlyindicates that the plant based pesticide is less toxiccompared to the chemical one. To reduce thechemical load on the environment, it is suggestedthat use of plant based pesticides should beencouraged (Schmutterer, 1990). However, careshould be taken to use even the plant basedpesticide at moderate levels. Furthermore, plantbased pesticides disintegrate easily intoconstituent elements without leaving any indelibleimpression in different regions of the environment(Khan and Ahmed, 2000). It is advocated that moreand more plant products should be developed withproper and targeted action and this eventually helpsin keeping the environment free from hazardouschemicals. From the present study, it could beconcluded that Dichlorvos contamination isdangerous to aquatic ecosystems, and this factshould be taken into consideration when thisinsecticide is used in agriculture or in the control ofmosquito populations. It can be also concluded thatalthough neem based pesticides are consideredas less toxic and environmental friendly, butprecautions must be taken when it is used in fishinhabiting areas since the excess application canaffect the life of organisms. This type of study canalso be useful to compare the sensitivity of thevarious species of aquatic animals and potency ofchemicals using LC
50 values and to derive safeenvironvimental concentration by which there is nolethality and stress to the animals.
REFERENCES
1. Areechon, N. and Plump, J.A., Sub lethaleffects of Malathion on channel cat fish,Ictalaurus punctatus. Bull. Environ. Contam.Toxicol., 44: 435-442 (1990).
2. Baskaran, P., Palanichamy, S., Visalakshi, S.and Balasubramanian, M.P. Effects ofmineral fertilizers on survival of the fishOreochromis mossambicus. Environ. Ecol.,7: 463-465 (1989).
3. Cagauan, A.G., The impact of pesticides onrice fields vertebrates with emphasis on fish.In: P.L. Pingali and P.A. Roger (Eds.), Impact
. of pesticides on farmer health and the riceenvironment. International Rice ResearchInst., Kluwer Academic Publ., Phillipines:203-248 (1990).
4. Cagauan, A.G. and Arce, R.G., Overview ofpesticides use in rice-fish farming in SouthEast Asia. In: C.R. Dela cruz, C. Lightfood, B.Coasta pierce, V.R. Carangal and M.P.Bimbao (Eds.), Rice-fish research anddevelopment in Asia. International Centre forLiving Aquatic Resources Management(ICLARM) Conf. roc., Philippines: 24: 217-

161 BHAT et al., Curr. World Environ., Vol. 7(1), 157-161 (2012)
233 (1992).5. Caguan, A.G., Galaites, M.C. and Fajardo,
L.J., Evaluation of botanical piscicides onNile tilapia Oreochromis niloticus L. andmosquito fish Gambusia affinis Baird andGirard. Proceedings on ISTA, 12-16September. Manila, Phillipines: 179-187(2004).
6. Das, B. K., Mukherjee, S. C., and Murjani, O.Acute toxicity of neem (Azadirachta indica)in Indian major carps. Journal of Aquaculturein the Tropics, 17: 23-33 (2002).
7. El-Shazly, M.M. and El-Sharnoubai, E.D. ,Toxicity of a neem (Azadirachta indica)insecticide to certain aquatic organisms.Journal of the Egyptian Society ofParasitology, 30(1): 221-231.
8. Finney, D.J., Probit analysis, 3rd (Ed.),Cambridge University Press, London, 333pp (1971).
9. Goktepe, I. and Pihak, L.C., Comparativetoxicity of two azadirachtin – based neempesticides to Daphnia pulex. EnvironmentalToxicology and Chemistry, 21(1): 31-36(2002).
10. Hassanein, H. M. A; Okail, H. A. andMohamed, N.K. Biochemical changes inproteins and DNA in Ctenopharyngodonidella due to environmental pollution withthe biopesticide (Trilogy). 10 ICCA,Garyounis University, Benghazi, Libya: 18-21 (2007).
11. Kumar A., Prasad, M.R., Srivastava, K.,
Tripathi, S. and A.K., Srivastava., BranchialHistopathological Study of catfishHeteropneustes fossilis following exposureto purified Neem Extract, Azadirachtin. Worldjournal of zoology. 5 (4): 239-243 (2010).
12. Kalavathy, K., Sivakumar, A.A. and Chandran,R., Toxic effect of the pesticide Dimethoateon the fish Sarotherodon mossambicus. J.Ecol. Res. Bioconserv., 2(1-2): 27–32 (2001).
13. Khan, M.F. and Ahmed, S.M., Toxicity of crudeneem leaf extract against housefly Muscadomestica L. adults as compared with DDVP,Dichlorvos. Turk. J. Zool., 24(4): 219-223(2000).
14. Khangarot, B.S., Ray, P.K. and Singh, K.P.Influence of copper treatment on theimmune response in an air breathing teleostSaccobranchus fossilis. Bull. Environ.Contam. Toxicol., 41: 222-226 (1988).
15. Koesomadinata, S., Pesticide as a majorconstraint in integrated agriculture-aquaculture farming system. In: R.S.V. Pullinand Z.H. Shehadeh (Eds.), IntegratedAgriculture - Aquaculture Farming Systems.(ICLARM) Conf. Proc., 4: 45-51 (1980).
16. Schmutterer, H., Properties and potential ofnatural pesticides from the neem tree,Azadirachta indica. Ann. Rev. Entomol., 35:271-297 (1990).
17. Sharma, S.K., Dua, V.K. and Sharma, V.P.,Field studies on the repellent action of neemoil. Southeast Asian. J. Trop. Med. Pub. Helth.,26: 180-182 (1995).

INTRODUCTION
The chemical composition of the bottomsediments and its variation of different sites in theriver Swarnarekha receiving the treated anduntreated waste water from domestic and industrialsources have a profound impact on the water qualityof the river basin. Water chemistry only assessesthe effluent impact at the time of sampling while thebottom sediments geo-chemistry gives acumulative assessment of pollution. Bottomsediments analysis has been used to trace pollutantinputs and to anticipate the effects of their pollutantson water quality.
In this work, the bottom sediments fromdifferent sites on the river Swernarekha aroundSteel City of Jamshedpur and Ghatsila was analysedfor their multi-element composition with a view toestablish the relationship between the pollution ofrivers and the discharge of domestic and industrialwaste waters.
Current World Environment Vol. 7(1), 163-167 (2012)
Studies in River’s Bottom Sediments in Swarnarekha Riveraround Jamshedpur and Ghatsila for Metallic Pollution
H.S. MISHRA1 and S.K. JHA2*
1Department of Chemistry, Jamshedpur Co-operative College, Jamshedpur (India).2*Department of Chemistry, J.S.M. College, Jamshedpur (India).
(Received: April 28, 2012; Accepted: June 10, 2012)
ABSTRACT
Studies of heavy metals namely Iron, Chromium, Manganese, Cobalt, Nickel, Copper,Zinc, Cadmium and lead as pollutants in river water and waste water discharge samples of riversaround steel plants of Jamshedpur and Ghatsila, East Singhbhum, Jharkhand, was carried outfrom February,2012 to March, 2012. Atomic Absorption spectrophotometric analysis of non-filterable residue of bottom sediments for the heavy metals were made. The fractionation analysisof the adsorption and/or ion exchangeable, oxide coating, organic solids and crystalline phasewas carried out. Total metals concentration was also determined. The sum of the concentration ofmetals in adsorbed, oxide coating and organic solid phases is available to biota. The crystallinephase is not available to biota. The results have been discussed and the conservation of metalavailable to biota have been estimated.
Key words : Metal transport phases, Bottom sediments, Pollutants, biota,Atomic Absorption spectrophotometer (AAS) and Self purification.
EXPERIMENTAL
Sampling Sites.(i) Swarnarekha River (Near Nirmal nagar,
Sakchi) in February, 2012Site IA – Discharge SampleSite IB – River Water Sample (1 Km awayfrom discharge)
(ii) Swarnarekha River (Near Ghatsila) inMarch, 2012
(iii) Site II A – Discharge Sample(iv) Site II B – River Water Sample (1 Km away
from discharge)
Partitioning of waste water discharge sampleThe sample was transferred into two 1 litre
measuring flasks separately and then filteredthrough Whatman filter paper (No.-42) separately.Filtrate in all the cases were rejected. The residuesin the above two cases were collected separatelyand treated as follows :

164 MISHRA & JHA, Curr. World Environ., Vol. 7(1), 163-167 (2012)
Residue-IThe residue obtained after filtration of the
waste water discharge sample along with the filterpaper was treated with 20 ml aqua regia and heatedfor 0.5 hours over water bath. It was then filteredthrough Whatman filter paper (No.-42) and thevolume was made up to 500 ml with distilled waterin a volumetric flask. The metals determined in thisfiltrate were the total metal concentration in thissample.
Residue-IIThe residue obtained after filtration of 1
litre of waste water discharge sample along withthe filter paper was leached with 50ml of 0.5 NMgCl2. 6H2O solution for 7 hours stirring from timeto time and it was then filtered through Whatmanfilter paper (No.-42). The filtrate was then made upto500ml with distilled water in a volumetric flask forthe determination of adsorbed and/or ionexchangeable heavy metals (Eisenreich-1980). Theresidue left over on the filter paper along with thefilter paper itself was then leached with 0.4 Nsodium pyrophosphate solution for 10 hours stirringfrom time to time and then filtered. The filtrate wasthen made upto 500ml and heavy metals associatedwith organic solid were estimated from this filtrate.The residue along with filter paper was treated with50ml 0.3 N HCl solution and heated at 90oC for 0.5hr and then filtered. The filtrate, was then made,upto 500ml. Heavy metals in oxide coating weredetermine in the filtrate. The residue along with the
filter paper was then treated with 20ml aqua regiaand heated over water bath for 0.5 Hrs. It was thenfiltered and the volume of the filtrate was made upto250ml. The metals determined in this last filtratewere designated metals in crystalline state.
Partitioning of river Water SampleSimilar procedure was followed for the
determination of total concentration of heavy metalsand concentration of heavy metals in differentphases.
The samples obtained as above wereanalysed for estimation of heavy metals such asFe, Mn, Cr, Ni, Co, Cu, Zn, Cd and Pb by AtomicAbsorption spectrophotometer.
RESULTS AND DISCUSSION
Among the heavy metals, iron occurs inmuch higher concentration at site IA & IIA (dischargesample) 18.52 to 16.857 ppm. At site IB & IIB (riverwater sample) the concentration is 11.67 to 6.402.Total Mn content in the sample as determined byAtomic absorption spectrophotometer were 0.85 to0.429 ppm at the point of discharge and in riverwater sample it is 0.259 to 0.16 ppm. Ni in dischargesample were estimated to be 0.919 ppm to 0.766ppm where as in river water sample it is 0.183 ppmto 0.1 ppm. Total Zn metal concentration in dischargesample was found to be 1.61 to 1.34 ppm and inriver water sample was estimated to be 1.15 to 0.84
Table 1: Waste water discharge sample (At the point of discharge) site-IA in themonth of February, 2012 of Swarnarekha river, Nirmal nagar, Jamshedpur (By
Atomic Absorption Spectrophotometer) Heavy metal concentration in differencephase in mg/liter or ppm
Elements Total Adsorbed Organic Oxide CrystallineConcern Solid Phase Phase Phase
Fe 18.521 11.659 0.024 2.02 5.894Mn 0.85 0.78 Nf 0.041 0.45Ni 0.766 0.27 Nf 0.026 0.397Zn 1.34 0.14 0.11 0.069 1.045Pb 0.26 Nf 0.101 0.009 0.124Cd 0.010 Nf Nf Nf 0.007Co Nf Nf Nf Nf NfAs Nf Nf Nf Nf Nf

165MISHRA & JHA, Curr. World Environ., Vol. 7(1), 163-167 (2012)
Table 4: Heavy metal concentration in different phase in mg/litre or ppm(1 Km away from discharge point) of Swarnarekha River, Site-IIB (March, 2012)
Elements Total Adsorbed Organic Oxide CrystallineConcern Solid Phase Phase Phase
Fe 11.67 6.55 3.96 2.39 5.24Mn 0.16 0.0617 Nf 0.0171 0.0447Ni 0.183 0.069 Nf Nf 0.07Zn 1.15 0.513 Nf 0.027 0.62Pb 0.201 0.078 0.008 0.012 0.085Cu 1.54 0.646 0.054 0.039 0.845Co 0.008 Nf Nf Nf 0.006As Nf Nf Nf Nf Nf
Nf : not found.
Table 3: Waste Water River sample (At the point of discharge) Site-IIA in theMonth of March, 2012 of Swarnarekha River, HCL, Moubhandar, Ghatsila.
Heavy metal concentration in different phase in mg/litre or ppm(By AtomicAbsorption Spectrophotometer).
Elements Total Adsorbed Organic Oxide CrystallineConcern Solid Phase Phase Phase
Fe 16.657 0.846 0.114 3.861 13.988Mn 0.429 0.187 0.14 0.052 0.284Ni 0.919 0.26 0.027 0.019 0.328Zn 1.61 0.55 0.34 0.094 1.16Pb 0.158 0.031 0.017 Nf 0.092Cu 0.048 0.004 Nf Nf 0.0246Co Nf Nf Nf nf NfAs Nf Nf Nf nf Nf
Table 2: Heavy metal concentration in different phase in mg/litre or ppm(1 Km away from discharge) of Swarnarekha river site – IB (Feb, 2012)
Elements Total Adsorbed Organic Oxide CrystallineConcern Solid Phase Phase Phase
Fe 6.402 2.989 1.291 0.499 2.88Mn 0.259 0.197 0.065 0.062 0.108Ni 0.10 0.07 0.013 Nf 0.028Zn 0.84 0.56 0.27 0.14 0.33Pb 0.017 0.006 nf nf 0.023Cd 0.702 0.042 0.062 0.011 0.031Co Nf Nf nf nf NfAs Nf Nf nf nf Nf

166 MISHRA & JHA, Curr. World Environ., Vol. 7(1), 163-167 (2012)
ppm. Lead metal concentration was found to be0.26 to 0.158 ppm in discharge sample and in riverwater sample it was 0.201 to 0.017 ppm. Higherconcentration of Pb-metal in River water is probablydue to domestic discharge in the River water.
The partioning of Iron in different formsshow that the dominant phase is the crystalline onefor transportation of iron. This finding is similar tothe finding of Roy and Mishra (1988) and Mishra &Tiwary but it is contrast to that of Roy andUpadhyaya (1985) found in their studies.
The more common transport phasebehavior for iron in the river water in Swarnarekhariver is adsorbed>crystalline>oxide>organic solidbut at site IIA the trend is crystalline> adsorbed>oxide>organic solid.
Mn concentration in different phases asanalysed by Atomic absorption spectrophotometerin Swarnarekha river is adsorbed>crystalline>oxide>organic except for site IIA where crystalline>adsorbed>oxide>organic. These finding aredifferent from Dr.Mishra & Tiwary.
Zn concentration in different phase wereestimated and found to be adsorbed>crystalline>oxide>organic solid in site IB while in the rest it wasfound to be crystalline>adsorbed>organic>oxide
while not found in oxide phase. The variation ofconcentration of Ni metal in sample IB wasadsorbed>crystalline>organic while not found inoxide phase whereas in others it was crystalline>adsorbed>organic>oxide form. Partioning of
Pb-metal in different phases were foundas crystalline>adsorbed>organic>oxide whereinconcentration of metal is very low. However, oxidephase and organic phase was found to be almostnil in some of the samples.
CONCLUSIONS
There data about the occurrence of Fe,Mn, Cu, Cr, Ni, Zn and Pb in the various availableand unavailable metal phases would help indetermining the effect of these metals on the cropsand other biota. The higher concentration of theseheavy metals in water prevents the self purificationof water and thereby produces adverse effect foraquatic lives.
General standard for discharge ofenvironmental pollutants (inland surface water)such as Fe = 3.0mg/L, C-2.0 mg/L, Cu-3.0 mg/L, Zn= 5.0 mg/L, Ni = 3 mg/L. However it needs furtherstudy on the co-relation of the concentration of thesemetals in the various phases and their toxilogicaland other effects.
REFERENCES
1. APHA Standard methods for examination ofwater and waste water (12th edn; part I).American public Health Association, NewYork 317-320 (1967).
2. S.J. Eisenreich, M.R. Hoffman, D. Rastetter,E. Yost and W.J. Maier, ACS symp Ser. 189:135 (1980).
3. H.S. Mishra, Studies in metal transportphases in rivers around Jamshedpur Ph.D.,Thesis, Ranchi (1988).
4. N.N. Roy, and N.P. Upadhyaya Toxicologicaland environmental Chemistry, 10: 285-298.(1985).
5. V.R. Sub. Naniu. Van Grieken and I, vantdacka Env. Geolr water Sci. 9(2): 93-103,(1987).
6. A.I. Vogel, A text book of quantitativeinorganic analysis (4th edn.). The EnglishLanguage Book society and Longman,London (1978).
7. W. Stummn and J.J. Morgan AquaticChemistry (2nd edn) John Wiley and Sons.New York. (1981).
8. M.M. Reddy, Environmental International(1979).
9. R.M. Chattopadhyaya, Studies in riversediments around Jamshedpur. Ph.D.Thesis, Ranchi University, Ranchi (1985).
10. H.S. Mishra and P.B. Tiwary J. Chemtracks 6:69 (2004).
11. W. Schott, Dtsch. Labensmitt Rdsch, 48: 62-63 (1952).

167MISHRA & JHA, Curr. World Environ., Vol. 7(1), 163-167 (2012)
12. M.J. Stiff, Water res, 5(8): 585-599 (1971)13. A.I. Kadukin, V.V. Krasintseva, G.I. Romanova
and L.V. Tarasonko, Gidribiol Zh, 18(1): 79-82 (1982).
14. H.S. Mishra & P.B. Tiwary “Studies inmonitoring and Control of chemical Pollutiondue to heavy metals”, Jchemtracks., 10(1&2):
121-128 (2008).15. A.S. Waznah, B.Y. Kamaruzzaman, M.C. Org.
S.Z. Rina and S.M. Zahir. Orient. J. Chem.26(1): 39-44 (2010).
16. V. Magarde, S.A. Iqbal, S. Pani and N. Iqbal.Orient. J. Chem. 26(4): 1473-1477 (2010).

INTRODUCTION
In continuation of earlier studies on bore-well water1-3, here we have investigated intensivelythe Physico-Chemical analysis of drinking water ofMorbi-Malia territory, located in Rajkot district ofGujarat state. Bore-well water is generally used fordrinking and other domestic purposes in this area.The use of fertilizers and pesticides, manure, lime,septic tank, refuse dump etc. is the major sourcesof bore-well water pollution4. In the absence of freshwater supply people residing in this area use bore-well water for their domestic and drinking purpose.In order to assess water quality index, we haveconducted the physico-chemical analysis of bore-well drinking water.
EXPERIMENTAL
In the present study bore-well watersamples from twenty five different areas located inand around Morbi-Malia territory were collected inbrown glass bottle with necessary precautions5.
All the chemicals were used of AR grade.Double distilled water was used for the preparation
Current World Environment Vol. 7(1), 169-173 (2012)
Physico-Chemical Analysis of UndergroundDrinking Water in Morbi-Malia Territor
B. M. BHESHDADIA1*, M. B. CHAUHAN2 and P.K.PATEL1
1*Department of Chemistry, M. M. Science College, Saurashtra University,Rajkot, Gujarat, Morbi - 363 642 (India).
2Department of Chemistry, J. & J. College of Science, Nadiad, Gujarat University,Ahmedabad, Gujarat (India).
(Received: April 03, 2012; Accepted: May 03, 2012)
ABSTRACT
Physico-chemical analysis such as temperature, salinity, alkalinity, total hardness,phosphate, sulphate, nitrate, pH, electrical conductivity, T.D.S., turbidity, dissolved oxygen, fluoride,chloride of bore-well water was carried out from twenty five sampling stations of Morbi-Maliaterritory during May-2010 (before monsoon) and October-2010 (after monsoon) in order toassess water quality index.
Key Words: Physico-chemical analysis, Bore-well drinking water, Morbi-Malia, Gujarat.
of reagents and solution. The major water qualityparameters considered for the examination in thisstudy are temperature, pH, D.O., turbidity, electricalconductivity, T.D.S., salinity, alkalinity, phosphate,sulphate, nitrate, fluoride, total hardness andchloride contents6.
Temperature, pH, D.O., turbidity, electricalconductivity, T.D.S., salinity, phosphate, nitrate andfluoride value were measured by water analysiskit, portable D.O. meter and manual methods. Totalhardness of water was estimated bycomplexometric titration methods7-8. Chloridecontent was determined volumetrically by silvernitrate titrimetric method using potassium chromateas an indicator and was calculated in terms of mg/l. Alkalinity of water samples were measuredvolumetrically by titrimetric method7-8. Sulphatecontent was determined by volumetric method7.
RESULTS AND DISCUSSION
TemperatureIn the present study, temperature in May-
2010 ranged from 29.6 to32.60C and temperaturein October-2010 ranged from 29.1 to 31.80C.

170 BHESHDADIA et al., Curr. World Environ., Vol. 7(1), 169-173 (2012)
D.O.In the present study, D.O. in May-2010
ranged from 3.9 to 7.3 ppm. The minimum tolerancerange is 4.0 ppm for drinking water. But the D. O.was found lower in sample station Nos. 8. InOctober-2010 D.O. ranged from 4.1 to 8.3 ppm.
pHIn the present study, pH in May-2010
ranged from 7.10 to 8.90. The tolerance pH limit9 is6.5 to 8.5. The sample station No. 1, 5, 6, 7, 8, 11,12, 13, 15, 16, 17, 20, 21, 23, 24 and 25 showedhigher pH than prescribed range. In October-2010pH ranged from 7.67 to 9.02. The sample stationNo. 8, 12, 15, 16, 17, 20, 21 and 23 showed higherpH than the prescribed range.
TurbidityIn the present study, Turbidity in May-2010
ranged from 0.08 to 2.35 NTU and in October-2010Turbidity ranged from 0.15 to 4.60.The tolerancerange for Turbidity is 5 NTU10. So all the samplestation Nos. have shown lower NTU values thanthe prescribed range.
Electrical conductanceIn present study, Electrical conductance
in May-2010 ranged from 0.74 × 10⁻³ to 6.15 × 10⁻³
mho/cm, while in October-2010 Electricalconductance ranged from 0.51 × 10⁻³ to 4.97 × 10⁻³
mho/cm.
T.D.S.In the present study, TDS in May-2010
ranged from 399 to 3070 ppm. According to WHO9
and Indian standards10, TDS value should be lessthan 500 ppm for drinking water. The sample stationNos. 1 to 25 except 10 and 21 showed higherranges compare to prescribed WHO and Indianstandards. In October-2010 TDS ranged from 247to 2460 ppm. But sample station Nos. 1 to 25 except10, 20, 21 and 24 showed higher range thanprescribed range.
SalinityIn the present study, Salinity in May-2010
ranged from 390 to 3060 ppm and in October-2010Salinity ranged from 240 to 2450 ppm.
AlkalinityIn the present study, Alkalinity in May-2010
ranged from 100 to 650 ppm while in October-2010Alkalinity ranged from 110 to 710 ppm.
PhosphateIn the present study, Phosphate in May-
2010 ranged from 13 to 41 mg/l and in October-2010 Phosphate ranged from 10 to 39 mg/l. Theevaluated value of phosphate in the present studyis higher than the prescribed value14. The highervalue of phosphate is mainly due to the use offertilizers and pesticides by the people residing inthis area. If phosphate is consumed in excess,phosphine gas is produced in gastro-intestinal tracton reaction with gastric.
NitrateIn the present study, Nitrate in May-2010
ranged from 85 to 445 mg/l and in October-2010Nitrate ranged from 92 to 423 mg/l. The tolerancerange for Nitrate is 20-45 mg/l. Nitrate nitrogen isone of the major constituents of organism alongwith carbon and hydrogen as amino acids proteinsand organic compounds in the bore-well water15. Ifthe nitrate reduces to nitrite then it causesmethaemoglobinaemia in infants16-18 and alsodiarrhea.
SulphateIn the present study, Sulphate in May-2010
ranged from 130.28 to 362.07 mg/l and in October-2010 Sulphate ranged from 109.25 to 359.55 mg/l.The tolerance range of Sulphate is 200-400 mg/l12.
Total hardnessIn the presence study, Total hardness in
May-2010 ranged from 115 to 960 ppm and inOctober-2010 Total hardness ranged from 85 to 820ppm. The tolerance range for Total hardness11 is300-600 ppm.
ChlorideIn the present study, Chloride in May-2010
ranged from 122.2 to 1465.7 mg/l and in October-2010 Chloride ranged from 68.9 to 1257.5 mg/l.While the tolerance range for chloride is 200-1000mg/l10.

171BHESHDADIA et al., Curr. World Environ., Vol. 7(1), 169-173 (2012)Ta
ble
1:
An
alys
is r
esu
lt o
f th
e sa
mp
les
colla
cted
fro
m m
orb
i-m
alia
ter
rito
ry in
May
- 2
010
S.
Nam
e o
f S
amp
leTe
mp
D.O
.P
HTu
rb.
Con
d.T.
D.S
.S
alin
ityA
lkal
i-P
hosh
Sul
p-N
itra
teFl
ouri
deTo
tal
Ch
lori
de
No
:S
tatio
n(0 C
)(p
pm
)(N
TU
)(m
ho
nity
ph
ate
hat
e(m
g/I)
(mg
/I)H
ard
nes
(mg
/I)/c
m)
(pp
m)
(pp
m)
(pp
m)
(mg
/l)(m
g/I)
(pp
m)
1S
hri R
am S
ocie
ty30
.44.
18.
700.
222.
10×
10-3
10
10
10
00
65
01
615
8.18
44
11.
11
15
162.
52
Yadu
nand
an S
ocie
ty30
.25.
57.
100.
232.
47×
10-3
12
80
12
70
51
02
029
2.25
87
1.0
30
529
8.9
3P
anch
avat
y S
ocie
ty31
.74.
48.
420.
081.
71×
10-3
85
58
45
25
02
126
5.33
42
00.
96
10
305.
24
Jain
Der
asar
29.6
4.5
8.48
0.39
2.20
×10
-31
11
01
09
02
50
30
275.
022
65
1.1
51
228
5.2
5G
ayat
ri N
agar
31.5
6.8
8.59
0.15
6.15
×10
-33
07
03
06
03
70
20
230.
551
91
1.2
96
014
65.7
6B
hagv
ati
Par
k31
.06.
68.
750.
103.
37×
10-3
16
70
16
60
60
04
114
2.18
41
71.
14
38
440.
37
Sci
ence
Col
lege
32.6
4.9
8.56
0.35
1.82
×10
-39
40
93
01
00
20
168.
624
45
1.0
73
439
8.7
8R
elif
Nag
ar30
.83.
98.
660.
182.
37×
10-3
12
25
12
10
35
01
822
0.47
13
50.
93
60
395.
1
9B
huvn
eshw
er P
ark
31.5
5.4
8.37
0.15
2.23
×10
-31
16
51
15
01
10
19
321.
444
15
1.2
69
045
2.6
10
Ken
al R
oad
30.1
7.3
8.39
0.31
0.98
×10
-34
60
45
51
50
36
198.
213
30
1.0
30
514
5.6
11
Mat
am C
hock
31.7
6.9
8.62
0.18
6.06
×10
-33
04
03
03
03
90
20
230.
482
05
1.2
95
014
50.7
12
Bhi
sti V
ad30
.75.
58.
770.
174.
35×
10-3
21
10
21
00
60
03
422
9.28
28
50.
82
05
688.
41
3R
ail.
Sta
tion
Roa
d31
.36.
78.
710.
113.
33v1
0-31
69
01
68
06
00
38
151.
124
16
1.1
44
044
5.7
14
Kha
riva
di31
.85.
88.
290.
135.
10×
10-3
26
10
25
95
13
01
626
1.36
12
91.
03
50
1324
.5
15
Ram
ji M
andi
r C
hock
31.5
5.9
8.78
0.41
3.46
×10
-31
82
01
81
03
10
20
290.
218
51.
22
50
666.
61
6Je
tpar
30.8
5.3
8.81
0.17
4.11
×10
-32
11
02
10
06
40
35
225.
252
99
0.9
19
766
7.3
17
Ani
yari
31.4
5.8
8.90
0.40
3.49
×10
-31
82
01
81
03
30
21
283.
238
71.
22
55
667.
2
18
Kha
khar
echi
31.5
6.4
8.28
0.21
1.37
×10
-37
30
72
02
40
20
130.
284
00
1.0
27
015
1.4
19
Sar
vad
31.9
5.8
8.28
0.18
5.21
×10
-32
58
02
57
01
30
17
260.
481
35
1.0
34
013
26.3
20
Mot
a D
ahis
hara
31.4
5.2
8.58
1.75
1.78
×10
-38
80
87
04
30
16
259.
014
30
0.9
12
515
5.8
21
Kha
khar
ada
32.2
5.6
8.58
0.49
0.74
×10
-33
99
39
01
50
13
138.
513
50
1.1
20
013
5.3
22
Jodh
apar
Nad
i30
.86.
37.
850.
291.
87×
10-3
94
09
30
21
01
526
4.41
30
70.
95
60
394.
12
3C
hach
apar
31.3
5.5
8.68
2.35
1.88
×10
-31
02
01
01
04
30
20
362.
074
13
1.0
17
530
6.6
24
Nan
i V
avad
i32
.36.
58.
690.
371.
11×
10-3
51
55
10
23
02
627
5.28
38
01.
21
98
122.
22
5N
ichi
Man
dal
31.9
5.4
8.69
0.17
1.39
×10
-36
70
66
02
90
17
149.
324
15
1.0
22
119
6.4

172 BHESHDADIA et al., Curr. World Environ., Vol. 7(1), 169-173 (2012)
Tab
le 2
: A
nal
ysis
res
ult
of
the
sam
ple
s co
llact
ed f
rom
mo
rbi-
mal
ia t
erri
tory
in o
ct -
201
0
S.
Nam
e o
f S
amp
leTe
mp
D.O
.P
HTu
rb.
Con
d.T.
D.S
.S
alin
ityA
lkal
i-P
hosh
Sul
p-N
itra
teFl
ouri
deTo
tal
Ch
lori
de
No
:S
tatio
n(0 C
)(p
pm
)(N
TU
)(m
ho
nity
ph
ate
hat
e(m
g/I)
(mg
/I)H
ard
nes
(mg
/I)/c
m)
(pp
m)
(pp
m)
(pp
m)
(mg
/l)(m
g/I)
(pp
m)
1S
hri R
am S
ocie
ty29
.24.
18.
150.
301.
88x1
0-39
90
98
07
10
10
109.
253
41
0.9
95
240.
22
Yadu
nand
an S
ocie
ty29
.15.
47.
670.
592.
35x1
0-31
14
01
13
06
50
13
180.
239
51.
02
70
245.
83
Pan
chav
aty
Soc
iety
30.6
5.8
8.49
0.97
1.32
x10-3
72
07
10
43
02
218
7.32
41
10.
94
80
211.
14
Jain
Der
asar
29.2
5.5
8.48
0.49
1.88
x10-3
91
09
00
35
02
722
2.30
23
21.
03
90
245.
35
Gay
atri
Nag
ar30
.37.
68.
310.
444.
97x1
0-32
46
02
45
05
90
19
208.
571
79
1.1
82
011
70.7
6B
hagv
ati
Par
k30
.17.
58.
400.
172.
25x1
0-31
38
01
37
06
70
35
139.
353
67
1.0
33
034
1.5
7S
cien
ce C
olle
ge31
.85.
88.
350.
521.
28x1
0-35
10
49
05
90
18
141.
724
12
0.9
61
430
8.7
8R
elif
Nag
ar29
.64.
98.
900.
511.
58x1
0-37
80
77
04
50
15
192.
371
10
1.0
15
017
7.8
9B
huvn
eshw
er P
ark
30.2
6.3
8.35
0.57
1.27
x10-3
58
05
70
21
01
928
5.45
35
91.
13
20
178.
71
0K
enal
Roa
d29
.28.
38.
470.
380.
95x1
0-34
60
45
03
30
32
175.
253
18
1.0
32
013
0.2
11
Mat
am C
hock
30.7
7.9
8.27
0.44
4.85
x10-3
24
40
24
30
57
02
020
0.48
17
21.
08
00
1161
.51
2B
hist
i Vad
30.2
6.6
8.66
0.36
2.12
x10-3
10
20
10
10
43
03
521
1.25
29
00.
91
95
348.
91
3R
ail.
Sta
tion
Roa
d30
.27.
48.
490.
202.
24x1
0-31
36
01
35
06
70
34
131.
153
70
1.0
34
734
2.5
14
Kha
riva
di30
.66.
58.
291.
204.
40x1
0-32
19
02
18
01
10
16
239.
481
17
1.2
32
012
57.5
15
Ram
ji M
andi
r C
hock
30.4
6.5
8.58
0.54
3.10
x10-3
15
60
15
50
47
02
027
1.72
94
1.0
25
061
2.2
16
Jetp
ar30
.36.
38.
690.
372.
12x1
0-31
05
01
04
04
30
39
210.
212
91
1.0
18
034
9.1
17
Ani
yari
30.4
6.5
8.58
0.52
3.14
x10-3
15
50
15
40
45
02
227
8.23
92
1.1
22
062
0.9
18
Kha
khar
echi
30.4
7.2
8.30
0.15
1.48
x10-3
74
07
30
29
02
311
5.39
37
71.
12
60
141.
11
9S
arva
d30
.76.
78.
351.
274.
38x1
0-32
19
52
18
01
30
17
232.
581
37
1.1
31
012
45.2
20
Mot
a D
ahis
hara
30.5
6.3
8.73
0.31
0.88
x10-3
44
44
40
22
01
523
5.11
42
31.
01
30
148.
72
1K
hakh
arad
a31
.26.
78.
550.
820.
51x1
0-32
47
24
01
70
13
138.
513
45
1.2
17
071
.52
2Jo
dhap
ar N
adi
30.3
7.2
8.27
0.65
1.25
x10-3
65
06
40
21
01
524
5.12
33
30.
93
50
259.
52
3C
hach
apar
30.3
5.8
9.02
4.60
1.70
x10-3
83
08
20
52
02
535
9.55
42
11.
08
524
8.8
24
Nan
i V
avad
i31
.17.
28.
230.
580.
77x1
0-33
84
38
03
50
29
276.
383
71
1.2
13
568
.92
5N
ichi
Man
dal
31.2
6.4
8.19
0.59
1.80
x10-3
89
08
70
37
01
814
8.21
40
11.
22
95
342.
4

173BHESHDADIA et al., Curr. World Environ., Vol. 7(1), 169-173 (2012)
FluorideIn the present study, Fluoride in May-2010
ranged from 0.8 to 1.2 mg/l and in October-2010Fluoride ranged from 0.9 to 1.2 mg/l. While thetolerance range for Fluoride is 1.0 to 1.5 mg/l10.
The study has shown that the essentialelements in water like TDS, Salinity, Phosphate,Nitrate, pH, Total hardness, Chloride are higher thantolerance range. There fore, the bore well water inthis territory is not drinkable.
ACKNOWLEDGMENTS
The Principle Investigator is thankful toUGC for financial assistance in the form of MinorResearch Project [F No. 47-550/08 (WRO) Dated:-15/01/2009]. The Principle Investigator is alsothankful to The Sarvodaya Education Society, Morbiand the Principal, M. M. Science College, Morbi, forproviding necessary facilities.
REFERENCES
AWWA, Washington (1985).10. International Standard for Drinking Water, 3rd
Edn., WHO, Geneva (1971).11. The Gazette of India: Extraordinary, Part-II,
3: 11 (1991).12. Dhembare A. J., Pondhe G.M. and Singh
C.R., poll. Res., 17: 87 (1998).13. Mekee J.E. and Wolf H.W., Water Quality
Criteria. The Resources Agency ofCalifornina State Water Quality ControlBoard (1978).
14. APSFSL, Andhra Pradesh State ForensicScience Laboratories, Annual Report(1988).
15. Miller D.G., Nitrate in Drinking Water, WaterResearch Centre, Medmenham (1981).
16. NEERI: National Environment EngineeringResearch Institute, Disinfection of SmallCommunity Water Supplies, Nagpur (1972).
17. White J.W. and Agri J., Food Chem., 23: 886(1975).
18. Mushtaq Hussain, T.V.D. Prasad Rao, H. AliKhan and M. Satyanarayan. Orient. J. Chem.27(4): 1679-1684 (2011).
1. Rana A.K., Kharodawala M.J., Patel J. M, RaiR.K., Patel B.S. and Dabhi, Asian J.Chem.,14: 1209 (2002).
2. Rana A.K., Kharodawala M.J., Dabhi H.R.,Suthar D.M., Dave D.N., Patel B.S. and RaiR.K., Asian J. Chem., 14: 1178 (2002).
3. Bhoi D.K., Raj D.S., Mehta Y.M., ChauhanM.B. and Machhar M.T., Asian J.Chem., 17:404 (2005).
4. Hamilton P.A. and Helsel D.K., Ground Water,33: 2 (1995)
5. Broun E., Skovgstd M.W. and Fishman M.J.,Method for Collection and Analysis of waterSamples for Dissplved Minerals and Gases,5: (1974)
6. Manivasagam N., Physico-chemicalExamination of water, Sewage and IndustrialEffluents, Pragati Prakashan, Meerut (1984).
7. Vogel A.I., Text Book of Quantitative InorganicAnalysis, 4th Edn., ELBC, London (1978).
8. H.C. Kataria and Shalini Sharma, Orient J.Chem. 26(1): 337-338 (2010).
9. APHA: American Public Health Association,Standard Methods for Examinnation of waterand Wastewater, 16th Edn., APHA-WPCF-

INTRODUCTION
Neem (Azadirachtin indica) is a traditionaland highly esteemed medicinal tree for the peopleof Indian sub-continent.It is one of the mostpromising medicinal plant, having a wide spectrumof biological activity, well known for its insecticidalproperties (ICAR, 1993). Biological activities andmedicinal properties of neem have beenextensively reviewed by Biswas et al (2002).Azadirachtin (a tetranotriterpenoid) is one of themajor components (Kraus et al., 1981; Broughtonet al., 1986) of neem, which have pesticide property.In view of the environmental problems caused bythe use of synthetic chemicals and the growingneed for alternative methods of pest control thatminimize this damage, there has been extensiveresearch on pest control by substances from plants.One of the most promising natural compounds isazadirachtin, an active compound extracted fromthe neem tree. Recently neem based pesticidesare popularised due to their effectiveness, cheaperprice and comparatively safe for users, which isused widely in several states of India. However,
Current World Environment Vol. 7(1), 175-178 (2012)
Acute Toxicity and Behavioural Responses ofLabeo rohita (Hamilton) to a Biopesticide “NEEM-ON”
IMTIYAZ AHMAD BHAT1*, BILAL AHMAD BHAT1, SANTOSH VISHWAKARMA1,ALOK VERMA2 and GEETA SAXENA1
1Department of Zoology, Government Science and Commerce College Benazir,Bhopal - 462 008 (India).
2Department of Zoology, Government College Lateri, Vidisha - 464 114 (India).
(Received: January 01, 2012; Accepted: February 27, 2012)
ABSTRACT
The objective of this study was to determine the toxicity of the neem biopesticide azadirachtin(NEEM-ON, Brand name) on the freshwater fish ‘Labeo rohita’. Fishes were exposed to variousconcentrations of botanical insecticide azadirachtin for 96 h and the percent mortality was recorded.The 96h LC50 value determined by Finney’s Probit Analysis Method was found to be 42.66 ppm.Behavioural patterns were observed critically during the whole experiment. The test fish exhibitederratic swimming, increased surfacing, decreased rate of opercular movement, reduced agilityand inability to maintain normal posture and balance with increasing exposure time.
Key words:Toxicity, Azadirachtin, NEEM-ON, Labeo rohita, LC50, Behavioural changes.
neem has been found to be toxic to non-targetorganisms where it induces marked alterations inexperimental animals (Mahboob et al., 1998;Anjaneyulu et al., 1999; Mondal et al., 2007).
Fishes are considered as good indicatorsof aquatic pollution. They are highly sensitive to thealterations in the quality of water. Labeo rohita wasselected as the test species. The present study wasaimed to determine the 96h LC50 value andbehavioural response of a neem based pesticide“NEEM-ON” to the freshwater fish Labeo rohita.
MATERIAL AND METHODS
BiopesticideNEEM-ON (Manufactured by Jai Kissan
Agro Pvt. Ltd., Sangam nagar, Indore, M.P.) wasused in this study. It is based on neem seed kernelextract containing a minimum of 0.15% EC(1500PPM) of azadirachtin as active ingredient.
Test animalLabeo rohita weighing 58±3g and

176 BHAT et al., Curr. World Environ., Vol. 7(1), 175-178 (2012)
Table 1: The graph showing linear curve between probit mortality of fishagainst log concentration in L. rohita on exposure to Neem-on.
Conc. Log10 No.of No. of Dead Mortality Probit(ppm) Conc. Fishes (96h) (%)Control 10 0 0
40 1.6021 10 0 041 1.6128 10 1 10 3.7242 1.6232 10 3 30 4.4843 1.6335 10 6 60 5.2544 1.6435 10 8 80 5.8445 1.6532 10 10 100
average length of 15cm were collected from thePatra Fish Farm, Berkhedi, Bhopal, Madhyapradesh. The fishes were acclimatized to thelaboratory conditions for 15 days. They were feddaily with commercial fish pellets.Water wasrenewed after every 24hrs. Physio-chemicalcharacteristics of water were determined andmaintained.
Experimental procedureThe experiments were conducted in a
series of glass aquariums (30 litre capacities) filledwith 20 litre tap water. The stock solution was preparedand the required quantity of azadirachtin was drawnfrom this stock solution to find out the LC50 value for96 h. Different concentrations were prepared andfor each concentration a control was maintained. Tenacclimatized fishes of uniform size were exposed toeach concentration. Preliminary tests were carriedout to find out the median lethal concentration (LC50)of the fish to azadirachtin for 96h by Fenney’s ProbitAnalysis Method. The control and the exposed fishwere aerated frequently to prevent hypoxic conditionof the medium.The control and azadirachtin exposedfish were kept under continuous observation duringthe experiment period. Feeding to fishes was stoppedduring the experiment. Behaviour of the test fisheswas observed and the dead fishes were removedand recorded from time to time during 96 hr exposureperiod. The water in the containers was changedevery 24 hr and a constant concentration of Neem-on was maintained during the period of exposure.
RESULTS
The maximum concentration at which zeropercent mortality and minimum concentration atwhich 100% mortality of Labeo rohita wereobserved was at 40 ppm and 45ppm respectively.The determination of 96h LC50 value of Neem-on toLabeo rohita was found to be 42.66ppm by Finney’sProbit Analysis Method (1971) and is depicted inthe graph.
In this study, Labeo rohita was subjectedto various concentrations of Neem-on and itsbehavioral changes were observed. The behavioraland the swimming patterns of the fish were normalin case of control group and there was no mortality.After the exposure of fishes to Neem-on, variousbehavioral changes were observed. First theschooling of fishes starts disrupting and thenabnormal swimming behavior increases. The fisheswere observed to hit the aquarium walls. Theopercular movement initially increases and thendecreases with rising toxicant concentration in theexposed fishes. Vertical and downward swimmingpatterns were observed. Loss of balance increasedand the color of the fish were observed to get lighterwith an increased secretion of mucus. Surfacingfrequency and gulping of surface water withoccasional coughing increases remarkably inexposed fishes. Defecation was increased and morefecal matter was found at the bottom of theaquarium than control. Finally due to complete loss

177BHAT et al., Curr. World Environ., Vol. 7(1), 175-178 (2012)
of balance, fishes sank to bottom with their ventralside facing upwards. After 96h exposure of pesticideto fishes, at 45ppm hundred percent mortality wasobserved.
DISCUSSIONS
The acute toxicity values of several neemproducts for different fish species have beenreported earlier by many workers. Das et al., 2002have studied the acute toxicity of neem in thefingerlings of Indian major carps i.e., Labeo rohita,Catla catla and Cirrhinus mrigala and the 96h LC50
values were found to be 2.36, 2.04 and 2.78ppmrespectively. Hassanein et al., 2007 reported the96h LC50 value of a neem biopesticide (Triology)on the grass carp fish, Ctenopharyngodon idellaand was found to be 112ppm. In the present study,the 96h LC50 value of Neem-on on the Labeo rohitawas found to be 42.66ppm. The variation in the LC50
values is due to its dependence upon variousfactors viz., sensitivity to the toxicant, itsconcentration and duration of exposure; type andsize of the test animal and so on.
Behavioral changes are the most sensitiveindication of potential toxic effects. Impact of differentpesticides on the behavior of Labeo rohita havebeen studied by various workers (Marigoudar etal., 2009; Anita et al., 2010; Nagaraju et al., 2011).
Fishes exhibited a number of behavioralchanges when they were exposed to differentconcentrations. The opercular movement of fishesinitially increases and then gradually decreases.Decreased opercular movement probably helps inreducing absorption of pesticide through gills.Abnormal swimming and loss of balance wascaused by the decifiency in nervous and muscularcoordination which may be due accumulation ofacetylcholine in synaptic and neuromuscularjunctions (Rao et al., 2005). A thick coat of mucuswas observed all over the body of the fish, makingthe fish slimier. The fish were swimming with thebelly upwards and in zig zag motion. There werealso erratic and parallel movements observed inthe fish, indicating loss of equilibrium while incontrol, the fish was swimming normally withoutloss of equilibrium. The fish sometimes becomeshighly excited and was observed to hit the aquariumwalls at a very fast speed. Due to this hyperexcitibilitybleeding from the snout was observed in somefishes.
Neem-on, a biopesticide is an ecofriendlyproduct used against different pest species but itseffect on non-target organisms can not be ruledout. So, neem based pesticides should be usedcautiously.
Log10 concentration
Fig. 1:
Pro
bit
Val
ue

178 BHAT et al., Curr. World Environ., Vol. 7(1), 175-178 (2012)
REFERENCES
1. ICAR: World Neem Conference SouvenirICAR, Bangalore, India (1993).
2. Biswas, K., Chattopadhyay, I., Banerjee, R.K. and Bandyopadhyay, U. Biologicalactivities and medicinal properties of neem(Azadirachta indica). Current Science, 82:1336-1345 (2002).
3. Kraus, R.K., R.Cramer and G.Sawitzki.Tetranortriterpenoids from the seeds ofAzadirachtin indica. Phytochemistry, 20(1):117 (1981).
4. Broughton, H.B., S.V.Ley, A.M.Z. Slawin, J.D.Williams and E.D.Morgan: X-raycrystalographic structure determination ofdetigloyldihydroazadirachtin andreassignment of the structure of the limionoidinsect antifeedent azadirachtin .J.Chem.Soc.Chem. Commun., 391-401(1986).
5. Mahboob, M., J. Siddiqui and K. Jamil: Theeffect of subacute administration of a neempesticide on rat metabolic enzymes. J.Environ. Sci. Hlth., 33: 425–438 (1998).
6. Anjaneyulu, G.V.S.R. and K.D.Mishra. Acutetoxicity of Neemax (Neem Seed Powder) toa freshwater fish, Puntius ticto Ham. PollutionResearch . 18(4): 391-394 (1999).
7. Mondal, D.; Barat, S. and Mukhopadhyay, M.K.: Toxicity of neem pesticides on a freshwater loach Lepidocephalichthys guntea(Ham.) of Darjeeling district in west Bengal.J. Environ. Biol. 28(1): 119-122 (2007).
8. Finney, D.J.: Probit Analysis, 3rd Edn.Cambridge University Press, London(1971).
9. Das, B. K., Mukherjee, S. C., and Murjani, O.
Acute toxicity of neem (Azadirachta indica)in Indian major carps. Journal of Aquaculturein the Tropics, 17: 23-33 (2002).
10. Hassanein, H. M. A; Okail, H. A. andMohamed, N.K. Biochemical changes inproteins and DNA in Ctenopharyngodonidella due to environmental pollution withthe biopesticide (Trilogy). 10 ICCA,Garyounis University, Benghazi, Libya: 18-21 (2007).
11. Marigoudar S.R., R.Nazeer Ahmed andM.David. Impact of Cypermethrin onbehavioural responses in the freshwaterteleost, Labeo rohita (Ham.). World Journalof Zoology. 4(1): 19-23, (2009).
12. Anita S, K.Sobha and K.S.Tilak. A study onacute toxicity, oxygen consumption andbehavioural changes in the three majorcarps, Labeo rohita, Catla catla and Cirrhinusmrigala exposed to Fenvalerate. BioresearchBulletin. 33-40 (2010).
13. Nagaraju B, Sudhakar P, Anitha A, HaribabuG and Rathnamma V.V.: Toxicity evaluationand behavioural studies of freshwater fishLabeo rohita exposed to Rimon. InternationalJournal of Research in Pharmaceutical andBiomedical sciences. ISSN., 2229-3701(2011).
14. Rao, J.V., G.Begum, G. Pallela, P.K.Usmanand R.N.Rao. Changes in behavior andbrain acetylcholinesterase activity inmosquito fish Gambusia affinis in relation tosublethal exposure of chlorpyrifos. Int. J.Environ. Res. Public Health, 2(3-4): 478-483(2005).

INTRODUCTION
Education is not preparation for life; education islife itself.
The time it takes to earn the degree ineducation today is based on an increasinglyoutdated model: so many hours in a classroomentitle a student to a receipt in the form of a grade,and so many receipts can be redeemed for acredential in the form of a degree... Education todayis just beginning to think of shifting the basis ofcertification from time served to skills andknowledge obtained.
Multimedia holds great promise forimproving the quality of education becausemultimedia provides the ability to illustrate ideaswith visual, audio, text or any combination of mediaso learners can create new ways of communicatingideas.
The role that information technologies areplaying and will continue to play in the area ofeducation , explains the ways that these forms ofmass media are being applied in education to makeit a more accessible, more effective, and moreefficient. It illustrates that these forms of media holda great deal of potential, and will become moreand more important to education, multimediateaching strategies allow for people to becomeeducated and trained, who in the past would nothave been given such an opportunity.
Advantages of MultimediaThe impact of technology on Education
has been tremendous. By adopting the various
Current World Environment Vol. 7(1), 179-182 (2012)
Evolution of Child Development in the Multimedia Environment
ASHVINI JOSHI and VINITA BHATNAGAR
Sri Satya Sai College of Engineering, Bhopal (India).
(Received: March 20, 2012; Accepted: May 27, 2012)
technological tools that are available today we havebeen able to enhance learning and teaching at thesame time. As a teacher, facilitator reading orspeaking out the information to the students is notsufficient. A class or a session is like a presentation,and the presenter (teacher) needs to plan andprepare his/her session. Along with renderinginformation, it is the learning outcome to beachieved that has to be kept in mind. Technologyhelps and aids teachers to enhance this learningoutcome. It looks at the argument that multimediacan educate children by entertaining and keepingtheir interest while they learn. Multimedia is a toolthat can be used to increase the learning outcomeof a session. In fact, it is a combination of multipletechniques, Today’s children and those of the futurewill grow up immersed in the multimediaenvironment. I anxiously wait to see how thesechildren will integrate the various media into theirenvironments, creating and expanding theircognitive, social, physical, and creative capacities.The “wall” of information and technology thatdivided adults and children in the past is now notso thick, as children are now able to access alltypes of information easily using these technologies.They are also able to engage themselves in manytypes of virtual experiences which will allow themto broaden their skills and imagination. However,the question of how these children should bestutilize, to their fullest potential, multimediatechnologies and how adults who guide thesechildren should scaffold them still remains unclear.
Multimedia Encourages New Learning Styles“Students must be the change they want
to bring in world”

180 JOSHI & BHATNAGAR, Curr. World Environ., Vol. 7(1), 179-182 (2012)
Modern computer and communicationtechnology is becoming common place in a growingnumber of schools. Add to this the multimediacapabilities of the web and students literally havethe world of information at their fingertips, with muchof this information available to them in ways easyfor them to grasp. As new media are used bystudents both as their source of raw informationand as the tools through which they express theirmastery, the role of educator changes. Instead ofteachers providing “content” to students, they noware freed to help students find “context” andmeaning in their studies.
Multimedia as the catalyst“Education’s purpose is to replace an emptymind with an open one.”
Education has historically prepared moststudents to live productive lives in a family within asociety. This technology can serve as a catalyst tohelp educators capitalize on the unique skills whicheach learner brings to the classroom. Multimediatechnology can support an education environmentin which´ All children can learn-the computer can
enhance the learning process, fromenabling communication for a child who isseverely disabled, to providing insight andnew ways of dynamically visualizingconcepts for children who have specialtalents.
´ Cultural heritages are valued and nurtured-technology can help teachers providelearning environments that are not onlyculturally sensitive to the heritage of each oftheir students, but culturally affirmative andrich in varied language experiences.
´ Learning is a lifelong process-the computercan engage both parent and child andencourage learning for both throughintergenerational sharing of language andexperience.
´ Families can become more self-sufficient-computer technology can provideindividualized programs in basic skills,literacy, health and nutrition, and careerdevelopment, not only in formal educationenvironments, but in community centers,museums, libraries, and the home.
“One’s destination is never a place butrather a new way of looking at things”
Our goal must be to harness technologyto provide the most engaging and dynamic systemever used in education, so that school once againembraces culture and learning in our society. Theprocess of education must deal with the needs ofstudents to develop both macro and micro strategiesfor dealing with their world. One effect of theworldwide information processing capability is thatwork can now move to wherever skilled labor isavailable. Countries are now linked financially,economically, socially, culturally, and politically asnever before, and this linkage is constantly growing.This can create new income and demand for moregoods and services in countries which haveeducated their populations to deliver the skills indemand for the information age; it can rapidly draincountries whose citizens do not develop skills tokeep pace with the emerging work opportunities
“The surest way to grow the global marketfor educational media is to grow the globalaudience of educated people.”
Benefits of multimedia technologyMultimedia technology is intended to
improve education over what it would be withouttechnology. Some of the claimed benefits are listedbelow:Easy-to-access course materials
Instructors can post the course material orimportant information on a course website, whichmeans students can study at a time and locationthey prefer and can obtain the study material veryquickly
Student motivationComputer-based instruction can give
instant feedback to students and explain correctanswers. Moreover, a computer is patient and non-judgmental, which can give the student motivationto continue learning. Students usually learn morein less time when receiving computer-basedinstruction and they like classes more and developmore positive attitudes toward computers incomputer-based classes

181JOSHI & BHATNAGAR, Curr. World Environ., Vol. 7(1), 179-182 (2012)
Wide participationLearning material can be used for long
distance learning and are accessible to a wideraudience
Improved student writingIt is convenient for students to edit their
written work on word processors, which can, in turn,improve the quality of their writing. According tosome studies, the students are better at critiquingand editing written work that is exchanged over acomputer network with students they know
Subjects made easier to learnMany different types of educational
software are designed and developed to helpchildren or teenagers to learn specific subjects.Examples include pre-school software, computersimulators, and graphics software
“An educational system isn’t worth a greatdeal if it teaches young people how to make a livingbut doesn’t teach them how to make a life.”
Knowledge is innately free and rightlybelongs in the public domain. We just want learningto be easy, personalized. Technology is anincreasingly influential factor in education.Computers and mobile phones are used indeveloped countries both to complementestablished education practices and develop newways of learning such as online education (a typeof distance education). This gives students theopportunity to choose what they are interested inlearning. Technology offers powerful learning toolsthat demand new skills and understandings ofstudents, including Multimedia, and provides newways to engage students, such as Virtual learningenvironments. Technology is being used more notonly in administrative duties in education but alsoin the instruction of students. The use oftechnologies such as PowerPoint and interactivewhiteboard is capturing the attention of students inthe classroom. Technology is also being used inthe assessment of students. One example is the
Audience Response System (ARS), which allowsimmediate feedback tests and classroomdiscussions.
Information and communicationtechnologies (ICTs) are a “diverse set of tools andresources used to communicate, create,disseminate, store, and manage information.” Thesetechnologies include computers, the Internet,broadcasting technologies (radio and television),and telephone. There is increasing interest in howcomputers and the Internet can improve educationat all levels, in both formal and non-formal settings.Older ICT technologies, such as radio andtelevision, have for over forty years been used foropen and distance learning, although print remainsthe cheapest, most accessible and therefore mostdominant delivery mechanism in both developedand developing countries.
Yesterday’s impossible is today’s normal.What we want is to see the child in pursuit
of knowledge, and not knowledge in pursuit of thechild.”
“Education is a weapon, whose effectdepends on who holds it in his hands and at whomit is aimed.”
It also exposes the other side of theargument— that children are merely beingentertained, learning how to passively watch, whiledeveloping shorter attention spans and the needfor quick stimuli , also study the difference betweentraining and critical thinking with the use ofmultimedia.
This does not mean, however, that anyprogram filled with rich media elements isautomatically valuable. Our task in education is toengage, not entertain, the learner. Our new toolsprovide the potential to do this, but the art of softwaredevelopment still requires careful thought aboutboth the pedagogy and curriculum.
REFERENCES
1. Apple, Multimedia demystified. New York:Random House (1994).
2. Anderson, J. R., Cognitive psychology andits implications. New York: W.H. Freeman

182 JOSHI & BHATNAGAR, Curr. World Environ., Vol. 7(1), 179-182 (2012)
(1990).3. Barrett, E. & Redmond, M., Contextual media.
Cambridge, MA: MIT Press (1995).4. Biocca, F. & Levy, M.R., Communication in
the age of virtual reality. Hillsdale, NJ:Lawrence Erlbaum (1995).
5. Blattner, M.M.., In our image: Interface designin the 1990s. IEEE Multimedia, 25-36 (1994).
6. Clark. R.E., Reconsidering research onlearning from media. Review of EducationalResearch, 53: 445-459 (1983).
7. Dannenberg, R. & Blattner, M., The trendtoward multimedia interfaces. In Blattner, M.and Dannenberg, R. (Eds.) MultimediaInterface Design. New York: ACM Press(1992).
8. Davenport, G., Seeking dynamic, adaptivestory environments. IEEE Multimedia, 3: 9-13 (1994).
9. Davenport, G. Seeking dynamic, adaptivestory environments. IEEE Multimedia, 3: 9-13. (1994).
10. Davenport, G., Evans, R. & Halliday, M.,Orchestratingdigital micromovies. Leonardo,26: 4 (1993).
11. Eberts, R.E. User interface design.
Englewood cliffs, NJ: Prentice-Hall (1994).12. Erickson, T.D., Working with interface
metaphors. pp65-73 in Laurel, B. ed. Art ofhuman computer interface design. Reading,Massachusetts: Addison Wesley (1990).
13. Falk, D., & Carlson, H., Learning to Teachwith Multimedia. T.H.E. Journal, pp. 96-101(1992).
14. Farah, M.J., Knowledge from text andpictures: A neuropsychological perspective.In Mandl, H. & Levin, J.R. (Eds.) Toffler, Alvin(1990) Powershift (1989).
15. Utz, Peter. All You Need is LV (1994).16. Van Tassel, Joan., Advanced Television
Systemsl. Newton, MA: Focal Press (1996).17. Waern, Y., Cognitive aspects of computer
supported tasks. Chicago, John Wiley(1989).
18. Waring, Becky., Video Scan Converters: Notas Simple as they Seem. New MediaMagazine, pp. 37-42 (1994).
19. Wilson, S. Multimedia design with hypercardPrentice Hall.
20. Wimberly, D. & Samsel, J., Interactive writer’shandbook. Los Angeles: Carronade Group(1995).

INTRODUCTION
A pesticide is a chemical substance usedfor preventing, destroying, repelling or mitigating apest, which can be an insect; rodent, bind, weed orfungus, as well as micro organism like bacteria andviruses. Pesticides can be broadly classified asinsecticides, herbicides, fungicides, rodenticides,and antimicrobials, with many subclasses. Themajor insecticide groups are the organochlorines,organophosphates, carbonates and pyrethroids.Pesticides are considered hazardous chemicalsand improved the regulation of pesticidesparticularly in developed countries, a health riskremains. Both the potency of primary factor affectingthe level of risk.
The use of pesticides provided animportant socioeconomic benefit to the areas ofagriculture and food productions. Pesticideproduction is market driven with high investment inindustrialized countries. In the U.S, 77% of allpesticides are used. In developing countries, publichealth programs represent an important use of
Current World Environment Vol. 7(1), 183-186 (2012)
Analysis of Pesticide Residues in Winter Fruits
CHITRA GUPTA¹, ROHIT VERMA¹*, RAVI KANT KANNAUJIA¹ and FAROOQ AHMEDWANI²
¹Department of Chemistry , Bundelkhand University Jhansi - 284 128 (India).¹Department of Chemistry, APS University Rewa - 486 003 (India).
(Received: February 20, 2012; Accepted: May 27, 2012)
ABSTRACT
Fruit samples of winter fruits (apple, grapes, banana cheeku, papaya, lemon) forpesticideresidues employing a multiresidue analysis by gas liquid chromatography.All the fruitsamples showed the presence of residues with one or other group of pesticides.Some samplesexceeded the quantification limit.The increasing interest in the pesticides in fruit samples is justifiedfrom the enological point of view.In this paper pesticide mobility on fruit samples was studied.Outof nine pesticides tested for most of the sample show very high levels of malathion ,while otherpesticides residues are with in the established tolerance,BHC endosulphan dieldrin are with inlimits.thus consumer intake of pesticides from fruit samples studied in this work should be reducedbywashing fruits with water .In this paper multiresidue determination of pesticides are discussedusing G.C.
Key words: Pesticides,GC, Fruits residues.
pesticides in the control of vector borne diseaseslike malaria. Countries in Africa, Asia and centralSouth America are highly dependent on pesticides.Other areas in which pesticides are used includeforestry, gardening and lawn care horticulture andlivestock and to a large extent domestic use in home.In the U.S pesticides are used in around 70 millionhomes.
Usage of OCP’s have been prohibited inmost of countries, but 70% of banned pesticideslow cost, in India DDT was banned for use inagriculture in 1985, but still 7500 metric tons peryear is used here.
The problems of pesticides residues incrops has been attracting growing attention the useof organic insecticides for the control of insect oncrops has become common during the past fewyears. [1]
The detection and identification ofpesticides in our environment is a problem ofincreasing public interest. [2-4]

184 GUPTA et al., Curr. World Environ., Vol. 7(1), 183-186 (2012)
Pesticides residues in food has become aconsumer safety issue. The consumer has a right toknow how much pesticide gets in corporate in thefood he eats. At many laboratories expandedresearch programmers have been instituted tounderstand and control more fully the varied effectsof pesticides like:-1) The appraisal of the potential carcinogenicity
of ingested substances.2) Palatability and organoleptre evaluation of
fruits, meats and vegetables.3) Assimilation of detailed data on acute and
chronic toxicity for all compounds.4) Nature of plant surfaces and the chemical
modes of penetration subsequenttranslocation, distribution and metabolic fatein plants and exudation of regulatingcompounds into the soil.
5) Establishment of safety threshold levelswithin a human being without immediate orfuture harm. The short as well as long termimpact of the use of pesticides on biologicalsystems is being evaluated continuously inan effort to minimize.
Potential or latent hazards whilemaximizing the benefits derived by marking formincreased agricultural production andcommunicable disease eradication. [5]
The use of pesticides has not permittedthe control of diseases transmitted by insects butalso has led to increased food production and betterhealth.
EXPERIMENTAL
Selection of fruit samples were based ontheir availability in winter. The samples werepurchased in Jhansi. The fruits sold here are boughtfrom the near bus stand in Jhansi. The fruit sampleswas analyzed in the form, that is offered to theconsumer. For example apple, Cheeku, Papayaand grapes were analyzed with peels whereasbanana, pomegranate and coconut were analyzedwithout peels. Lemon was analyzed with peals as itis used in making pickles in the form6.
Each sample size taken 1 kg out of which
a representative substance weighting 20gram wasrandomly taken and the pesticides were extractedfor 8-10 hr at the rate (4-5) cycles per hr, in hexanein a soxhelt extractors. The rotary evaporators. Theconcentrate contained aqueous as well as organicresidue.
The organic part was extracted in hexanewith the help of a separating funnel and a pinch ofsodium sulphate was added to it. The solution thusobtained was filtered and concentrated again. Tothis 5 ml of hexane was added and the sample thusprepared was analyzed for the presence of 9pesticides by gas chromatograph (Perkin Elmer-Auto system XL) with the selective electron-capturedetector (ECD). This detector allows the detectionof contaminants at trace level concentration in thelower ppm range in the presence of multitude ofcompounds extracted from the matrix to which thesedetectors do not resend.[7] The column used wasPE-17, length 30m. ID 0.25 film 0.25 mm with a 2ml/min flow. The carrier gas and the make up gaswas nitrogen employing the splitting mode. Theoven temperature was kept at 190-2800C with aramp of 50c/min. The lam plies were calibrated(retention time, are a count) against a 10 ppmstandard mixed solution of all 9 pesticides. Eachpeak is characterized by its retention time and theresponse factor in ECD. Sample results werequantitated in ppm automatically by the GCsoftware.
One GC injection (30 min) was requiredin order to cover all 9 pesticides included in aanalysis. Hamilton micro syringes injection of thepesticide dissolved in hexane as solvent weremade directly onto the coated silanized columnsolid support, there by eliminating the possibility ofcatalytic degradation by metallic surfaces.Pesticides were identified according to theirretention time. For accurate result the concentrationof the standard was kept same.[8] The multiresiduemethod which can detect all 9 pesticides in oneanalytical run was preffered. This method ischaracterized by a broad scope of application goodrecoveries and sensitivity and low solventconsumption, coupled with good analytical qualitycontrol. The presence of marathon, DDE in therespective sample were further confirmed by HNMR(Joel, 400 MHZ) and IR (Bruker) Spectral studies.

185GUPTA et al., Curr. World Environ., Vol. 7(1), 183-186 (2012)
Table 1
Pesticide Chemical Name Molwt. Trale Name Chemical Class ADI mg/Kg/Day
α,β,γ,δ 1,2,3,4,5,6- 290.85 HCH, Organochlorine 0.008BHC GrammexaneDDT Hexachlorocyclohexane 354.41 Anofex, Organocholorine 0.02
1,1-(2,2,2-trichloro Cesarex,ethylidene) bis [4- Digmar,chlorobenzene] Gezarex
Methyl 0,0-dimethye 0-4- 263.21 Matafos, Organophasphate 0.02Parathion Nitrophenyl metacide,dalf,
Phasphorothioate GearphasMalathion Diethyl (Dimethoxy 330.36 Carbophos, Organophasphate 0.02
Thiophas meldisonPhosphorylthio Mercaptothionsuccolnate
Dimethoate 0,0 dimethye S- 229-28 Cygon400,Dem Organophasphate 0.01methylcarbo os, Dicap, rogormouylemethylphosphoridithiote
Ethion 0,0,0,1,01-tetraethyl, s-s1 384.48 Acithion, Organophasphate .002 methyloe bis Ethanox, (phosphorodithioate) Hylmox
Endsulfan 6,7,8,9,10,10- 406.96 Hexasulfan, Organochlorine .006hexachloro 1,5a,6,9,9a- Afidan,hexahydro 6,9-methano- Cyclodan2,4,3 benzadioxathiepin Beosit 3-oxide
Dieldrin 1,2,3,4,10.10- 380.9 Dieldriti, OrganochlorineHexachloro 6,7 expoxy Dieldrex, 1,4,-4a,5,6,7,8,8a, Octaloxoctahydro-1,4,5,8- Panoram D-31dimetanophthalene
Table 2: Pesticide residues, in water fruits mg/Kg.
Sample αααααBHC βββββ and γγγγγ dimethanoateδδδδδBHC Methyl MalathionEndsuffan DDT Dieldrin BHC Parathion
Apple - 0.05 - - - 2.46 - - -Pomegranate - 0.01 - - - 1.70 - - -Black grapes 0.02 0.03 - 0.02 - 2.37 0.02Green Grapes - - 0.01 - - 3.05 0.10 - 0.01Banana - - - - - 1.03Papaya 0.01 - 0.02 - - 4.19 0.01Cheeku - - 0.01 - 4.34 0.01Coconut 0.03 - 3.25Lemon - 5.66 0.31 0.01

186 GUPTA et al., Curr. World Environ., Vol. 7(1), 183-186 (2012)
HNMR and IR spectra of the standard pesticidewas taken separately and compared with that ofthe sample containing those particular pesticides.
The study including the following parameters:Fruit sample, place of origin, Methods used
and Pesticides tested for Table 1 andconcentrations found for each pesticides table 2.
Where the No. of Pesticides-1) αBHC2) α and β BHC3) Dimethanoate4) Methyl Parathion5) Malathion6) Endosulphama7) DDE8) Dieldrin9) Ethion10) DDT
CONCLUSION
The high levels of malathion is alarming.We have analyzed for only 9 pesticides where asthe presence of many others can not be ignored.Out of necessity the field of residue analyticalchemistry has emerged as a devoted specificallyto the determination of sub microgram concentrationlevels of pesticides to confirm the toleranceestablished by law for pesticides in or onagricultural forage and food crops and animalproducts. The area associated with the nature,persistence and concentration level of pesticidesresidues on produce need to be critically examinedby academic, industrial and government agenciesto ensure man’s future well being.
ACKNOWLEDGMENTS
Authors are thankful to Dr. RekhaLagarkha (Co-ordinator), Department of ChemistryBundelkhand University, Jhansi for providing thenecessary fulfill facilities.
REFERENCES
1. Agency for Toxicsubstance and DiseaseRegistry (ATSDR). Toxicological profile forHCB. Atlanta, GA, USA: US department ofHealth and Human services, Public HealthService, A TSDR (2002).
2. Agnihotri N.P Dewan RS Dixit A.K Residuof insecticides in food commodities in foodcommodities from Delhi. 1. Vegetables.Indian J. Entromal 36: 160-162 (1974).
3. American Cancer Society. Cancer facts andfigures 2003. Available at Bailey RE. GlobalHexachlorobenzene emissionschemosphere, 43: 167-82 (2001):.
4. Burns JE, Miller FM, Gomes E, Albert R:hexachlorobenzene exposure fromcontaminated DCPA in vegetablesspraymen. Arch Environ Health 29: 192-4(1974).
5. Currier MF, Mc claims CD, Barna-Lloyd G.Hexachlorobenzene blood levels and thehealth status of men in the manufacture ofchlorinated solvents. J Toxicol Health 6: 367-77 (1980).
6. Deutscher RL, Cathro KJ. Organochlorineformation in magnesium electrowinning cellschemosphere 43: 147-55 (2001).
7. FAO/WHO, joint FAO/WHO food standardsprogramme. Codex maximum limits forpesticide residue. Vol. XIII. 2nd ed Romeltaly ,(1986).
8. Gullett BK, Touati A, Hays MD. PCDD/F, PCB.HxCBZ, and PM emission factors for fireplaceand wood stove combustion in the SanFrancisco Bay Region. Environ Sci. technol37: 1758-65 (2003).

INTRODUCTION
A phytase (myo-inositol hexakisphosphate phosphohydrolase) is any type ofphosphatase enzyme that catalyzes the hydrolysisof phytic acid (myo-inositol hexakisphosphate) —an indigestible, organic form of phosphorus that isfound in grains and oil seeds— and releases ausable form of inorganic phosphorus1. Whilephytases had been found to occur in animals, plants,fungi and bacteria, phytases had been mostcommonly detected and characterized from fungi 2.In modern age of biotechnology, enzymes haveproved their market demand over other products ofbiotechnology with annual sales close to 2.0 billiondollars. Phytases (EC 3.1.3.8), phosphatases thatcatalyze the hydrolysis of phosphate moieties, havea big share in enzyme business due to itswidespread application as a feed supplement3- 6.The phytases enhance the bioavailibility ofminerals, protein and phosphorus in monogastricanimals. They reduce the phosphorus pollution inareas of intensive livestock production 7, 8. The
Current World Environment Vol. 7(1), 187-190 (2012)
A Culturing of Fungi for Phytase Productionby Solid State from Different Sources
JYOTSNA VIHNUDAS 1*, MALATHI JOJULA2 and M.A. SINGARACHARYA3
1Department of Pharm. Biochemistry, Sri Shivani College of Pharmacy, Warangal (India).2Department of Pharm. Microbiology, Sri Shivani College of Pharmacy, Warangal (India).
3Department of Microbiology, Kakatiya University, Warangal (India).
(Received: June 03, 2012; Accepted: June 29, 2012)
ABSTRACT
Supplementation with phytase is an effective way to increase the availability of phosphorusin seed- based animal feed. Fifteen different types of themophilic fungi such as Aspergillus fumigatus,Curvalaria, Pencillium Sp, Mycrothecicum, Helimenthosporium, Fusaruim Throderna, AlternariaSpices were majorly found during our study they were classified based on the morphologicalcharacterization and staining methods This isolates were isolated from the compost moderfvarious localities. Among all isolates, Aspergillus sp wasfound to be the best isolate for the phytaseproduction. Three different types of materials(rice bran, Poultry soil, Kudithi) were evaluated asgrowth substratefor phytase production by Sporotrichum thermophile. Of all the sources tested,rice bransupplemented with diluent containing (g/L); (NH4)2SO4; 5.0, KH2PO4; 1.0, Yeast extract; 2.0gavemaximum production (4.16 U/mL/min) when 4% volume of the 250 mL conical flask was usedafter 96 hrs spore inoculation at 45°C using solid-state fermentation.
Key words: Phytase, Kali, Kudithi.
thermostability of phytase suggests potentialbiotechnological applications in the pulp and paperindustry as a biological agent to remove plantphyticacid. The enzymatic degradation of phytic acidwill not produce toxic by-products, so it isenvironmental friendly 10. A large number ofmicrobes including bacteria, yeast and filamentousfungi has been used for phytase production.Selection of particular microbe depends on thenature of substrate, environmental conditions anddesired final product. Thermophilic fungihavecomplex or unusual nutritional requirementsand well-known microbes to producephytase11-14.In view of increasingdemand for phytase it isessential to produce phytase in a cost-effectivemanner. Phytase required for commercial feedpreparation must meet following specifications i.e.,thermo stability and activity over wider pH range,which is only possible withthermophilic fungi.Poultry manure is a useful nutrient source suppliesphytase and high available phosphorous corn dietson the solubility and plant uptake of P, Cu, and Znin poultry manure and soils amended with
188 VIHNUDAS et al., Curr. World Environ., Vol. 7(1), 187-190 (2012)
manure.Therefore, the present study wasconducted with the aim to isolate apotent strain ofthermophilic fungi from local habitat and optimizeafter screening for theproduction of phytase.
Aims and objectives1. To isolates and characterize the fungal
organism, which hydrolyses phytaseenzyme in high amounts.
2. To estimate the amount of Phytaseenzymeproduced from fungal micro-organisms from open natural fermenters andfrom soil near poultry farms.
3. Optimization of the condition for the activityof the enzyme phytase.
MATERIAL AND METHODS
Source of samplesSoil sample from Poultry farm waste, 2 Kali
is a fermented waste water of rice and this is usedby villagers to cook cereal food. These liquid feedof cattle are a good source of microbes,contributingto vitamins and enzymes in food. They contain a lotof bran – derived materials including phytase.
Isolation of organismsThree different samples were used to
isolate fungi which have the ability to producephytase enzyme during the growth cycle. Thepoultry soil, kali and kudith samples werecollected from Warangal and its surroundingareas. Samples were processed by serialdilution method 15. Soil samples of poultry farmswere collected in sterile polythene bags. Onegram of sample was suspended in 100 mL ofsterilized distilled water and allowed to settleover n ight a t room temperature. The so i lsuspension was further diluted up to 104-106times. One millilitre of this dilute suspensionwas then transferred to ndividual Petri platescontaining potato dextrose agar medium. Thefungal cultures were further puri f ied frombacter ia l contaminants by using 10 mg/Lcombination of penicillin and streptomycin (1:1ratio) in the Petr i plate medium. Two othersamples Kudithi and Kali were collected insterile bottles from different cattle sheds andfrom different houses of suburban locatlities ofWarangal town.
Morphological appearanceAll the isolates of fungi were identified by
microscopic examination 16,17,18. Independentcolonies of each identified isolate were picked upand transferred to potato dextrose agar (PDA) slantsfor culture maintenance. The cultures were storedin a refrigerator at 4°C for further studies.
InoculumThe spores from 3-5 days old slant culture
were wetted by adding 10 mL ofsterilized 0.005%Monoxal O.T (diacetyl ester of Sodiumsulphosuccinic acid) to eachslant. The spores werescratched with sterilized inoculating needle and thetubes wereshaken gently to break the clumps ofspores. sporesl suspension was used asaninoculum. Inoculum size was measured bymeasuring the density of spore(number of sporeper unit volume) with Haemacytometer, Neubauerimproved; precicdor HBG, Germany (Tiefe depthprofondeur 0.10 mm and 0.0025mm2 area).
Phytase assayPhytase activity was assayed after some
modification of 12 and 13 methods using Sodiumphytate as substrateand the inorganic phosphorusreleased was measured spectrophotometericallyby usingthe Taussky-Schoor reagent. Half milliliterof Sodium phytate (0.00682M) was added to0.1mL of MgSO4 (0.05M) and 0.1mL of Sodium acetatebuffer (0.2M). Enzyme solution(0.1 mL) was addedto above mixture and the mixture was incubated at50°C for 30minutes. After incubation, 1.0 mL of 10%tricarboxylic acid (TCA) was added along with2.0mL of distilled water. Mixed well and 5.0 mL ofTaussky-Schoor reagent was added.Taussky-Schoor reagent was prepared when 10.0 gAmmonium molybdate was mixedwith 10.0 mLH2SO4 (10N) and further diluted with 70.0 mL ofdeionized water. Then 5.0g of ferrous sulphateheptahydrate (FeSO4.7H2O) was added and madethe final volumeupto 100.0 mL. Absorbance wasmeasured at 660 nm by using spectrophotometerandliberated inorganic phosphate was estimatedafter comparing the absorbance with knownconcentration of KH2PO4 using same assayconditions instead of enzyme. One unit ofphytaseactivity is defined as “the amount of enzyme thatliberates one µmol of inorganicphosphate attemperature (50°C) and pH (5)”.

189VIHNUDAS et al., Curr. World Environ., Vol. 7(1), 187-190 (2012)
Statistical analysisDuncan’s multiple range tests in the form
of probability <p> valueswere used to find out thesignificant difference among replicates. Treatmenteffects werecompared after Snedecor & Cochrane(1980) using computer software Costat,3.03Berkeley, CA 94701.
RESULTS AND DISCUSSION
Both Kudithi and Kali contained microbeswhich had ability of producing phytase. Fungi Sevenstrains of five different thermophilic fungi such asAspergillus fumigatus,Humicola insolens,Rhizomucor miehei-I & II, Sporotrichumthermophile, Thermomyceslanuginosus-I & II wereisolated from compost soil and were screened forphytaseproduction. Aspergillus fumigatus produced0.04 U/mL/min of phytase while Humicolainsolens,Rhizomucor miehei-I & II, Sporotrichumthermophile, Thermomyces lanuginosus-I & II gave0.22, 0.20, 0.76, 2.20, 0.20 and 0.53 U/mL/minrespectively. Of the seventhermophilic fungal strainsscreened for phytase production, Sporotrichumthermophile wasfound to produce higherextracellular phytase when grown on solid statewheat bran (Table1). Chadha et al., (2004) isolatedand screened out thermophilic fungi and foundninethermophilic strains having the potential ofphytase production like Rhizomucorpusillus,Humicola grisea, Sporotrichum
thermophile, Humicola insolens,Thermomyceslanuginosus-I, Thermomyceslanuginosus-II, Rhizomucor miehei-I, Rhizomucormiehei-IIand Aspergillus fumigatus. Singh &Satyanarayana (2008) also investigatedthatSporotrichum thermophile has the potential forenhanced production of phytase.The main productof a fermentation process often determines thechoice of carbonsource, particularly if the productresults from the direct dissimilation of it. It iscommonpractice to use carbohydrates as carbonsource in microbial fermentation processes.Themost widely
CONCLUSIONS
Phytase which is liberated during thegrowth cycleof microbes especially fungi andbacteria, thephytase enzyme play a vital role inimproving the nourishment of plants which is a richsourceof carbon source, the study was based onthe background of Indianvillage feeds for animalswhich is rich source Of Proteins and carbohydratesthis components are been utilized by the fungi whenthey grow in kali and kudhithi and release phytaseenzyme. This phyatatic kali and kudhithi was beenused as feed for animals but there is a complicationin digestion of phyatses by animals this is liberatedout as indigested produted in to environment.Execrates of animals can be used as manure infields.
REFERENCES
1. Mullaney EJ, Daly CB, Ullah AH . “Advancesin phytase research”. Adv Appl Microbiol 47:157–199 (2000). doi: 10.1016/S0065-2164(00)47004-8. PMID 12876797.
2. Mullaney EJ, Ullah AH. “The term phytasecomprises several different classes ofenzymes”. Biochem Biophys Res Commun., 312(1): 179-184. doi:10.1016/j.bbrc.2003.09.176. PMID 14630039
3. Becerra, M. and M.I.G. Siso. Yeast b-galactosidase in solid state fermentation.Enzyme Microb. Technol., 19: 39-44 (1996).
4. Bogar, B., G. Szakacs, J.C. Linden, A. Pandeyand R.P. Tengerdy. Optimization ofphytaseproduction by solid substrate
fermentation. J. Ind. Microbiol. Biotechnol.,30(3): 183-189 (2003).
5. Chadha, B.S., H. Gulati, M. Minhas, H.S. Sainiand N. Singh, Phytase production bythethermophilic fungus Rhizom Rhizomucorpusillus, World J. Microbiol. Biotechnol., 20:105-109 (2004).
6. Ciofalo, V., N. Barton, K. Kretz, J. Baird, M.Cook and D. Schanahan., Safely evaluationof aphytase, expressed inSchizosaccharomyces pombe, intended foruse in animal feed. Regul. Toxicol. Pharm.,37(2): 266-292 (2003).
7. Clark, W.D., K.E. Wohlt, R.L. Gilbreath andP.K. Zajar. Phytate phosphorus intake

190 VIHNUDAS et al., Curr. World Environ., Vol. 7(1), 187-190 (2012)
anddisappearance in the gastrointestinaltract of high producing dairy cows. J. Dair.Sci., 69: 3151-3155 (1958).
8. Cooney, D.G. and R. Emerson. Thermophilicfungi: An account of their biology,activitiesand classification. W.H. Freeman &Co., San Francisco, Calif. (1964).
9. Domsch, K.H., W. Gams and T.H. Anderson.Compendium of soil fungi. Academicpress,New York, Toronto, San Francisco.(1980).
10. Ebune, A., S. Al-Asheh and Z. Duvnjak.Production of phytase during solidstatefermentation using Aspergillus ficuumNRRL 3135 in canola meal. Biores. Technol.,53: 7-12 (1995)
11. Greiner, R. and U. Konietzny. Phytase for foodapplication. Food Technol. Biotechnol., 44(2):125-140 (2006).
12. Harland, B.F. and J. Harland. Fermentativereduction of phytic acid in rye, wheat andwholewheat bread. Cereal Chem., 57(3):226-229 (1980).
13. Heinonen, J.K. and R.J. Lahti. A new andconvenient colorimetric determination ofinorganicorthophosphate and its applicationto the assay of inorganic pyrophosphatase.Anal Biochem, 113: 313-317 (1981).
14. Hughes, M.N. and R.K. Poole. Metals andMicroorganisms. Chapman and Hall,
London.Hughes, M.N. and R.K. Poole. 1991.Metal speciation and microbial growth - thehard and softfacts. J. Gen. Microbiol., 137:725-734 (1989).
15. Koneman, W., E. Allen and W.C. Washington.Diagnostic Microbiology, 3rd Ed, p.608.Lynd, L.R., P.J. Weimer, Z.W. Van andI.S. Pretorius. 2002. Microbial celluloseutilization:fundamentals and biotechnology.Microbiol. Mol. Biol. Rev., 66: 506-577 (1991).
16. McCoy, M. Enzymes emerge as big AG feedsupplements. Chem. Eng. News, 4: 29-30.Onion, A.H.S., D. Allosopp and O.W.Eggins. 1986. Smith Introduction to IndustrialMycology, 7thEd, Edward Arnold Publishers,London, 187-188 (1998).
17. Pandey, A., G. Szakacs, C.R. Soccol, J.A.Rodriguez-Leon and V.T. Soccol.Production,purification and properties ofmicrobial phytases. Bioresour. Technol.,77(3): 203-214.Saha, C. 2003. Hemicellulosebioconversion. Ind. Microbiol. Biotechnol, 30:279-291 (2001).
18. Singh, B. and T. Satyanarayana. Phytaseproduction by thermophilic moldSporotrichumthermophile in solid-statefermentation and its application indephytinization of sesame oilcake. Appl.Biochem. Biotechnol., 133(3): 239-250(2006).