customer intercept survey: overview and · pdf filecustomer intercept survey: overview and...
TRANSCRIPT

Customer Intercept Survey: Overview and Methods
• Goal: to better understand current HRM farmers’ market customers and assess their shopping patterns, behaviors, and preferences
• Surveys conducted two Saturdays: Sept 28th & Oct 5nd from 5-9 am
• 119 surveys completed, a significant proportion of customers on each day so results are likely representative
• Not a random sampling procedure so randomness assumptions cannot be made for statistical analysis
• Only reflects customers in fall – not spring flower days customers
• Designed as an exit survey: asked customers what they did at the Market that day, not what they “typically” do
• Some language barriers but several surveyors conducted survey in Spanish

Customer Intercept Survey: Demographics
Households84%
Wholesale13%
Both2%
Other1%
Customer Type
White68%
Black11%
Hispanic12%
Other9%
Race
Male50%
Female50%
Gender
21-29years
30-39years
40-49years
50-59years
60-69years
70+ years
0.0%
5.0%
10.0%
15.0%
20.0%
25.0%
30.0%
35.0%
40.0%
Age
Survey CT
Key findings:
• Most customers interviewed are household shoppers
• The Market attracts very few young customers; a large majority are age 40-69
• Racial diversity mirrors Hartford County

Customer Intercept Survey
• Survey median income: $75-100,000
• Connecticut median household income 2012 = $69,243 (quickfacts.census.gov)
• Hartford median household income 2012 = $29,107
Q26. What range includes your total household income, before taxes, for 2012? (N=87)
<=$25k10%
$25-75k38%
>$75k52%
Household Income 2012
0.0%
5.0%
10.0%
15.0%
20.0%
25.0%
30.0%
Under$15,000
$15,000 to$25,000
$25,001 to$50,000
$50,001 to$75,000
$75,001 to$100,000
$100,001to
$150,000
Over$150,000
Household Income 2012
Survey Hartford Cty Key findings:
• Customer income skews higher than Hartford County, with largest group of customers reporting income from $100-150,000
• The Market attracts very few very low income and few very high income shoppers

Customer Intercept Survey
Key findings
• Most customers come from throughout Hartford County
• Customers come from all 8 counties in Connecticut
• 43 different zip codes
• Only one out-of-state customer interviewed (Maine)
Q23. What is your home zip code? (Households N=95)
Hartford15%
E, W Hartford
16%Rest of
Hartford County
48%
Rest of CT21%
Residence of HH Customers

Customer Intercept Survey
Q2. How long did you travel to get to the Market today? (N=118)
Q3. Are you here by yourself or did you come to the Market with other people? (N=117)
1%
57%
31%
9%
2%0%
33%
22%
39%
6%
Less than 5minutes
5 - 15 minutes 16 - 30minutes
31 - 60minutes
More than 60minutes
Travel Time to Market
HHs Wholesale
Question 3: GroupsizeGroupsize HHs Wholesale
Average 2.2 1.67
Min 1 1
Max 9 3
Mode 1 43% * 44%
Mode 1 or 2 57% 1 or 2 89%
Sum 218 30
Key findings:
• Household customers generally travel 5-15 minutes to visit the Market, while wholesale buyers have longer trips, with nearly half traveling more than 30 minutes
• Coming to Market is a group activity: average group size among households was 2.2 people and ranged from one to nine

Customer Intercept Survey
Q4. Before today, when was the last time you came to the Market? (N=117)
Q5. When did you first begin visiting the Hartford Regional Market? (N=112)
First time here4%
Last Sat or within week49%
Within the past
month23%
More than month ago
24%
Last Visit : HouseholdsFirst time
here0%
Last Sat or within week78%
Within the past
month5%
More than month ago
17%
Last Visit: Wholesale
2%9%
20%15%
54%
0%6%
17% 17%
61%
Within thepast year
1-2 years ago 3-5 years ago 6-10 yearsago
>10 years ago
First Visit to MarketHHs Wholesale
Key findings:
• Market customers are loyal, consistent, and longstanding
• Almost no new customers

Customer Intercept Survey
Q6. Counting everywhere you made a purchase today, how many different vendors did you buy from? (N=114)
Q7. Did you buy from vendors in and around the shed, from the businesses on the docks, or from both areas? (N=119)
Question 6: Number of vendors where purchases were made
Groupsize HHs Wholesale
Average 3.88 4.17
Min 1 1
Max 10 12
Mode 3 31% *
Sum 372 75
0%
10%
20%
30%
40%
50%
1-2 3-4 5-6 7-8 >8
Sho
pp
ers
Number of Vendors
Number of Vendors HH Shoppers Bought From
31%
7%
61%
22%
11%
67%
Shed only Docks only Both
Shop at Shed or DocksHHs
Key findings:
• Household customers buy from many different vendors, even though the number of vendors in September is fairly small
• Most households and wholesale buyers shop at both the sheds and the docks, reflecting the Market’s interconnected nature

Household Spending
$0.00
$20.00
$40.00
$60.00
$80.00
$100.00
$120.00
<=$50k $50-100k >$100k
HH Spending by Income
$0.00
$20.00
$40.00
$60.00
$80.00
$100.00
Male Female
HH Spending by Gender
$0.00
$20.00
$40.00
$60.00
$80.00
$100.00
$120.00
$140.00
First time here Last Saturday Within thepast month
More than amonth ago
HH Spending by Last Visit
$0.00
$50.00
$100.00
$150.00
<40 40-59 60+
HH Spending by Age
Q8. Counting everything that you bought, how much money did you spend at the Market today? (N=92)
Question 8: Spent HHs Wholesale
Min $ 9.00 $ 8.00
Max $ 800.00 $ 2,500.00
Average $ 74.44 $ 700.28
Median $ 45.00 $ 350.00
Std Deviation $ 116.94 $ 783.34
Sum $ 7,146.00 $ 12,605.00
Average sale/transaction $ 19.21 $ 168.07
Key findings:
• Household buyers reported high expenditures, about triple the typical average at farmers’ markets
• Lower income households reported spending less than high income, a rare inverse relationship

Customer Intercept Survey
Q9. This time of year, where does your household buy most of its fresh food? (N=103)
Q. 17. How would you rate the service you receive from Market vendors? Would you describe it as very good, somewhat good, OK, somewhat poor, or very poor? (N= 91, 12)
Suprmkt37%
HRM41%
Other11%
Both11%
Where Buy Most Fresh Food
0.0%
10.0%
20.0%
30.0%
40.0%
50.0%
60.0%
70.0%
80.0%
Very Good SomewhatGood
OK Somewhat Poor Very Poor
Comparable Rankings: Service
HH Wholesale
Key findings:
• Many customers said they buy most of their fresh food at HRM, suggesting the Market is a key source of fresh food in the region
• Both households and wholesale buyers rate the service they receive from Market vendors highly.

Q. 10-12. Compared to other places that sell similar products, would you describe the quality/selection/pricesof products at the Market as much better, somewhat better, about the same, somewhat worse, or much worse?
0.0%
10.0%
20.0%
30.0%
40.0%
50.0%
60.0%
70.0%
Quality Selection Prices
Comparable Rankings: HH
Much Better Somewhat Better Same Somewhat Worse Much Worse
0.0%
10.0%
20.0%
30.0%
40.0%
50.0%
Quality Selection Prices
Comparable Rankings: Wholesale
Much Better Somewhat Better Same Somewhat Worse Much Worse
Key findings:
• Among household customers, prices at the Regional Market stand out as being much better than other places to buy similar products
• Wholesale buyers are more critical and seem to appreciate the blend of selection, quality and price offered at the Market

Customer Intercept Survey
Q15. What things do you like best about the Regional Market? (N=112, up to three answers recorded)
0 2 4 6 8 10 12 14
Apples
Quality
Produce item
Freshness
Flowers
Produce
Plants
Atmosphere
What Like Best
Key findings:
• The Market’s atmosphere was mentioned most frequently as what they like, followed by particular products (mainly plants and produce)
• Freshness and quality also received numerous mentions

Customer Intercept Survey
Q16. What things would you like to see changed at the Regional Market? (N=80, up to three answers recorded)
0 5 10 15 20 25 30 35 40
Other
More ads
Paved roads
Smaller quantities
Indoor/shelter
Variety
Parking
What Things to ChangeKey findings:
• Parking stands out as the biggest item that customers would change
• Customers would also like to see more variety
Customer Intercept Survey
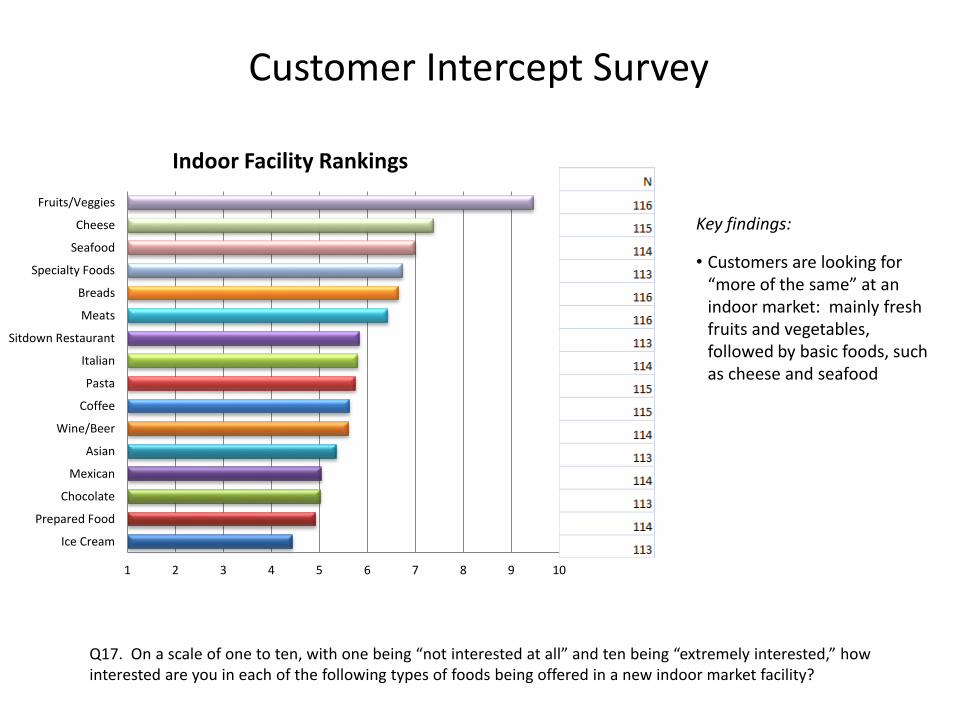
Q17. On a scale of one to ten, with one being “not interested at all” and ten being “extremely interested,” how interested are you in each of the following types of foods being offered in a new indoor market facility?
1 2 3 4 5 6 7 8 9 10
Ice Cream
Prepared Food
Chocolate
Mexican
Asian
Wine/Beer
Coffee
Pasta
Italian
Sitdown Restaurant
Meats
Breads
Specialty Foods
Seafood
Cheese
Fruits/Veggies
Indoor Facility Rankings
Key findings:
• Customers are looking for “more of the same” at an indoor market: mainly fresh fruits and vegetables, followed by basic foods, such as cheese and seafood

Customer Intercept Survey
Q18. Again on a scale of one to ten, with one being “extremely unlikely” and ten being “extremely likely,” how likely are you to visit a new indoor market at the Hartford Regional Market if it were open …?
1 2 3 4 5 6 7 8 9 10
Weekday evenings
Mon-Fri
Sundays
Saturdays
Likeliness to Visit
Wholesale HH
Key findings:
• A new indoor market would most likely be visited on weekends, particularly for household customers
• Interest in shopping at an indoor market during the week was quite limited