2010 visitor intercept survey study overview and methodology · study overview and methodology a...
TRANSCRIPT

Visit Cheyenne
_____________________ __ 2010 Visitor Intercept Survey
7 - 1
Study Overview and Methodology A Visitor Intercept Study was conducted by Cheyenne Convention and Visitors Bureau (CCVB) with assistance from Randall Travel Marketing (RTM). CCVB prepared the survey questionnaire document and bureau staff completed 414 intercept interviews with a random sampling of visitors to Cheyenne. Interviews were segmented by type of visitor, by location, and by time period. The interviews were conducted at various times of day and various days and months during 2010 in order to achieve a full-year random sampling. Completed surveys were data entered and tallied by bureau staff. This completed data was provided to RTM. RTM prepared this written analysis of the data. An incentive gift (bumper sticker, plastic sheriff’s badge, etc.) was given to respondents. Segment:
Segment Number Percentage
Business 110 26.57%
Leisure 304 73.43%
Overall 414 100.00%
Month:
Month Business Leisure Overall
January 8.18% 2.63% 4.11%
February 10.00% 3.62% 5.31%
March 2.73% 3.62% 3.38%
April 11.82% 2.30% 4.83%
May 8.18% 13.82% 12.32%
June 10.91% 16.78% 15.22%
July 1.82% 27.63% 20.77%
August 12.73% 12.17% 12.32%
September 5.45% 10.20% 8.94%
October 12.73% 1.64% 4.59%
November 2.73% 5.26% 4.59%
December 12.73% 0.33% 3.62%
Location:
Location Business Leisure Overall
Days Inn 1.82% 1.32% 1.45%
Depot 0.00% 9.54% 7.00%
Fairfield 8.18% 12.50% 11.35%
Hampton Inn 17.27% 4.93% 8.21%
Holiday Inn 5.45% 3.95% 4.35%
Holiday Inn Express 35.45% 12.17% 18.36%
Little America 10.00% 0.00% 2.66%
Microtel 5.45% 0.33% 1.69%
Springhill Suites 2.73% 1.32% 1.69%
Trolley 11.82% 44.74% 35.99%
Nagle-Warren 1.82% 9.21% 7.25%
Grand Total 100.00% 100.00% 100.00%

Visit Cheyenne
_____________________ __ 2010 Visitor Intercept Survey
7 - 2
Summary of Intercept Interviews
Overall Intercept Survey Quantity of Interviews: 414
Demographics:
Average Age 35-54 Gender: Male / Female 45.34%/48.23%
Point Of Origin: Colorado, Wyoming, Nebraska, California and Texas
Age Range
Under 18 1.77%
18-24 4.04%
25-34 9.60%
35-54 34.09%
55-64 24.24%
65+ 26.26%
Travel Party Size:
Business Leisure Overall
Adults traveling without children 93.52% 80.34% 83.87%
Average # adults in party 2.30 2.44 2.40
Adults traveling with children 6.48% 19.66% 16.13%
1.29 2.12 2.03
Traveling with pets 2 5 7
Major Trip Purpose Business Leisure Overall
Vacation 10.00% 69.74% 53.86%
Shopping/dining/entertainment 2.73% 3.62% 3.38%
Group tour 3.64% 3.62% 3.62%
Visiting friends and relatives 4.55% 27.30% 21.26%
Convention or meeting 30.91% 0.00% 8.21%
Other business reasons 73.64% 0.00% 19.57%
Other (specify) 0.91% 3.29% 2.66%
Primary Destination Business Leisure Overall
Cheyenne 70.00% 54.61% 58.70%
Yellowstone 0.00% 11.84% 8.70%
Denver 6.36% 12.50% 10.87%
Grand Tetons 0.00% 7.89% 5.80%
Mt. Rushmore / Black Hills 4.55% 16.45% 13.29%
Other (specify) 15.45% 21.71% 20.05%
First Visit? Business Leisure Overall
Yes 21.57% 47.14% 40.31%
Prior Visits
1 – 3 years ago 60.78% 32.86% 40.31%
4 – 10 years ago 9.80% 9.29% 9.42%
More than 10 years ago 7.84% 10.71% 9.95%
Lodging Type Business Leisure Overall
Hotel / Motel 91.82% 59.54% 68.12%
Friends / Relatives 1.82% 12.50% 9.66%
Bed & Breakfast 1.82% 14.14% 10.87%
Campground 0.91% 9.21% 7.00%
Other (specify) 2.73% 2.30% 2.42%

Visit Cheyenne
_____________________ __ 2010 Visitor Intercept Survey
7 - 3
Average Length of Stay Business Leisure Overall
0 Nights – Day trip only 0.93% 9.31% 7.05%
1 Night 49.53% 39.31% 42.07%
2 Nights 30.84% 21.72% 24.18%
3 Nights 5.61% 10.00% 8.82%
4 Nights 4.67% 7.59% 6.80%
5 Nights 0.93% 4.83% 3.78%
6 Nights or More 7.48% 7.24% 7.30%
Avg. number of nights = 2.20 2.25 2.24
Transportation Mode Business Leisure Overall
Automobile only 76.36% 78.95% 78.26%
Motor coach / bus 4.55% 4.93% 4.83%
Motorcycle 0.00% 1.32% 0.97%
Other (specify) 1.82% 2.63% 2.42%
Combination fly / drive 16.36% 10.86% 12.32%
Travel Planning Time Business Leisure Overall
7 Days or Less 41.49% 18.18% 24.30%
14 Days to 30 Days 36.17% 25.76% 28.49%
35 Days to 180 Days 21.28% 46.59% 39.94%
210 Days or More 1.06% 9.47% 7.26%
Average Number of Days 35.54 83.14 70.64
Information Source Business Leisure Overall
Friends / Relatives 13.64% 43.09% 35.27%
Magazine article 2.73% 5.59% 4.83%
Newspaper article 1.82% 1.97% 1.93%
Print advertising 5.45% 3.62% 4.11%
Brochures 4.55% 20.72% 16.43%
State / city visitor Office 7.27% 5.92% 6.28%
AAA / Motor Club 9.09% 16.12% 14.25%
Web Sites 32.73% 38.82% 37.20%
Other sources (specify) 21.82% 4.61% 9.18%
Visit Cheyenne
_____________________ __ 2010 Visitor Intercept Survey
7 - 4
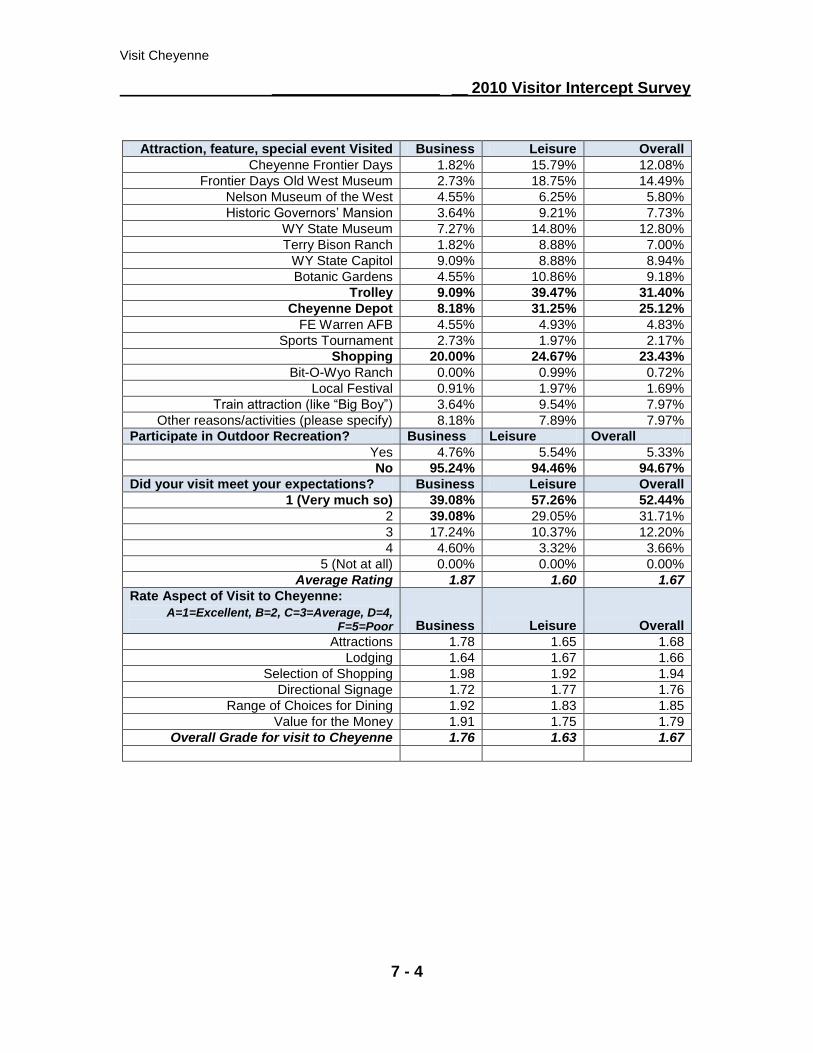
Attraction, feature, special event Visited Business Leisure Overall
Cheyenne Frontier Days 1.82% 15.79% 12.08%
Frontier Days Old West Museum 2.73% 18.75% 14.49%
Nelson Museum of the West 4.55% 6.25% 5.80%
Historic Governors’ Mansion 3.64% 9.21% 7.73%
WY State Museum 7.27% 14.80% 12.80%
Terry Bison Ranch 1.82% 8.88% 7.00%
WY State Capitol 9.09% 8.88% 8.94%
Botanic Gardens 4.55% 10.86% 9.18%
Trolley 9.09% 39.47% 31.40%
Cheyenne Depot 8.18% 31.25% 25.12%
FE Warren AFB 4.55% 4.93% 4.83%
Sports Tournament 2.73% 1.97% 2.17%
Shopping 20.00% 24.67% 23.43%
Bit-O-Wyo Ranch 0.00% 0.99% 0.72%
Local Festival 0.91% 1.97% 1.69%
Train attraction (like “Big Boy”) 3.64% 9.54% 7.97%
Other reasons/activities (please specify) 8.18% 7.89% 7.97%
Participate in Outdoor Recreation? Business Leisure Overall
Yes 4.76% 5.54% 5.33%
No 95.24% 94.46% 94.67%
Did your visit meet your expectations? Business Leisure Overall
1 (Very much so) 39.08% 57.26% 52.44%
2 39.08% 29.05% 31.71%
3 17.24% 10.37% 12.20%
4 4.60% 3.32% 3.66%
5 (Not at all) 0.00% 0.00% 0.00%
Average Rating 1.87 1.60 1.67
Rate Aspect of Visit to Cheyenne:
A=1=Excellent, B=2, C=3=Average, D=4, F=5=Poor Business Leisure Overall
Attractions 1.78 1.65 1.68
Lodging 1.64 1.67 1.66
Selection of Shopping 1.98 1.92 1.94
Directional Signage 1.72 1.77 1.76
Range of Choices for Dining 1.92 1.83 1.85
Value for the Money 1.91 1.75 1.79
Overall Grade for visit to Cheyenne 1.76 1.63 1.67

Visit Cheyenne
_____________________ __ 2010 Visitor Intercept Survey
7 - 5
Spending Category Amount
Business Amount Leisure
Amount Overall
Lodging $254.91 $220.95 $231.34
Transportation (auto operation, rental, airline) $274.40 $201.25 $220.46
Eating and drinking places $131.88 $122.75 $125.26
Admissions and entertainment $118.33 $76.96 $80.84
Food and supplies bought at stores $62.71 $73.14 $70.73
Other purchases (souvenirs, gifts, etc.) $143.40 $107.13 $114.63
Total Trip Expenditures $985.64 $802.18 $843.25
Average Number of Nights 2.20 2.25 2.24
Average Daily Expenses $448.02 $356.52 $376.45
Spending Category
% of whole
Business % of whole
Leisure % of whole
Overall
Lodging 25.86% 27.54% 27.43%
Transportation (auto operation, rental, airline) 27.84% 25.09% 26.14%
Eating and drinking places 13.38% 15.30% 14.85%
Admissions and entertainment 12.01% 9.59% 9.59%
Food and supplies bought at stores 6.36% 9.12% 8.39%
Other purchases (souvenirs, gifts, etc.) 14.55% 13.35% 13.59%
Total Trip Expenditures 100.00% 100.00% 100.00%

Visit Cheyenne
_____________________ __ 2010 Visitor Intercept Survey
7 - 6
Summary of Findings
The primary destination for business travelers tends to be either Cheyenne or the nearby area.
Leisure visitors report their primary destination as either Cheyenne (54.61%) or Yellowstone and
other regional destinations.
The top activities for both business and leisure visitors include: dining, shopping, the Cheyenne
Depot and the trolley.
Only 5% of Cheyenne visitors engage in outdoor activities. Most popular activities include golf,
hiking, and walking. This contrasts with statewide data, where more than one-third of visitors
report outdoor activities.
93.52% of all business travel parties are adults traveling without children, although they often
contain two or more adults. 80.34% of all leisure travel parties are adults traveling without
children. Those that do contain children are likely to have 1-3 children. Very few travel parties
(1%) to Cheyenne (business and leisure) contain pets, compared to 12% on a statewide basis.
80.37% of business travelers stay 1-2 nights. 61.03% of leisure visitors stay 1-2 nights, and
12.07% stay 5 nights or longer.
78.26% of all visitors drive to Cheyenne. 16.36% of business travelers fly into either Denver or
Cheyenne and rent an automobile. 12.32% of leisure visitors fly/drive, with most of those flying
into Denver. Southwest and United Airlines are the most frequently chosen airlines.
91.82% of business travelers and 59.54% of leisure visitors choose hotels/motels for their lodging.
Business visitors plan their trip an average of 35.54 days in advance, while leisure visitors plan
their trips 83.14 days in advance.
Websites are the most prevalent source of visitor information, along with referrals from friends and
relatives. For business visitors information provided by their workplace is also a frequent
information source. Brochures are the third most frequent source of information for leisure visitors.
Approximately 60% of all visitors are repeat visitors, while approximately 40% are first-time
visitors. This is excellent and near-text book perfect. The ideal mix is considered one-third new
visitors and two-thirds repeats.
The majority (52.44%) rated Cheyenne an “A” in meeting their expectations. Nearly 85% of
respondents rated Cheyenne either an “A” or a “B”. Only 12% rated it a “C” or average. Less
than 4% rated it below average. This can be considered excellent satisfaction ratings.
Business travelers spent an average of $985.64 on their trip to Cheyenne while Leisure travelers
spent an average of $802.18. Trip lengths averaged between 2-3 nights. Cheyenne’s 2010
Inquiry Conversion Study (see section 6 of this report, page 25) indicates the spending for those
who inquired to Visit Cheyenne was $904.31. Again trip length averages between 2-3 nights. This
matches the statewide 2010 Visitor Profile Study that indicated the 2010 trip total was $914, with
an average length of stay of 2-3 nights. The statewide total of $914 was nearly 10% lower than in
previous years, which matches national trends since the recession.
Visitors tend to be Generation X, Baby Boomers, or Silent Generation. Approximately one out of
twenty (5.03%) visitors are foreign. This matches statewide data, as well as data for the
surrounding states. Primary points of origin are Wyoming, Colorado, Texas, California, Nebraska,
Missouri and Michigan.
Household income tends to be over $75,000.

Visit Cheyenne
_____________________ __ 2010 Visitor Intercept Survey
7 - 7
1. Which of the following represents the main reason for your visit to Cheyenne? (Check all that apply)
Main Reason Business Leisure Overall
Vacation 10.00% 69.74% 53.86%
Shopping/dining/entertainment 2.73% 3.62% 3.38%
Group tour 3.64% 3.62% 3.62%
Visiting friends and relatives 4.55% 27.30% 21.26%
Convention or meeting 30.91% 0.00% 8.21%
Other business reasons 73.64% 0.00% 19.57%
Other (specify) 0.91% 3.29% 2.66% Survey Sample (N) = 110 304 414
Other main reasons listed include: Business
Spelling Bee
Leisure Pool Tournament (3)
Hockey Tournament (2)
Baseball Tournament
Kaycee
Medical
Sports
Truck break down
This question was asked to determine primary trip purpose and to screen participants in order to get an appropriate mix of business and leisure respondents.

Visit Cheyenne
_____________________ __ 2010 Visitor Intercept Survey
7 - 8
2. What was your primary destination for this trip? (Multiple responses taken)
Top response in bold
Primary Destination Business Leisure Overall
Cheyenne 70.00% 54.61% 58.70%
Yellowstone 0.00% 11.84% 8.70%
Denver 6.36% 12.50% 10.87%
Grand Tetons 0.00% 7.89% 5.80%
Mt. Rushmore / Black Hills 4.55% 16.45% 13.29%
Other (specify) 15.45% 21.71% 20.05% Survey Sample (N) = 110 304 414
Other primary destinations listed include:
Business Casper (2)
California
Colorado
Hiking
Laramie
Multiple
North Carolina
Pine Bluffs
Snow
Tennessee
Torrington
Wisconsin
Wyoming
Leisure California (6)
Colorado (4)
Steamboat (4)
Montana (3)
Salt Lake (3)
Utah (3)
Canada (2)
Casper (2)
Estes Park (2)
Nebraska (2)
Ohio (2)
Vegas (2)
West (2)
Boise
Boston
Carpenter
Colorado Springs
Crazy Horse**
Detroit
Devils Tower
Ft. Laramie
Full time RV
Kaycee WY
Milwaukee
Oklahoma City
Oregon
Parks
Quilt shops
Rapid City**
Sedona
South Dakota
Vedawoo
Vermont
Yosemite
**NOTE: Please note verbatim references to Crazy Horse and Rapid City, which could be considered part of
Mt. Rushmore/Black Hills. Items were left in this list as reported by the respondent.
Cheyenne was the primary destination for the majority of these respondents. Business
respondents were most likely to report Cheyenne or nearby points as their primary
destination. Leisure respondents reported a wider range of primary destinations, and while
Cheyenne was the most frequently referenced, Yellowstone and other regional destinations
were prominent in the reporting.

Visit Cheyenne
_____________________ __ 2010 Visitor Intercept Survey
7 - 9
3. Please check all attractions, features or special events you went to in Cheyenne during this visit.
Top Responses in Bold Attraction, feature, special event Business Leisure Overall
Cheyenne Frontier Days 1.82% 15.79% 12.08%
Frontier Days Old West Museum 2.73% 18.75% 14.49%
Nelson Museum of the West 4.55% 6.25% 5.80%
Historic Governors’ Mansion 3.64% 9.21% 7.73%
WY State Museum 7.27% 14.80% 12.80%
Terry Bison Ranch 1.82% 8.88% 7.00%
WY State Capitol 9.09% 8.88% 8.94%
Botanic Gardens 4.55% 10.86% 9.18%
Trolley*** 9.09% 39.47% 31.40%
Cheyenne Depot 8.18% 31.25% 25.12%
FE Warren AFB 4.55% 4.93% 4.83%
Sports Tournament 2.73% 1.97% 2.17%
Shopping 20.00% 24.67% 23.43%
Bit-O-Wyo Ranch 0.00% 0.99% 0.72%
Local Festival 0.91% 1.97% 1.69%
Train attraction (like “Big Boy”) 3.64% 9.54% 7.97%
Other reasons/activities (please specify) 8.18% 7.89% 7.97% Survey Sample (N) = 110 304 414
***NOTE: A number of intercept interviews were conducted on the Trolley, somewhat skewing this response.
Other reasons/activities listed include:
Business Eat
Goats
Guard duty
None
UW
WYDOT
Wyoming Forum
Leisure Graduation (4)
Atlas
Baseball
Book signing
Cattle drive
Cowgirls
Family
Farmers market
Geocaching
Greenway
Kiwanis breakfast
Nagle Warren
Outlaw
Pancake breakfast
Rodeo in Pine
Wedding
The Trolley, the Cheyenne Depot, and shopping are the top three activities reported by
leisure visitors. It is interesting to note the percentage of business travelers that engage
in leisure activities while visiting Cheyenne. The trend line for both leisure and business
tends to run the same, with the exception of those activities that are only open when
leisure visitors are able to visit. Other activities that rated highly include the Frontier Days
Old West Museum, Cheyenne Frontier Days, and the Wyoming State Museum.

Visit Cheyenne
_____________________ __ 2010 Visitor Intercept Survey
7 - 10
4. During your trip to Cheyenne, did any member of your party participate in outdoor recreation (fishing, golf, hiking, biking, etc.)?
Response Business Leisure Overall
Yes 4.76% 5.54% 5.33%
No 95.24% 94.46% 94.67% No Response = 4.55% 4.93% 4.83%
Survey Sample (N) = 110 304 414
Question Sample (n) = 105 289 394
If yes, specify: Business
Golf Hiking Walking
Leisure Golf (5)
Hiking (5)
Biking (2)
Fishing
Walking
Visitors to Cheyenne are not likely to be engaging in outdoor activities. In this study, only slightly over one out of twenty (5.33%) reported outdoor activities during their stay in Cheyenne. Golf, hiking and walking are the most likely outdoor activities. This contrasts with statewide data. In the 2010 Visitor Profile Study for Wyoming Travel and Tourism, in which over one-third of respondents reported outdoor activities. Thus, we can conclude that visitors to Cheyenne are likely to be more interested in dining, shopping, and attending museums and attractions.
0.00%
20.00%
40.00%
60.00%
80.00%
100.00%
120.00%
Business Leisure Overall
Yes
No

Visit Cheyenne
_____________________ __ 2010 Visitor Intercept Survey
7 - 11
5. How many people, including yourself, are in your travel party on this visit.
Number of Adults Business Leisure Overall
1 51.85% 12.88% 23.33%
2 31.48% 59.66% 52.11%
3 3.70% 9.15% 7.69%
4 4.63% 14.24% 11.66%
5 or More 8.33% 4.07% 5.21%
Average 2.30 2.44 2.40 No Response = 1.82% 2.96% 2.66%
Survey Sample (N) = 110 304 414
Question Sample (n) = 108 295 403
Percentage of visitors traveling with adults only: Business 93.52% Leisure 80.34% Overall 83.87%
Number of Children under 18 Business Leisure Overall
1 71.43% 24.14% 29.23%
2 28.57% 50.00% 47.69%
3 0.00% 17.24% 15.38%
4 0.00% 6.90% 6.15%
5 0.00% 1.72% 1.54%
Average children for parties with children = 1.29 2.12 2.03
Average children for sample = 0.08 (n=108) 0.42 (n=295) 0.33 (n=403)
No Response = 93.64% 80.92% 84.30%
Survey Sample (N) = 110 304 414
Question Sample (n) = 7 58 65
Percentage of visitors traveling with children: Business 6.48% Leisure 19.66% Overall 16.13%
Number of parties traveling with pets: Business 2 Leisure 5 Overall 7
The vast majority of business travel parties (93.52%) are adults traveling without children, although about half of all business travel parties (48.15%) include more than one adult. Interestingly, over three-quarters of leisure travel parties (80.34%) are also adults traveling without children. The one out of five travel parties that do contain children tend to include one to three children, with approximately half having two children. Very few travel parties (1%) include pets. Again, this contrasts with statewide data in which we find that approximately 12% of visitor parties contain pets.

Visit Cheyenne
_____________________ __ 2010 Visitor Intercept Survey
7 - 12
6. How many nights were/are you in Cheyenne on this trip?
Number of Nights Business Leisure Overall
0 Nights – Day trip only 0.93% 9.31% 7.05%
1 Night 49.53% 39.31% 42.07%
2 Nights 30.84% 21.72% 24.18%
3 Nights 5.61% 10.00% 8.82%
4 Nights 4.67% 7.59% 6.80%
5 Nights 0.93% 4.83% 3.78%
6 Nights or More 7.48% 7.24% 7.30%
Average number of nights = 2.20 2.25 2.24 No Response = 2.73% 4.61% 4.11%
Survey Sample (N) = 110 304 414
Question Sample (n) = 107 290 397
The significant majority (80.37%) of business travelers stay in Cheyenne either one or two nights, with the average being 2.20 nights. Leisure travelers stay slightly longer at 2.25 average nights, with only 61.03% staying either one or two nights. Approximately 10% of leisure respondents were day trippers and 12.07% stayed five nights or longer.
0.00%
10.00%
20.00%
30.00%
40.00%
50.00%
60.00%
0
Nights
– Day
trip
only
1 Night 2
Nights
3
Nights
4
Nights
5
Nights
6
Nights
or
More
Business
Leisure
Overall

Visit Cheyenne
_____________________ __ 2010 Visitor Intercept Survey
7 - 13
7. What mode of transportation did you use to visit Cheyenne? (Multiple responses taken)
Top response in bold
Transportation Mode Business Leisure Overall
Automobile only 76.36% 78.95% 78.26%
Motor coach / bus 4.55% 4.93% 4.83%
Motorcycle 0.00% 1.32% 0.97%
Other (specify) 1.82% 2.63% 2.42%
Combination fly / drive 16.36% 10.86% 12.32% Survey Sample (N) = 110 304 414
Other transportation modes listed: Business RV (2)
Leisure RV (4)
5th wheel
Tractor
Van
If flying, what airline did you use? Business United (6)
Frontier (3)
Great Lakes (3)
American
Delta
Private
Southwest
Leisure Southwest (11)
United (8)
Frontier (4)
Delta (3)
American (2)
B.A. (2)
Continental (2)
USAir
Which airport did you use? Business Denver (8)
Cheyenne (6)
Casper
WyANG
Leisure Denver (33)
CYS
Rapid City
Approximately three-quarters of all visitors drive to Cheyenne. Close to one out of five (16.36%) of business travelers fly into either Denver or Cheyenne and rent an automobile. 12.32% of leisure travelers fly into Denver (primarily) and rent an automobile. Those who fly are most likely to choose Southwest or United Airlines.

Visit Cheyenne
_____________________ __ 2010 Visitor Intercept Survey
7 - 14
8. What type of lodging did you use? (Multiple responses taken)
The TOP responses in bold
Lodging Type Business Leisure Overall
Hotel / Motel 91.82% 59.54% 68.12%
Friends / Relatives 1.82% 12.50% 9.66%
Bed & Breakfast 1.82% 14.14% 10.87%
Campground 0.91% 9.21% 7.00%
Other (specify) 2.73% 2.30% 2.42% Survey Sample (N) = 110 304 414
Other lodging types listed: Business Spelling Bee
Leisure RV (2)
Generally this matched what RTM typically finds. The vast majority of traveler prefer hotels/motels when traveling.
9. How far in advance did you begin planning this trip? Respondents were asked to estimate their planning time in days, weeks, or
months. For reporting purposes, all times given have been converted to days.
Planning Time Business Leisure Overall
7 Days or Less 41.49% 18.18% 24.30%
14 Days to 30 Days 36.17% 25.76% 28.49%
35 Days to 180 Days 21.28% 46.59% 39.94%
210 Days or More 1.06% 9.47% 7.26%
Average Number of Days 35.54 83.14 70.64 No Response = 14.55% 13.16% 13.53%
Survey Sample (N) = 110 304 414
Question Sample (n) = 94 264 358
This matches statewide data both in the 2010 statewide visitor profile study and the 2010 Visitor Center Economic Impact Study. Business travelers tend to have a shorter trip planning cycle, while leisure visitors plan their trip up to six months in advance.

Visit Cheyenne
_____________________ __ 2010 Visitor Intercept Survey
7 - 15
10. How did you gather information about Cheyenne? (Check all that apply)
The TOP responses in bold
Information Source Business Leisure Overall
Friends / Relatives 13.64% 43.09% 35.27%
Magazine article 2.73% 5.59% 4.83%
Newspaper article 1.82% 1.97% 1.93%
Print advertising 5.45% 3.62% 4.11%
Brochures 4.55% 20.72% 16.43%
State / city visitor Office 7.27% 5.92% 6.28%
AAA / Motor Club 9.09% 16.12% 14.25%
Web Sites 32.73% 38.82% 37.20%
Other sources (specify) 21.82% 4.61% 9.18% Survey Sample (N) = 110 304 414
Other sources listed include: Business
Work (5)
Previous (2)
AARP
Convention Brochure
US DOT
WLRA
Leisure
Previous (2)
Guide
Map
Radio
This matches statewide data very closely. Websites are the most prevalent source of visitor information, along with referrals from friends and relatives. For business travelers information provided by their workplace also is a frequent source of trip planning information. Brochures was the third most frequent source of information for leisure visitors.

Visit Cheyenne
_____________________ __ 2010 Visitor Intercept Survey
7 - 16
11. On an A B C D F school grading scale, where C is average, what grade would you give to each of the following aspects of your visit to Cheyenne?
(For reporting purposes the scale has been converted to: A=1=Excellent, B=2, C=3=Average, D=4, F=5=Poor)
Aspect of Visit Business Leisure Overall
Attractions 1.78 1.65 1.68
Lodging 1.64 1.67 1.66
Selection of Shopping 1.98 1.92 1.94
Directional Signage 1.72 1.77 1.76
Range of Choices for Dining 1.92 1.83 1.85
Value for the Money 1.91 1.75 1.79
Overall Grade for visit to Cheyenne 1.76 1.63 1.67
Cheyenne earns the equivalent of a “B+” from both its leisure and business visitors. Women tend to rate Cheyenne a little more positively than men.
Average rating for “Overall Grade for visit to Cheyenne”
Category Average
Rating Average
Rating Average
Rating
Gender Business Leisure Overall
Men 1.85 1.74 1.78
Women 1.64 1.49 1.53
Both Male and Female Marked N/A 1.64 1.64
Main Purpose for Visit
Vacation 1.57 1.66 1.65
Shopping/dining/entertainment 1.00 1.40 1.31
Group tour 1.00 1.67 1.44
Visiting friends and relatives 2.00 1.51 1.53
Convention or meeting 1.67 N/A 1.67
Other business reasons 1.79 N/A 1.79
Other (specify) 1.00 1.50 1.44

Visit Cheyenne
_____________________ __ 2010 Visitor Intercept Survey
7 - 17
12. When was the last time you visited Cheyenne?
Last Visit Business Leisure Overall
Never 21.57% 47.14% 40.31%
1 – 3 years ago 60.78% 32.86% 40.31%
4 – 10 years ago 9.80% 9.29% 9.42%
More than 10 years ago 7.84% 10.71% 9.95% No Response = 7.27% 7.89% 7.73%
Survey Sample (N) = 110 304 414
Question Sample (n) = 102 280 382
This data indicated that approximately 60% of all visitors are repeat visitors, while approximately 40% are first-time visitors. This is excellent and near-text book perfect. The ideal mix is considered one-third new visitors and two-thirds repeats. A destination wants to steadily replenish the visitor base with new visitors, and know it attracts repeat visitors as well. Business visitors are slightly more likely to be repeat visitors, as might be expected.
0.00%
10.00%
20.00%
30.00%
40.00%
50.00%
60.00%
70.00%
Never 1 – 3 years
ago
4 – 10 years
ago
More than
10 years
ago
Business
Leisure
Overall

Visit Cheyenne
_____________________ __ 2010 Visitor Intercept Survey
7 - 18
13. Before visiting, what was your perception of Cheyenne?
Business Good / Great (6)
Small (3)
Western town (3)
Expected a rural area / Country (2)
Nice town / Wonderful town (2)
No preconceptions (2)
State Capitol (2)
Airbase town
Always visit Cheyenne
Buffalo
Cold
Cowboy Capital
Isolated
It would be the same as 5 years ago
Like Cheyenne, except the wind
Modern, friendly city which embraces its western history
OK
Old cow town
Same
Song " Beaches of Cheyenne"
Western history place
Windy
Leisure Western town (14)
Didn't have any (9)
Cowboy Country (8)
Nice (7)
Small (7)
Windy (7)
Good / Great (6)
Big town (3)
Friendly (3)
Rail Road (3)
Wild west (3)
Cold (2)
Hot / warm (2)
Open country side (2)
State capitol (2)
Alright place
Back in the day
Beautiful buildings
Been here
Capitol
Charming
Country
Cows
Cow town with class
Ghost Town
Great place to come shop
Great western historic events
History
Horses and cowgirls
I wanted to revisit
Kids live here
Laid back city
Less metropolitan
Like it
Lived here
Lovely
Mountain
My uncle lived here
Near town
Old
Only here during Frontier Days so busy
Pioneers
Cheyenne is one of those places on the globe that everyone seems to know. As mentioned elsewhere in this report, the very word “Cheyenne” conjures up great mental images of the wild west, railroads, and western heritage. Clearly that is the perception these respondents reported.

Visit Cheyenne
_____________________ Visitor Intercept Survey
7 - 19
14. Did your visit meet your expectations? (Responses were rated on the following scale, 1=Very much so, 5=Not at all)
Rating Business Leisure Overall
1 (Very much so) 39.08% 57.26% 52.44%
2 39.08% 29.05% 31.71%
3 17.24% 10.37% 12.20%
4 4.60% 3.32% 3.66%
5 (Not at all) 0.00% 0.00% 0.00% No Response 20.91% 20.72% 20.77%
Survey Sample (N) = 110 304 414
Question Sample (n) = 87 241 328
Average Rating 1.87 1.60 1.67
Why or why not?
Business Nice people (2)
Very Nice (2)
Car broke down
Clean
Did not realize the history here & quality of the library
Expected saloons with swinging doors
Great tour guide
I love country
I would definitely come
back, very nice people. Beautiful.
It changed
It was good
Slightly larger
Yes, love Cheyenne
Leisure Wonderful Trolley ride (2)
Awesome scenery
CFD was awesome
Cleanliness restored buildings preservation
Could not find campgrounds off I-80
Frontier Days was Great!
Good
I wanted to see more old buildings
Late Trolley no restaurants open
Little wind and few cows
Loaded up vehicle with clothes and things on sale
Many museums closed
Nice people
Not a lot for kids to do
Not too big but big enough
Overnight stop
Parking is not visitor friendly!!!!
Pleasantly surprised
Quiet and clean
Some attractions not up to par
Too many things closed on weekends
Too much road construction
Trolley only attraction
Varity of things to see and do
Very lovely town
Visiting family
We have been here before
The majority (52.44%) rated Cheyenne an “A” in meeting their expectations. Nearly 85% of respondents rated Cheyenne either an “A” or a “B”. Only 12% rated it a “C” or average. Less than 4% rated it below average. This can be considered excellent satisfaction ratings.

Visit Cheyenne
_____________________ Visitor Intercept Survey
7 - 20
15. Please estimate how much your travel party spent in Cheyenne during this trip. (Estimate as best you can.)
Spending Category Amount
Business
% of whole
Business Amount Leisure
% of whole
Leisure Amount Overall
% of whole
Overall
Lodging $254.91 25.86% $220.95 27.54% $231.34 27.43%
Transportation (auto operation, rental, airline) $274.40 27.84% $201.25 25.09% $220.46 26.14%
Eating and drinking places $131.88 13.38% $122.75 15.30% $125.26 14.85%
Admissions and entertainment $118.33 12.01% $76.96 9.59% $80.84 9.59%
Food and supplies bought at stores $62.71 6.36% $73.14 9.12% $70.73 8.39%
Other purchases (souvenirs, gifts, etc.) $143.40 14.55% $107.13 13.35% $114.63 13.59%
Total Trip Expenditures $985.64 100.00% $802.18 100.00% $843.25 100.00%
Average Number of Nights 2.20 2.25 2.24
Average Daily Expenses $448.02 $356.52 $376.45
Here we see that Business traveler spent an average of $985.64 on their trip to Cheyenne while Leisure travelers spent an average of $802.18. Trip lengths averaged between 2-3 nights.
Cheyenne’s 2010 Inquiry Conversion Study (see section 6 of this report, page
25) indicates the spending for those who inquired to Visit Cheyenne was $904.31. Again trip length averages between 2-3 nights.
This matches the statewide 2010 Visitor Profile Study that indicated the 2010 trip total was $914, with an average length of stay of 2-3 nights. The statewide total of $914 was nearly 10% lower than in previous years, which matches national trends since the recession.

Visit Cheyenne
_____________________ Visitor Intercept Survey
7 - 21
Demographics Demographics are the descriptive statistics dealing with a specific population of people. The demographics of visitors are excellent descriptions of the target markets that are visiting a destination. The demographics of the sample of respondents who requested information from the Cheyenne Area Convention and Visitors Bureau are described in the following information. 16. What is your age?
Age Range Business Leisure Overall
Under 18 0.92% 2.09% 1.77%
18-24 3.67% 4.18% 4.04%
25-34 12.84% 8.36% 9.60%
35-54 51.38% 27.53% 34.09%
55-64 20.18% 25.78% 24.24%
65+ 11.01% 32.06% 26.26%
Typical Age Range 35-54 35-54 35-54 No Response 0.91% 5.59% 4.35%
Survey Sample (N) = 110 304 414
Question Sample (n) = 109 287 396
Cheyenne’s visitors tend to be Generation X, Baby Boomers, and Silent Generation. It is good to see the high percentage of Generation X. This indicates a good trend for the future of the destination.

Visit Cheyenne
_____________________ Visitor Intercept Survey
7 - 22
17. Are you?
Gender Business Leisure Overall
Male 60.00% 40.26% 45.34%
Female 38.75% 51.52% 48.23%
Both Male and Female Marked 1.25% 8.23% 6.43% No response = 27.27% 24.01% 24.88%
Survey Sample (N) = 110 304 414
Question Sample (n) = 80 231 311
0.00%
10.00%
20.00%
30.00%
40.00%
50.00%
60.00%
70.00%
Business Leisure Overall
Male
Female
Both Male and Female
Marked

Visit Cheyenne
_____________________ Visitor Intercept Survey
7 - 23
18. What is your annual household income?
Income Level Business Leisure Overall
Under $30,000 2.30% 7.11% 5.77%
$30,000 - $45,000 18.39% 18.22% 18.27%
$46,000 - $60,000 14.94% 14.22% 14.42%
$61,000 - $75,000 19.54% 18.22% 18.59%
Above $75,000 44.83% 42.22% 42.95% No response 20.91% 25.99% 24.64%
Survey sample = 110 304 414
Question sample = 87 225 312
The income level for visitors to Cheyenne tends to be above $75,000 household income.
0.00%
5.00%
10.00%
15.00%
20.00%
25.00%
30.00%
35.00%
40.00%
45.00%
50.00%
Under
$30,000
$30,000 -
$45,000
$46,000 -
$60,000
$61,000 -
$75,000
Above
$75,000
Business
Leisure
Overall

Visit Cheyenne
_____________________ Visitor Intercept Survey
7 - 24
19. What country is your home?
Country Business Leisure Overall
United States 98.15% 93.79% 94.97%
Other Country 1.85% 6.21% 5.03% No response 1.82% 4.61% 3.86%
Survey sample = 110 304 414
Question sample = 108 290 398
Other countries listed: Business
Canada
Netherlands
Leisure Canada (5)
Australia (4)
United Kingdom (4)
France (2)
Netherlands (2)
Ireland
Approximately one out of twenty (5.03%) visitors are foreign. This matches statewide data, as well as data for the surrounding states. As seen in the following questions the following are the primary points of origin: Wyoming, Colorado, Texas, California, Nebraska, Missouri and Michigan.

Visit Cheyenne
_____________________ Visitor Intercept Survey
7 - 25
19. (Continued) US Zip Codes listed:
Cheyenne, Wyoming Intercept
Survey Response Origins – US
Business Segment
n=80

Visit Cheyenne
_____________________ Visitor Intercept Survey
7 - 26
Cheyenne, Wyoming Intercept
Survey Response Origins – US
Leisure Segment
19. (Continued) US Zip Codes listed:
n=215

Visit Cheyenne
_____________________ Visitor Intercept Survey
7 - 27
19. (Continued) Business Travelers Wyoming - 22 (27.16%) Acme Afton Atlantic City Bar Nunn (2) Bitter Creek Cody (2) Creston Eden Evanston (2) Gillette Hoback Junction Jackson Pinedale Prairie Center Recluse Ryan Park Sheridan (3) Colorado - 14 (17.28%) Arvada (3) Aurora Denver (5) Grand Jct Gunnison Littleton Parker Silt Texas - 7 (8.64%) Cypress
Garland Livingston Lufkin Orange Round Rock Van California - 7 (8.64%) Bloomington Roseland San Diego (2) San Francisco South Lake Tahoe Susanville Nebraska - 6 (7.41%) Crookston North Platte Ogallala Omaha (2) Scottsbluff Arizona - 4 (4.94%) Sun Arizona Boys Ranch Bensch Ranch Chandler Idaho - 3 (3.70%) Boise Hollister Moscow Oregon - 3 (3.70%)
Parkrose Portland Sweet Home Missouri - 3 (3.70%) Archie Bucyrus Saint Louis Foreign - 2 (2.47%) Canada Netherlands Minnesota - 2 (2.47%) Cobden Saint Paul New Mexico - 2 (2.47%) Albuquerque (2) Mississippi - 1 (1.23%) Gautier Utah - 1 (1.23%) Saint George Illinois - 1 (1.23%) Plattville South Carolina - 1 (1.23%) Simpsonville Oklahoma - 1 (1.23%) Oklahoma City Montana - 1 (1.23%) Clancy

Visit Cheyenne
_____________________ Visitor Intercept Survey
7 - 28
19. (Continued) Leisure Travelers Colorado - 30 (13.33%) Aurora Boulder Brighton (2) Cimarron Hills Denver (5) Firestone (2) Fort Collins (6) Fruitvale (2) Greeley Johnstown Longmont (4) Louisville Parker Windsor Yuma Foreign - 18 (8.00%) Australia (4) Canada (5) France (2) Ireland Netherlands (2) United Kingdom (4) Nebraska - 18 (8.00%) Bridgeport Crawford Filley (2) Kearney Lexington Lincoln (6) Nemaha North Platte Omaha
Winnebago York (2) California - 15 (6.67%) Agoura Anaheim Apple Valley Barstow Diamond Bar Fair Oaks Freestone Lakeport Larkspur Livermore (2) San Jose (2) Sunnyvale West Covina Texas - 12 (5.33%) Addicks Aubrey Boerne Bonner Brazoria Harker Heights Houston Livingston Lubbock Round Rock Royse City Texas City Wyoming - 11 (4.89%) Afton Archer Bitter Creek (2)
Bordeaux Buffalo Cody Dayton Gillette (2) Jackson Missouri - 11 (4.89%) Avalon Bellefontaine Neighbors Chain of Rocks Des Peres Gladstone Independence Innsbrook Lebanon Peculiar Prairie City Rolla Michigan - 9 (4.00%) Alpena (2) Burtchville Canton Dearborn Heights Mio Novi (2) Saranac North Carolina - 7 (3.11%) Asheville Brentwood Cedar Island Murphy Newport (3)

Visit Cheyenne
_____________________ Visitor Intercept Survey
7 - 29
19. (Continued) Leisure Travelers – Continued Wisconsin - 6 (2.67%) Beloit Caryville Chenequa Glenwood City Vernon Waupaca Arizona - 6 (2.67%) Alpine Blue (2) Cottonwood Mesa Phoenix Montana - 5 (2.22%) Clancy Dagmar Evergreen Great Falls Helena Nevada - 5 (2.22%) Apache Batte Mtn (2) Henderson Las Vegas Indiana - 5 (2.22%) Belshaw Clermont Coatesville Colburn Eureka Ohio - 5 (2.22%) Cincinnati (2) Columbus Findlay New Albany Florida - 5 (2.22%) De Land Fort Myers Merritt Island Wesley Chapel (2) Kansas - 5 (2.22%)
Culver Hutchinson Kansas City Lenexa Mc Louth Oklahoma - 4 (1.78%) Broken Arrow Oklahoma City (3) Pennsylvania - 4 (1.78%) Collegeville Edisonville Fertility Mechanicsburg Utah - 4 (1.78%) Provo Salt Lake City (3) Illinois - 4 (1.78%) Barrington Hills Huntley Lake Forest Mulberry Grove Tennessee - 3 (1.33%) Chattanooga Fountain City Rogersville Washington - 3 (1.33%) Bremerton (2) Deer Park Kentucky - 3 (1.33%) Anchorage Lexington Reynolds Station Arkansas - 3 (1.33%) Beryl Hot Spgs Vl Springdale Minnesota - 2 (0.89%) Andover Blaine South Dakota - 2 (0.89%) Betts
Clayton Idaho - 2 (0.89%) Boise Pocatello New Mexico - 2 (0.89%) Albuquerque Deming Iowa - 2 (0.89%) Ames Center Grove New Jersey - 2 (0.89%) Rockaway Thorofare West Virginia - 1 (0.44%) Dunbar Connecticut - 1 (0.44%) Southington South Carolina - 1 (0.44%) Charleston Oregon - 1 (0.44%) Portland New York - 1 (0.44%) Brentwood Vermont - 1 (0.44%) Fonda Virginia - 1 (0.44%) Earlysville Maryland - 1 (0.44%) Saint Charles Rhode Island - 1 (0.44%) Warwick North Dakota - 1 (0.44%) Hickson Massachusetts - 1 (0.44%) Florence Alabama - 1 (0.44%) Mobile