curves 3 - abb group · pdf filecurves 3 . curves – user guide ... choice of the curve...
TRANSCRIPT

Curves 3

Curves – User guide – pag 2

Curves – User guide – pag 3
1. Introduction
Curves allows the visualization of the time-current, energy and peak limitation characteristics of ABB low voltage
devices. Program features are the guided verifications of the protection of cables, people and discrimination.
2. Use conditions
Warnings and use conditions are available here:
http://search.abb.com/library/Download.aspx?DocumentID=9AKK106103A2575&LanguageCode=en&DocumentPartI
d=&Action=Launch
Curves manual is available clicking on the question mark top right.

Curves – User guide – pag 4
3. Menu commands
Menu commands allow a simple management of the features of Curves.
Frequently used commands are proposed also in the toolbar with the icon represented left of the command described in
the following paragraphs.
3.1. File menu
New: Creates a new file.
Open: Opens a previously saved Curves file (extension *.crs).
Save: Saves the current project. The program will store the list of chosen objects, their status (visible-
not visible), the settings of trip units and the relations between objects (cable protection-
discrimination).
Save as: Saves the current project with a different filename and/or path.
Print: Prints a report with the current diagram and the visualized objects and the relays settings.
Exit: Closes Curves.
3.2. Home Menu
“New”:
o New: Adds a new object.
o Delete: Deletes the selected object.
“Output”:
o Copy values: Copies the descriptions, the reference voltage and all the other useful data of the
visualized objects in the clipboard. The information stored vary depending on the object.
o Copy diagram: Copies the current diagram in the clipboard; the diagram is available for
pasting in the wished format.
“Properties”:
o Toggle ID: Toggles ON – OFF the visualization of a user made ID for the current object.
o Color: Changes the color of the curve of the current object.
o Tickness: Changes the thickness of the curve of the current object.
o Pattern: Changes the pattern of the curve of the current object.
“Devices and relations”:
o Show related: Shows the objects linked to the current object for protection or discrimination
relations.
o Relations dialog: Opens the “Relations” window, where it is possible to assign the protection
of a specific cable to a circuit-breaker or fuse or a discrimination link between two circuit
breakers
o Coordinates: Opens the “Coordinates” window for the current object. The use of this feature
will be presented in paragraph 5.
“Currents”:
o IB: Visualizes a vertical line at the Ib of the current object.
o IZ: Visualizes a vertical line at 1,45xIz of the current object.
o Min Ik: Visualizes a vertical line at minimum fault current of the current object.

Curves – User guide – pag 5
o Max Ik: Visualizes a vertical line at the maximum fault current of the current object.
“View”:
o Zoom window: Zooms the area selected with the mouse.
o Zoom in.
o Zoom out. o Zoom Extension: Zoom in/out to automatically fit all the curves displayed in the diagram.
“Reports”:
o Project data: Enables the user to enter, or change, the data in the project heading (customer,
plant, project, board …).
“Export”:
o Ekip Connect: exports trip units settings in a format readable by Ekip Connect. Exip
connect user manual is available here:
https://library.e.abb.com/public/a3a733bfb5884fe1a8bdddc39208a612/1SDH000891R0002.p
df
3.3. Windows menu
“Lists”: permits to decide if “Objects” and “Relations” should be visible in the main window.
“Diagrams”: permits to decide which diagrams should be visible in the main window.
Curves – User guide – pag 6
4. Using curves
Example of Curves Workflow:
1) Choice of visualized object(s)
2) Definition of the verifications to check (cables protection – discrimination between circuit breakers)
3) Choice of the curve (Time-current, Energy limitation, Peak limitation)
4) Setting of the object(s) (if available)
5) Printouts
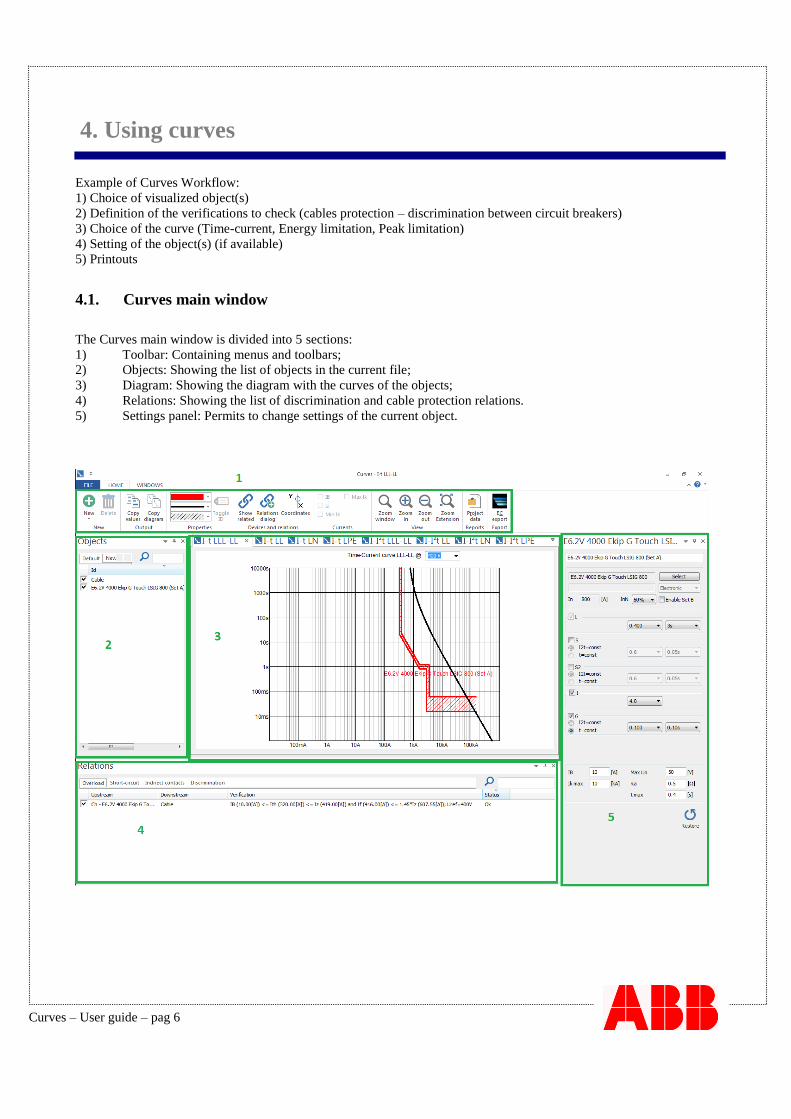
4.1. Curves main window
The Curves main window is divided into 5 sections:
1) Toolbar: Containing menus and toolbars;
2) Objects: Showing the list of objects in the current file;
3) Diagram: Showing the diagram with the curves of the objects;
4) Relations: Showing the list of discrimination and cable protection relations.
5) Settings panel: Permits to change settings of the current object.

Curves – User guide – pag 7
4.2. Objects
Click on “New” button to choose a product. ABB products (circuit breakers, fuses) will be selected through a specific
selection window. Once chosen and selected, the wished product will be added to the list of the visualized objects.
The available objects are
Cable: choice of a cable. The default data (Iz, k2S2) shown in cable window refers to a cable with 3 conductors
loaded, method of installation B2 (installation in cable trunking, standard IEC 60364-5-52). The data are user
customizable
Cb (Circuit breaker) with electronic trip unit: ABB Air or Moulded Case circuit breaker equipped with an
electronic trip unit.
Cb (Circuit breaker) with thermomagnetic trip unit: ABB Miniature or Moulded Case circuit breaker
equipped with a thermomagnetic trip unit.
Fuse: fuses with gG (general purpose) and aM (Motor start-up) fuse-links; sizes from ‘00’ to ‘3’ (NH sizes) and
rated current from 2A up to 630A. Also available fuses defined in the standard IEC 60269-2-1.
RCD (Residual Current Device): products with Idn from 0,01A up to 1A; A and AC classes; Instantaneous,
Selective and Anti-Perturbance versions.
User defined: definition of a curve per points, supplying abscissa and ordinate.
4.3. Available diagrams
I-t LLL: time-current devices tripping characteristic for three phase faults.
I-t LL: time-current devices tripping characteristic for two phase faults.
I-t LN: time-current devices tripping characteristic for single phase faults.
I-t LPE: time-current devices tripping characteristic for phase-earth faults.
I-I2t LLL: specific let through energy for three phase faults.
I-I2t LL: specific let through energy for two phase faults.
I-I2t LN: specific let through energy for single phase faults.
I-I2t LPE: specific let through energy for phase-earth faults.
Peak: current limitation curve.

Curves – User guide – pag 8
4.4. Setting the trip units
Current object
It is the currently selected object. Selecting an object need to:
Click on the description in the “Objects” section
Click on the curve
The curve of the current object is dashed.

Curves – User guide – pag 9
Circuit breaker with electronic trip unit
How to set an electronic trip unit?
In the control panel: Click on the description (in objects panel) or on the curve of the breaker to open its control
panel on the right. Choose the wished settings in the pop-up menus: the curves are updated in real time. Set ON-
OFF functions of the trip units by clicking on the corresponding check box.
Dragging the curve directly in the diagram: Move the mouse cursor on the edge of a curve until it changes
its shape into an horizontal double headed arrow for current thresholds, and a vertical double headed
arrow for time thresholds. Click and, keeping the left mouse button pressed, drag the curve in the wished
position.

Curves – User guide – pag 10
Function highlighting
Passing with the mouse on the curve, the part of the curve corresponding to the function on
which the mouse is passing will be highlighted. A tooltip will give information about the
function, the current settings and the coordinates on which the mouse cursor is.
Magnetic cursor
When the mouse cursor is next to a curve, the cursor is “magnetically attracted” by the curve:
this function permits to slide the curve and read the curves coordinates with high precision.

Curves – User guide – pag 11
WARNING
The program verifies in real time the coherency of the settings. Therefore it is not possible to
set thresholds which do not satisfy the condition:
I1 < I2 < (I2-S2) < I3
Circuit breaker with thermomagnetic trip unit
When a thermomagnetic trip unit has adjustable thresholds it can be set by dragging its curve or in its specific window.
When the threshold are fixed this features will be disabled.
Changing the breaker IB (the load current of the breaker), it is possible to appreciate the curve variation due to it.

Curves – User guide – pag 12
Cable The cable control panel contains the data used in the verifications. It is possible to customize all the default values.
The data used in the verifications are:
Iz: current carrying capacity.
K2S2: max withstandable energy during short circuit.
Ik min: min. fault current at line end.
Ik max: max. fault current at line beginning.

Curves – User guide – pag 13
Ik min calculator The calculator in the cable control panel allows a quick assessment of the minimum short
circuit current at line end, given the upstream contribution and the cable length.
Following the formulas and hypothesis used in the calculation:
22 )()(
95.0min
XsXpeXphRaRsRpeRphA
VIcc
Legenda:
V = Rated Voltage.
A = Phase coefficient = 1 for single-phase cables, or when PE and Neutral are not
distributed; √3 in all the other cases.
Rph = Phase Resistance at Tmax. Resistance of the phase conductor at the
maximum working temperature (70°C for PVC; 90°C for EPR).
Rpe = PE Resistance at Tmax. Resistance of the PE conductor (or Neutral, if the
PE is not available) at the maximum working temperature.
Xph = Phase Reactance. The reactance calculation considers conductors in flat
disposition, spaced.
Xpe = PE Reactance.
Rs = Resistance of the upstream circuit = 0.6 ∗ 𝑉√3 ∗ 𝐼𝑐𝑐𝑚𝑎𝑥⁄ .
Xs = Reactance of the upstream circuit = 0.8 ∗ 𝑉√3 ∗ 𝐼𝑐𝑐𝑚𝑎𝑥⁄ .
Ra = Earthing resistance of the network (only for TT systems).

Curves – User guide – pag 14
Fuse The data used to select and verify a fuse (Fuse-link type, Size, In) are displayed in the fuse control panel. It is possible to
select ABB fuses as well as fuses defined in the standard IEC 60269-2-1.
Residual current device The data used to select and verify a residual current circuit breaker (poles, Id, class, version) are displayed in its control
panel.

Curves – User guide – pag 15
User defined It is possible to define a curve by points, connected each other by a straight line. This object can be used to draw, for
instance, a MV relay.
It is possible to export (Export command) and import (Import command) the curves in .csv, .xls, .xlsx format.
The object “Area” works like the user defined curve, with the adding of a pattern which will fill in the area above or
below the curve, according to user choice.

Curves – User guide – pag 16
5. Advanced features
The chapter will describe the advanced features of the program:
The verifications of the protection of a cable;
The verification of discrimination;
The coordinates command;
The views creation;
The reference voltage of the diagram.
5.1. Relations
Cables protection and discriminations links are defined in the dialog window “Relations”.
Protection: links a cable to a device able to protect it against OverLoad (OL), Short Circuit (SC), Indirect Contacts (IC).
Combo boxes filter the list of protecting devices and protected cables.
Discrimination: creates a discrimination link between two circuit breakers. Verifications are made according to QT1.
The dialog window shows the following values:
Requested Is: requested discrimination value in [kA]. “Full” means discrimination up to the Ik.
Actual Is: discrimination value with current settings.
Ik: max. short circuit current in the downstream circuit breaker; it is the discrimination value to reach to
achieve full discrimination.
Is max: max discrimination value achievable by the couple of circuit breakers when the rules defined in QT1
are accomplished. This value is read from the coordination tables (energy discrimination).
Curves – User guide – pag 17
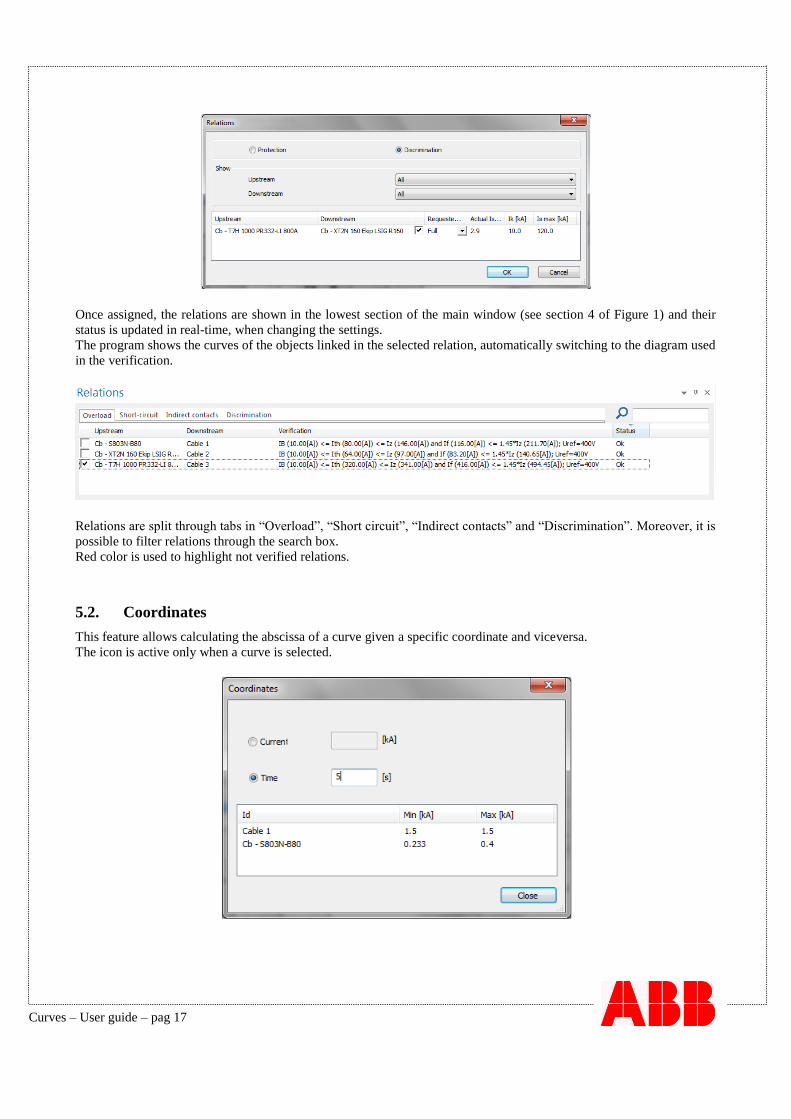
Once assigned, the relations are shown in the lowest section of the main window (see section 4 of Figure 1) and their
status is updated in real-time, when changing the settings.
The program shows the curves of the objects linked in the selected relation, automatically switching to the diagram used
in the verification.
Relations are split through tabs in “Overload”, “Short circuit”, “Indirect contacts” and “Discrimination”. Moreover, it is
possible to filter relations through the search box.
Red color is used to highlight not verified relations.
5.2. Coordinates
This feature allows calculating the abscissa of a curve given a specific coordinate and viceversa.
The icon is active only when a curve is selected.

Curves – User guide – pag 18
5.3. Views creation
In the “Objects” panel, it is possible to create views in which visualize only the desired objects.
Clicking on “New”, the view is created, and it can be renamed. Checking the desired objects, they are inserted in the new
view. Views remain memorized, and changing settings in a view, they are automatically changed in all the views.
Objects, in each view, can be sorted by alphabetical order in each column clicking on the column header, and can be
filtered using the search box.
5.4. Diagram reference voltage
This feature permits to change the reference voltage of the diagram. This is not related to the breakers behavior at
different voltage levels.
This functionality enables the user to visualize breakers, whose curves are valid at different voltage levels, in the same
diagram at the same time; it can be particularly useful in case of different voltages in the same plant.
In the following pictures, the same diagram is shown with two different reference voltages. In essence, the change of the
reference voltage of the graph moves the curves horizontally.

Curves – User guide – pag 19
6. Print commands
6.1. Print
The print report created by Curves is a document with:
Project data
Current diagram
Reference voltage
Drawn objects and related charachteristics (Trip units settings; current carrying capacity of cables, etc.)
Current relation (verification and status)