current conditions and trends assessment
TRANSCRIPT
Minnesota West Central Landscape
Current Conditions andTrends Assessment
MinnesotaForest
ResourcesCouncil
Landscape Program
Draft, March 2001

Minnesota Forest Resources Council DocumentLandscape Technical Document, Draft, March 2001 (LT-0301d)©Copyright 2001, Minnesota Forest Resources Council
This document is on the Internet at www.iic.state.mn.us/finfo/landscap/3/wc.htmlInformation about the Minnesota Forest Resources Council and the Landscape Program can be found atwww.frc.state.mn.us. Information on the Landscape Program also is located at the Interagency InformationCooperative Internet site, www.iic.state.mn.us.
Equal opportunity to participate in and benefit from Minnesota Forest Resources Council programs is available to allindividuals regardless of race, color, creed, religion, national origin, sex, marital status, status with regard to publicassistance, age, sexual orientation, or disability. Discrimination inquiries should be sent to the Minnesota ForestResources Council, 2003 Upper Buford Circle, St. Paul, MN 55108; or the Equal Opportunity Office, Department of theInterior, Washington, D.C. 20240.
This information is available in an alternative format upon request.
Project Leader - Chad Skally, Minnesota Forest Reources CouncilDocument Formatting - Sally Ruckmar, Minnesota Department of Natural ResourcesSocial and Economic Data Collected by - Scott Wiedemer
Current Conditions and Trends Assessment
3
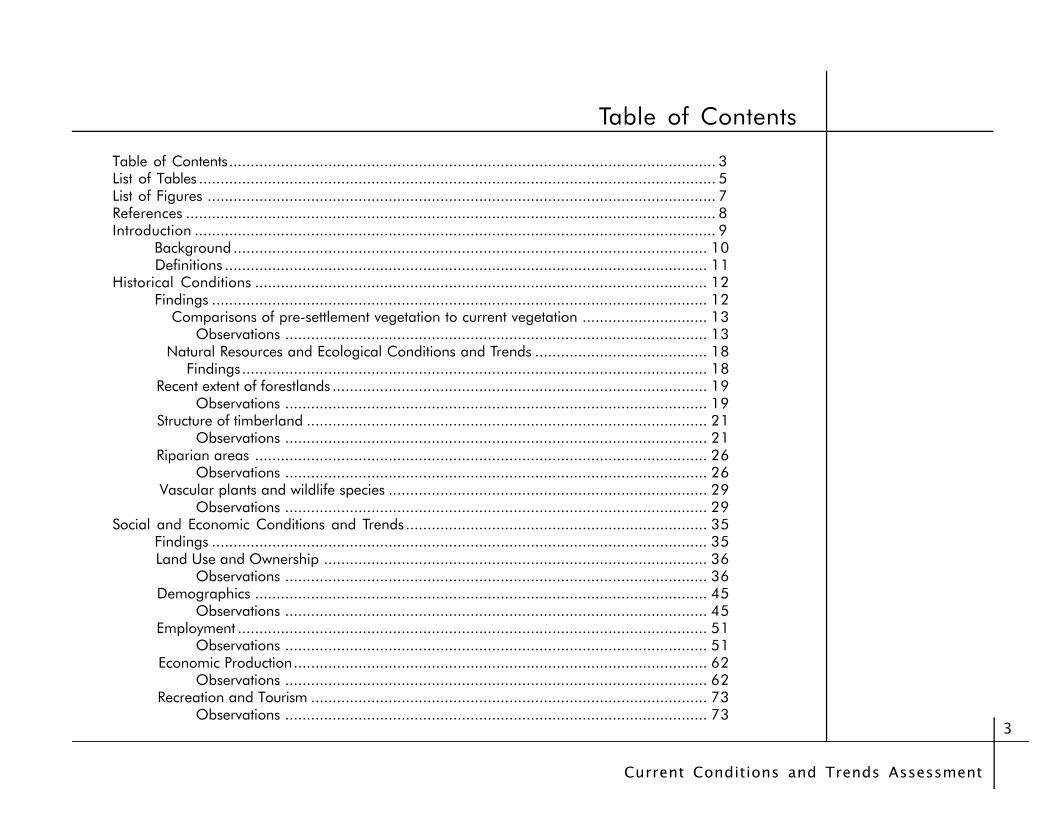
Table of Contents
Table of Contents................................................................................................................. 3List of Tables ........................................................................................................................ 5List of Figures ...................................................................................................................... 7References ........................................................................................................................... 8Introduction ......................................................................................................................... 9 Background .............................................................................................................. 10 Definitions ................................................................................................................ 11Historical Conditions ......................................................................................................... 12 Findings ................................................................................................................... 12 Comparisons of pre-settlement vegetation to current vegetation ............................. 13 Observations .................................................................................................. 13 Natural Resources and Ecological Conditions and Trends ........................................ 18 Findings............................................................................................................ 18 Recent extent of forestlands ....................................................................................... 19 Observations .................................................................................................. 19 Structure of timberland ............................................................................................. 21 Observations .................................................................................................. 21 Riparian areas ......................................................................................................... 26 Observations .................................................................................................. 26 Vascular plants and wildlife species .......................................................................... 29 Observations .................................................................................................. 29Social and Economic Conditions and Trends...................................................................... 35 Findings ................................................................................................................... 35 Land Use and Ownership ......................................................................................... 36 Observations .................................................................................................. 36 Demographics ......................................................................................................... 45 Observations .................................................................................................. 45 Employment ............................................................................................................. 51 Observations .................................................................................................. 51 Economic Production................................................................................................ 62 Observations .................................................................................................. 62 Recreation and Tourism ............................................................................................ 73 Observations .................................................................................................. 73

Minnesota West Central Landscape Region
4
Appendix A. Metadata - General Information of Data ......................................................... 80Appendix B. Summary of FIA Sampling and Estimation Procedures ..................................... 83

Current Conditions and Trends Assessment
5
List of Tables
Table 1. Summary of Rare Natural Features, by Landscape and Feature Type.................... 12Table 2. Difference between Bearing Tree data and 1990 FIA data rounded to the nearestpercent) ............................................................................................................................. 16Table 3. Area (acres) of Land Use in the West Central Landscape, 1977 and 1990 .............. 20Table 4. Ratio of Forestland to Nonforestland for the West Central Landscape, 1977 and 1990 ................................................................................................................................. 20Table 5. 1977 FIA Acrea (acres) by Timberland Type & Stand Size Class for the West CentralLandscape.......................................................................................................................... 24Table 6. 1990 FIA Acrea (acres) by Timberland Type & Stand Size Class for the West CentralLandscape.......................................................................................................................... 25Table 7. Density of Waterways, by Ecological Subsection, in the West Central Landscape .... 28Table 8. Wetlands in the West Central Landscape................................................................ 28Table 9. Richness of vascular plants in Owenby and Morley (1991) by MFRC Landscape ..... 30Table 10. Numbers of vascular plants in Owenby and Morley (1991) with recorded occurrencelimited to a particular MFRC Landscape ............................................................................. 31Table 11. Richness of forest-associated mammals, amphibians and reptiles, and breedingbirds in Minnesota .............................................................................................................. 32Table 12. Status of Minnesota’s forest-associated endangered, threatened and special concernvertebrate wildlife, 1984 ..................................................................................................... 33Table 13. Status of Minnesota’s forest-associated endangered, threatened and special concernvertebrate wildlife, 1996 ..................................................................................................... 34Table 14. Area of land by GAP ownership groups for the West Central Landscape ............... 38Table 15. Area of Ownership Classes for the West Central Landscape, 1977 and 1990 ...... 39Table 16. Area of Ownership by Public and Private for the West Central Landscape, 1977 and1990 .................................................................................................................................. 40Table 17. Area of land use classes for the West Central Landscape ..................................... 43Table 18. Population of Minnesota and Counties in the West Central Landscape ................ 46Table 19. Population Projections for Minnesota and counties in the West CentralLandscape.......................................................................................................................... 47Table 20. Population by age group for Minnesota and the West Central Landscape ........... 48
Minnesota West Central Landscape Region
6
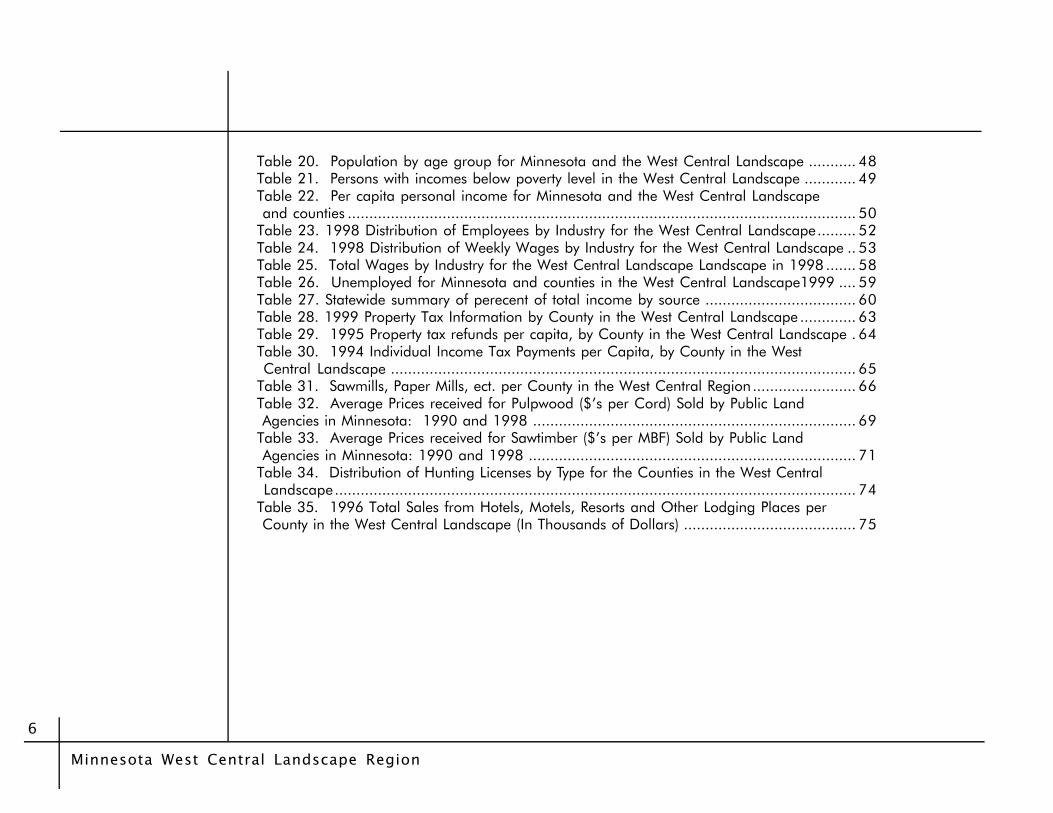
Table 20. Population by age group for Minnesota and the West Central Landscape ........... 48Table 21. Persons with incomes below poverty level in the West Central Landscape ............ 49Table 22. Per capita personal income for Minnesota and the West Central Landscape and counties ...................................................................................................................... 50Table 23. 1998 Distribution of Employees by Industry for the West Central Landscape......... 52Table 24. 1998 Distribution of Weekly Wages by Industry for the West Central Landscape .. 53Table 25. Total Wages by Industry for the West Central Landscape Landscape in 1998 ....... 58Table 26. Unemployed for Minnesota and counties in the West Central Landscape1999 .... 59Table 27. Statewide summary of perecent of total income by source ................................... 60Table 28. 1999 Property Tax Information by County in the West Central Landscape ............. 63Table 29. 1995 Property tax refunds per capita, by County in the West Central Landscape . 64Table 30. 1994 Individual Income Tax Payments per Capita, by County in the West Central Landscape ............................................................................................................ 65Table 31. Sawmills, Paper Mills, ect. per County in the West Central Region........................ 66Table 32. Average Prices received for Pulpwood ($’s per Cord) Sold by Public Land Agencies in Minnesota: 1990 and 1998 ........................................................................... 69Table 33. Average Prices received for Sawtimber ($’s per MBF) Sold by Public Land Agencies in Minnesota: 1990 and 1998 ............................................................................ 71Table 34. Distribution of Hunting Licenses by Type for the Counties in the West Central Landscape......................................................................................................................... 74Table 35. 1996 Total Sales from Hotels, Motels, Resorts and Other Lodging Places per County in the West Central Landscape (In Thousands of Dollars) ........................................ 75
Current Conditions and Trends Assessment
7
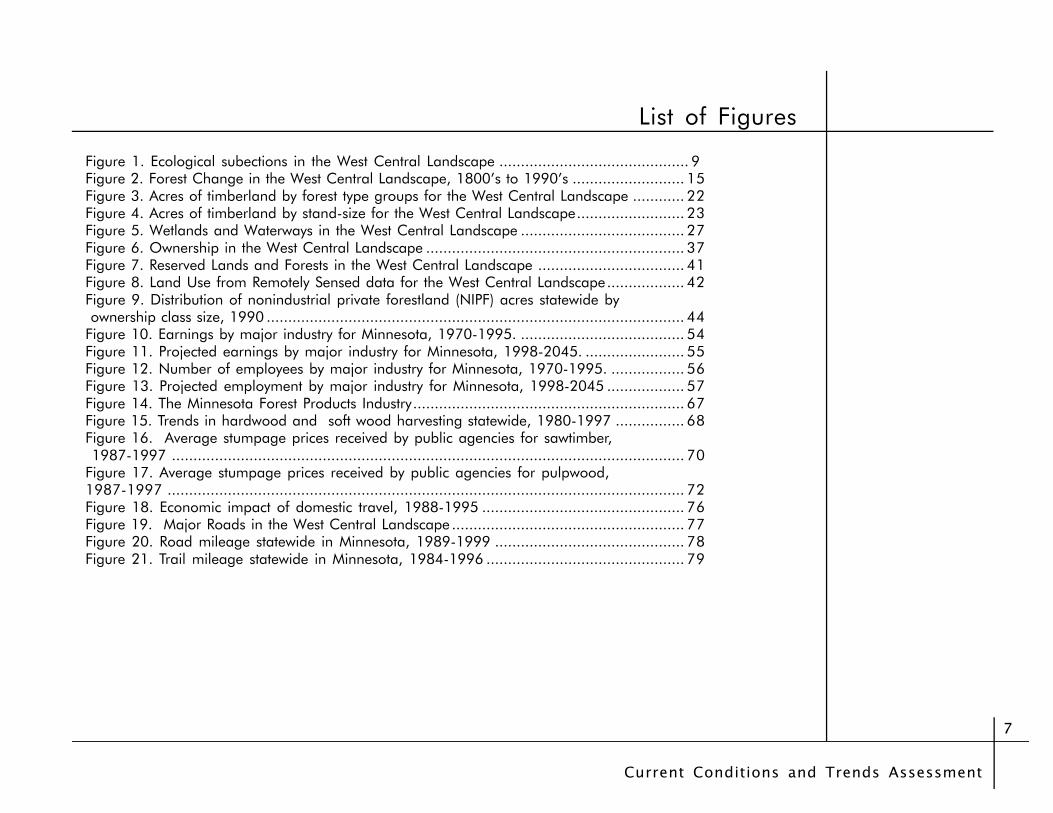
List of Figures
Figure 1. Ecological subections in the West Central Landscape ............................................ 9Figure 2. Forest Change in the West Central Landscape, 1800’s to 1990’s .......................... 15Figure 3. Acres of timberland by forest type groups for the West Central Landscape ............ 22Figure 4. Acres of timberland by stand-size for the West Central Landscape......................... 23Figure 5. Wetlands and Waterways in the West Central Landscape ...................................... 27Figure 6. Ownership in the West Central Landscape ............................................................ 37Figure 7. Reserved Lands and Forests in the West Central Landscape .................................. 41Figure 8. Land Use from Remotely Sensed data for the West Central Landscape.................. 42Figure 9. Distribution of nonindustrial private forestland (NIPF) acres statewide by ownership class size, 1990 ................................................................................................. 44Figure 10. Earnings by major industry for Minnesota, 1970-1995. ...................................... 54Figure 11. Projected earnings by major industry for Minnesota, 1998-2045. ....................... 55Figure 12. Number of employees by major industry for Minnesota, 1970-1995. ................. 56Figure 13. Projected employment by major industry for Minnesota, 1998-2045 .................. 57Figure 14. The Minnesota Forest Products Industry............................................................... 67Figure 15. Trends in hardwood and soft wood harvesting statewide, 1980-1997 ................ 68Figure 16. Average stumpage prices received by public agencies for sawtimber, 1987-1997 ....................................................................................................................... 70Figure 17. Average stumpage prices received by public agencies for pulpwood,1987-1997 ........................................................................................................................ 72Figure 18. Economic impact of domestic travel, 1988-1995 ............................................... 76Figure 19. Major Roads in the West Central Landscape ...................................................... 77Figure 20. Road mileage statewide in Minnesota, 1989-1999 ............................................ 78Figure 21. Trail mileage statewide in Minnesota, 1984-1996 .............................................. 79

Minnesota West Central Landscape Region
8
References
Almendinger, J. C. Minnesota’s Bearing Tree Database.Minnesota Department of Natural Resources. St.Paul,MN, 1996.
Generic Environmental Impact Statement (GEIS) Study ontimber Harvesting and Forest Management in Minne-sota. Minnesota Environmental Quality Board.1994.
Green, J. C. “Birds and Forests: A Management andConservation Guide.” MN Dept. of Natural Re-sources. St. Paul, MN, 1995.
Jakes, P. The fourth Minnesota forest inventory: area.Resource Bull. NC-54. USDA Forest Service, NorthCentral Forest Experiment Station. St. Paul, MN,1980.
Heinselman, M. L. “Interpretation of Francis J.Marschner’s Map of the Original Vegetation of Min-nesota.” USDA Forest Service North Central ForestExperiment Station. St. Paul, MN, 1974.
Murray, P. Forest Statistics for Minnesota’s Northern PineUnit, 1990. USDA Forest Service, North
Central Forest Experiment Station. St. Paul, MN, 1991.Miles, P. D., C. M. Chen, & E. C. Leatherberry. Minnesota
Forest Statistics, 1990, Revised. USDA Forest ServiceNorth Central Forest Experiment Station. St. Paul,MN, 1995.
Minnesota Department of Natural Resources. “Checklistof Endangered and Threatened Animal and PlantSpecies of Minnesota.” St. Paul, MN, 1984.
Minnesota Department of Natural Resources.“Minnesota’s List of Endangered, Threatened andSpecial Concern Species.” St. Paul, MN, 1996.
Minnesota Department of Natural Resources, Trails andWaterways Unit. Minnesota Registry of Public Recre-ational Trail Mileages. St. Paul, MN, 1996.
Minnesota Forest Resources Council. Status of MinnesotaTimber Harvesting and Silvicultural Practice in 1996.St.Paul, MN, 1996
Owenby, G. B. and T. Morley. Vascular Plants of Minne-sota: A Checklist and Atlas. Minneapolis: U of MNPress, 1991.
Tester, J. R. Minnesota’s Natural Heritage. St. Paul: U ofMN Press, 1995.

Current Conditions and Trends Assessment
9
The process for conducting assessments of land-scape conditions and trends for the East Central land-scape of Minnesota (see Figure 1) is explained in thebackground section below. At the time of this writing, thefollowing sections of the assessment are completed:
•Historical Conditions•Natural Resource and Ecological Conditions and
Trends•Social and Economic Conditions and Trends
The information in this assessment will serve as
Introduction
Figure 1. Ecological subections in the West Central landscape.
the starting point for establishing a regional forest re-source committee in the East Central landscape, whichincludes all of Douglas, Kandiyohi, Meeker, Otter Tail,Pope, Stearns, Todd, and Wadena counties. As additionalecological and social/economic data becomes available, itwill be analyzed and presented to the regional committeefor its consideration in determining desired future condi-tions, goals, and strategies for the landscape.
Source: DNR

Minnesota West Central Landscape Region
10
BackgroundSubdivision 2 of Minnesota’s 1995 Sustainable
Forest Resources Act (SFRA) authorizes the establishmentof citizen-based regional forest resource committees to fosterlandscape-based forest resource planning.
The SFRA defines landscape-level planning aslong-term, broad-based efforts that may require extensiveanalysis and planning over large areas and that may requireextensive coordination among all landowners in a region.Regional committees provide the opportunity to involveprivate citizens, forestry professionals, and members ofvarious interest groups in implementing landscape-levelplanning to promote forest sustainability. The SFRA chargesthe regional committees to:
•include representative interests;•serve as a forum to discuss issues;•identify and implement an open and public process
whereby landscape-level strategic planning can occur;•identify sustainable forest resource goals for the land-
scape and strategies to achieve those goals; and•provide a regional perspective on forest sustainability to
the Minnesota Forest Resources Council.
The landscape program follows a general planningprocess in each landscape region. The regional forestresource committees use this five-step process to gather,share, and communicate information. It is:
•prepare an assessment of current conditions and
trends (ecological, social, and economic) in thelandscape;
•determine a vision, goals, and issues that addressexisting and potential forest resource conditionsconsidered desirable for the region;
•develop strategies for implementing the visionand goals, and resolve issues in the region;
•encourage voluntary implementation of thestrategies by coordination among landowners; and
•conduct an evaluation to determine how well thestrategies accomplish the vision and goals andresolve issues.
This “Current Conditions and Trends Assess-ment: West Central Landscape Region” represents thefirst step in the general planning process for southeast-ern Minnesota. Resource managers from the Minne-sota Forest Resources Council, Department of NaturalResources, United States Forest Service, and countyland departments have analyzed the natural resourcesand ecological conditions and trends and preparedtheir findings. Although this assessment is a work inprogress, it contains enough information to get theregional committee started on the steps in the generalplanning process. As additional ecological and social/economic data becomes available it will be presentedto the regional committee to use in determiningdesired future conditions, goals, and strategies for theforest resources in the landscape.
Current Conditions and Trends Assessment
11
DefinitionsObservations: Significant points about the informationpresented in the graphs and tables. At the beginning of eachsection in the assessment there are basic observations aboutthe data presented
Findings: A general theme that emerges from a set ofobservations. Overall findings from the assessment are notedin this document’s introduction; findings about specifictopics are listed at the beginning of that section.
Issues: An area of concern based on the interpretation ofthe findings and people’s values. Some issues regardingforest resources in southeastern Minnesota are listed in theintroduction to this document.
Goals: A benchmark to strive towards in resolving theissues. Goals are not listed in this assessment; the SoutheastRegional Forest Resource Committee will set goals foraddressing each issue.
Strategies: Methods to meet goals. These also are not listedin the assessment but will be part of the regional forestresource committee’s work.
Minnesota West Central Landscape Region
12
Findings
Historical Conditions and Trends
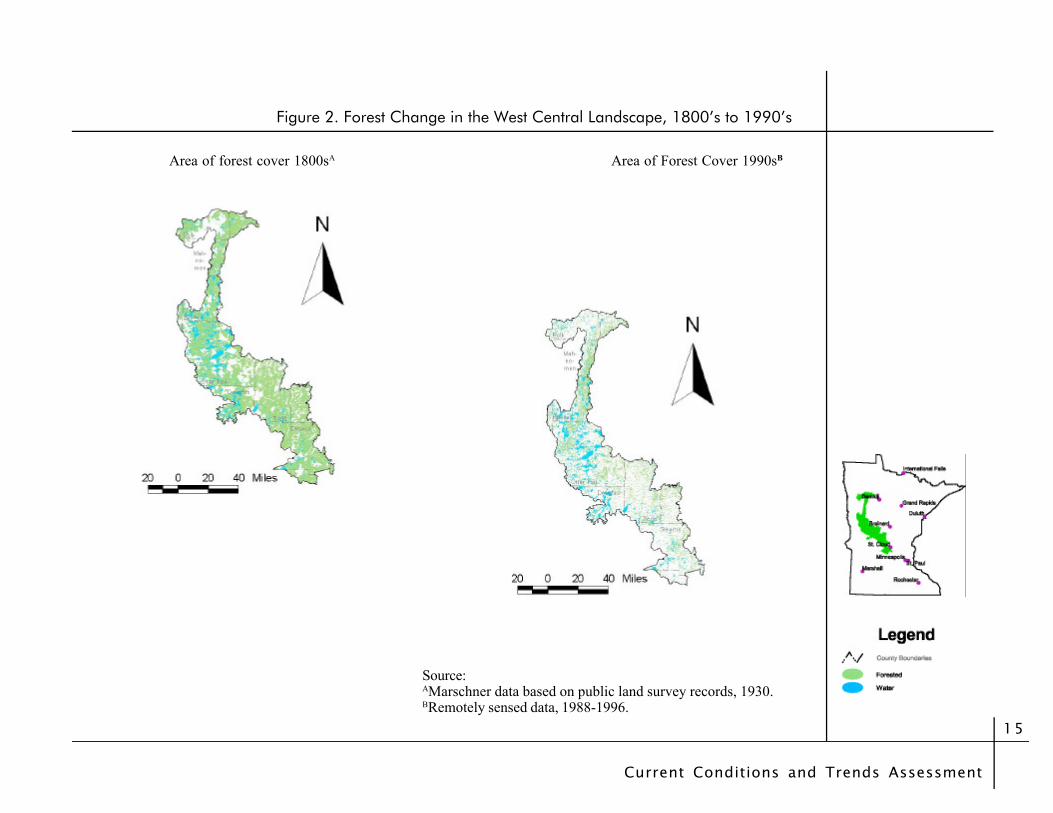
There is less forest than historically (Figure 2).
Current Conditions and Trends Assessment
13
Comparison of Pre-settlement vegetation to today
Observations
Compared to pre-settlement not as much of the region isstill forested (Figure 2).
There has been a noticeable decrease in tamarack, andincrease in box elder (Table 2).
Minnesota West Central Landscape Region
14
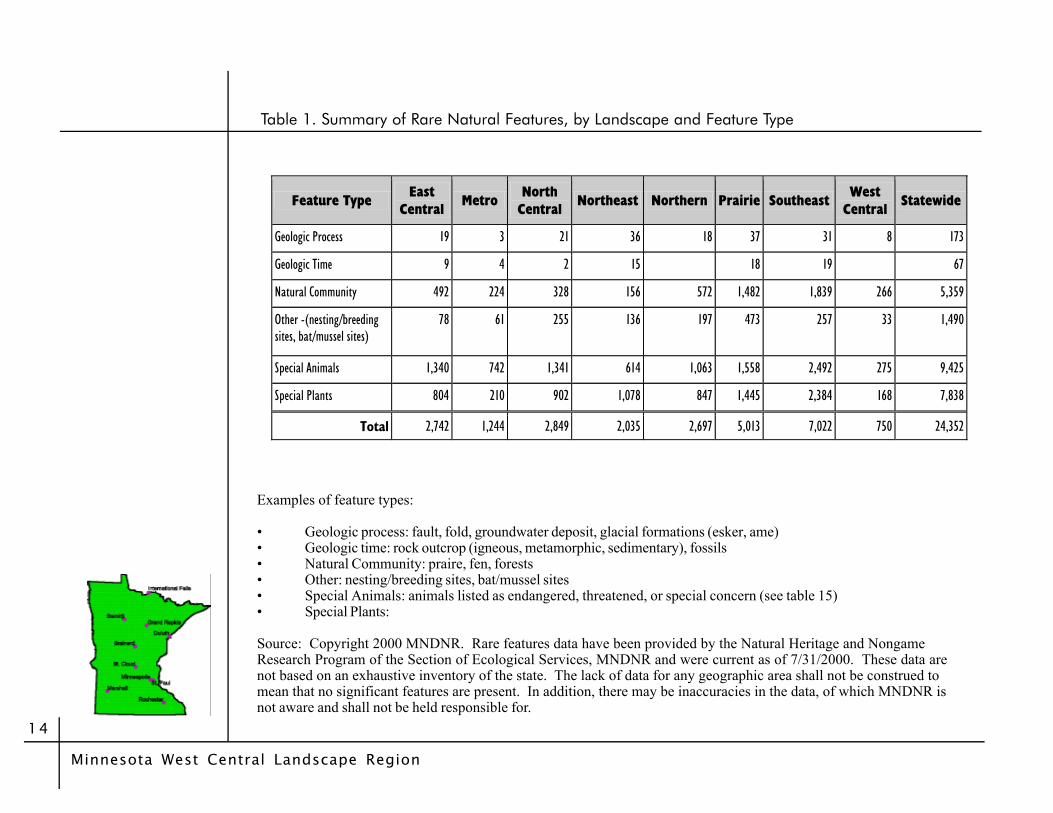
Table 1. Summary of Rare Natural Features, by Landscape and Feature Type
Examples of feature types:
• Geologic process: fault, fold, groundwater deposit, glacial formations (esker, ame)• Geologic time: rock outcrop (igneous, metamorphic, sedimentary), fossils• Natural Community: praire, fen, forests• Other: nesting/breeding sites, bat/mussel sites• Special Animals: animals listed as endangered, threatened, or special concern (see table 15)• Special Plants:
Source: Copyright 2000 MNDNR. Rare features data have been provided by the Natural Heritage and NongameResearch Program of the Section of Ecological Services, MNDNR and were current as of 7/31/2000. These data arenot based on an exhaustive inventory of the state. The lack of data for any geographic area shall not be construed tomean that no significant features are present. In addition, there may be inaccuracies in the data, of which MNDNR isnot aware and shall not be held responsible for.
Feature Type East Central Metro North
Central Northeast Northern Prairie Southeast West Central Statewide
Geologic Process 19 3 21 36 18 37 31 8 173
Geologic Time 9 4 2 15 18 19 67
Natural Community 492 224 328 156 572 1,482 1,839 266 5,359
Other -(nesting/breeding sites, bat/mussel sites)
78 61 255 136 197 473 257 33 1,490
Special Animals 1,340 742 1,341 614 1,063 1,558 2,492 275 9,425
Special Plants 804 210 902 1,078 847 1,445 2,384 168 7,838
Total 2,742 1,244 2,849 2,035 2,697 5,013 7,022 750 24,352
Current Conditions and Trends Assessment
15
Area of Forest Cover 1990sBArea of forest cover 1800sA
Figure 2. Forest Change in the West Central Landscape, 1800’s to 1990’s
Source:AMarschner data based on public land survey records, 1930.BRemotely sensed data, 1988-1996.

Minnesota West Central Landscape Region
16
Table 2. Difference between Bearing Tree data and 1990 FIA data (roundedto the nearest percent)
Name Percent Difference
Proportional Difference
Alder--Alnus incana, A. viridis 0 0 Ash--Fraxinus nigra, F. pennsylvanica, F. americana 4 2 Aspen--Populus tremuloides, P. grandidentata, P. balsamifera (in lesser part) -3 -1 Balm-of-Gilead--Populus balsamifera (in greater part) 1 2 Beech--Fagus grandifolia (unknown from Minn. possibly Carpinus caroliniana 0 0 Birch--Betula papyrifera, B. cordifolia 1 1 Black Birch--Betula nigra, B. alleghaniensis (in part ?) 0 0 Black Oak--Quercus nigra, Q. ellipsoidalis (in part) 0 0 Black Walnut--Juglans nigra 0 0 Blue Beech--Carpinus caroliniana 0 0 Box-Elder--Acer negundo 3 124 Bur Oak--Quercus macrocarpa 3 1 Butternut--Juglans cinerea 0 2 Cherry--Prunus serotina, P. pennsylvanica 0 2 Cottonwood--Populus deltoides 0 5 Elm--Ulmus americana, U. rubra, U. thomasii 2 1 Fir--Abies balsamea 0 2 Hackberry--Celtis occidentalis 0 8 Hawthorn--Crataegus spp. 0 0 Hickory--Carya cordiformis, C. ovata 0 0 Illegible or Not Recorded--equivalent unknown 0 0 Ironwood--Ostrya virginiana -1 -2 Jack Oak--Quercus ellipsoidalis 0 -2 Jack Pine--Pinus banksiana 0 4

Current Conditions and Trends Assessment
17
Name Percent Difference
Proportional Difference
Juniper or Red Cedar--Juniperus virginiana 0 15 Linden or Basswood--Tilia americana 6 2 Maple--Acer rubrum, A. saccharum, A. saccharinum -2 -4 Mountain Ash--Sorbus decora, S. americana 0 0 Oak--Quercus rubra, Q. macrocarpa, Q. ellipsoidalis, Q. velutina, Q. alba, Q. bicolor -16 0 Pine--Pinus strobus, P. resinosa, P. banksiana -1 0 Plum--probably Prunus americana 0 0 Red Elm--Ulmus rubra 1 0 Red Oak --Quercus rubra, Q. ellipsoidalis (in part or as hybrid) 7 3 Red, Norway, or Yellow Pine--Pinus resinosa 0 4 Spruce--Picea mariana, P. glauca 0 -2 Sugar Maple--Acer saccharum 1 1 Tamarack--Larix laricina -5 -3 Thorn--probably Crataegus spp. 0 0 White Cedar--Thuja occidentalis 0 0 White Pine--Pinus strobus 0 -1 Willow--Salix spp. 0 1 Witch Hazel--Hamamelis virginiana 0 0 Yellow Birch--Betula alleghaniensis 0 8
Table 2. Difference between Bearing Tree data and 1990 FIA data (rounded to thenearest percent) Continued
Source: Public Land Survey Bearing Tree Data, late 1800s, and 1990 US Forest Service ForestInventory and Analysis. Summary produced by John C. Almendinger, MNDNR. 8/1997.

Minnesota West Central Landscape Region
18
Natural Resources and Ecological Conditions and Trends
Findings
The region is mostly non-forested. Areas containingtimberland have slightly increased (Recent Forest andStructure of Timberland Observations).
The area is mostly upland, with a higher density ofintermittent streams versus perennial streams, and ditches(Riparian Observations).
Current Conditions and Trends Assessment
19
Recent Extent of Forestland
Observations
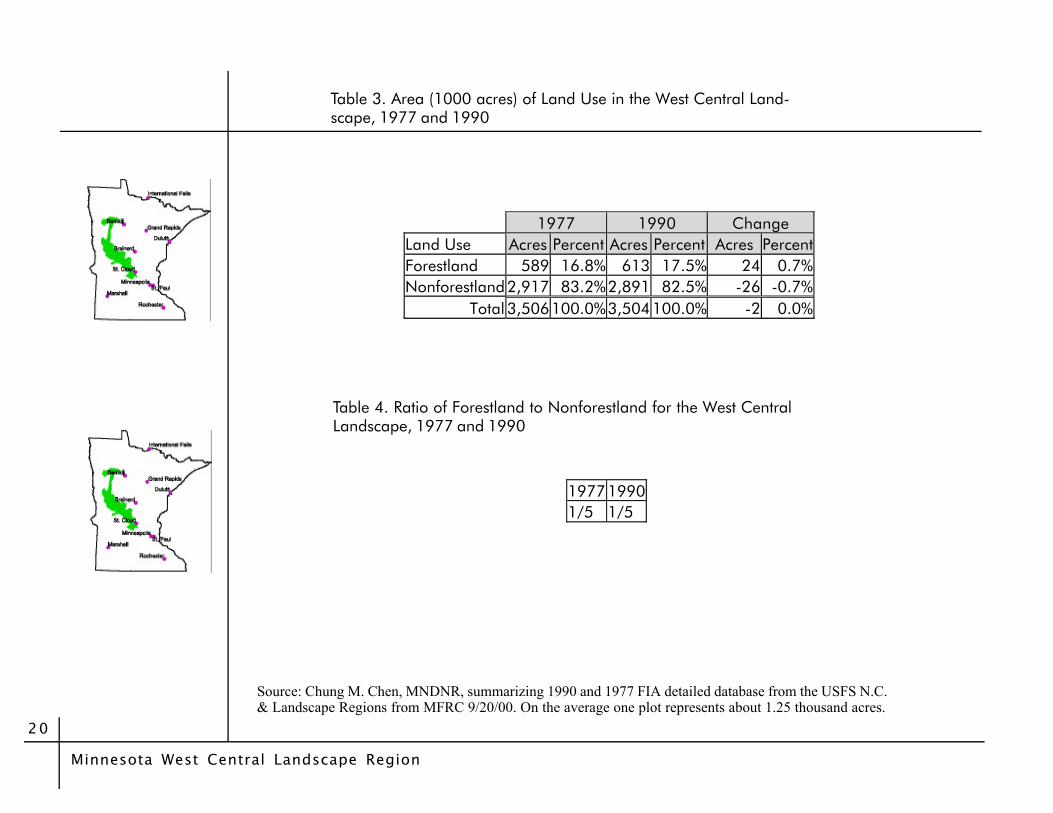
This area is mostly non-forested (Tables 3 and 4).
Minnesota West Central Landscape Region
20
Table 3. Area (1000 acres) of Land Use in the West Central Land-scape, 1977 and 1990
Source: Chung M. Chen, MNDNR, summarizing 1990 and 1977 FIA detailed database from the USFS N.C.& Landscape Regions from MFRC 9/20/00. On the average one plot represents about 1.25 thousand acres.
1977 1990 Change Land Use Acres Percent Acres Percent Acres Percent Forestland 589 16.8% 613 17.5% 24 0.7% Nonforestland 2,917 83.2% 2,891 82.5% -26 -0.7%
Total 3,506 100.0% 3,504 100.0% -2 0.0%
Table 4. Ratio of Forestland to Nonforestland for the West CentralLandscape, 1977 and 1990
1977 1990 1/5 1/5

Current Conditions and Trends Assessment
21
Structure of Timberland
Observations
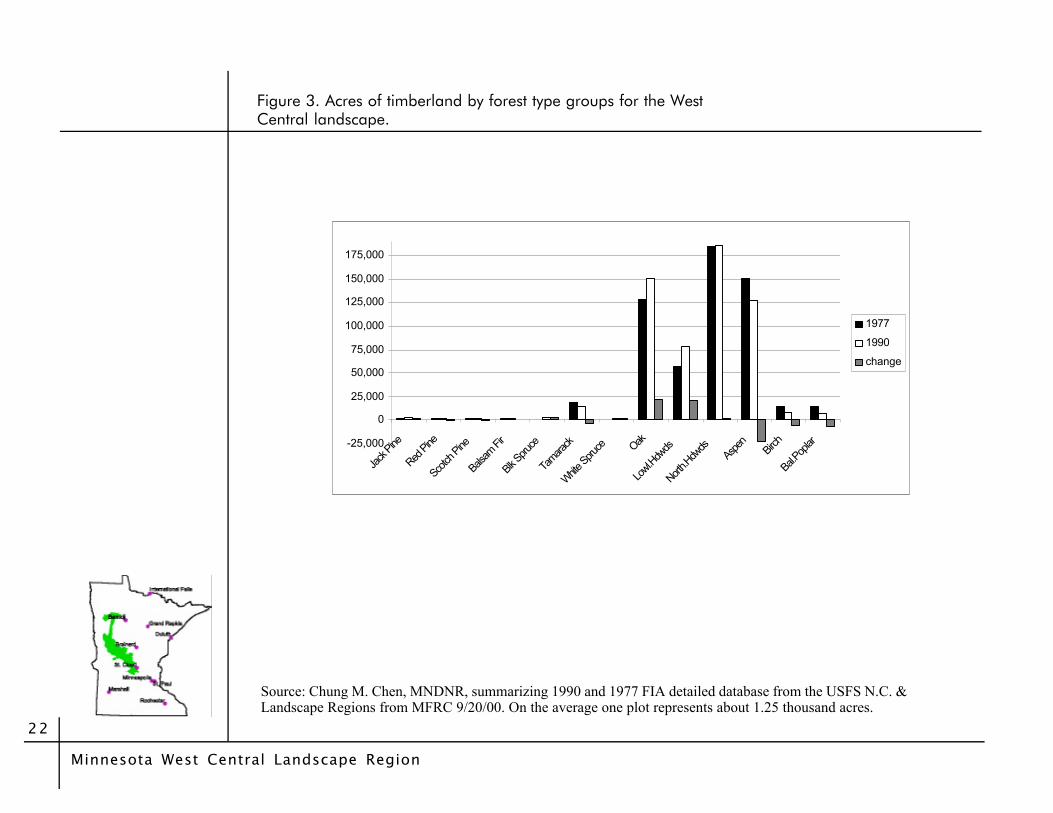
Oak and Hardwoods timberland types have increasedsince 1977 while aspen, birch, poplar, and tamarack havegone down (Figure 3, Tables 5 and 6).
All size classes have increased since 1977 exceptpoletimber (Figure 4).
Minnesota West Central Landscape Region
22
-25,000
0
25,000
50,000
75,000
100,000
125,000
150,000
175,000
Jack
Pine
Red Pine
Scotch
Pine
Balsam
Fir
Blk Spru
ce
Tamara
ck
White Spru
ce Oak
Lowl.H
dwds
North.H
dwds
Aspe
nBirc
h
Bal.Pop
lar
1977
1990
change
Source: Chung M. Chen, MNDNR, summarizing 1990 and 1977 FIA detailed database from the USFS N.C. &Landscape Regions from MFRC 9/20/00. On the average one plot represents about 1.25 thousand acres.
Figure 3. Acres of timberland by forest type groups for the WestCentral landscape.

Current Conditions and Trends Assessment
23
-60,000
0
60,000
120,000
180,000
240,000
300,000
Saw
timbe
r
Pol
etim
ber
See
d/S
aplin
g
Non
stoc
ked
19771990change
Source: Chung M. Chen, MNDNR, summarizing 1990 and 1977 FIA detailed data-base from the USFS N.C. & Landscape Regions from MFRC 9/20/00. On theaverage one plot represents about 1.25 thousand acres.
Figure 4. Acres of timberland by stand-size for the West Central landscape.

Minnesota West Central Landscape Region
24
Source: Chung M. Chen, MNDNR, summarizing 1990 and 1977 FIA detailed database from the USFS N.C.& Landscape Regions from MFRC 9/20/00. On the average one plot represents about 1.25 thousand acres.
Table 5. 1977 FIA Acrea (acres) by Timberland Type & Stand Size Class for the WestCentral Landscape
Size Class Forest Type Sawtimber Poletimber Seed/Sapling Nonstocked Total Red Pine 2,000 0 0 0 2,000Scotch Pine 0 0 2,000 0 2,000Balsam Fir 0 2,000 0 0 2,000Blk Spruce 0 0 1,000 0 1,000White Cedar 0 0 0 0 0Tamarack 6,000 7,000 4,000 2,000 19,000Oak 68,000 57,000 4,000 0129,000Lowl.Hdwds 19,000 34,000 4,000 0 58,000North.Hdwds 120,000 59,000 5,000 1,000185,000Aspen 29,000 91,000 31,000 0151,000Birch 0 8,000 6,000 0 14,000Bal.Poplar 0 9,000 3,000 2,000 14,000Total 243,000 267,000 61,000 4,000576,000
Current Conditions and Trends Assessment
25
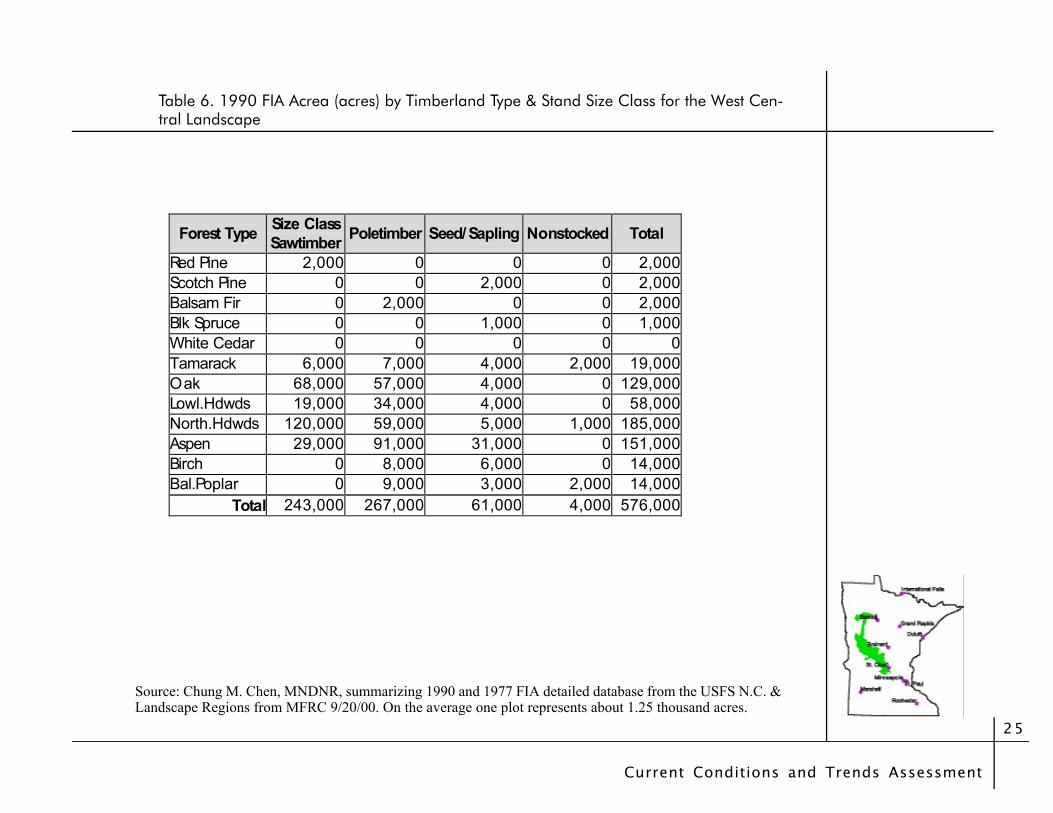
Forest Type Size Class Sawtimber Poletimber Seed/Sapling Nonstocked Total
Red Pine 2,000 0 0 0 2,000Scotch Pine 0 0 2,000 0 2,000Balsam Fir 0 2,000 0 0 2,000Blk Spruce 0 0 1,000 0 1,000White Cedar 0 0 0 0 0Tamarack 6,000 7,000 4,000 2,000 19,000Oak 68,000 57,000 4,000 0 129,000Lowl.Hdwds 19,000 34,000 4,000 0 58,000North.Hdwds 120,000 59,000 5,000 1,000 185,000Aspen 29,000 91,000 31,000 0 151,000Birch 0 8,000 6,000 0 14,000Bal.Poplar 0 9,000 3,000 2,000 14,000
Total 243,000 267,000 61,000 4,000 576,000
Source: Chung M. Chen, MNDNR, summarizing 1990 and 1977 FIA detailed database from the USFS N.C. &Landscape Regions from MFRC 9/20/00. On the average one plot represents about 1.25 thousand acres.
Table 6. 1990 FIA Acrea (acres) by Timberland Type & Stand Size Class for the West Cen-tral Landscape
Minnesota West Central Landscape Region
26
Observations
Riparian Areas
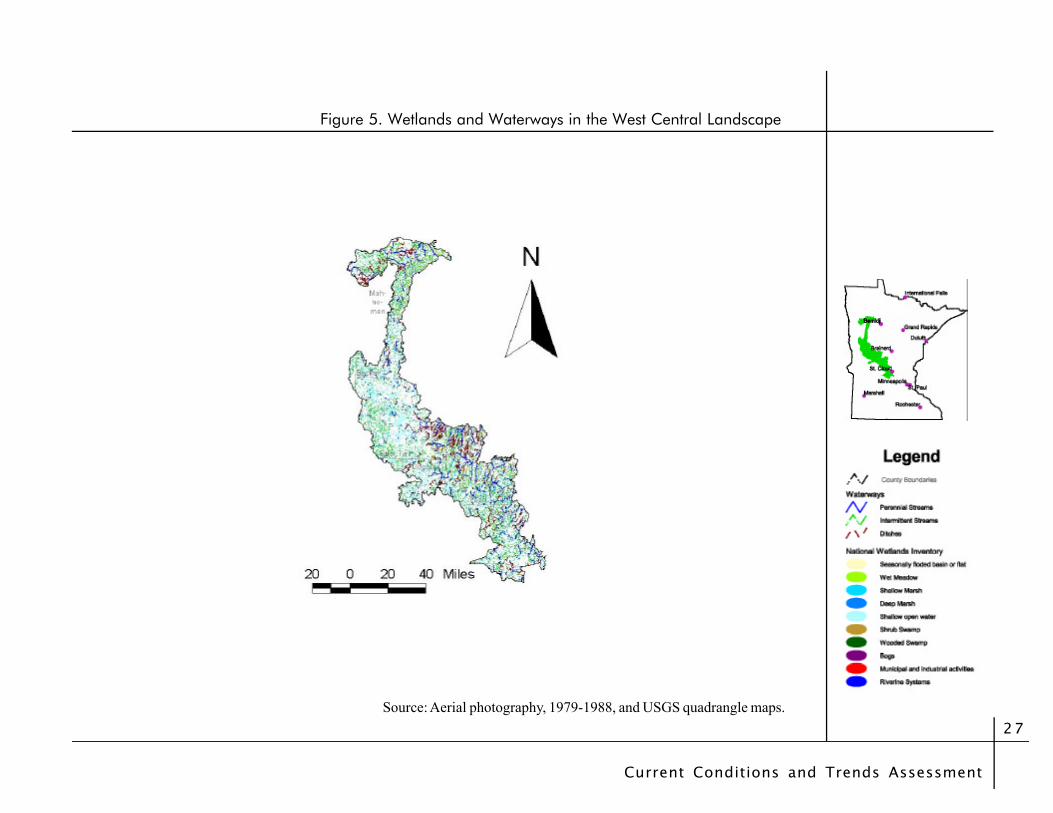
There is a higher density of intermittent streams thanperennial streams and ditches (Figure 5, and Table 7).
A majority of the area is considered upland (Table 8).
Current Conditions and Trends Assessment
27
Figure 5. Wetlands and Waterways in the West Central Landscape
Source: Aerial photography, 1979-1988, and USGS quadrangle maps.

Minnesota West Central Landscape Region
28
Source: MNDNR GIS data derived from 1980 USGS quadrangle maps.Note: Density equals miles of waterway divided by miles square of subsection.
Perennial Intermittent Ditch 0.19 0.53 0.16
Table 7. Density of Waterways, by Ecological Subsection, in the West Central Landscape
Table 8. Wetlands in the West Central Landscape
Wetland Type percent Seasonally flooded basin or flat 0.5%Wet meadow 0.5%Shallow marsh 8.4%Deep marsh 0.3%Shallow open water 8.6%Shrub swamp 3.1%Wooded swamps 1.3%Bogs 0.5%Municipal and industrial activities, water regime 0.0%Riverine systems, system 0.4%Uplands, system 76.4%Area outside Minnesota, system 0.0%
Current Conditions and Trends Assessment
29
Vascular Plants and Wildlife Species
Observations
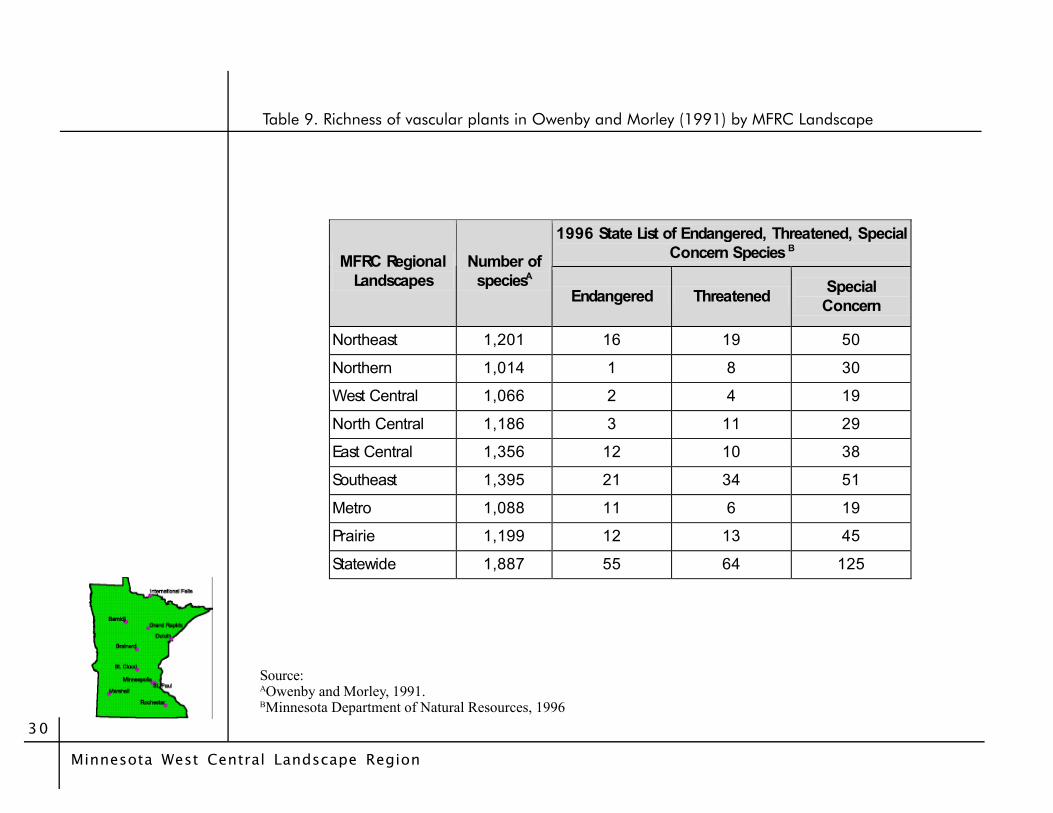
Compared to other regions of the state there are fewendangered and threatened vascular plants (Tables 9 and10).
Minnesota West Central Landscape Region
30
Source:AOwenby and Morley, 1991.BMinnesota Department of Natural Resources, 1996
Table 9. Richness of vascular plants in Owenby and Morley (1991) by MFRC Landscape
1996 State List of Endangered, Threatened, Special Concern Species B MFRC Regional
Landscapes Number of
speciesA Endangered Threatened Special
Concern
Northeast 1,201 16 19 50
Northern 1,014 1 8 30
West Central 1,066 2 4 19
North Central 1,186 3 11 29
East Central 1,356 12 10 38
Southeast 1,395 21 34 51
Metro 1,088 11 6 19
Prairie 1,199 12 13 45
Statewide 1,887 55 64 125

Current Conditions and Trends Assessment
31
1996 State List of Endangered, Threatened, Special Concern Species B
MFRC Regional Landscapes
Number of speciesA
Endangered Threatened Special Concern
Northeast 82 14 12 23
Northern 3 0 1 1
West Central 6 1 0 0
North Central 7 1 3 0
East Central 14 2 2 2
Southeast 82 11 20 15
Metro 9 2 0 0
Prairie 56 8 6 15
Table 10. Numbers of vascular plants in Owenby and Morley (1991) with recorded occur-rence limited to a particular MFRC Landscape.
Source:AOwenby and Morley, 1991.BMinnesota Department of Natural Resources, 1996.

Minnesota West Central Landscape Region
32
Source:AOwenby and Morley, 1991.BMinnesota Department of Natural Resources, 1996
Table 11. Richness of forest-associated mammals, amphibians and reptiles, andbreeding birds in Minnesota
All habitats Statewide
Forest associated Statewide
MammalsA 80 65 Amphibians and reptilesA 49 43
Breeding birds B 245 151

Current Conditions and Trends Assessment
33
Endangered Threatened Special concern
Mammals — Birds — Amphibians and reptiles 1. Five-lined skink
Mammals 1. Gray wolf Birds 1. Bald eagle 2. Loggerhead shrike Amphibians and reptiles 1. Wood turtle 2. Blanding’s turtle
Mammals 1. Least shrew 2. Mountain lion 3. Wolverine 4. Marten 5. Rock vole 6. Woodland vole 7. Northern myotis 8. Heather vole 9. Eastern pipistrelle 10. Caribou 11. Eastern spotted skunk 12. Northern bog lemming Birds 1. Red-shouldered hawk 2. Osprey 3. Louisiana waterthrush
Amphibians and Reptiles 1. Northern cricket frog 2. Snapping turtle 3. Racer 4. Timber rattle snake 5. Rat snake 6. Fox snake 7. Western hognose snake 8. Eastern hognose snake 9. Milk snake 10. Massasauga 11. Bullfrog 12. Pickerel frog
Table 12. Status of Minnesota’s forest-associated endangered, threatened, andspecial concern vertebrate wildlife, 1984.
Source: MNDNR
Minnesota West Central Landscape Region
34Source: MNDNR
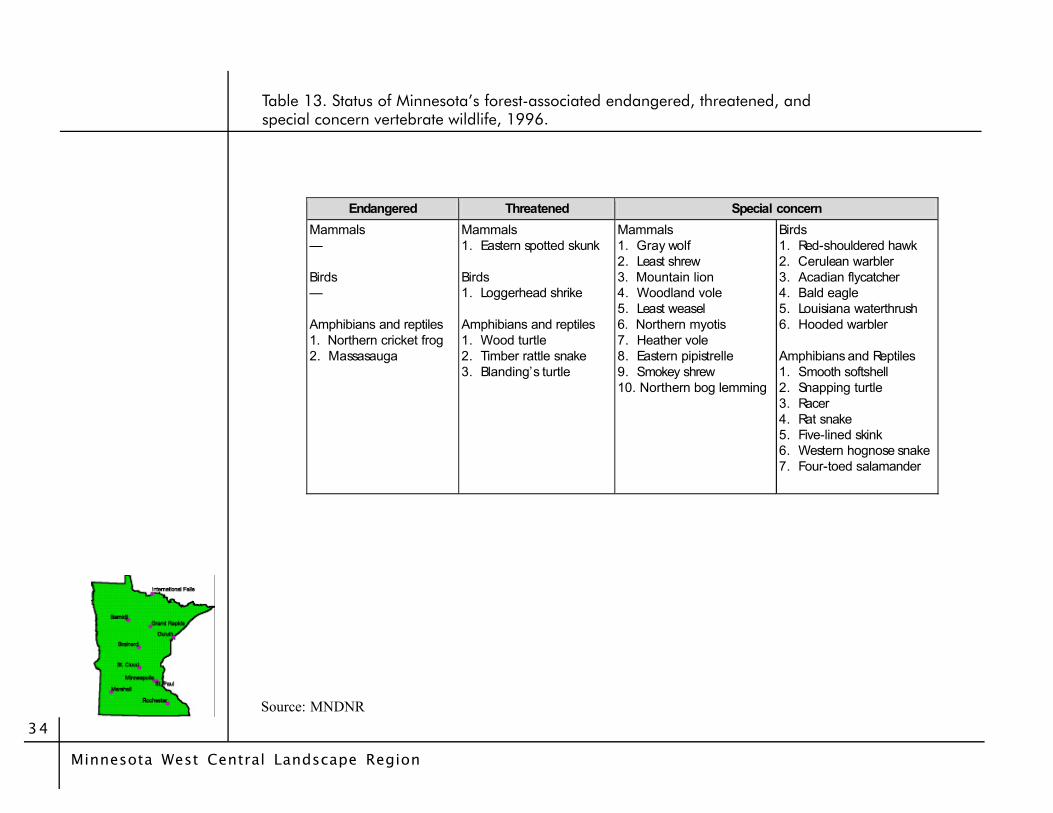
Table 13. Status of Minnesota’s forest-associated endangered, threatened, andspecial concern vertebrate wildlife, 1996.
Endangered Threatened Special concern
Mammals — Birds — Amphibians and reptiles 1. Northern cricket frog 2. Massasauga
Mammals 1. Eastern spotted skunk Birds 1. Loggerhead shrike Amphibians and reptiles 1. Wood turtle 2. Timber rattle snake 3. Blanding’s turtle
Mammals 1. Gray wolf 2. Least shrew 3. Mountain lion 4. Woodland vole 5. Least weasel 6. Northern myotis 7. Heather vole 8. Eastern pipistrelle 9. Smokey shrew 10. Northern bog lemming
Birds 1. Red-shouldered hawk 2. Cerulean warbler 3. Acadian flycatcher 4. Bald eagle 5. Louisiana waterthrush 6. Hooded warbler Amphibians and Reptiles 1. Smooth softshell 2. Snapping turtle 3. Racer 4. Rat snake 5. Five-lined skink 6. Western hognose snake 7. Four-toed salamander
Current Conditions and Trends Assessment
35
Findings
Social and Economic Conditions and Trends
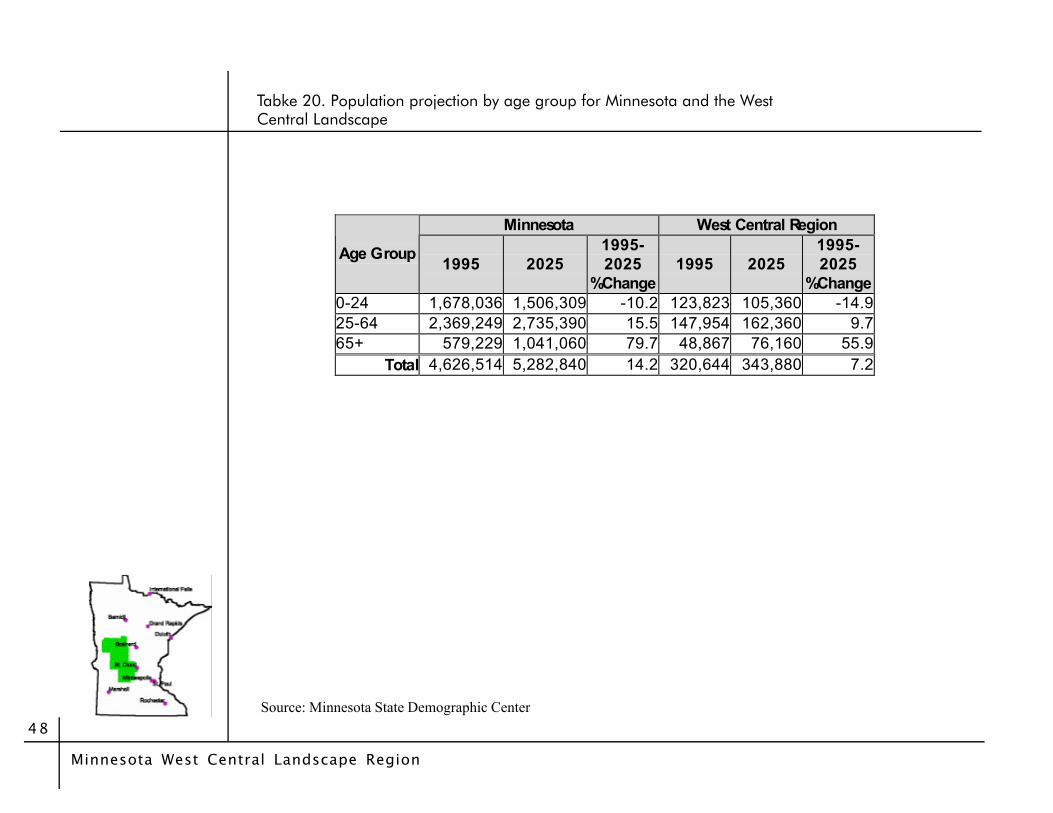
We see a drastic change in population composition inMinnesota and the region for the years to come. Thenumber of young people (up to 24 years old) is expectedto decrease by 10.2% in Minnesota and by 14.9 percent inthe west central region. Middle-aged people, representingthe productive work force (ages 25-64) will increase in thepopulation by 15.5% for the state, and increase roughly 10percent in this region. Of most consequence, the state andregion will see dramatic increases (79.7% and 55.9%respectively) in the population of senior citizens (over theage of 65). This can be largely attributed to increases inlife expectancy rates, but other explanations are possible.An attractive retirement environment and the maturing ofthe "baby-boom" generation are other possible reasons.This is a very important observation, as a drastic shift inpopulation composition can significantly affect the needs(such as health care), values, and recreational activities ofthe community. Rapid expansion of the services sector ofthe economy is one likely result (see DemographicsObservations).
Timber harvesting and the relative price of wood hasincreased greatly since the mid-1980's. An increase inwood harvesting is a good indication of an overall growthin the forest and timber products sector. Severalexplanations exist for the significant increases in stumpageprice that have occurred during the past decade. First andmost important, is the observation that harvesting has
increased significantly since 1980. Greater demand on alimited resource will always cause the price to rise.Inflation also causes price level rise, but this explains only alimited amount of the observed growth. Steadyadvancement in conservation management, environmentalconcern, and social responsibility may also contribute toprice upsurge as the supply of timber has been tightened byinclinations to protect privately owned and public land.However, this theory is largely speculative (see EconomicProduction Observations).
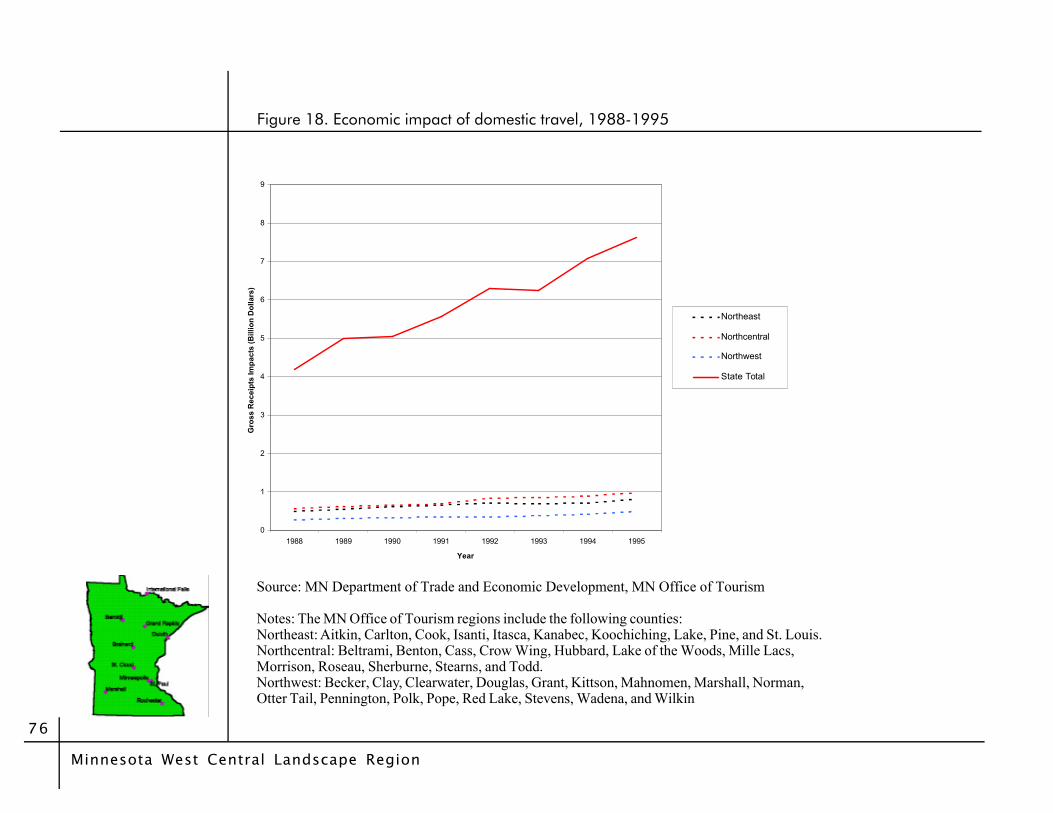
Remarkable growth in the tourism industry has occurred inMinnesota since the late 1980's. Figure 18 illustrates thistremendous increase in which annual gross receipts grewfrom about 4 billion in 1988 to nearly 8 billion by 1995.(see Tourism Observations).
Minnesota West Central Landscape Region
36
Land Use and Ownership
Observations
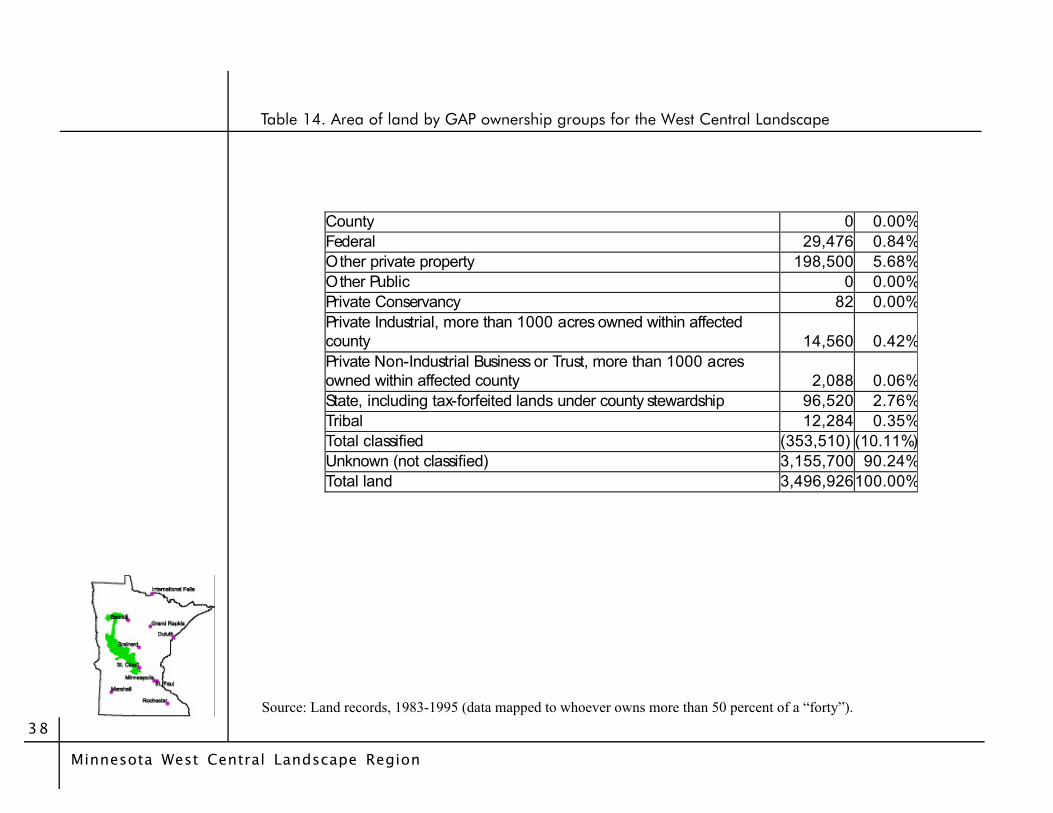
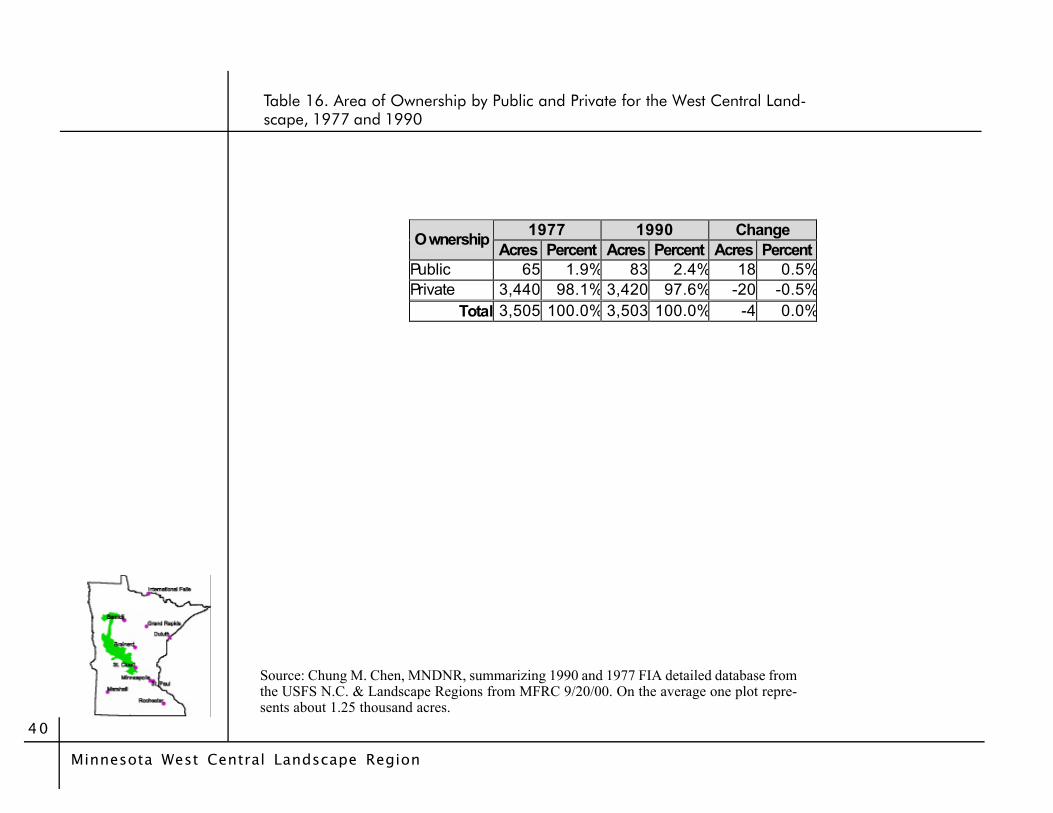
Almost all of the land is privately owned (Figure 6, andTables 14, 15, and 16).
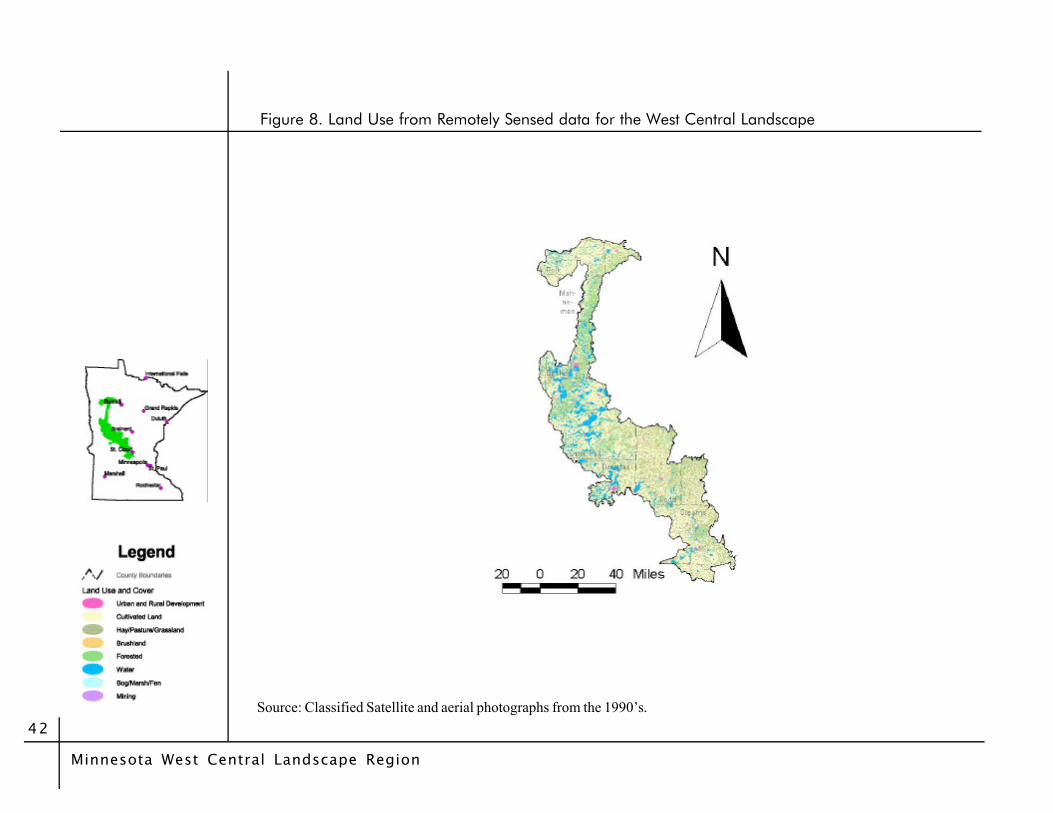
About ¼ of the land is forested, more than half isagriculture/hay/pasture/grassland, and one eight water/bog/marsh/fen (Figure 8 and Table 17).

Current Conditions and Trends Assessment
37
Figue 6. Ownership in the West Central Landscape
Source: Source: Land records, 1983-1995 (data mapped to whoeverowns more than 50 percent of a “forty;” private ownership of less than1000 acres not mapped).
Minnesota West Central Landscape Region
38
County 0 0.00%Federal 29,476 0.84%Other private property 198,500 5.68%Other Public 0 0.00%Private Conservancy 82 0.00%Private Industrial, more than 1000 acres owned within affected county 14,560 0.42%Private Non-Industrial Business or Trust, more than 1000 acres owned within affected county 2,088 0.06%State, including tax-forfeited lands under county stewardship 96,520 2.76%Tribal 12,284 0.35%Total classified (353,510) (10.11%) Unknown (not classified) 3,155,700 90.24%Total land 3,496,926100.00%
Table 14. Area of land by GAP ownership groups for the West Central Landscape
Source: Land records, 1983-1995 (data mapped to whoever owns more than 50 percent of a “forty”).

Current Conditions and Trends Assessment
39
Table 15. Area of Ownership Classes for the West Central Landscape,1977 and 1990
Source: Chung M. Chen, MNDNR, summarizing 1990 and 1977 FIA detailed data-base from the USFS N.C. & Landscape Regions from MFRC 9/20/00. On theaverage one plot represents about 1.25 thousand acres.
1977 1990 Change Ownership Class Acres Percent Acres Percent Acres Percent
Bureau of Land Mgmt 0 0.0% 0 0.0% 0 0.0%County & Municipal 21 0.6% 27 0.8% 6 0.2%Indian Lands 11 0.3% 12 0.3% 1 0.0%Misc Federal 6 0.2% 19 0.5% 13 0.4%National Forest 0 0.0% 0 0.0% 0 0.0%Private 622 17.7% 617 17.6% -5 -0.1%State 27 0.8% 25 0.7% -2 -0.1%Unknown 2,818 80.4% 2,803 80.0% -15 -0.4%
Total 3,505 100.0% 3,503 100.0% -2 0.0%
Minnesota West Central Landscape Region
40
Source: Chung M. Chen, MNDNR, summarizing 1990 and 1977 FIA detailed database fromthe USFS N.C. & Landscape Regions from MFRC 9/20/00. On the average one plot repre-sents about 1.25 thousand acres.
Table 16. Area of Ownership by Public and Private for the West Central Land-scape, 1977 and 1990
1977 1990 Change Ownership Acres Percent Acres Percent Acres Percent
Public 65 1.9% 83 2.4% 18 0.5%Private 3,440 98.1% 3,420 97.6% -20 -0.5%
Total 3,505 100.0% 3,503 100.0% -4 0.0%

Current Conditions and Trends Assessment
41
Figure 7. Reserved Lands and Forests in the West Central Landscape
Source: DNR
Minnesota West Central Landscape Region
42Source: Classified Satellite and aerial photographs from the 1990’s.
Figure 8. Land Use from Remotely Sensed data for the West Central Landscape

Current Conditions and Trends Assessment
43
Table 17. Area of land use classes for the West Central Landscape.
Source: Classified Satellite and aerial photographs from the 1990’s.
LULC Acres Percent Urban-Rural Dev. 84,940 2.43%Cultivated Land 1,556,272 44.50%Hay/Pasture/Grassland 548,458 15.68%Brushland 96,900 2.77%Forested 745,230 21.31%Water 316,891 9.06%Bog/Marsh/Fen 144,598 4.13%Mining 3,672 0.10%
Total 3,496,961 100.00%

Minnesota West Central Landscape Region
44
Figure 9. Distribution of nonindustrial private forestland (NIPF) acres statewide byownership class size, 1990
Current Conditions and Trends Assessment
45
Demographics
Observations
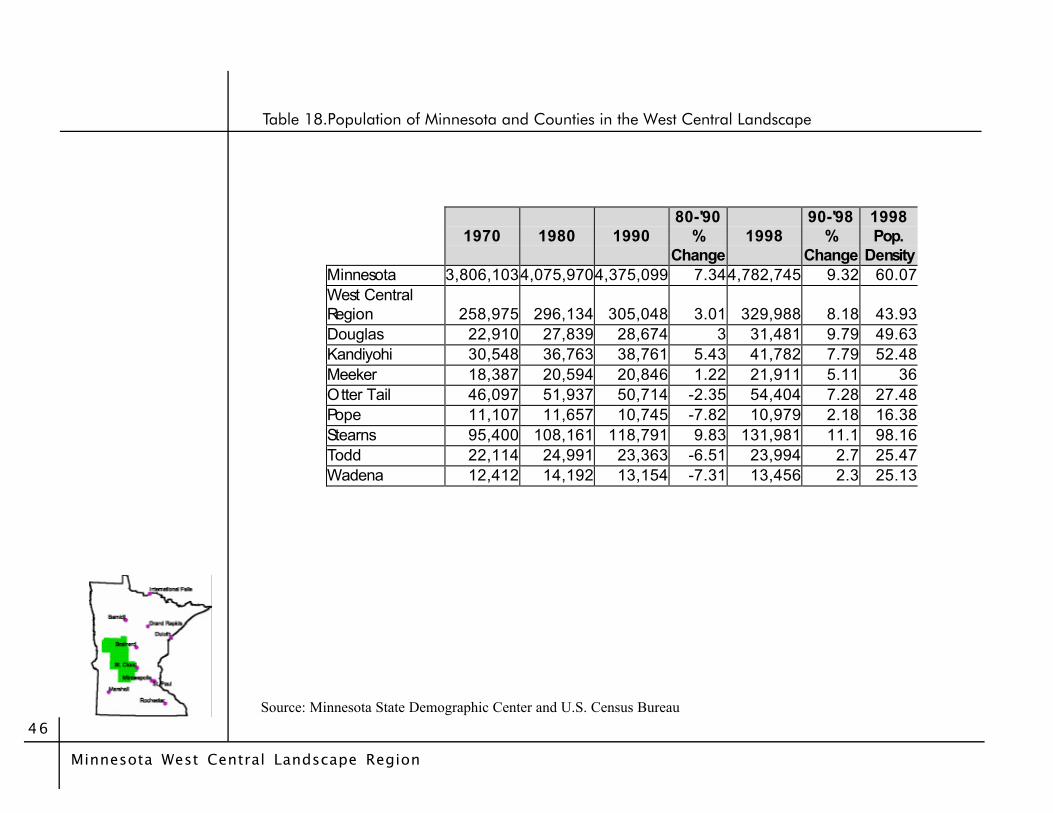
About 330,000 people live in the West Central LandscapeRegion (Table 18).
The region is moderately populated, with a populationdensity just over half of the state average (Table 18).
Stearns County is the most densely populated and has thegreatest population, while Pope County is the least densewith the least population (Tables 18 and 19).
The populations of Stearns and Douglas are increasing themost in this region (Tables 18, and 19).
The populations of Pope, Todd, Wadena, and Meeker areprojected to decline (Table 19).
The distribution and composition of the population ischanging significantly, but minimal net growth is occurring(Table 20). Specifically there is a projected decrease ofindividuals ages 0-24, and increase of individuals agesgreater than 65.
The counties in the west central region have higher levels ofpoverty in relation to the 8.7% state average (Table 21).
Todd County has the leading poverty rate in the region at15.1% (Table 21).
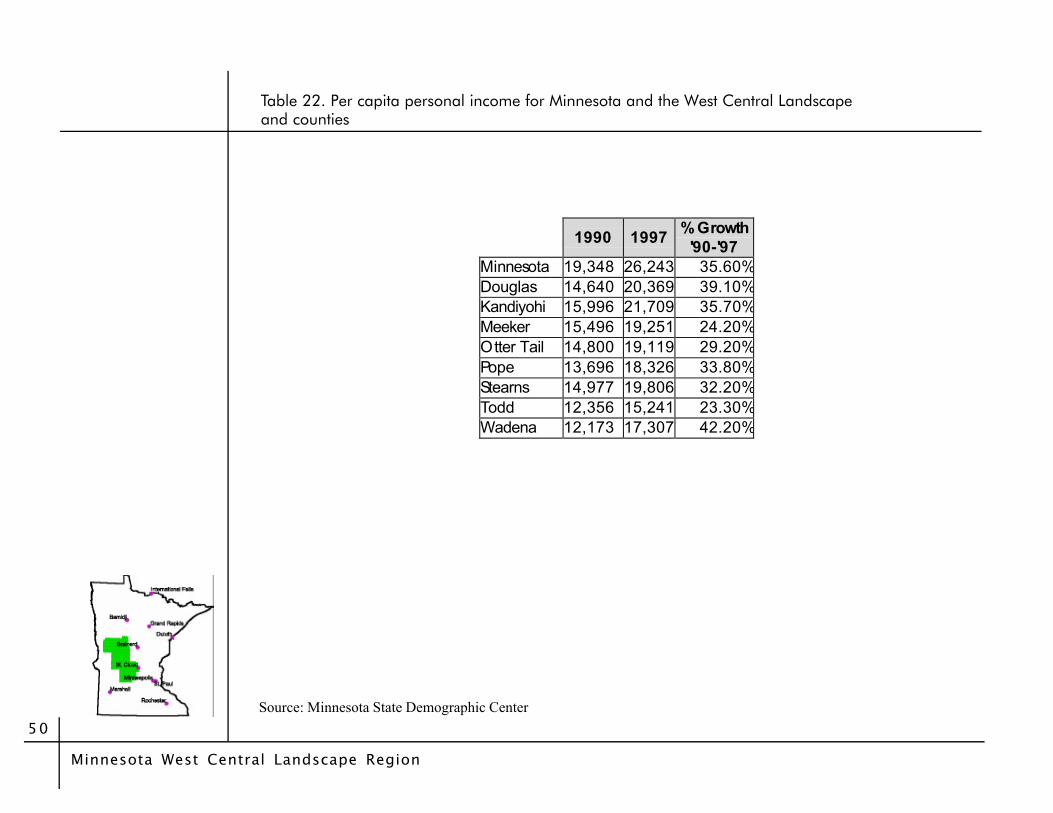
Personal income is significantly lower than the stateaverage throughout the region (Table 22).
Kandiyohi has the highest per capita income and Wadenahas the lowest (Table 22).
Minnesota West Central Landscape Region
46
Table 18.Population of Minnesota and Counties in the West Central Landscape
Source: Minnesota State Demographic Center and U.S. Census Bureau
1970 1980 1990
80-'90 %
Change 1998
90-'98 %
Change
1998 Pop.
Density Minnesota 3,806,103 4,075,9704,375,099 7.34 4,782,745 9.32 60.07 West Central Region 258,975 296,134 305,048 3.01 329,988 8.18 43.93 Douglas 22,910 27,839 28,674 3 31,481 9.79 49.63 Kandiyohi 30,548 36,763 38,761 5.43 41,782 7.79 52.48 Meeker 18,387 20,594 20,846 1.22 21,911 5.11 36 Otter Tail 46,097 51,937 50,714 -2.35 54,404 7.28 27.48 Pope 11,107 11,657 10,745 -7.82 10,979 2.18 16.38 Stearns 95,400 108,161 118,791 9.83 131,981 11.1 98.16 Todd 22,114 24,991 23,363 -6.51 23,994 2.7 25.47 Wadena 12,412 14,192 13,154 -7.31 13,456 2.3 25.13

Current Conditions and Trends Assessment
47
Table 19. Population Projections for Minnesota and counties in the West CentralLandscape
Source: Minnesota State Demographic Center
1995 2025 1995-2025 % Change
Minnesota 4,626,514 5,282,840 14.19West Central Region 320,644 343,820 7.23Douglas 30,424 33,790 11.06Kandiyohi 41,167 45,860 11.4Meeker 21,352 20,950 -1.88Otter Tail 52,847 53,430 1.1Pope 10,906 9,580 -12.16Stearns 126,912 144,980 14.24Todd 23,742 22,500 -5.23Wadena 13,294 12,730 -4.24
Minnesota West Central Landscape Region
48Source: Minnesota State Demographic Center
Tabke 20. Population projection by age group for Minnesota and the WestCentral Landscape
Minnesota West Central Region
Age Group 1995 2025
1995-2025
%Change 1995 2025
1995-2025
%Change 0-24 1,678,036 1,506,309 -10.2 123,823 105,360 -14.925-64 2,369,249 2,735,390 15.5 147,954 162,360 9.765+ 579,229 1,041,060 79.7 48,867 76,160 55.9
Total 4,626,514 5,282,840 14.2 320,644 343,880 7.2

Current Conditions and Trends Assessment
49
Table 21. Persons with incomes below poverty level in the West Central Landscape
Source: U.S. Census Bureau
% Population Below
Poverty Level in 1995 Minnesota 8.7 Douglas 9.3 Kandiyohi 11.6 Meeker 8.6 Otter Tail 11.3 Pope 10.8 Stearns 9 Todd 15.1 Wadena 16
Minnesota West Central Landscape Region
50
1990 1997 % Growth '90-'97
Minnesota 19,348 26,243 35.60%Douglas 14,640 20,369 39.10%Kandiyohi 15,996 21,709 35.70%Meeker 15,496 19,251 24.20%Otter Tail 14,800 19,119 29.20%Pope 13,696 18,326 33.80%Stearns 14,977 19,806 32.20%Todd 12,356 15,241 23.30%Wadena 12,173 17,307 42.20%
Table 22. Per capita personal income for Minnesota and the West Central Landscapeand counties
Source: Minnesota State Demographic Center
Current Conditions and Trends Assessment
51
Observations
Employment
Manufacturing, Trade (retail and wholesale), Services andGovernment are the leading industries in Minnesota (Table27).
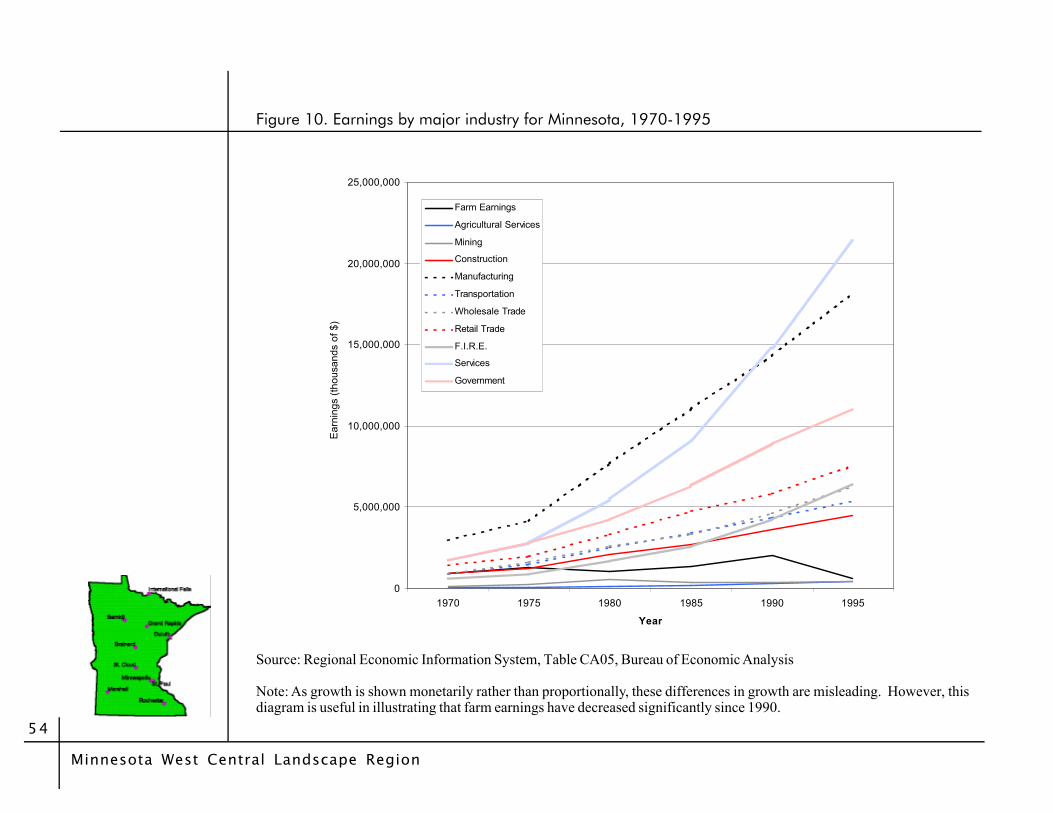
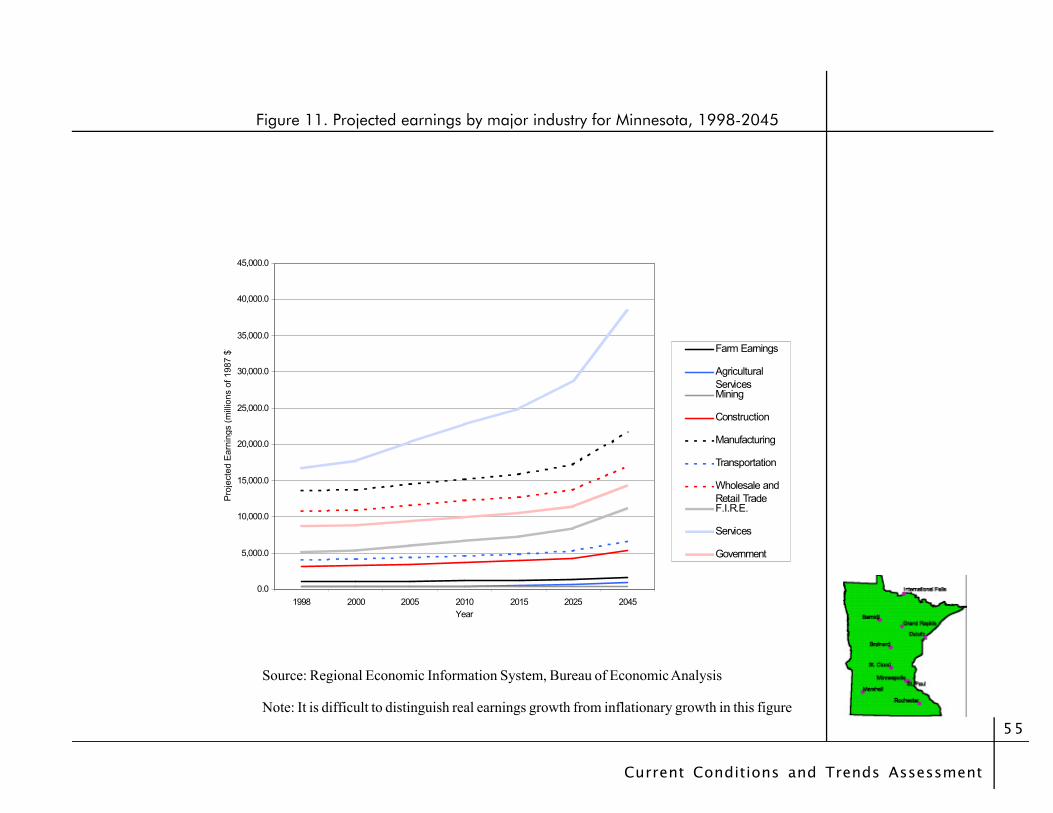
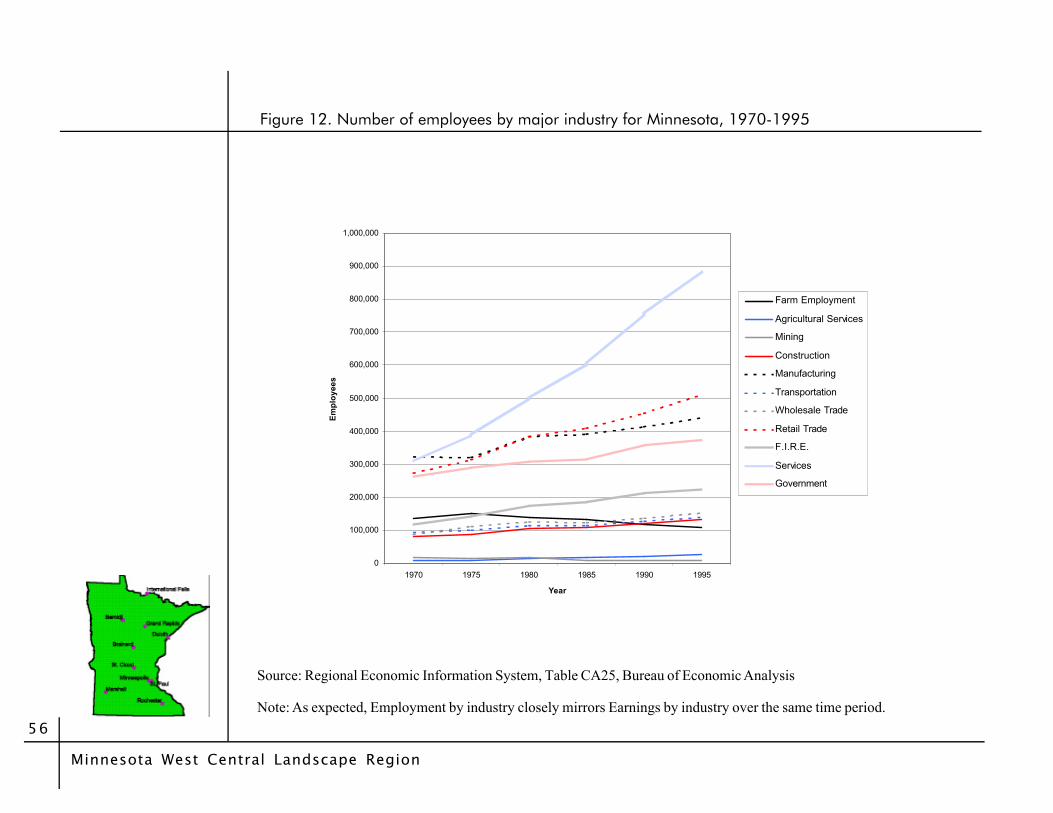
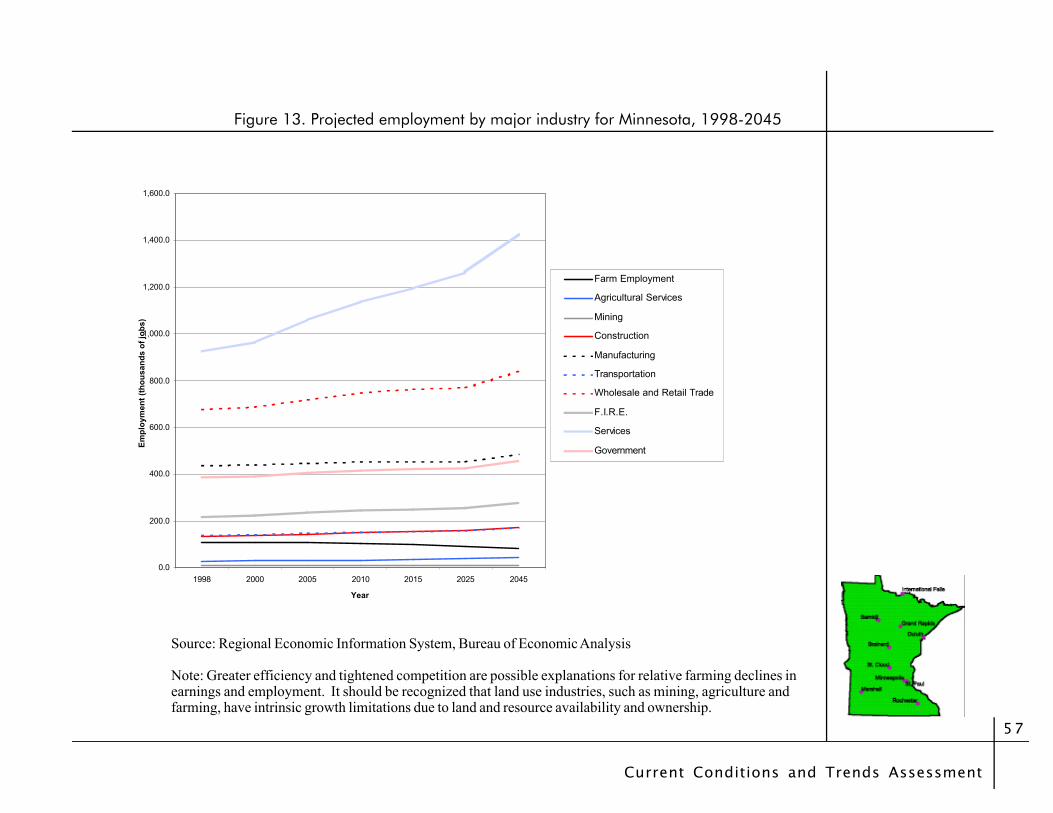
The services industry has experienced the highest growthrate over the past several decades and this trend isexpected to continue (Figures 10, 11, 12, and 13).
The farming sector of Minnesota's economy is currentlyshrinking and should continue to contract (Figures 10, 11,12, and 13).
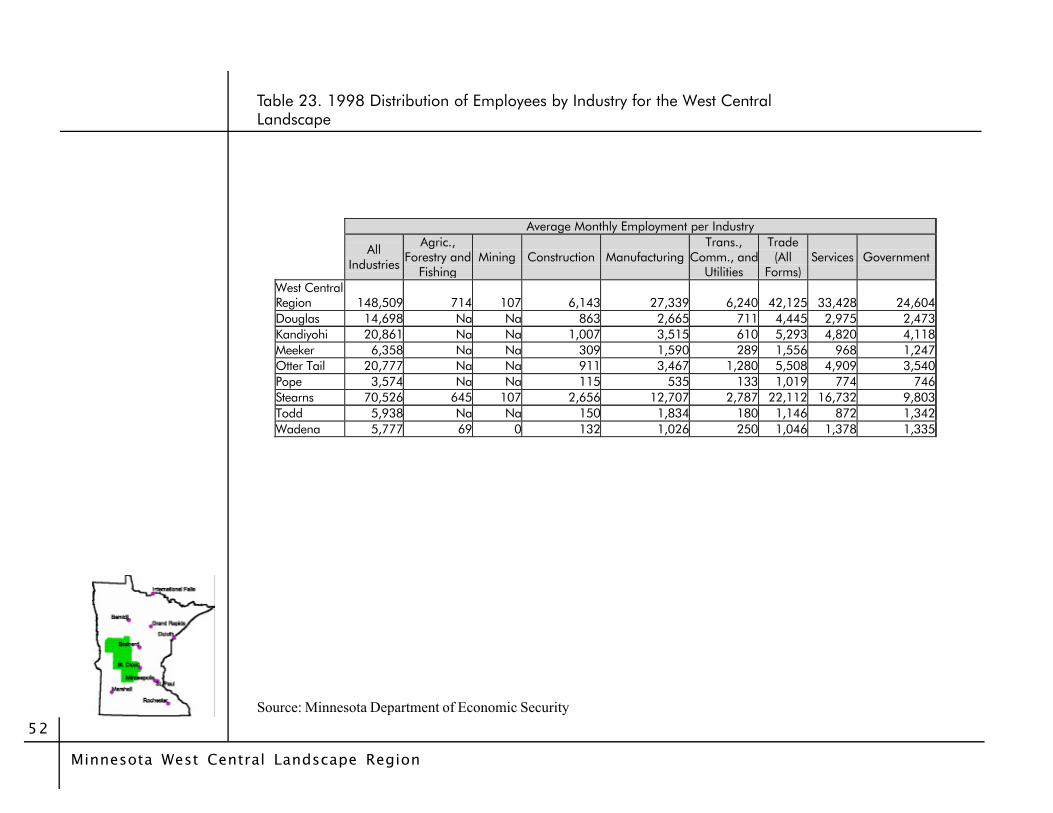
The services, manufacturing, government and trade sectorsare the dominant industries in the region (Table 23, and25).
The trades and services sector generally pays low wages(Table 24).
There are about 168,000 people in the regional labor force(Table 26).
West Central region unemployment is about the same asthe state and lower than the national averages at 3% of thelabor force (Table 26).
Wadena has a very high rate of unemployment (Table 26).
Workers in Stearns generally earn the highest weeklywages in the region, while Pope County has low wages(Tables 24, and 25).
The timber industry accounts for 2.5% of statewidepersonal income (Table 27).
Minnesota West Central Landscape Region
52
Table 23. 1998 Distribution of Employees by Industry for the West CentralLandscape
Source: Minnesota Department of Economic Security
Average Monthly Employment per Industry
All Industries
Agric., Forestry and
Fishing Mining Construction Manufacturing
Trans., Comm., and
Utilities
Trade (All
Forms) Services Government
West Central Region 148,509 714 107 6,143 27,339 6,240 42,125 33,428 24,604Douglas 14,698 Na Na 863 2,665 711 4,445 2,975 2,473Kandiyohi 20,861 Na Na 1,007 3,515 610 5,293 4,820 4,118Meeker 6,358 Na Na 309 1,590 289 1,556 968 1,247Otter Tail 20,777 Na Na 911 3,467 1,280 5,508 4,909 3,540Pope 3,574 Na Na 115 535 133 1,019 774 746Stearns 70,526 645 107 2,656 12,707 2,787 22,112 16,732 9,803Todd 5,938 Na Na 150 1,834 180 1,146 872 1,342Wadena 5,777 69 0 132 1,026 250 1,046 1,378 1,335

Current Conditions and Trends Assessment
53
Table 24. 1998 Distribution of Weekly Wages by Industry for the West CentralLandscape
Source: Minnesota Department of Economic Security
Average Weekly Wages per Industry (given in dollars)
All Industries
Agric., Forestry
and Fishing
Mining Construction Manufacturing
Trans., Comm.,
and Utilities
Trade (All
Forms) Services Government
Douglas 428 Na Na 668 587 561 271 349 506 Kandiyohi 449 Na Na 651 502 486 320 391 580 Meeker 419 Na Na 644 526 412 314 310 453 Otter Tail 401 Na Na 501 482 646 256 334 513 Pope 392 Na Na 464 526 325 350 269 479 Stearns 512 430 654 637 580 553 426 473 625 Todd 420 Na Na 515 552 435 233 341 448 Wadena 394 302 Na 447 460 469 323 363 427
Minnesota West Central Landscape Region
54
Figure 10. Earnings by major industry for Minnesota, 1970-1995
Source: Regional Economic Information System, Table CA05, Bureau of Economic Analysis
Note: As growth is shown monetarily rather than proportionally, these differences in growth are misleading. However, thisdiagram is useful in illustrating that farm earnings have decreased significantly since 1990.
0
5,000,000
10,000,000
15,000,000
20,000,000
25,000,000
1970 1975 1980 1985 1990 1995
Year
Ear
ning
s (t
hous
ands
of $
)
Farm Earnings
Agricultural Services
Mining
Construction
Manufacturing
Transportation
Wholesale Trade
Retail Trade
F.I.R.E.
Services
Government
Current Conditions and Trends Assessment
55
Figure 11. Projected earnings by major industry for Minnesota, 1998-2045
Source: Regional Economic Information System, Bureau of Economic Analysis
Note: It is difficult to distinguish real earnings growth from inflationary growth in this figure
0.0
5,000.0
10,000.0
15,000.0
20,000.0
25,000.0
30,000.0
35,000.0
40,000.0
45,000.0
1998 2000 2005 2010 2015 2025 2045Year
Pro
ject
ed E
arni
ngs
(mill
ions
of 1
987
$) Farm Earnings
AgriculturalServicesMining
Construction
Manufacturing
Transportation
Wholesale andRetail TradeF.I.R.E.
Services
Government
Minnesota West Central Landscape Region
56
0
100,000
200,000
300,000
400,000
500,000
600,000
700,000
800,000
900,000
1,000,000
1970 1975 1980 1985 1990 1995
Year
Em
plo
yees
Farm Employment
Agricultural Services
Mining
Construction
Manufacturing
Transportation
Wholesale Trade
Retail Trade
F.I.R.E.
Services
Government
Figure 12. Number of employees by major industry for Minnesota, 1970-1995
Source: Regional Economic Information System, Table CA25, Bureau of Economic Analysis
Note: As expected, Employment by industry closely mirrors Earnings by industry over the same time period.
Current Conditions and Trends Assessment
57
Figure 13. Projected employment by major industry for Minnesota, 1998-2045
0.0
200.0
400.0
600.0
800.0
1,000.0
1,200.0
1,400.0
1,600.0
1998 2000 2005 2010 2015 2025 2045
Year
Em
plo
ymen
t (t
ho
usa
nd
s o
f jo
bs)
Farm Employment
Agricultural Services
Mining
Construction
Manufacturing
Transportation
Wholesale and Retail Trade
F.I.R.E.
Services
Government
Source: Regional Economic Information System, Bureau of Economic Analysis
Note: Greater efficiency and tightened competition are possible explanations for relative farming declines inearnings and employment. It should be recognized that land use industries, such as mining, agriculture andfarming, have intrinsic growth limitations due to land and resource availability and ownership.

Minnesota West Central Landscape Region
58Source: Minnesota Department of Economic Security
Table 25. Total Wages by Industry for the West Central Landscape Landscape in1998
Total Annual Wages per Industry (given in Thousands of Dollars).
All Industries
Agric., Forestry
and FishingMining Construction Manufacturing
Trans., Comm.,
and Utilities
Trade (All Forms) Services Government
West Central Region 3,583,548 15,493 3638 195,959 778,282 177,940 795,892 716,483 711,385Douglas 327,265 na na 29,985 81,290 20,746 62,603 54,029 65,054Kandiyohi 487,066 na na 34,101 91,682 15,402 87,955 98,015 124,236Meeker 138,678 na na 10,342 43,464 6,199 25,457 15,625 29,367Otter Tail 433,024 na na 23,739 86,873 43,011 73,335 85,227 94,520Pope 72,830 na na 2,777 14,641 2,249 18,553 10,841 18,575Stearns 1,876,789 14,411 3,638 87,931 383,212 80,162 490,354 411,259 318,712Todd 129,608 na na 4,014 52,601 4,074 13,858 15,477 31,281Wadena 118,288 1,082 0 3,070 24,519 6,097 23,777 26,010 29,640

Current Conditions and Trends Assessment
59
Labor Force Employment Unemployment Unemployment Rate
US 139,368,000 133,488,000 5,880,000 4.20%Minnesota 2,698,511 2,623,058 75,453 2.80%West Central Region 168,824 163,740 5,084 3.00%Douglas 16,148 15,639 509 3.20%Kandiyohi 21,393 20,838 555 2.60%Meeker 8,998 8,599 399 4.40%Otter Tail 26,134 25,073 1,061 4.10%Pope 5,356 5,224 132 2.50%Stearns 75,245 73,534 1,711 2.30%Todd 8,927 8,541 386 4.30%Wadena 6,623 6,292 331 5.00%
Table 26. Unemployed for Minnesota and counties in the West Central Landscape 1999
Source: Minnesota Department of Economic Security

Minnesota West Central Landscape Region
60
Table 27. Statewide summary of perecent of total income by source
Current Conditions and Trends Assessment
61
Minnesota West Central Landscape Region
62
Economic Production
Observations
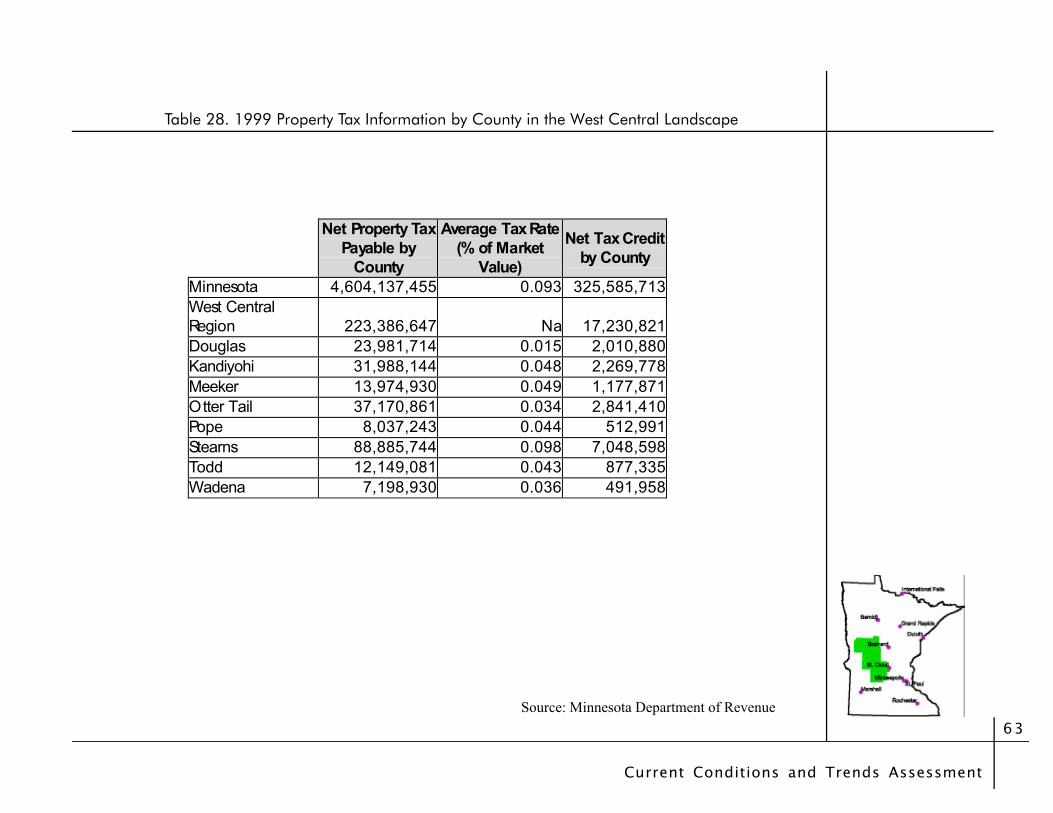
Overall, the range of property tax rates is very widespreadand inconsistent in the region with Pope and Wadena beinglow, and Stearns high (Table 28).
The region pays low income taxes compared to the stateaverage (Table 30).
1999 Property taxes reached nearly $223,000,000 in theregion (Table 28).
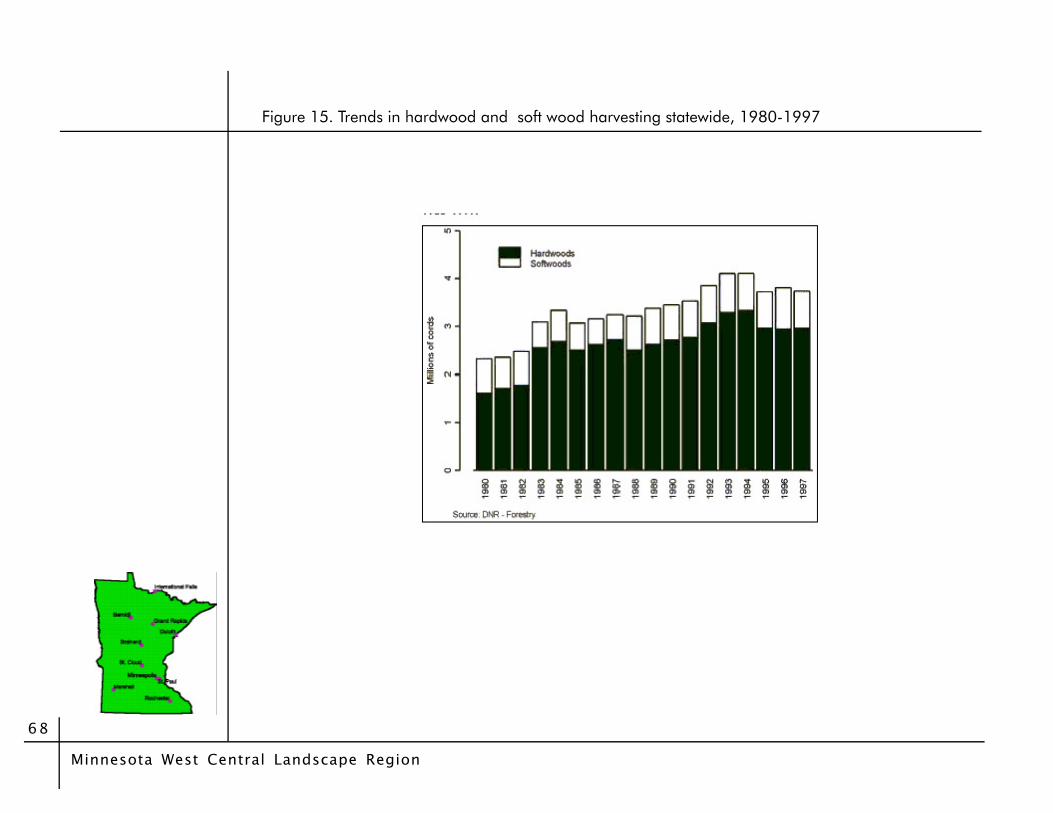
The volume of annual timber harvesting has increasedgreatly over the past twenty years (Figure 24).
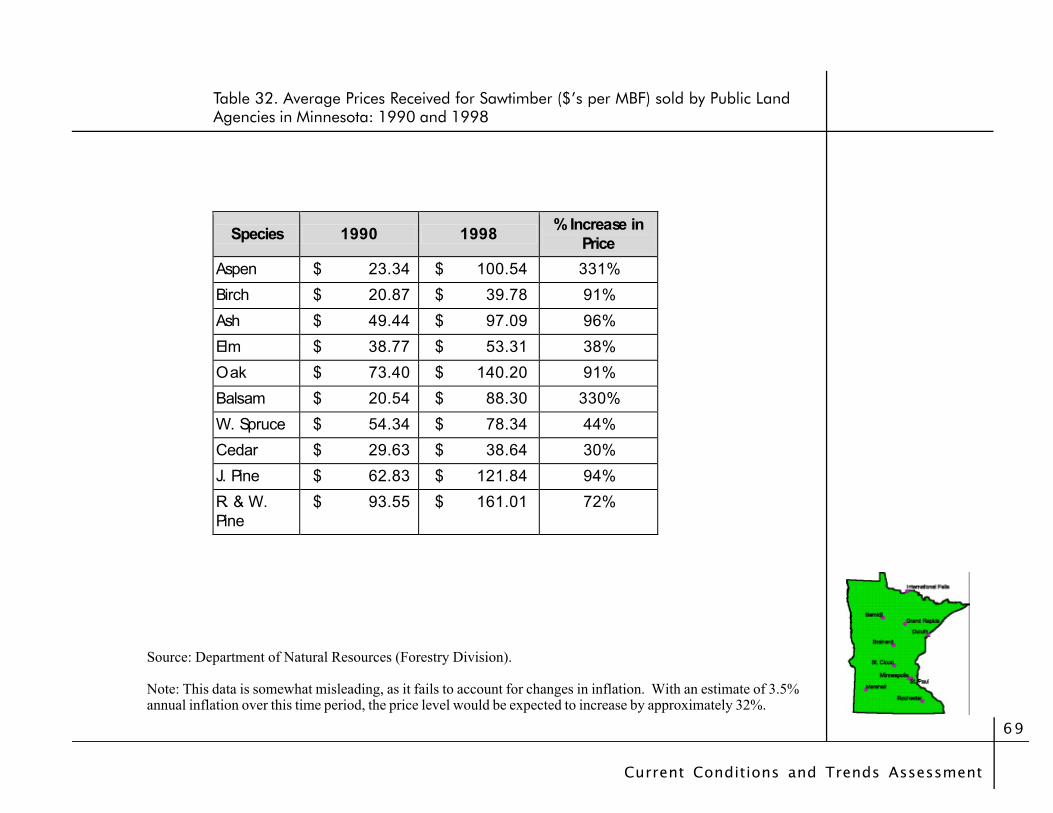
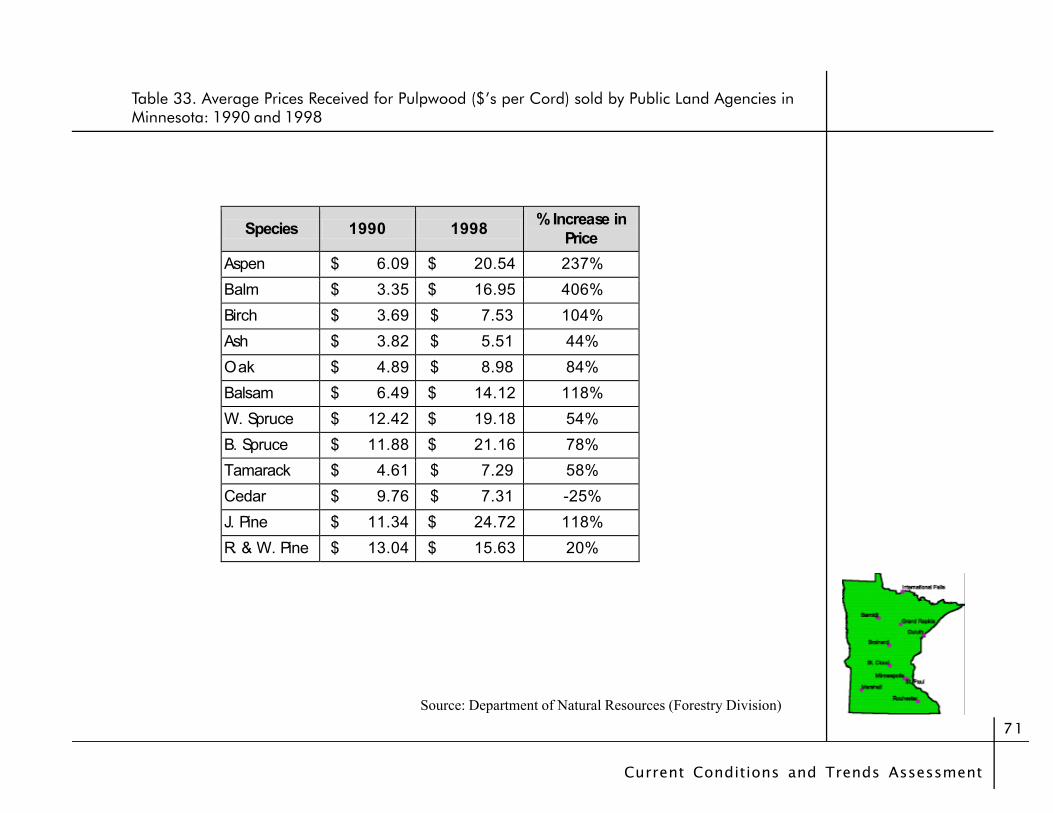
The price of wood has risen dramatically throughout thepast decade (Tables 30 and 31, and Figures 25 and 26).
The prices received for Aspen, Balsam and Balm woodhave risen faster than other species (Tables 30 and 31).
The volume of annual timber harvesting has increasedgreatly over the past twenty years (Figure 15).
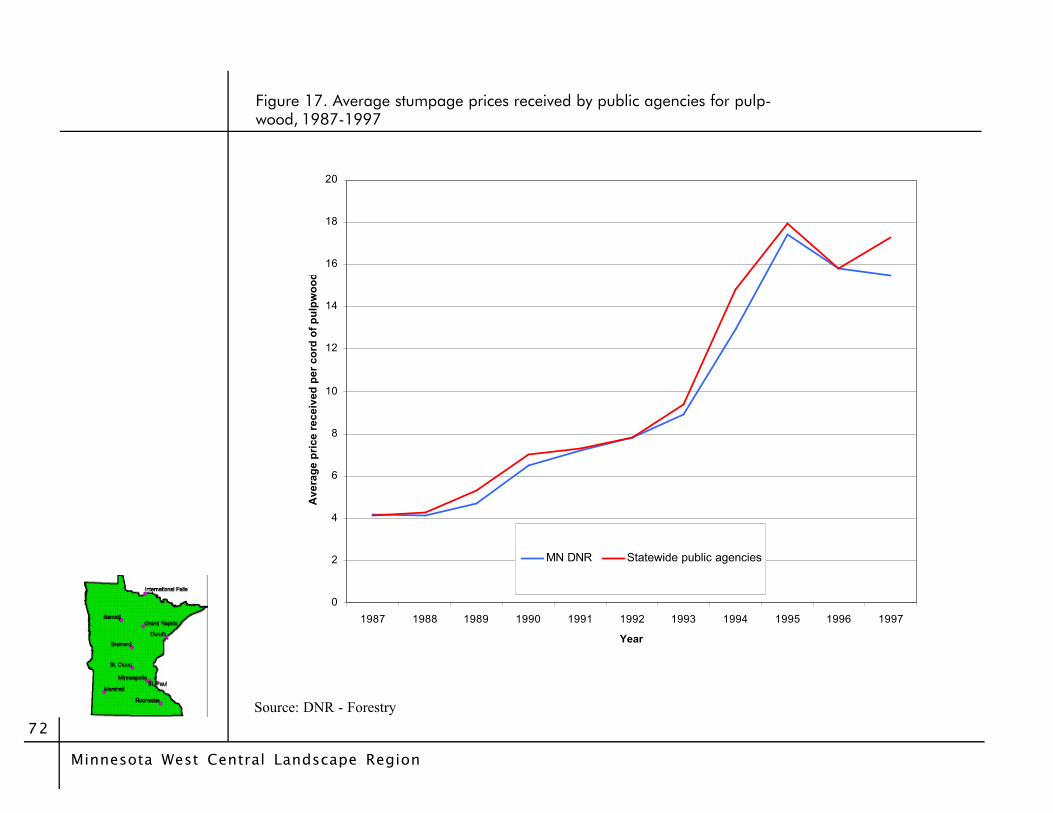
The price of wood has risen dramatically throughout thepast decade (Tables 32 and 33, and Figures 16 and 17).
The prices received for Aspen, Balsam and Balm woodhave risen faster than other species (Tables 32 and 33).
Current Conditions and Trends Assessment
63
Net Property Tax Payable by
County
Average Tax Rate (% of Market
Value)
Net Tax Credit by County
Minnesota 4,604,137,455 0.093 325,585,713West Central Region 223,386,647 Na 17,230,821Douglas 23,981,714 0.015 2,010,880Kandiyohi 31,988,144 0.048 2,269,778Meeker 13,974,930 0.049 1,177,871Otter Tail 37,170,861 0.034 2,841,410Pope 8,037,243 0.044 512,991Stearns 88,885,744 0.098 7,048,598Todd 12,149,081 0.043 877,335Wadena 7,198,930 0.036 491,958
Table 28. 1999 Property Tax Information by County in the West Central Landscape
Source: Minnesota Department of Revenue
Minnesota West Central Landscape Region
64
Per Capita Property Tax
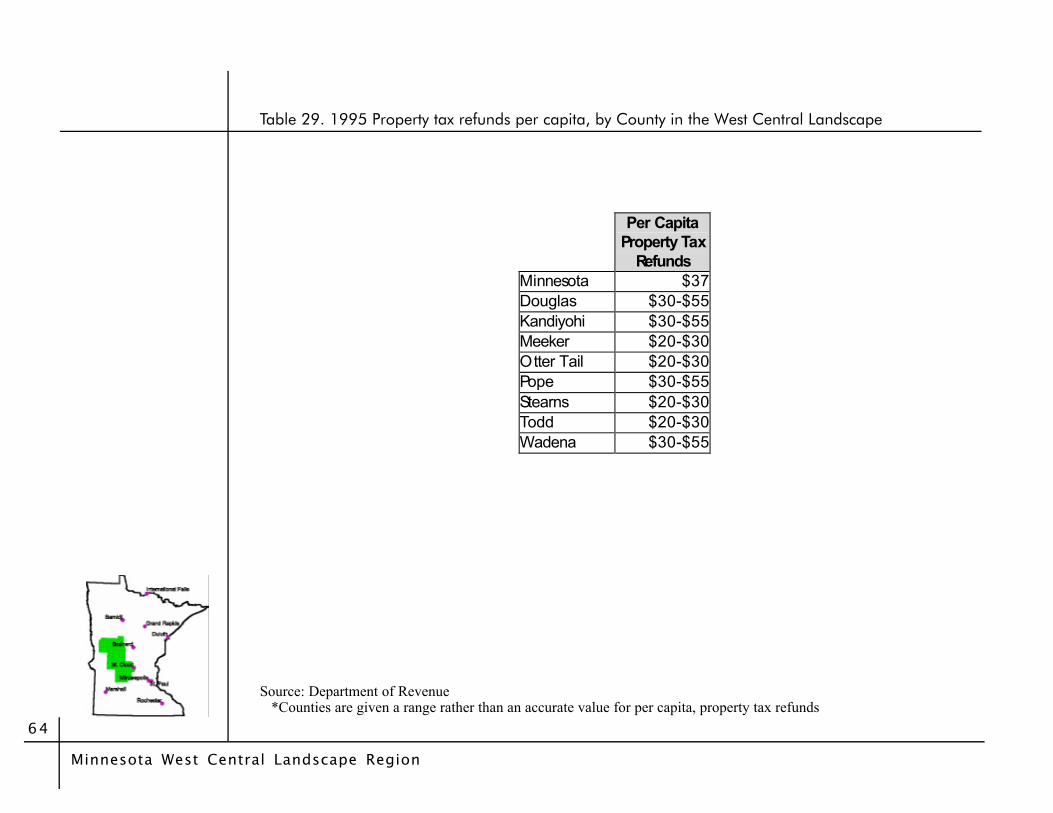
Refunds Minnesota $37 Douglas $30-$55Kandiyohi $30-$55Meeker $20-$30Otter Tail $20-$30Pope $30-$55Stearns $20-$30Todd $20-$30Wadena $30-$55
Table 29. 1995 Property tax refunds per capita, by County in the West Central Landscape
Source: Department of Revenue *Counties are given a range rather than an accurate value for per capita, property tax refunds

Current Conditions and Trends Assessment
65
Per Capita Income Tax
Minnesota $737 Douglas $255-$500Kandiyohi $500-$700Meeker $255-$500Otter Tail $255-$500Pope $255-$500Stearns $500-$700Todd $255-$500Wadena $255-$500
Table 30. 1994 Individual Income Tax Payments per Capita, by County inthe West Central Landscape
Source: Department of Revenue *Counties are given a range rather than an accurate value for per capita, property tax refunds

Minnesota West Central Landscape Region
66
Number of Timber Mills
West Central Region 18 Douglas 1 Kandiyohi 1 Meeker 0 Otter Tail 5 Pope 0 Stearns 4 Todd 3 Wadena 4
Table 31. Sawmills, Paper Mills, ect. per County in the West Central Landscape
Source: United States Forestry Service (North Central Research Station)

Current Conditions and Trends Assessment
67
Figure 14. The Minnesota Forest Products Industry
Note: The forest and timber products industry accounts for 2.5% of statewide personal income and is thus a majorcomponent of Minnesota’s economy. Figure 3.1 summarizes the major businesses involved in this industry. Alsoincluded below is a pie chart, illustrating the proportion of total labor supplied by each division of the forestry productssector. Allied products (secondary businesses associated with the timber industry) supply the greatest amount ofemployment in forestry products with 43.6% of net employment. Lumber and wood products account for nearly 30%of employment. Logging, pulp and paper mills, and wooden furniture and fixtures comprise the remaining forestproducts and timber related jobs in Minnesota.
Minnesota West Central Landscape Region
68
Figure 15. Trends in hardwood and soft wood harvesting statewide, 1980-1997
Current Conditions and Trends Assessment
69
Species 1990 1998 % Increase in Price
Aspen $ 23.34 $ 100.54 331%
Birch $ 20.87 $ 39.78 91%
Ash $ 49.44 $ 97.09 96%
Elm $ 38.77 $ 53.31 38%
Oak $ 73.40 $ 140.20 91%
Balsam $ 20.54 $ 88.30 330%
W. Spruce $ 54.34 $ 78.34 44%
Cedar $ 29.63 $ 38.64 30%
J. Pine $ 62.83 $ 121.84 94%
R. & W. Pine
$ 93.55 $ 161.01 72%
Table 32. Average Prices Received for Sawtimber ($’s per MBF) sold by Public LandAgencies in Minnesota: 1990 and 1998
Source: Department of Natural Resources (Forestry Division).
Note: This data is somewhat misleading, as it fails to account for changes in inflation. With an estimate of 3.5%annual inflation over this time period, the price level would be expected to increase by approximately 32%.

Minnesota West Central Landscape Region
70
Figure 16. Average stumpage prices received by public agencies for sawtimber, 1987-1997
0
20
40
60
80
100
120
140
1987 1988 1989 1990 1991 1992 1993 1994 1995 1996 1997
Year
Ave
rag
e p
rice
rec
eive
d f
or
saw
tim
ber
($/
MB
F)
MN DNR Statewide public agencies
Source: DNR – Forestry
Note: Although this is statewide stumpage data, these findings apply directly to the northernregion because only trivial price differences would be seen across the state.
Current Conditions and Trends Assessment
71
Species 1990 1998 % Increase in Price
Aspen $ 6.09 $ 20.54 237%
Balm $ 3.35 $ 16.95 406%
Birch $ 3.69 $ 7.53 104%
Ash $ 3.82 $ 5.51 44%
Oak $ 4.89 $ 8.98 84%
Balsam $ 6.49 $ 14.12 118%
W. Spruce $ 12.42 $ 19.18 54%
B. Spruce $ 11.88 $ 21.16 78%
Tamarack $ 4.61 $ 7.29 58%
Cedar $ 9.76 $ 7.31 -25%
J. Pine $ 11.34 $ 24.72 118%
R. & W. Pine $ 13.04 $ 15.63 20%
Table 33. Average Prices Received for Pulpwood ($’s per Cord) sold by Public Land Agencies inMinnesota: 1990 and 1998
Source: Department of Natural Resources (Forestry Division)
Minnesota West Central Landscape Region
72
Figure 17. Average stumpage prices received by public agencies for pulp-wood, 1987-1997
0
2
4
6
8
10
12
14
16
18
20
1987 1988 1989 1990 1991 1992 1993 1994 1995 1996 1997
Year
Ave
rag
e p
rice
rec
eive
d p
er c
ord
of
pu
lpw
oo
d
MN DNR Statewide public agencies
Source: DNR - Forestry

Current Conditions and Trends Assessment
73
Observations
Recreation and Tourism
Tourism in Minnesota has grown substantially during thepast decade (Figure 18).
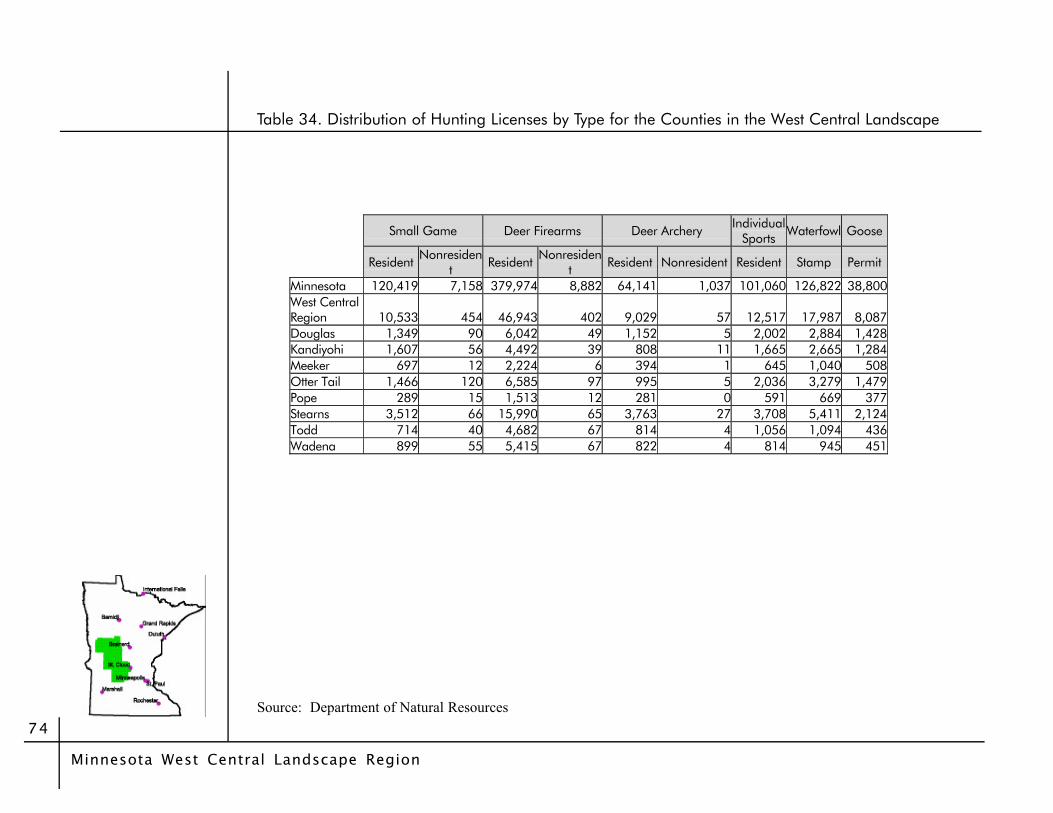
Tourism in the region is largely based upon camping, fishingand hunting (Table 34).
Stearns, Otter Tail, and Douglas have the greatest amountof hunting in the region (Table 34).
There is a large amount of major roads systems in thisregion (Figure 19).
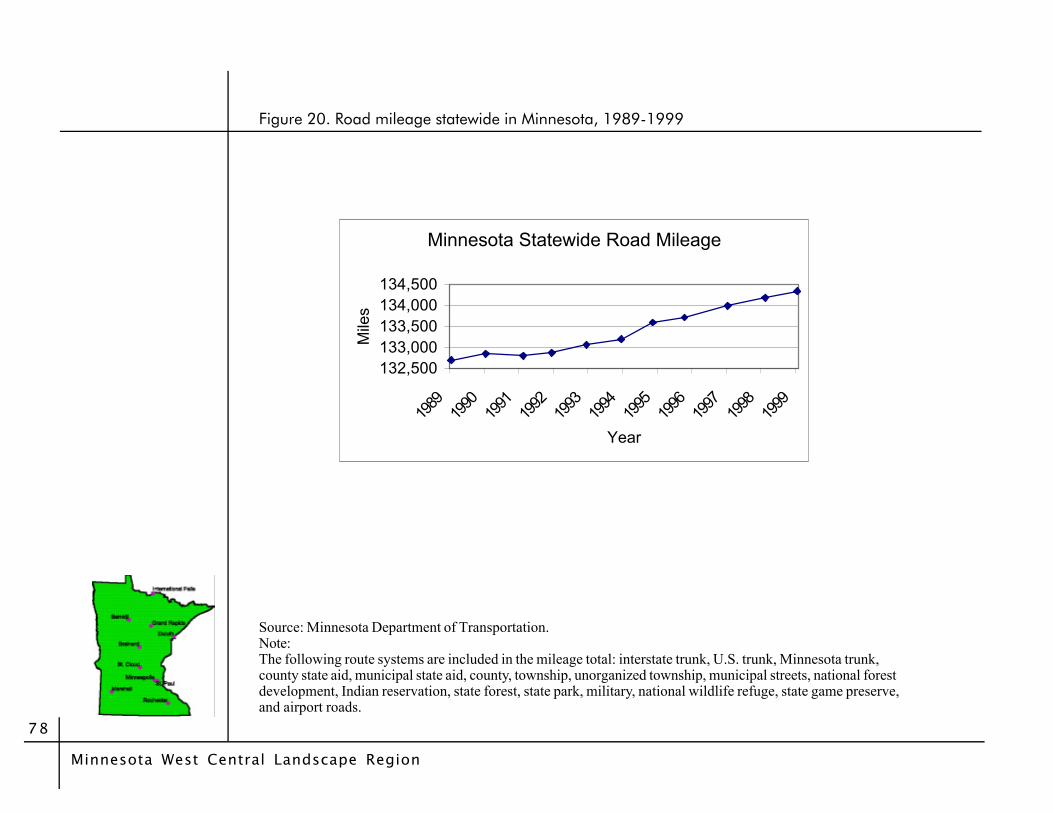
Statewide roads and trails have been increasing for at lestthe last 10 years (Figures 20 and 21).
Minnesota West Central Landscape Region
74
Small Game Deer Firearms Deer Archery Individual Sports Waterfowl Goose
Resident Nonresident Resident Nonresiden
t Resident Nonresident Resident Stamp Permit
Minnesota 120,419 7,158 379,974 8,882 64,141 1,037 101,060 126,822 38,800West Central Region 10,533 454 46,943 402 9,029 57 12,517 17,987 8,087Douglas 1,349 90 6,042 49 1,152 5 2,002 2,884 1,428Kandiyohi 1,607 56 4,492 39 808 11 1,665 2,665 1,284Meeker 697 12 2,224 6 394 1 645 1,040 508Otter Tail 1,466 120 6,585 97 995 5 2,036 3,279 1,479Pope 289 15 1,513 12 281 0 591 669 377Stearns 3,512 66 15,990 65 3,763 27 3,708 5,411 2,124Todd 714 40 4,682 67 814 4 1,056 1,094 436Wadena 899 55 5,415 67 822 4 814 945 451
Table 34. Distribution of Hunting Licenses by Type for the Counties in the West Central Landscape
Source: Department of Natural Resources

Current Conditions and Trends Assessment
75
1996 Sales for All
Lodging Places
% Change From 1995
to 1996
Minnesota 1,142,036 14.00%West Central Region 68,300 NADouglas 20,801 22.30%Kandiyohi 9,131 16.10%Meeker 586 1.70%Otter Tail 9,201 4.70%Pope 1,999 42.50%Stearns 24,108 28.90%Todd 842 6.20%Wadena 1,632 90.20%
Table 35. 1996 Total Sales from Hotels, Motels, Resorts and Other Lodging Places perCounty in the West Central Landscape(In Thousands of Dollars)
Source: Minnesota Department of Trade & Economic Development * This data can be used as a proxy for relative tourism levels.
Minnesota West Central Landscape Region
76
Figure 18. Economic impact of domestic travel, 1988-1995
0
1
2
3
4
5
6
7
8
9
1988 1989 1990 1991 1992 1993 1994 1995
Year
Gro
ss R
ecei
pts
Imp
acts
(Bill
ion
Do
llars
)
Northeast
Northcentral
Northwest
State Total
Source: MN Department of Trade and Economic Development, MN Office of Tourism
Notes: The MN Office of Tourism regions include the following counties:Northeast: Aitkin, Carlton, Cook, Isanti, Itasca, Kanabec, Koochiching, Lake, Pine, and St. Louis.Northcentral: Beltrami, Benton, Cass, Crow Wing, Hubbard, Lake of the Woods, Mille Lacs,Morrison, Roseau, Sherburne, Stearns, and Todd.Northwest: Becker, Clay, Clearwater, Douglas, Grant, Kittson, Mahnomen, Marshall, Norman,Otter Tail, Pennington, Polk, Pope, Red Lake, Stevens, Wadena, and Wilkin

Current Conditions and Trends Assessment
77Source: MN Department of Transportation
Figure 19. Major Roads in the West Central Landscape
Minnesota West Central Landscape Region
78
Figure 20. Road mileage statewide in Minnesota, 1989-1999
Source: Minnesota Department of Transportation.Note:The following route systems are included in the mileage total: interstate trunk, U.S. trunk, Minnesota trunk,county state aid, municipal state aid, county, township, unorganized township, municipal streets, national forestdevelopment, Indian reservation, state forest, state park, military, national wildlife refuge, state game preserve,and airport roads.
Minnesota Statewide Road Mileage
132,500133,000133,500134,000134,500
1989
1990
1991
1992
1993
1994
1995
1996
1997
1998
1999
Year
Mile
s

Current Conditions and Trends Assessment
79
Figure 21. Trail mileage statewide in Minnesota, 1984-1996
Source: Minnesota Department of Natural Resources Division of Trails and Waterways.
Statewide Trail Mileage
0
5,000
10,000
15,000
20,000
25,000
1984
1985
1986
1987
1988
1989
1990
1991
1992
1993
1994
1995
1996
Year
Mile
s Total PublicTotal PrivateGrand Total

Minnesota Southeast Landscape Region
80
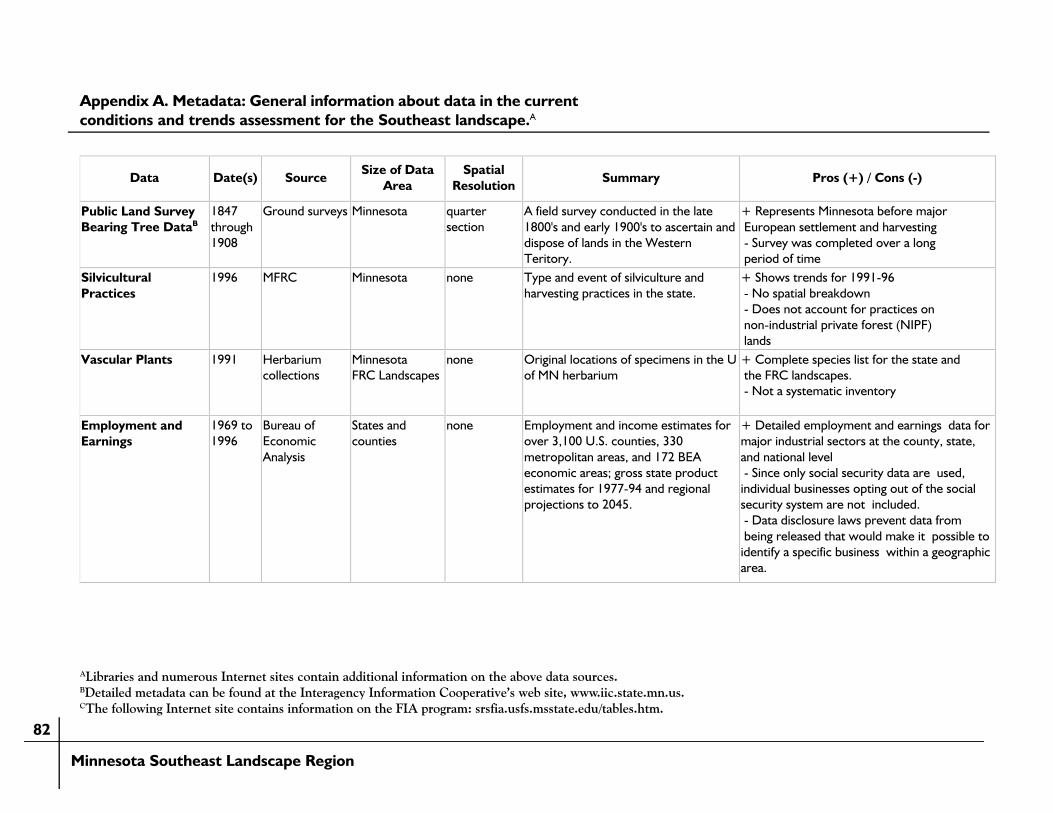
Appendix A. Metadata: General information about data in the current con-ditions and trends assessment for the Southeast landscape.A
Data Date(s) Source Size of DataArea
SpatialResolution Summary Pros (+) / Cons (-)
Advanced VeryHigh RadiometerResolutionAVHRRB
1990 to1996biweek
Satellite images Earth 250 acres AVHRR Satellites initially used forweather purposes, but found to usefulin regional/global vegetation analysis.
+ High temporal resolution - Poor spatial resoltion
Breeding Birds 1999 J.C. Green Minnesota, andNorth centralMinnesota
none Listing of birds in the state andnortheast.
+ Complete species list for the state andNorth central MN - No abundance list
CooperativeStand AssessmentCSAB
1998 Aeriel photosand groundsurveys
Minnesota,Stand Level,Public ForestLands
1 to 3 acres Public agencies responsible for forestmanagement use this data as their maininventory source.
+ Detailed forest stand information - Only land managed by public agencies forforest magement represented
Demographic 19901995
U.S. CensusBureau
U.S., states,counties, cities,census tracts,and blockgroups
none Survey of all individuals. Demographicdata on population, income, housing,and employment by geographic region(place of residence).
+ Complete universe of individuals+ Fine level of geographic detail - Updated only every 10 years
Forest InventoryAnd Analysis FIAB C
See Appendix B formore information.
19771990
Aerial photosand groundsurveys
Minnesota,Plot Level
1225 acresrepresentedper plot
A federally funded inventory of thestate’s forest resources: their type,extent, growth, mortality, andremovals.
+ Detailed forest stand information+ Represents public and private lands - Poor spatial resolution
GAP StewardshipB 1995 Land records Minnesota 40 acres Provides ownership and administrationinformation for each PLS quarter-quarter section.
+ Provides ownership information for theentire state - Source data is mostly from 1983B85 - Poor spatial resolution
ALibraries and numerous Internet sites contain additional information on the above data sources.BDetailed metadata can be found at the Interagency Information Cooperative’s web site, www.iic.state.mn.us.CThe following Internet site contains information on the FIA program: srsfia.usfs.msstate.edu/tables.htm.

Current Conditions and Trends Assessment
81
Appendix A. Metadata: General information about data in the currentconditions and trends assessment for the Southeast landscape.A
Data Date(s) Source Size of DataArea
SpatialResolution Summary Pros (+) / Cons (-)
LandUseB 1969 air photos Minnesota 40 acres Shows land use in Minnesota brokeninto several different categories.
+ Historical representation - Poor spatial resolution
LandUse/CoverB 1990 Aerial photosand satelliteimages
Minnesota 1/4 acre Shows land use in Minnesota brokeninto several different categories.
+ High spatial resolution - Different classifications used than in the1969 land use data
Mammals,Amphibians, Reptiles
1995 J.R. Tester andJ.C. Green
Minnesota, andNorth centralMinnesota
none Listing of mammals, amphibians, andreptiles in the state and North central.
+ Complete species list for the state andNorth central MN - No abundance data
MarschnerPresettlementVegetationB
1930 1847-1908Public LandSurvey (PLS)
Minnesota 100's acres Maps out basic boundaries of foreststands using data from the PLS.
+ Historical representation+ Good generalization - Very poor spatial resolution - General cover type classes
MinnesotaLegislative reports(state lands)
1951to1970
DNR reports Minnesota none Gives information on statutory acreagesin different state land areas (parks andforests).
+ Good historical information - Is based on statutory boundaries
MN DNR Trails 1984to1996
DNR reports Minnesota none Yearly summaries from 1984 to 1996on the trail mileages in MN, includingboth private and public trails.
+ High temporal resolution+ Distinctive trail classes - Only DNR tral mileages frequenty updated- Overlap in trail mileage counts for multi-usetrails
National ResourcesInventoryB
198219871992
Aerial photosand groundsurveys
U.S. nonfederallands
1875 acresrepresentedper plot
A statistically based sample of land useand natural resources conditions andtrends on U.S. non-federal land.
+ Includes private land - Does not include federal lands - Main focus is on agricultural land
ALibraries and numerous Internet sites contain additional information on the above data sources.BDetailed metadata can be found at the Interagency Information Cooperative’s web site, www.iic.state.mn.us.CThe following Internet site contains information on the FIA program: srsfia.usfs.msstate.edu/tables.htm.
Minnesota Southeast Landscape Region
82
Appendix A. Metadata: General information about data in the currentconditions and trends assessment for the Southeast landscape.A
Data Date(s) Source Size of DataArea
SpatialResolution Summary Pros (+) / Cons (-)
Public Land SurveyBearing Tree DataB
1847through1908
Ground surveys Minnesota quartersection
A field survey conducted in the late1800's and early 1900's to ascertain anddispose of lands in the WesternTeritory.
+ Represents Minnesota before major European settlement and harvesting - Survey was completed over a long period of time
SilviculturalPractices
1996 MFRC Minnesota none Type and event of silviculture andharvesting practices in the state.
+ Shows trends for 1991-96 - No spatial breakdown - Does not account for practices on non-industrial private forest (NIPF) lands
Vascular Plants 1991 Herbariumcollections
MinnesotaFRC Landscapes
none Original locations of specimens in the Uof MN herbarium
+ Complete species list for the state and the FRC landscapes. - Not a systematic inventory
Employment andEarnings
1969 to1996
Bureau ofEconomicAnalysis
States andcounties
none Employment and income estimates forover 3,100 U.S. counties, 330metropolitan areas, and 172 BEAeconomic areas; gross state productestimates for 1977-94 and regionalprojections to 2045.
+ Detailed employment and earnings data formajor industrial sectors at the county, state,and national level - Since only social security data are used,individual businesses opting out of the socialsecurity system are not included. - Data disclosure laws prevent data from being released that would make it possible toidentify a specific business within a geographicarea.
ALibraries and numerous Internet sites contain additional information on the above data sources.BDetailed metadata can be found at the Interagency Information Cooperative’s web site, www.iic.state.mn.us.CThe following Internet site contains information on the FIA program: srsfia.usfs.msstate.edu/tables.htm.
Current Conditions and Trends Assessment
83
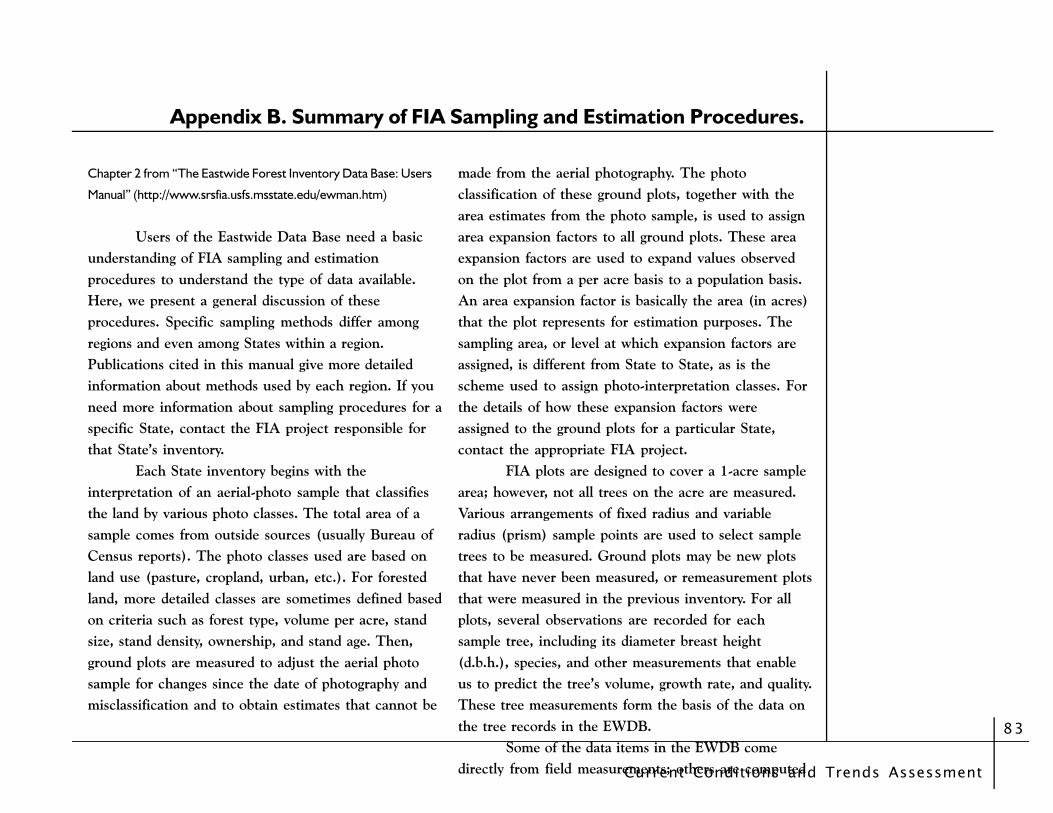
Appendix B. Summary of FIA Sampling and Estimation Procedures.
Chapter 2 from “The Eastwide Forest Inventory Data Base: Users
Manual” (http://www.srsfia.usfs.msstate.edu/ewman.htm)
Users of the Eastwide Data Base need a basicunderstanding of FIA sampling and estimationprocedures to understand the type of data available.Here, we present a general discussion of theseprocedures. Specific sampling methods differ amongregions and even among States within a region.Publications cited in this manual give more detailedinformation about methods used by each region. If youneed more information about sampling procedures for aspecific State, contact the FIA project responsible forthat State’s inventory.
Each State inventory begins with theinterpretation of an aerial-photo sample that classifiesthe land by various photo classes. The total area of asample comes from outside sources (usually Bureau ofCensus reports). The photo classes used are based onland use (pasture, cropland, urban, etc.). For forestedland, more detailed classes are sometimes defined basedon criteria such as forest type, volume per acre, standsize, stand density, ownership, and stand age. Then,ground plots are measured to adjust the aerial photosample for changes since the date of photography andmisclassification and to obtain estimates that cannot be
made from the aerial photography. The photoclassification of these ground plots, together with thearea estimates from the photo sample, is used to assignarea expansion factors to all ground plots. These areaexpansion factors are used to expand values observedon the plot from a per acre basis to a population basis.An area expansion factor is basically the area (in acres)that the plot represents for estimation purposes. Thesampling area, or level at which expansion factors areassigned, is different from State to State, as is thescheme used to assign photo-interpretation classes. Forthe details of how these expansion factors wereassigned to the ground plots for a particular State,contact the appropriate FIA project.
FIA plots are designed to cover a 1-acre samplearea; however, not all trees on the acre are measured.Various arrangements of fixed radius and variableradius (prism) sample points are used to select sampletrees to be measured. Ground plots may be new plotsthat have never been measured, or remeasurement plotsthat were measured in the previous inventory. For allplots, several observations are recorded for eachsample tree, including its diameter breast height(d.b.h.), species, and other measurements that enableus to predict the tree’s volume, growth rate, and quality.These tree measurements form the basis of the data onthe tree records in the EWDB.
Some of the data items in the EWDB comedirectly from field measurements; others are computed
Minnesota West Central Landscape Region
84
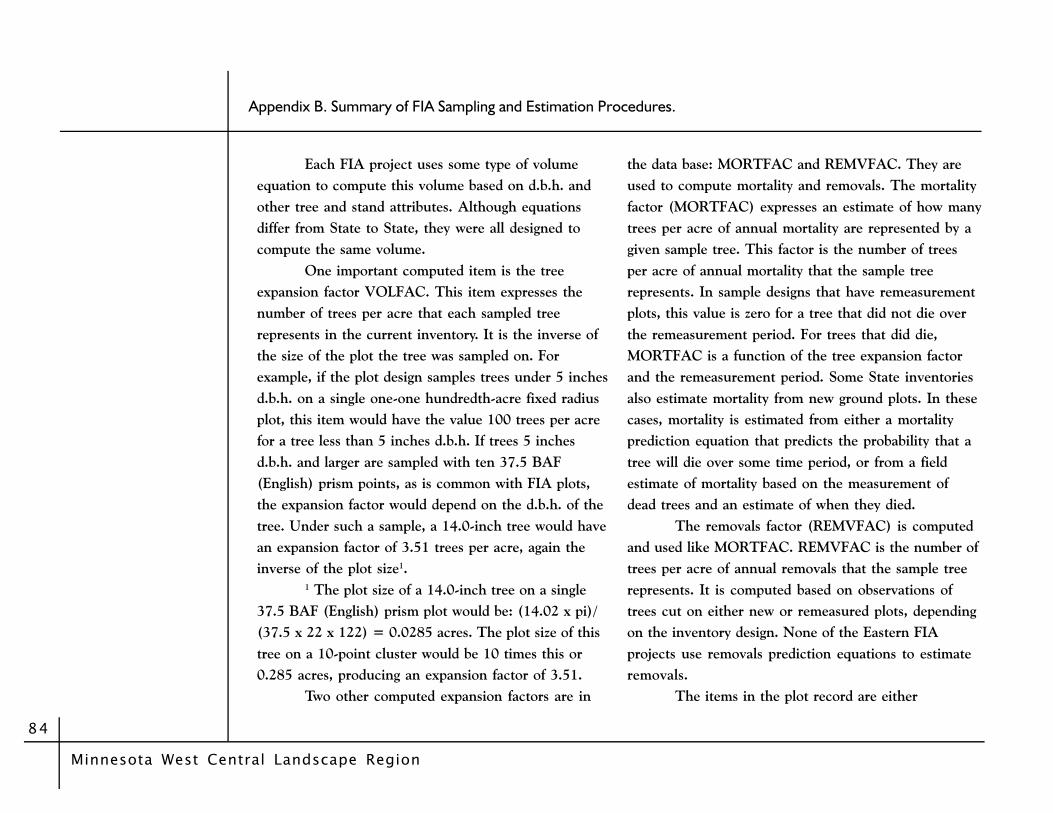
Appendix B. Summary of FIA Sampling and Estimation Procedures.
Each FIA project uses some type of volumeequation to compute this volume based on d.b.h. andother tree and stand attributes. Although equationsdiffer from State to State, they were all designed tocompute the same volume.
One important computed item is the treeexpansion factor VOLFAC. This item expresses thenumber of trees per acre that each sampled treerepresents in the current inventory. It is the inverse ofthe size of the plot the tree was sampled on. Forexample, if the plot design samples trees under 5 inchesd.b.h. on a single one-one hundredth-acre fixed radiusplot, this item would have the value 100 trees per acrefor a tree less than 5 inches d.b.h. If trees 5 inchesd.b.h. and larger are sampled with ten 37.5 BAF(English) prism points, as is common with FIA plots,the expansion factor would depend on the d.b.h. of thetree. Under such a sample, a 14.0-inch tree would havean expansion factor of 3.51 trees per acre, again theinverse of the plot size1.
1 The plot size of a 14.0-inch tree on a single37.5 BAF (English) prism plot would be: (14.02 x pi)/(37.5 x 22 x 122) = 0.0285 acres. The plot size of thistree on a 10-point cluster would be 10 times this or0.285 acres, producing an expansion factor of 3.51.
Two other computed expansion factors are in
the data base: MORTFAC and REMVFAC. They areused to compute mortality and removals. The mortalityfactor (MORTFAC) expresses an estimate of how manytrees per acre of annual mortality are represented by agiven sample tree. This factor is the number of treesper acre of annual mortality that the sample treerepresents. In sample designs that have remeasurementplots, this value is zero for a tree that did not die overthe remeasurement period. For trees that did die,MORTFAC is a function of the tree expansion factorand the remeasurement period. Some State inventoriesalso estimate mortality from new ground plots. In thesecases, mortality is estimated from either a mortalityprediction equation that predicts the probability that atree will die over some time period, or from a fieldestimate of mortality based on the measurement ofdead trees and an estimate of when they died.
The removals factor (REMVFAC) is computedand used like MORTFAC. REMVFAC is the number oftrees per acre of annual removals that the sample treerepresents. It is computed based on observations oftrees cut on either new or remeasured plots, dependingon the inventory design. None of the Eastern FIAprojects use removals prediction equations to estimateremovals.
The items in the plot record are either
Current Conditions and Trends Assessment
85
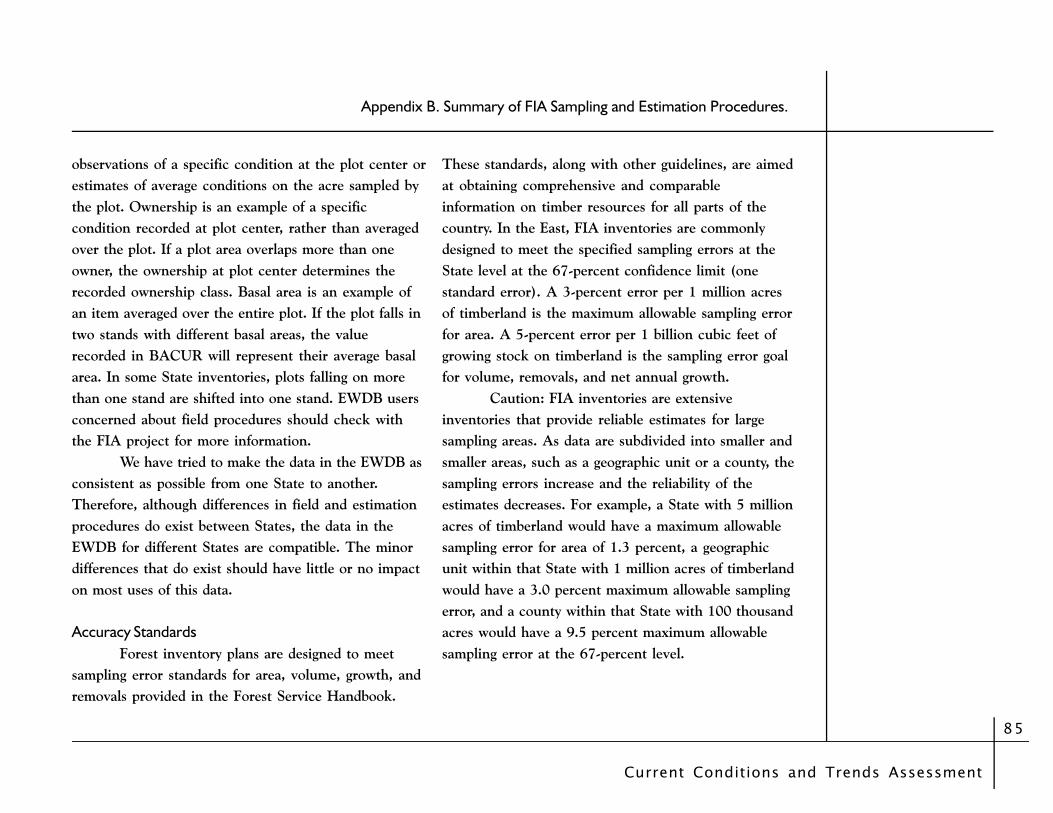
Appendix B. Summary of FIA Sampling and Estimation Procedures.
observations of a specific condition at the plot center orestimates of average conditions on the acre sampled bythe plot. Ownership is an example of a specificcondition recorded at plot center, rather than averagedover the plot. If a plot area overlaps more than oneowner, the ownership at plot center determines therecorded ownership class. Basal area is an example ofan item averaged over the entire plot. If the plot falls intwo stands with different basal areas, the valuerecorded in BACUR will represent their average basalarea. In some State inventories, plots falling on morethan one stand are shifted into one stand. EWDB usersconcerned about field procedures should check withthe FIA project for more information.
We have tried to make the data in the EWDB asconsistent as possible from one State to another.Therefore, although differences in field and estimationprocedures do exist between States, the data in theEWDB for different States are compatible. The minordifferences that do exist should have little or no impacton most uses of this data.
Accuracy StandardsForest inventory plans are designed to meet
sampling error standards for area, volume, growth, andremovals provided in the Forest Service Handbook.
These standards, along with other guidelines, are aimedat obtaining comprehensive and comparableinformation on timber resources for all parts of thecountry. In the East, FIA inventories are commonlydesigned to meet the specified sampling errors at theState level at the 67-percent confidence limit (onestandard error). A 3-percent error per 1 million acresof timberland is the maximum allowable sampling errorfor area. A 5-percent error per 1 billion cubic feet ofgrowing stock on timberland is the sampling error goalfor volume, removals, and net annual growth.
Caution: FIA inventories are extensiveinventories that provide reliable estimates for largesampling areas. As data are subdivided into smaller andsmaller areas, such as a geographic unit or a county, thesampling errors increase and the reliability of theestimates decreases. For example, a State with 5 millionacres of timberland would have a maximum allowablesampling error for area of 1.3 percent, a geographicunit within that State with 1 million acres of timberlandwould have a 3.0 percent maximum allowable samplingerror, and a county within that State with 100 thousandacres would have a 9.5 percent maximum allowablesampling error at the 67-percent level.