current and future technologies for power generation with ... library/events/2012/co2 capture... ·...
TRANSCRIPT
1
Current and Future Technologies for Power
Generation with Post-Combustion Carbon
Capture
Robert Stevens
National Energy Technology Laboratory
2012 NETL CO2 Capture Technology Meeting
July 11, 2012
2
Disclaimer
This presentation was prepared as an account of work sponsored by
an agency of the United States Government. Neither the United
States Government nor any agency thereof, nor any of their
employees, makes any warranty, express or implied, or assumes any
legal liability or responsibility for the accuracy, completeness, or
usefulness of any information, apparatus, product, or process
disclosed, or represents that its use would not infringe privately
owned rights. Reference therein to any specific commercial product,
process, or service by trade name, trademark, manufacturer, or
otherwise does not necessarily constitute or imply its endorsement,
recommendation, or favoring by the United States Government or any
agency thereof. The views and opinions of authors expressed therein
do not necessarily state or reflect those of the United States
Government or any agency thereof.
3
Objectives
• Support DOE’s Carbon Capture and Advanced
Combustion R&D Programs
• Develop technology pathways that feature post-
combustion CCS-enabled PC plants that achieve
≤35% increase in COE relative to today’s new
supercritical PC plant without CCS.
• Utilize the pathway studies to inform technology
development though identification of performance
and cost targets.

4
Scope
• Technologies included:
– Next generation post-combustion CO2 capture
– A-USC steam conditions (5000/1350/1400)
– Advanced CO2 compression
• Pathway begins with 1st generation supercritical PC
plant with today’s post-combustion capture
technology
• Extend the pathway to include emerging
technologies and estimate their performances at a
mature stage of development (i.e., 15-20 years), thus
simulating “nth-of-a-kind” plant performance (low
risk financial structure)

5
PC Plant PFD
coal Coal
Prep
primary air & coal
secondary air
Boiler
Secondary
Air Fan
ID Fan
SCR Air
Heater
ESP /
Baghouse FGD
CO2
Capture
Process
air
stack
gas
CO2
product
flue
gas
Steam
Power
Cycle
CO2
Separation
System
CO2
Purification &
Compression
System
air
air
primary
air
Some technologies
recycle flue gas to the boiler
steam
power
consumables
6
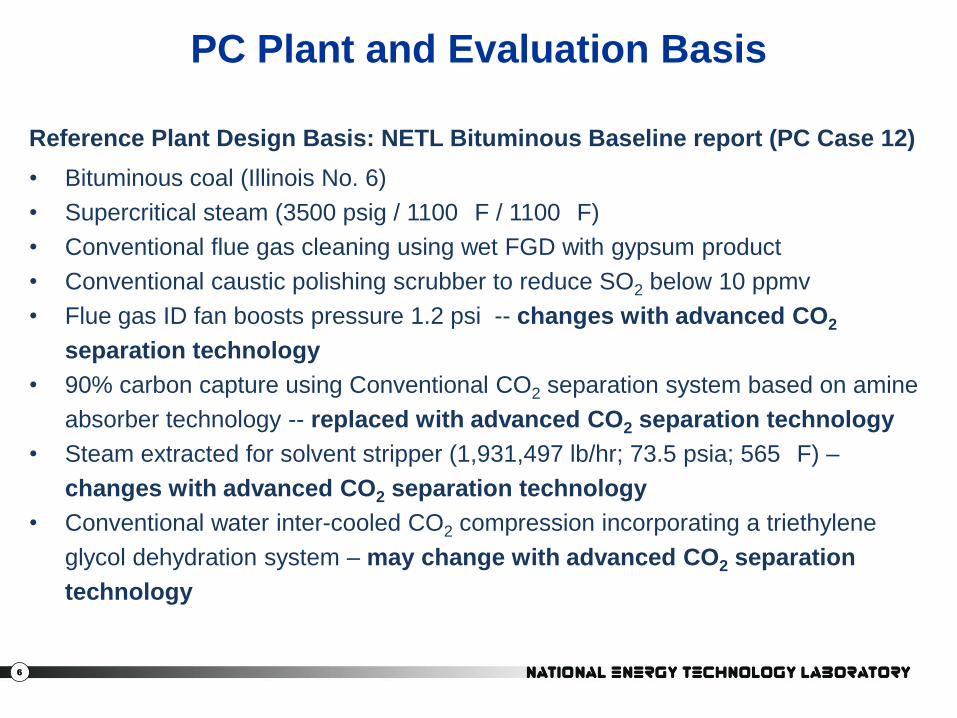
PC Plant and Evaluation Basis
Reference Plant Design Basis: NETL Bituminous Baseline report (PC Case 12)
• Bituminous coal (Illinois No. 6)
• Supercritical steam (3500 psig / 1100 F / 1100 F)
• Conventional flue gas cleaning using wet FGD with gypsum product
• Conventional caustic polishing scrubber to reduce SO2 below 10 ppmv
• Flue gas ID fan boosts pressure 1.2 psi -- changes with advanced CO2
separation technology
• 90% carbon capture using Conventional CO2 separation system based on amine
absorber technology -- replaced with advanced CO2 separation technology
• Steam extracted for solvent stripper (1,931,497 lb/hr; 73.5 psia; 565 F) –
changes with advanced CO2 separation technology
• Conventional water inter-cooled CO2 compression incorporating a triethylene
glycol dehydration system – may change with advanced CO2 separation
technology
7
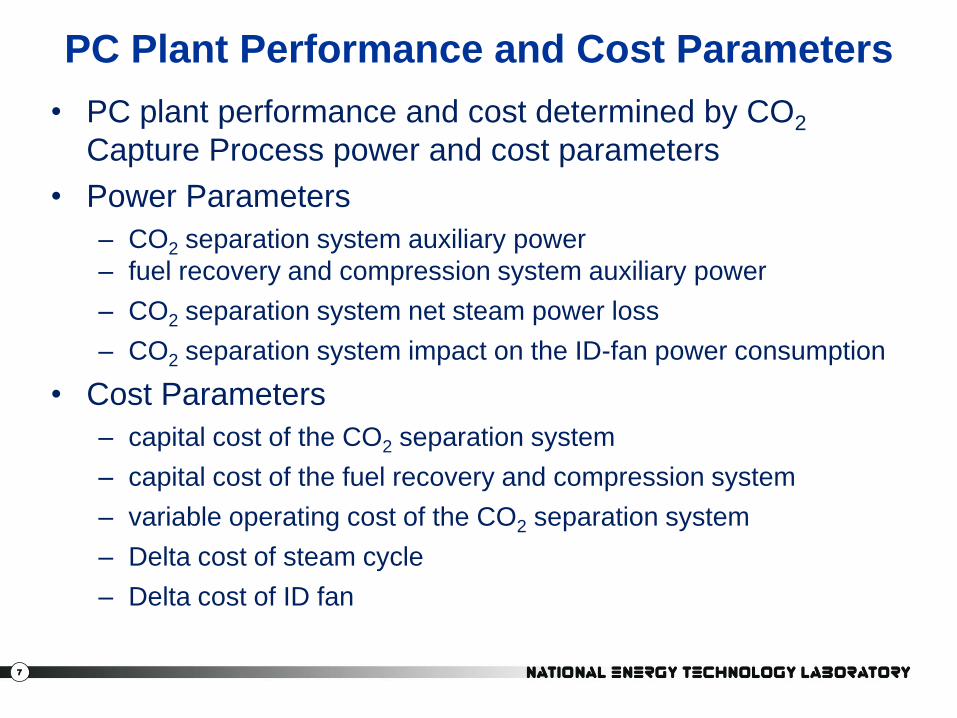
PC Plant Performance and Cost Parameters
• PC plant performance and cost determined by CO2
Capture Process power and cost parameters
• Power Parameters
– CO2 separation system auxiliary power
– fuel recovery and compression system auxiliary power
– CO2 separation system net steam power loss
– CO2 separation system impact on the ID-fan power consumption
• Cost Parameters
– capital cost of the CO2 separation system
– capital cost of the fuel recovery and compression system
– variable operating cost of the CO2 separation system
– Delta cost of steam cycle
– Delta cost of ID fan
8
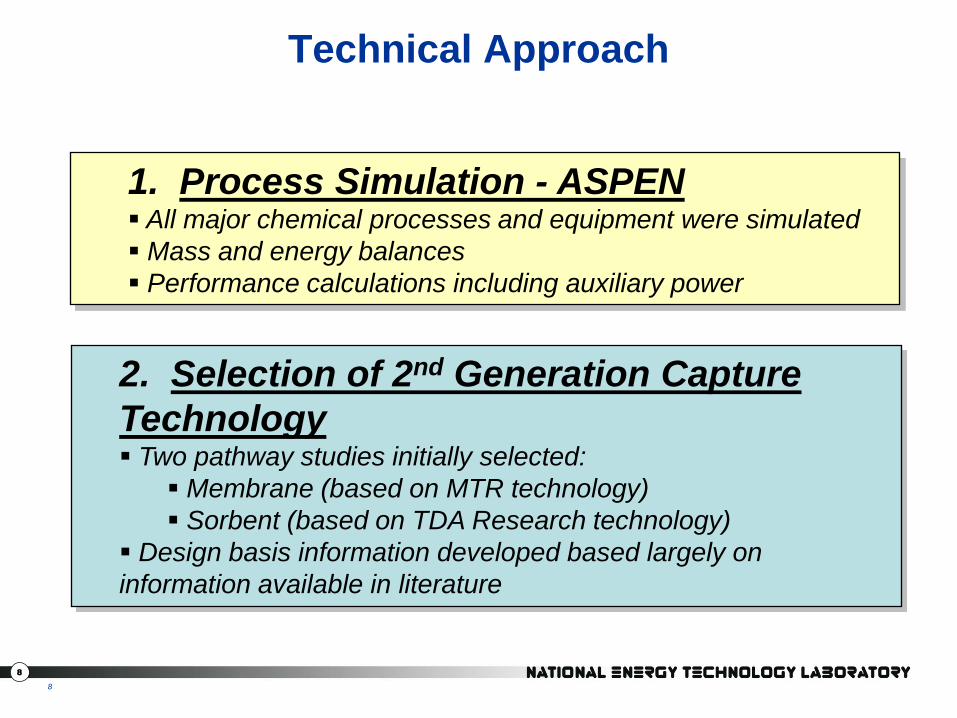
Technical Approach
8
1. Process Simulation - ASPEN All major chemical processes and equipment were simulated
Mass and energy balances
Performance calculations including auxiliary power
2. Selection of 2nd Generation Capture
Technology Two pathway studies initially selected:
Membrane (based on MTR technology)
Sorbent (based on TDA Research technology)
Design basis information developed based largely on
information available in literature
9
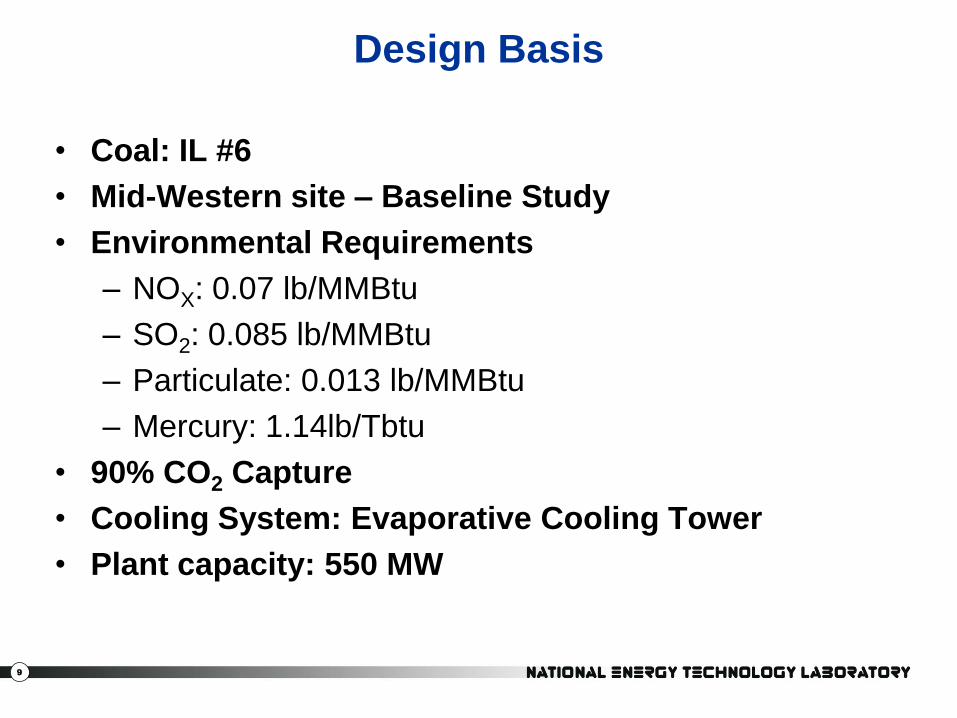
Design Basis
• Coal: IL #6
• Mid-Western site – Baseline Study
• Environmental Requirements
– NOX: 0.07 lb/MMBtu
– SO2: 0.085 lb/MMBtu
– Particulate: 0.013 lb/MMBtu
– Mercury: 1.14lb/Tbtu
• 90% CO2 Capture
• Cooling System: Evaporative Cooling Tower
• Plant capacity: 550 MW
10
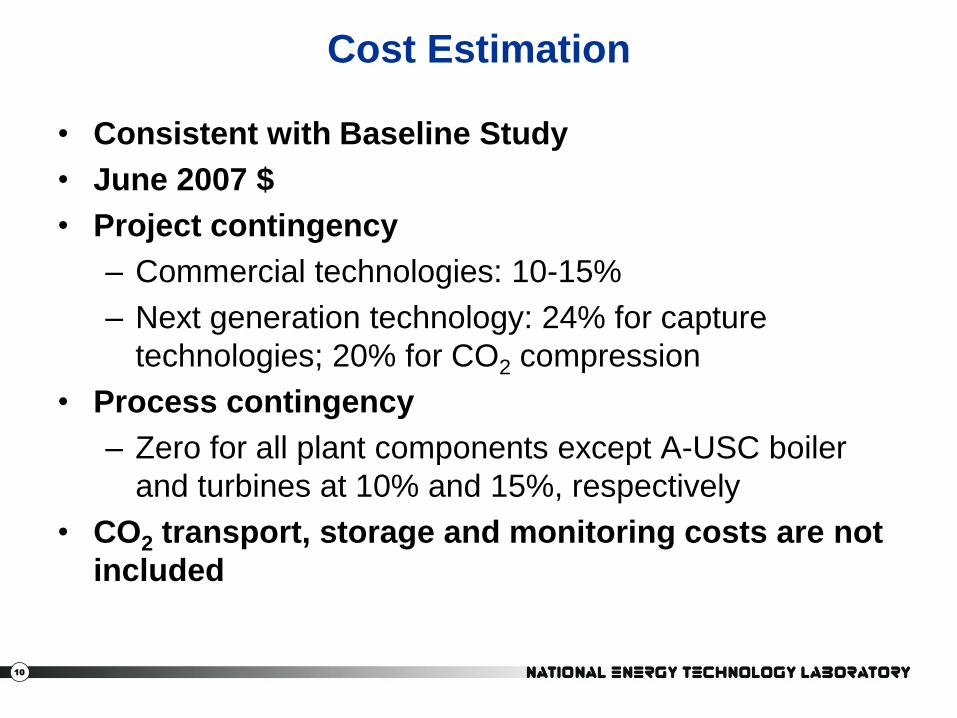
Cost Estimation
• Consistent with Baseline Study
• June 2007 $
• Project contingency
– Commercial technologies: 10-15%
– Next generation technology: 24% for capture
technologies; 20% for CO2 compression
• Process contingency
– Zero for all plant components except A-USC boiler
and turbines at 10% and 15%, respectively
• CO2 transport, storage and monitoring costs are not
included
11
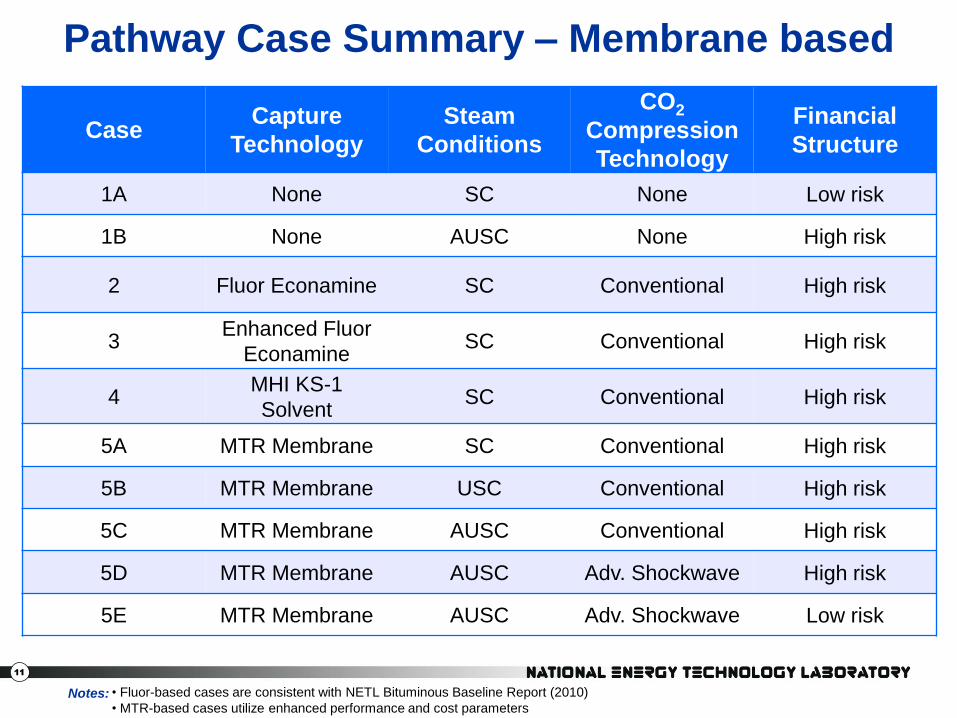
Pathway Case Summary – Membrane based
Case Capture
Technology
Steam
Conditions
CO2
Compression
Technology
Financial
Structure
1A None SC None Low risk
1B None AUSC None High risk
2 Fluor Econamine SC Conventional High risk
3 Enhanced Fluor
Econamine SC Conventional High risk
4 MHI KS-1
Solvent SC Conventional High risk
5A MTR Membrane SC Conventional High risk
5B MTR Membrane USC Conventional High risk
5C MTR Membrane AUSC Conventional High risk
5D MTR Membrane AUSC Adv. Shockwave High risk
5E MTR Membrane AUSC Adv. Shockwave Low risk
• Fluor-based cases are consistent with NETL Bituminous Baseline Report (2010)
• MTR-based cases utilize enhanced performance and cost parameters Notes:
12
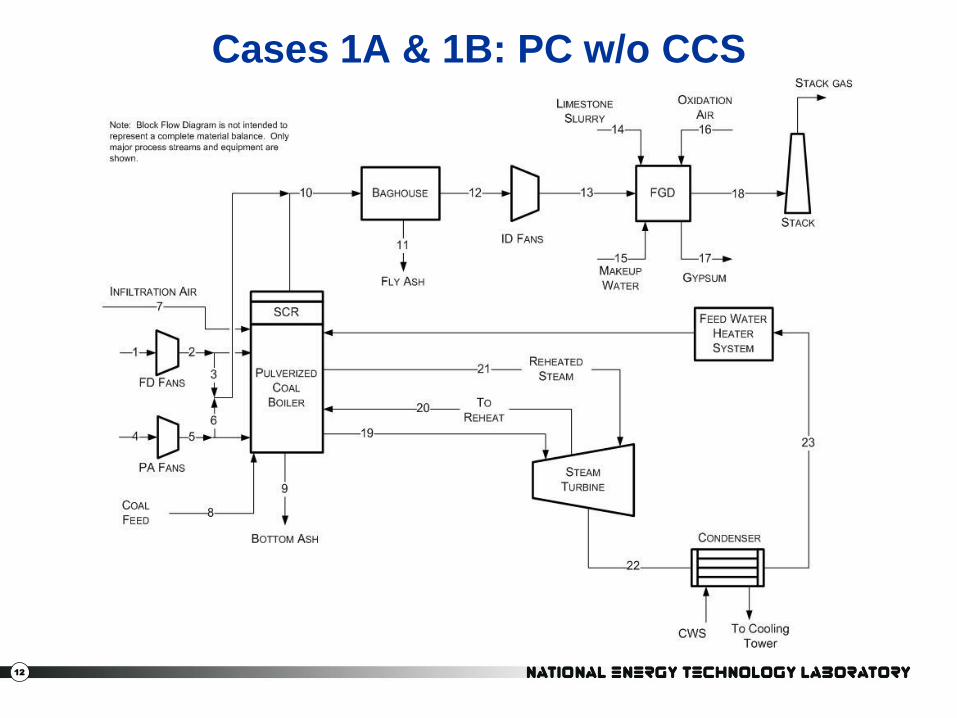
Cases 1A & 1B: PC w/o CCS

13
CASE 1A POWER SUMMARY (kWe)
TOTAL (STEAM TURBINE) POWER, kWe 580,400
AUXILIARY LOAD SUMMARY, kWe
Coal Handling and Conveying 440
Pulverizers 2,780
Sorbent Handling & Reagent Preparation 890
Ash Handling 530
Primary Air Fans 1,300
Forced Draft Fans 1,660
Induced Draft Fans 7,050
SCR 50
Baghouse 70
Wet FGD 2,970
Condensate Pumps 800
Circulating Water Pumps 4,730
Cooling Tower Fans 2,440
Transformer Losses 1,820
TOTAL AUXILIARIES, kWe 30,410
NET POWER, kWe 549,990
Net Plant Efficiency (HHV) 39.3%
Power Summary – Case 1A (SC)
14
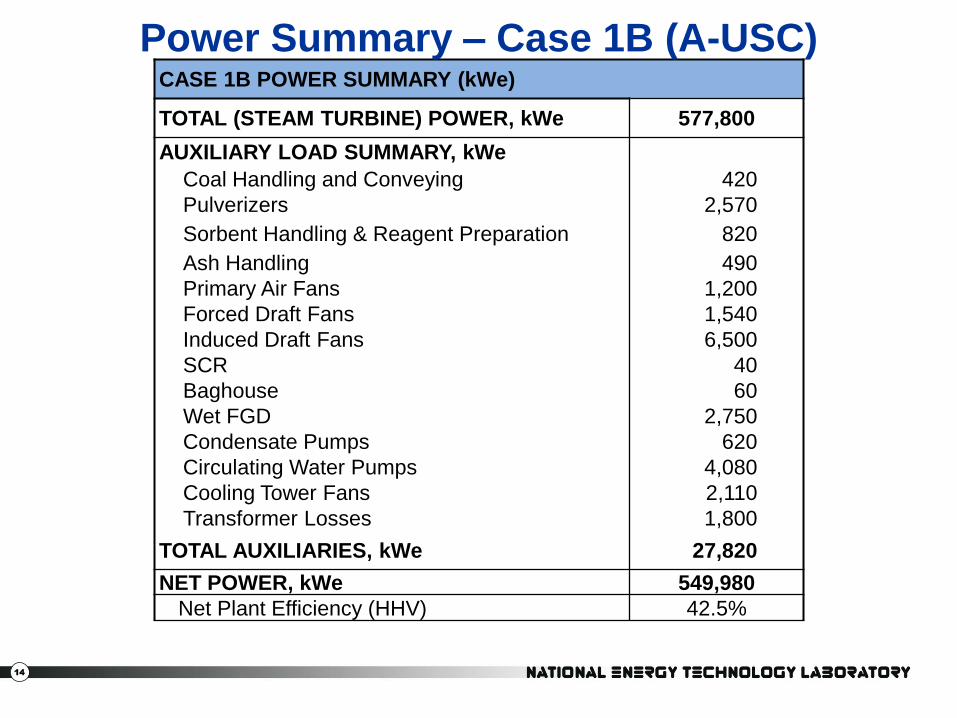
CASE 1B POWER SUMMARY (kWe)
TOTAL (STEAM TURBINE) POWER, kWe 577,800
AUXILIARY LOAD SUMMARY, kWe
Coal Handling and Conveying 420
Pulverizers 2,570
Sorbent Handling & Reagent Preparation 820
Ash Handling 490
Primary Air Fans 1,200
Forced Draft Fans 1,540
Induced Draft Fans 6,500
SCR 40
Baghouse 60
Wet FGD 2,750
Condensate Pumps 620
Circulating Water Pumps 4,080
Cooling Tower Fans 2,110
Transformer Losses 1,800
TOTAL AUXILIARIES, kWe 27,820
NET POWER, kWe 549,980
Net Plant Efficiency (HHV) 42.5%
Power Summary – Case 1B (A-USC)

15
BFD for PC with CO2 Capture
CO2
CAPTURE
16
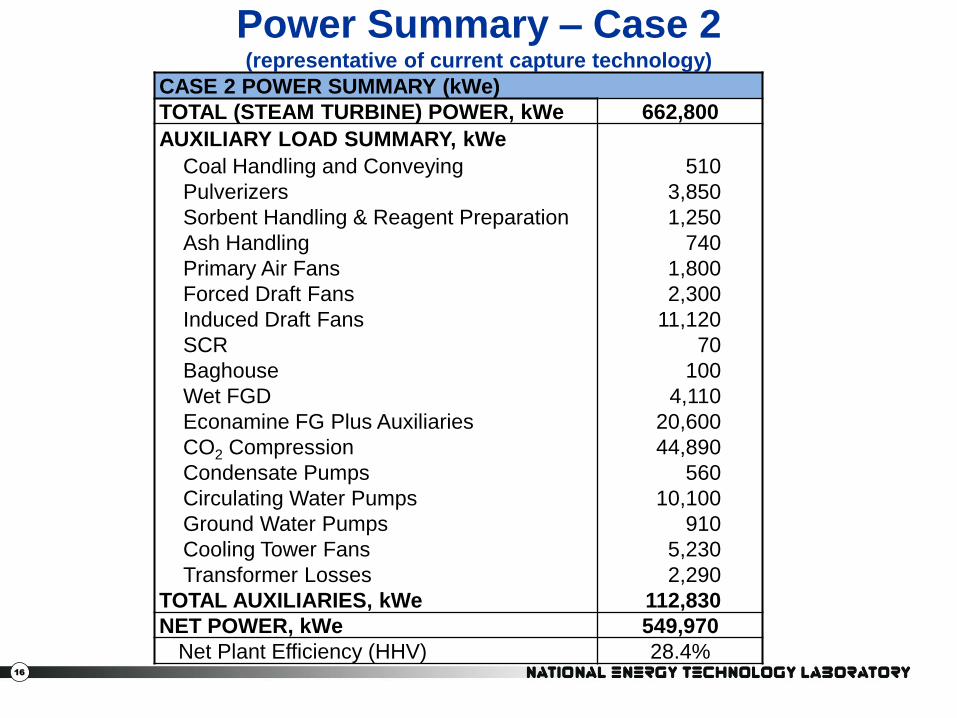
CASE 2 POWER SUMMARY (kWe)
TOTAL (STEAM TURBINE) POWER, kWe 662,800
AUXILIARY LOAD SUMMARY, kWe
Coal Handling and Conveying 510
Pulverizers 3,850
Sorbent Handling & Reagent Preparation 1,250
Ash Handling 740
Primary Air Fans 1,800
Forced Draft Fans 2,300
Induced Draft Fans 11,120
SCR 70
Baghouse 100
Wet FGD 4,110
Econamine FG Plus Auxiliaries 20,600
CO2 Compression 44,890
Condensate Pumps 560
Circulating Water Pumps 10,100
Ground Water Pumps 910
Cooling Tower Fans 5,230
Transformer Losses 2,290
TOTAL AUXILIARIES, kWe 112,830
NET POWER, kWe 549,970
Net Plant Efficiency (HHV) 28.4%
Power Summary – Case 2 (representative of current capture technology)
17
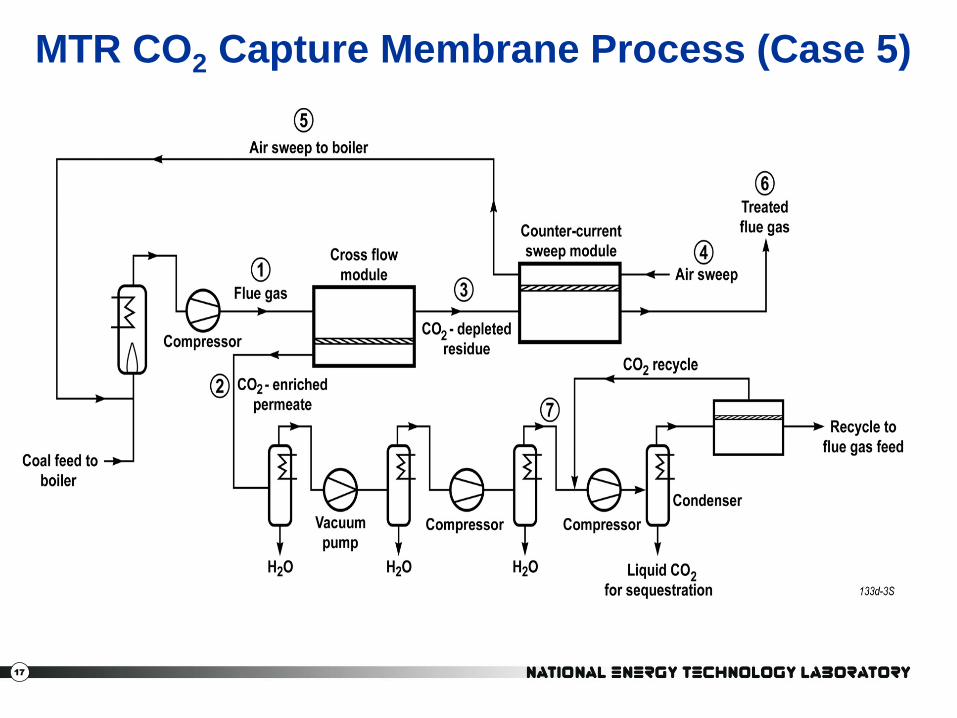
MTR CO2 Capture Membrane Process (Case 5)
18
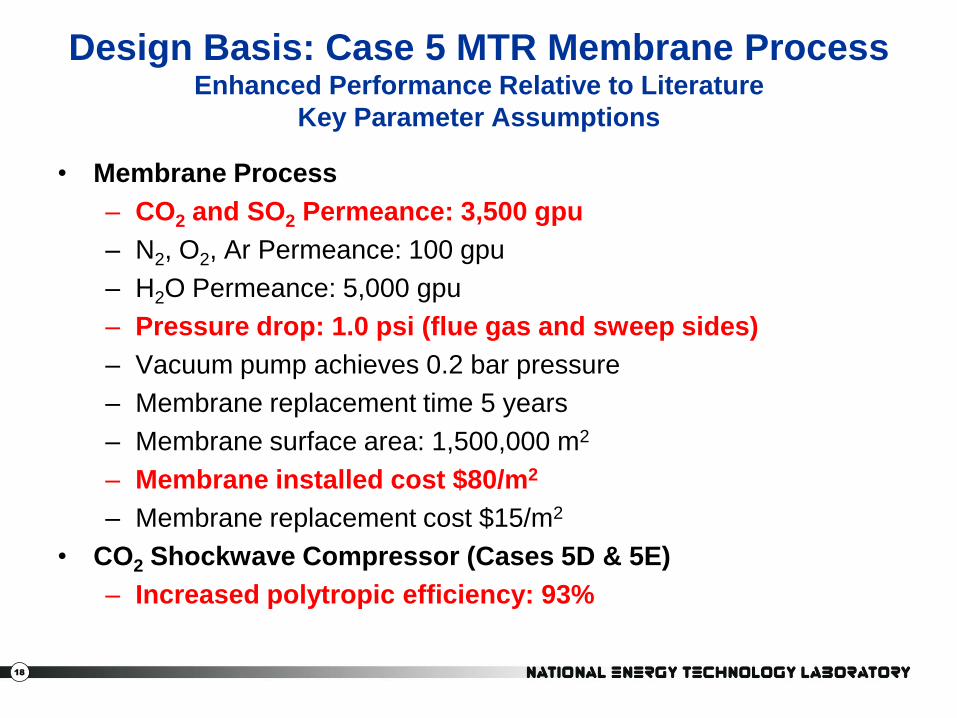
Design Basis: Case 5 MTR Membrane Process Enhanced Performance Relative to Literature
Key Parameter Assumptions
• Membrane Process
– CO2 and SO2 Permeance: 3,500 gpu
– N2, O2, Ar Permeance: 100 gpu
– H2O Permeance: 5,000 gpu
– Pressure drop: 1.0 psi (flue gas and sweep sides)
– Vacuum pump achieves 0.2 bar pressure
– Membrane replacement time 5 years
– Membrane surface area: 1,500,000 m2
– Membrane installed cost $80/m2
– Membrane replacement cost $15/m2
• CO2 Shockwave Compressor (Cases 5D & 5E)
– Increased polytropic efficiency: 93%
19
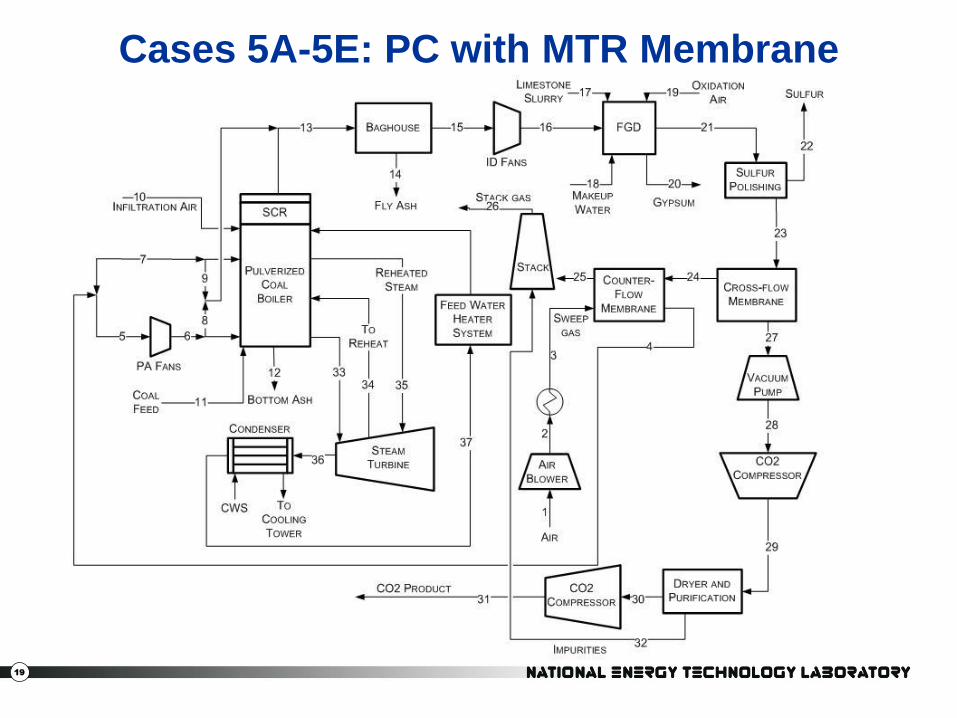
Cases 5A-5E: PC with MTR Membrane
20
39.3
42.5
28.4 29.8 30.432.7 34.2
36.1 36.5 36.5
0
5
10
15
20
25
30
35
40
45
50P
lan
t Eff
icie
ncy
(H
HV
), %
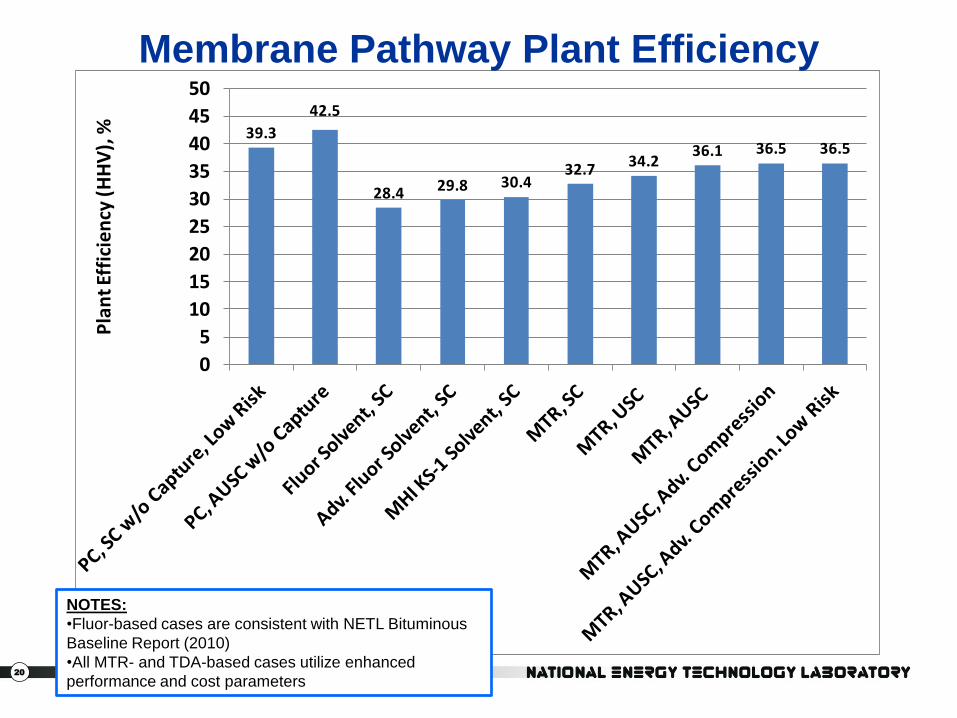
Membrane Pathway Plant Efficiency
NOTES:
•Fluor-based cases are consistent with NETL Bituminous
Baseline Report (2010)
•All MTR- and TDA-based cases utilize enhanced
performance and cost parameters
21
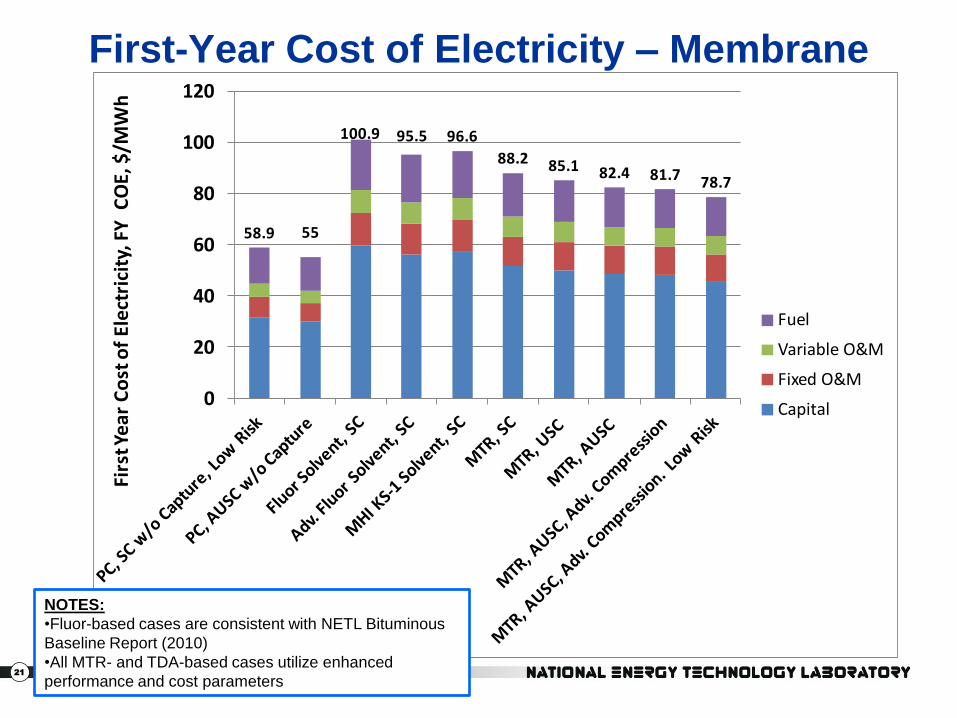
First-Year Cost of Electricity – Membrane
58.9 55
100.9 95.5 96.6
88.2 85.1 82.4 81.7 78.7
0
20
40
60
80
100
120
Firs
t Ye
ar C
ost
of
Ele
ctri
city
, FY
CO
E, $
/MW
h
Fuel
Variable O&M
Fixed O&M
Capital
NOTES:
•Fluor-based cases are consistent with NETL Bituminous
Baseline Report (2010)
•All MTR- and TDA-based cases utilize enhanced
performance and cost parameters
22
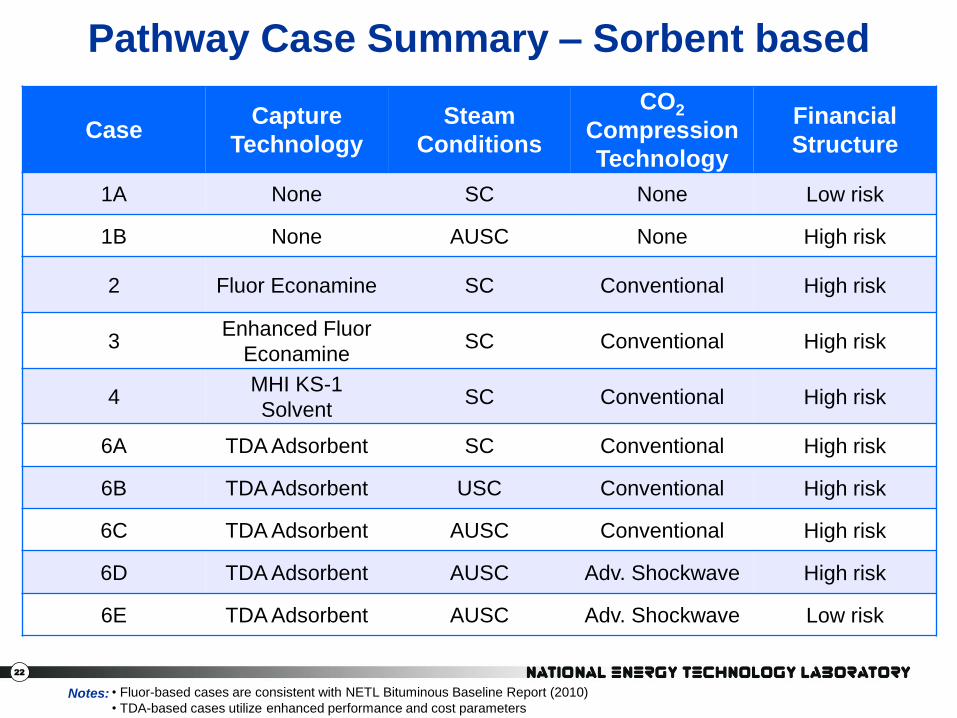
Pathway Case Summary – Sorbent based
Case Capture
Technology
Steam
Conditions
CO2
Compression
Technology
Financial
Structure
1A None SC None Low risk
1B None AUSC None High risk
2 Fluor Econamine SC Conventional High risk
3 Enhanced Fluor
Econamine SC Conventional High risk
4 MHI KS-1
Solvent SC Conventional High risk
6A TDA Adsorbent SC Conventional High risk
6B TDA Adsorbent USC Conventional High risk
6C TDA Adsorbent AUSC Conventional High risk
6D TDA Adsorbent AUSC Adv. Shockwave High risk
6E TDA Adsorbent AUSC Adv. Shockwave Low risk
Notes: • Fluor-based cases are consistent with NETL Bituminous Baseline Report (2010)
• TDA-based cases utilize enhanced performance and cost parameters

23
TDA Sorbent CO2 Capture Process
24
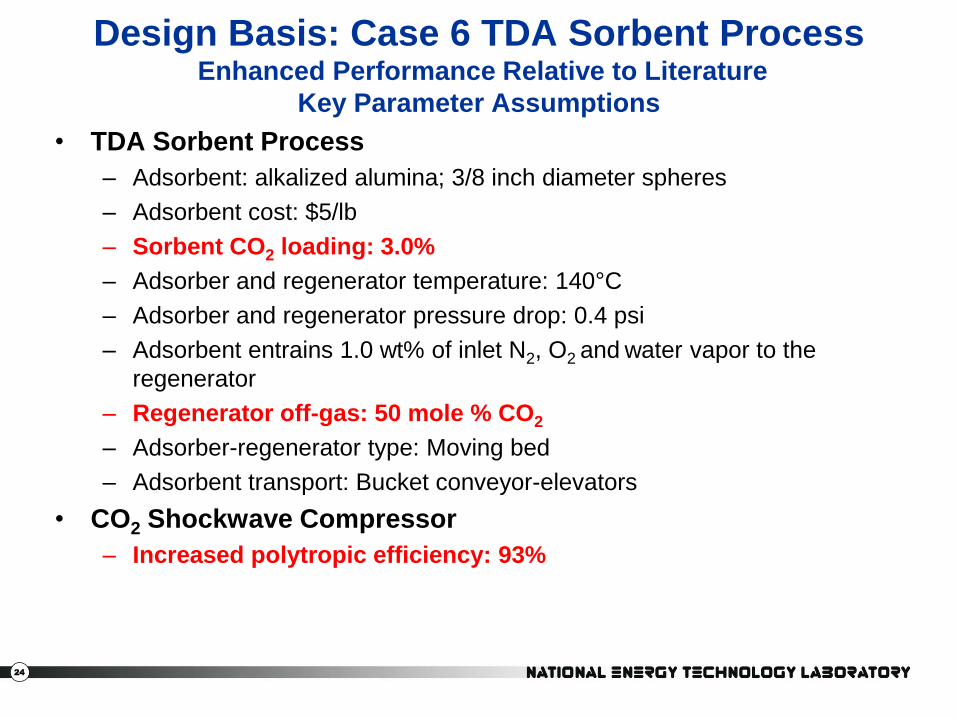
Design Basis: Case 6 TDA Sorbent Process Enhanced Performance Relative to Literature
Key Parameter Assumptions
• TDA Sorbent Process
– Adsorbent: alkalized alumina; 3/8 inch diameter spheres
– Adsorbent cost: $5/lb
– Sorbent CO2 loading: 3.0%
– Adsorber and regenerator temperature: 140°C
– Adsorber and regenerator pressure drop: 0.4 psi
– Adsorbent entrains 1.0 wt% of inlet N2, O2 and water vapor to the
regenerator
– Regenerator off-gas: 50 mole % CO2
– Adsorber-regenerator type: Moving bed
– Adsorbent transport: Bucket conveyor-elevators
• CO2 Shockwave Compressor
– Increased polytropic efficiency: 93%

25
Pathway Plant Efficiency – Sorbent pathway
39.342.5
28.429.8 30.4 31.5
32.934.4 34.7 34.7
0
5
10
15
20
25
30
35
40
45
50P
lan
t Eff
icie
ncy
(H
HV
), %
NOTES:
•Fluor-based cases are consistent with NETL Bituminous
Baseline Report (2010)
•All MTR- and TDA-based cases utilize enhanced
performance and cost parameters
26
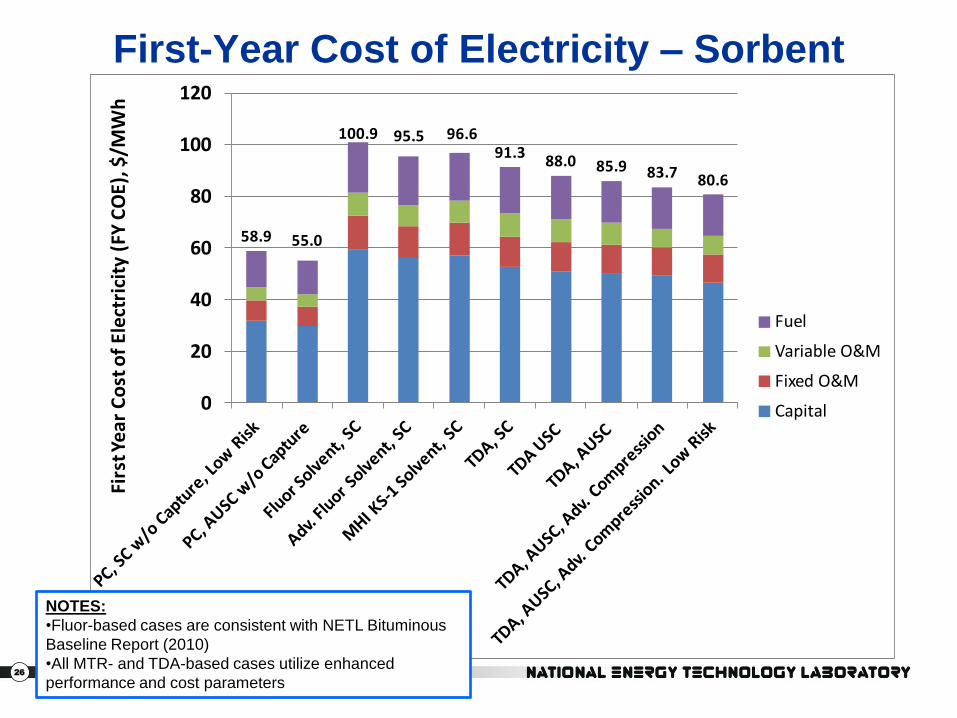
First-Year Cost of Electricity – Sorbent
58.9 55.0
100.9 95.5 96.691.3
88.0 85.9 83.7 80.6
0
20
40
60
80
100
120Fi
rst Y
ear
Co
st o
f El
ectr
icit
y (F
Y C
OE)
, $/M
Wh
Fuel
Variable O&M
Fixed O&M
Capital
NOTES:
•Fluor-based cases are consistent with NETL Bituminous
Baseline Report (2010)
•All MTR- and TDA-based cases utilize enhanced
performance and cost parameters

27
Conclusions
• The pathway study provides perspective on design and
operating parameters, capital cost and operating cost
that will be required to achieve the ≤ 35% increase in
COE for advanced post-combustion carbon capture,
CO2 compression, and advanced steam cycles.
• This work illustrates the challenge in meeting the DOE
COE target, suggesting that it will be difficult to achieve
with only a single technology but rather through the
combination of several technologies.
• Future work includes evaluating the effects of 2011$
and simulating a 2nd generation carbon capture
technology in a retrofit application.

28
Acknowledgements
Energy Sector Planning and Analysis (ESPA) contract:
• Dale Keairns – Booz Allen Hamilton, Inc.
• Richard Newby – Booz Allen Hamilton, Inc.
• Vasant Shah – Booz Allen Hamilton, Inc.
• Marc Turner – Booz Allen Hamilton, Inc.
• Mark Woods – Booz Allen Hamilton, Inc.
29
Further Information
http://www.netl.doe.gov/energy-analyses