cultures of consumption - consume.bbk.ac.uk · or ‘elite’ culture, and individuals in lower...
TRANSCRIPT
Cultures of Consumption
Working Paper Series
“Social Stratification and Cultural ConsumptionMusic in England”
Tak Wing Chan∗ and John H. Goldthorpe∗∗
∗ Department of Sociology, University of Oxford∗∗ Nuffield College, University of Oxford
Nothing in this paper may be cited, quoted or summarised or reproducedwithout permission of the author(s)
Cultures of Consumption, an ESRC-AHRC Research Programme
Birkbeck College, Malet Street, London, WC1E 7HXTel: +44 (0) 20 7079 0601Fax: +44 (0) 20 7079 0602www.consume.bbk.ac.ukDate: June 2005 Working Paper No.23

Social Stratification and Cultural
Consumption: Music in England∗
Tak Wing ChanDepartment of Sociology
University of Oxford
John H. GoldthorpeNuffield College
University of Oxford
June 16, 2005
Abstract
In this paper we use recent survey data to test three argumentson the relationship between social stratification and cultural con-sumption: i.e. what we label as the homology, individualisation andomnivore–univore arguments. We note various conceptual and method-ological problems in the ways these arguments have been advancedand stress in particular the importance of maintaining the Weberiandistinction between class and status. We concentrate on musical con-sumption and apply latent class models to identify types of musi-cal consumer. We then examine the social character of these typesthrough a regression analysis that includes a range of demographicand stratification variables. As would be anticipated from a Weberianstandpoint, type of musical consumption proves to be more closelyassociated with status, and also with education, than with class. In
∗We are grateful to Arts Council England, especially Adrienne Skelton and Ann Bridg-wood, for access to the detailed occupational codes of the Arts in England data set. Theviews expressed in this paper are entirely our own, and not necessarily those of ArtsCouncil England. For helpful comments and statistical advice, we thank Koen van Ei-jck, Duncan Gallie, Peter Hedstrom, Matthijs Kalmijn, Ruud Luijkx, Kenneth Macdonald,Kees van Rees, Yossi Shavit, Frank Trentmann, Jeroen Vermunt, and seminar audiences atBloomington, Cornell, Oxford, Tilburg, and the Spring 2004 meeting of the ISA ResearchCommittee 28 on Social Stratification and Mobility in Neuchatel. A substantial part ofthe analysis of this paper was carried out using the free software R. We are grateful to themany contributors to R for making their wonderful program available to us, and others,for free. Our research is supported by a ESRC/AHRC research grant under their Culturesof Consumption Research Programme Phase II, award number: RES–154–25–0006.
1

general, our results provide little support for the homology or individ-ualisation arguments. They are more consonant with the omnivore–univore argument, although a number of qualifications to this are alsosuggested.
1 Introduction—The three arguments
In the current sociological literature that treats the relationship betweensocial stratification and cultural taste and consumption, it is possible toidentify three main—and rival—lines of argument, each, though, with itsvariant forms. For convenience, we will refer to (i) the homology argument;(ii) the individualisation argument; and (iii) the omnivore–univore argument.In this paper, we begin by briefly outlining these three positions.1 We thennote some conceptual and methodological problems that arise, and indicatehow we would ourselves propose to deal with these problems. We go on toreport some first results from a research project in which we are engaged oncultural consumption in contemporary British society. While these resultsare limited to one particular cultural domain, that of music, this focus has,we believe, some strategic advantages in evaluating the current debate.
1.1 The homology argument
In its simplest form this argument claims no more than that social stratifica-tion and cultural stratification map on to each other very closely. Individualsin higher social strata are those who prefer and predominantly consume ‘high’or ‘elite’ culture, and individuals in lower social strata are those who preferand predominantly consume ‘popular’ or ‘mass’ culture—with, usually, var-ious intermediate situations also being recognised. However, more elaborateversions of the homology argument exist, notably that developed by PierreBourdieu in his book, Distinction, which, for reasons that will later becomeapparent, is of particular interest to us.
As best we can understand the essentials of Bourdieu’s position, they areas follows.2 On Bourdieu’s own account (1984, p.xii), Distinction starts outfrom ‘an endeavour to rethink Max Weber’s opposition between class andStand ’. Bourdieu agrees with Weber (1968, p.932) that status position—position within a generally recognised hierarchy of social superiority and
1We claim no originality in defining the current situation on these lines. See also, forexample, Warde et al. (2000) and Sintas and Alvarez (2002).
2We rely a good deal on the illuminating exposition of Bourdieu on ‘social class andsymbolic violence’ in Weininger (2005).
2
inferiority—is expressed by ‘above all else a specific style of life’. But hethen rejects Weber’s view of the class position of individuals or groups asbeing analytically and empirically separable from their status position inthat class position is determined purely by economic relations—i.e. relationsin labour markets and production units. For Bourdieu, class and status arenot to be understood as different forms of social stratification that can belinked, as Weber puts it, ‘in the most varied ways’. Rather, status has to beseen as the symbolic aspect or dimension of the class structure, which is notitself reducible to economic relations alone.
Thus, it is not possible for Bourdieu to accept that the relationship be-tween class and status—and thus lifestyle—is, at least to some degree, acontingent one. A necessary correspondence, or homology, has to be recog-nised. This homology is crucially mediated, Bourdieu claims, by the habitus
of different classes. That is, by the socially constituted ‘system of disposi-tions’ into which the members of a class are socialised and that arises out ofspecific ‘class conditions’. The class habitus produces a ‘semantic’ unity inpractices across all domains of consumption, cultural consumption included;and thus, within and integral to the class structure, there are created theinternally coherent but sharply contrasting lifestyles that are expressed bythe status order. In turn, then, rivalry and competition within this orderare not to be seen as separate from class divisions and conflict, let aloneas serving, perhaps, to inhibit class-based action (cf. Weber, 1968, p.930).To the contrary, the status order is the field of symbolic struggle betweenclasses, in which those involved seek to ‘classify’ themselves and others assame or different, included or excluded, and in which members of the domi-nant class use ‘symbolic violence’ in order to confirm the superiority of theirown lifestyle by arrogating to it those cultural forms that are generally recog-nised as ‘canonical’, ‘legitimate’, or otherwise ‘distinguished’. It is in fact inthis last respect, as Weininger (2005) has observed, that ‘the full signifi-cance of Bourdieu’s attempt to yoke together “class” and “status” becomesapparent’.3
3The one way in which, so far as we can see, Bourdieu might allow for the possibility ofa discrepancy between status and class—of the kind to which Weber frequently refers—iswhere, within what he deems to be the same class, Bourdieu acknowledges that differencesin the relative importance of cultural as opposed to economic capital lead to some ‘classfractions’ having lifestyles of greater ‘distinction’ than others. For example, within thedominant class academics and ‘artistic producers’ appear in this sense to be recognised ashaving superior status to industrial and commercial employers, with professionals fallingsomewhere in-between. If we are correct in this interpretation, it would, we believe,represent a much more substantial concession to the Weberian position than Bourdieu isready to acknowledge.
3

1.2 The individualisation argument
The individualisation argument may be regarded, if not as a more or lessdirect contradiction of the homology argument, then at all events as an at-tempt to restrict the validity of that argument to the past. What essentiallyis held is that, in the economically advanced societies of the present day,differences in cultural taste and consumption and indeed in lifestyles gener-ally are losing their grounding in social stratification, however this may beunderstood, and are becoming more a matter of individual ‘self-realisation’.
In weaker versions of the argument the suggestion is that other struc-tural bases, such as age, gender, ethnicity or sexuality, are now at least asimportant as class or status in conditioning lifestyles, and that individualsare in this way given a much greater range of choice as regards the collec-tivities, real or imagined, with which they will subjectively align themselvesand, in turn, greater possibilities for forming—or recreating—their own iden-tities (e.g. Giddens, 1991; Beck, 1992). However, in stronger versions, oftendeveloped under postmodernist influences, lifestyles are seen as now lack-ing any kind of structural grounding or indeed unifying logic. Through theirlifestyles, and primarily their patterns of consumption and demonstrations oftaste, individuals are increasingly able to ‘construct’ their own selves moreor less at will (e.g. Featherstone, 1987; Bauman, 1988). Here, then, thecontrast with Bourdieu’s position is striking. The emphasis shifts dramati-cally, as Warde (1997, p.8) has put it, ‘from habitus to freedom’. Instead ofbeing permanently marked by their initial class socialisation and restrictedto a limited set of predefined lifestyles, individuals not only can but have
to choose—to ‘pick-and-mix’—from the vast array of possibilities that thehighly commercialised ‘consumer societies’ of today make available to them:lifestyle becomes a ‘life project’.
1.3 The omnivore–univore argument
The first point to note about this argument is that it relates more specificallyto cultural consumption than to lifestyles in general. In its substance, it canperhaps be traced back to the findings of empirical research as early as thatof Wilensky (1964) who reported that in the US highly educated persons hadrarely any strong aversion to ‘mass’ culture and indeed often enjoyed it atleast in some forms. However, in its present-day terms the argument wouldappear to originate with Peterson and Simkus (1992). The broad hypothesisthat is advanced—and that is seen as having received support from empiricalresearch (e.g. Peterson and Simkus, 1992; Peterson and Kern, 1996)—is thatin modern societies the homology argument is outmoded, not because cul-
4

tural consumption has lost all grounding in social stratification, but becausea new relationship is emerging. Rather than cultural stratification mappingonto social stratification, on ‘elite-to-mass’ lines, the cultural consumptionof individuals in higher social strata differs from that of individuals in lowerstrata chiefly in that it is greater and much wider in its range—comprisingnot only more ‘high-brow’ culture but in fact more ‘middle-brow’ and more‘low-brow’ culture as well. Thus, the crucial contrast is not that of ‘snobversus slob’ but that of cultural omnivore versus cultural univore.
The omnivore–univore argument might then be seen as a ‘middle way’between the homology and individualisation arguments previously considered(cf. Warde et al., 2000). It is, however, open to at least two interpretationsthat endow it with clearly differing significance.
On the one hand, omnivores may be seen as essentially tolerant individ-uals (because, say, of their relatively high levels of education and/or socialmobility) who have a general openness to other cultural styles than that intowhich they were initially socialised and further, perhaps, a desire to exper-iment with different kinds of cultural consumption. In this case, there is afairly obvious affinity with the individualisation argument. Omnivore cul-tural consumption is concerned more with self-realisation then with settingdown status markers and creating social distinction (cf. the discussion of‘the new middle class’ in Wynne and O’Connor, 1998). On the other hand,though, omnivores may be seen as expressing a new aesthetic which, even ifmore inclusive and ‘cosmopolitan’ than that of earlier cultural elites, is noless directed towards the demonstration of cultural and social superiority—that is, when set against the very restricted cultural styles of univores (Sintasand Alvarez, 2002). And, in turn, omnivores may still show discrimination,either in the uses that they make of mass or popular culture—e.g. often‘ironic’ or otherwise condescending uses—or in still rejecting some of its par-ticular forms, such as ones with an especially close association with low statusgroups (cf. Bryson, 1996). In this case, then, the omnivore–univore argumentcould be regarded as taking over a good deal from the homology argument.The mapping of cultural onto social stratification is understood in a moresophisticated way but cultural consumption is still seen as playing a centralpart in creating symbolic boundaries and in status rivalry and competition.
1.4 Conceptual and methodological problems
The three broad positions outlined above have been widely debated and, to anincreasing extent, on the basis of empirical research. However, examinationof this research reveals certain recurrent problems of conceptualisation andmethod that call for more attention than they have so far received (though
5

see Warde et al., 2000). Here we focus for the most part on two problem-areas that relate to the ‘dependent’ and ‘independent’ variables that arecentral to our own empirical analyses: i.e. cultural consumption and socialstratification.
In most previous work, a distinction is in principle accepted betweencultural consumption and cultural taste or knowledge. However, in actualresearch practice the distinction seems often to be elided. Thus, respon-dents to surveys may be asked about their cultural tastes—i.e. their likesand dislikes—or perhaps ‘tested’ on their cultural knowledge; but then atsome point in the analysis based on this information, it becomes interpreted,if only implicitly, as if it were in fact information on actual consumptionwhich, clearly, it is not. For some purposes, a concern with cultural taste orknowledge, regardless of whether or not these are reflected in consumption,may indeed be appropriate; and it is true that cultural consumption maybe simply an expression of personal taste. But insofar as one is concernedwith the part played by cultural style in processes of social stratification, itis on consumption as a form of social action that attention must focus. Inthis perspective, for an individual to have actually been at the opera or haveMonteverdi or modern jazz playing on the stereo when the guests arrive ismore important than whether or not he or she likes opera, Monteverdi ormodern jazz or is knowledgeable about them. In our own work, therefore, itis on evidence of cultural consumption rather than taste that we concentrate.
Turning now to social stratification, we would observe that in this regardconceptualisation is often very loose and that indicators, such as occupation,education or income, are used with no very clear rationale. There are fewexamples where a range of well-defined stratification variables is constructedand then used in multivariate analyses;4 and in turn the possibly differingprocesses through which social ‘gradients’ in cultural consumption are actu-ally generated have remained largely unconsidered. For example, when otherstratification variables are controlled, an income gradient, if present, couldmore readily be taken as reflecting simply ability to pay, while a gradientby educational attainment would lend support to the idea that an individualpsychological factor—i.e. information processing capacity—is of importance,as suggested by various proponents of ‘empirical aesthetics’ (cf. Ganzeboom,1982; Berlyne, 1974; Moles, 1971).5 Furthermore, if cultural consumption
4These variables tend of course to be correlated with each other. But the correlationis seldom so high as to preclude their simultaneous inclusion a multivariate model so thattheir net effects can be assessed.
5The argument here is that the higher individuals’ information processing capacity, thegreater must be the information content of the cultural forms in which they participate ifthey are to derive satisfaction from them. Thus, the association between ‘high’ culture and
6

is to be related to the structure of inequality in society, the question arisesof how this structure should itself be envisaged. In this regard, we appreci-ate Bourdieu’s readiness to take seriously the distinction between class andstatus that was proposed by Weber, but we believe that his attempt to tran-scend this ‘opposition’ is not well considered. Especially in addressing issuesof cultural and social stratification, it is, in our view, analytically prefer-able to follow Weber and to see class and status as different forms of socialstratification, the connection between which is empirically variable, ratherthan to follow Bourdieu and to treat the status order as being the ‘symbolic’dimension of the class structure more or less by fiat. From a Weberian pointof view, one would in fact expect that cultural consumption, as an aspectof lifestyle, will be more strongly associated with status than with class—whatever the specific form the relationship may take; and, further, that in sofar as systematic discrepancies do exist between the positions of individualsand groups in the status order and in the class structure (the latter beingdefined by economic relations—i.e. relations within labour markets and pro-duction units), these discrepancies will then be reflected in differences inpatterns of cultural consumption within classes.6
There is, finally, one other methodological point of a quite different kindthat we need also to note. The individualisation and omnivore–univore argu-ments concern change over time. Both aim to replace the homology argumentwith an understanding of the relationship between cultural and social strati-fication that is seen as more appropriate to the present day. But in fact few ofthe empirical studies that have taken up these arguments have an over-timedimension (the main exception being Peterson and Kern, 1996). We are not,for the time being at least, in a position to improve matters in this regard.We can only keep in mind that our data and analyses do pertain to just onepoint in time, and hope that they may serve as baseline for further researchso that questions of change can be more adequately addressed.
2 Data and analytical strategy
Our data come from the Arts in England Survey carried out in England in2001 by the Social Survey Division of the UK Office for National Statistics
educational attainment is due to the facts (a) that ‘high’ culture has, on average, a higherlevel of information content than ‘low’ culture and (b) that education is crucially involvedin, and is thus a good proxy for, the information processing capacity of individuals.
6At an empirical level, we would thus wish to question whether Bourdieu’s notion ofclass habitus as the source of a close correspondence between ‘class conditions’, on theone hand, and lifestyle, including cultural consumption, on the other, is in fact capable ofbeing seriously upheld. See further below.
7

on behalf of Arts Council England. Face-to-face interviews were carried outwith a stratified probability sample of individuals aged over 16 and livingin private households. Interviews were completed with 6,042 respondents,giving a response rate of 64 per cent (for details, see Skelton et al., 2002).
The inquiry was concerned with assessing attendance at cultural eventsand participation in cultural activities, very broadly understood. In lateranalyses we shall aim to exploit this unusually wide coverage. In the presentpaper, however, we concentrate on just one cultural domain: that of music.This, we believe, represents an appropriate starting point. Music has oftenbeen seen as having special significance in regard to the social stratificationof cultural style. Bourdieu (1984, p.18), for example, claims that ‘nothingmore clearly affirms one’s “class”, nothing more infallibly classifies, thantastes in music’. And analyses of musical taste and consumption have in factfigured prominently in current debates (see e.g. Bryson, 1996, 1997; van Eijck,2001; Coulangeon, 2003) in part because research in this area (Peterson andSimkus, 1992) was closely associated with the development of the omnivore–univore argument.
In the Arts in England Survey questions were directly asked about fre-quency of attendance at musical events as well as of listening to music throughvarious media. In many other data-sets that have been used in analyses ofmusical consumption information is available on listening only, without anydistinction being possible as to whether listening was ‘live’ or not. This is,however, a distinction that from our standpoint is important and that weseek fully to exploit.
As regards musical events, respondents were asked whether in the lasttwelve months they had attended: a classical music concert, an opera oroperetta, a jazz concert, or a pop or rock concert. We take as our dependentvariables whether (or not) attendance was reported at each of these kindsof event.7 As regards listening to music, respondents were asked whetherin the last four weeks they had listened, through any medium (radio, TV,CDs, records, tapes etc.), to the same four genres of music. Again, we takeas our dependent variables whether (or not) any listening was reported to
7The survey also contains information on attendance at (i) musicals, (ii) folk or countryand western concerts, or (iii) other music events. These items are not used for the followingreasons. Attendance at musicals will be considered in a later analysis of theatre-going. Wehave repeated the analysis of the present paper with this item included, and the resultsare substantively the same as those reported below. Details are available from the authorson request. Attendance at folk or country and western concerts is not used because thiswas reported by only 3 per cent of respondents, and preliminary analysis suggested thatthis item was not discriminatory between the latent classes of musical consumption thatwe distinguish. Finally, attendance at ‘other’ music event is discounted as too imprecisein character to be relevant to our concerns.
8

each of these kinds of music, whatever the medium. On this basis, then, wehave in total eight different types of musical consumption that respondentsmight or might not have engaged in over a specific time-period: live andmedia consumption of the four genres of classical music, opera or operetta,jazz and pop or rock. These genres are not as refined as we would ideallyhave wished. However, it should be recognised that in collecting informationon actual musical consumption, rather than expressions of taste, the detailedspecification of genres is less easily accomplished, at least in a reliable way.
Apart from its emphasis on consumption, the Arts in England Survey isalso well suited to our purposes in that it obtained information on a widerange of respondents’ socio-demographic characteristics. Respondents werecoded to the National Statistics (NS) Socio-Economic Classification, whichis in effect a new instantiation of the Goldthorpe class schema (Rose andPevalin, 2003); and from the detailed occupational codings that are alsoavailable, we are able to allocate respondents to the 31 categories of the so-cial status scale developed by Chan and Goldthorpe (2004).8 In addition,information is available on respondents’ income and educational qualifica-tions (coded to the six official National Vocational Qualifications levels), andfurther on a range of attributes that are of potential interest to us as controlvariables, including age, marital status, family composition and region of res-idence (see Table 6 below). We have restricted our analysis to respondentsaged 20 to 64 (N = 4, 249) since preliminary analyses pointed clearly tothe desirability of undertaking separate analyses of the cultural participationof both younger and older groups. After deleting cases with missing valueson the key covariates of income, education and social status the analyticalsample size becomes 3,819.
3 Results
We begin by showing in Table 1 the overall proportions of respondents to theArts in England Survey who engaged in the eight types of musical consump-tion that we identified above. It can be seen that, as might be expected, ratesof live consumption were lower than rates of media consumption, even overa twelve-month as compared with a four-week period. Further, there is somewide variation across genres. Most obviously, opera and operetta (henceforth‘opera’) and jazz attract far fewer live consumers (henceforth ‘attenders’) andmedia consumers (‘listeners’) than does pop or rock (‘pop/rock’).
8This scale is based on an analysis of the occupational structure of close friendships(cf. Laumann, 1966). For further details of the construction and properties of this scale,see Appendix A.
9

Table 1: Percentage of respondentswho have attended live music events inthe past 12 months, or have listened tomusic via media in the past 4 weeks.
live mediaa
opera/operetta 5.7 16.3jazz 6.3 24.7classical 10.2 51.9pop/rock 23.2 88.5
Note: a includes radio, CD, mini disc, tape, record, television, DVD or video.
3.1 Latent class measurement models
In order to move on from data in the form of Table 1 to gain an understand-ing of patterns of musical consumption among respondents, we turn to latentclass analysis. The binary responses to the eight questions on musical con-sumption represented in Table 1 can be understood as forming an eight-waycontingency table with 256 (i.e. 28) cells. What we wish to know is whether,underlying these data, there are certain relatively well-defined types of musi-cal consumer. Latent class analysis, which can be regarded as the categoricalcounterpart of factor analysis for continuous variables, is therefore an appro-priate technique to apply. Latent class models seek to capture the associationthat exists among the observed indicators of some phenomenon—in our case,the eight indicators of musical consumption—through a small number of dis-crete latent classes. In effect, this association is regarded as resulting from amixture of ‘pure’ types within the population studied, so that if these typescan be identified and separated as latent classes, then conditional on member-
ship of these classes, the indicators will become statistically independent ofeach other. This principle of ‘local independence’ is key to all latent variableanalyses, including latent class models (McCutcheon, 1987).9 However, weshould note that in the present paper, we do, pragmatically, depart from it
9Thus, if there are three observed categorical variables A, B, C with I, J and K
categories respectively, a latent class model with T classes can be expressed as follows:
πABCijk =
T∑
t=1
πXt πAX
it πBXjt πCX
kt ,
where πXt is the probability that a person belongs to latent class t, πAX
it is the probabilitythat this person is found at level i of A given membership in latent class t, and so on.
10

in one respect. We allow for specific local dependence between live and medi-ated consumption of music of the same genre. Substantively, it is reasonableto expect there to be some residual association even within latent classesbetween attending live opera, classical music, jazz or pop performances andlistening to these same genres through various media. And, empirically, theinclusion of these four local dependencies improves quite dramatically the fitof all latent class models that we apply.
As can be seen from Table 2, the results of our latent class modelling,with the modification indicated above, are in fact fairly straightforward. Amodel postulating three latent classes fits the data satisfactorily accordingto the usual criterion of five per cent type I error.10
Table 2: Latent class measurement modelsfitted to musical consumption data.
# classes G2 df p BIC
1 1583.63 243 0.00 -420.572 387.55 234 0.00 -1542.423 222.96 225 0.52 -1632.78
Note: Four local dependence terms are included to account for residual association
between indicators of live and mediated consumption of music of the same genre.
The solutions of the three-class and also of the simpler two-class modelof Table 2, i.e. the estimated relative size of the latent classes and the es-timated conditional probability of consuming each of the eight items, givenmembership in a latent class, are reported in Table 3. A comparison ofthese two models suggests that the main difference between them is that thesmaller latent class under model 2 needs to be further differentiated into twosub-classes. On the basis of these results, we can then already make somerelevant commentary on the three arguments that we previously outlined,even before we consider the social covariates of latent class membership.
Most obviously, perhaps, the very fact that we are able to identify threelatent classes, each representing a relatively well-defined type of musical con-sumer, must throw doubt on the individualisation argument, at least in itsextreme, postmodernist versions: i.e. those that would claim the break-up ofall pattern or coherence in consumption itself as well as in its linkages with
10Without the four parameters of local dependence, we need to postulate six latentclasses before a satisfactory fit can be achieved. Details are available from the authors onrequest.
11

Table 3: Estimated relative size of the latent classes andthe conditional probabilities of consuming each of the ninemusic items under the two-class and three-class models.
2-class model 3-class model1 2 1 2 3
relative size 0.689 0.311 0.657 0.240 0.103opera (l) 0.010 0.162 0.013 0.039 0.386jazz (l) 0.024 0.150 0.027 0.075 0.273classical (l) 0.017 0.291 0.024 0.060 0.701pop/rock (l) 0.225 0.249 0.225 0.234 0.277
opera (m) 0.016 0.488 0.011 0.418 0.541jazz (m) 0.125 0.517 0.112 0.509 0.499classical (m) 0.313 0.973 0.289 0.952 0.977pop/rock (m) 0.903 0.845 0.899 0.905 0.749
Note: (l): attending live concerts, (m): listening to music through media.
social stratification. We are evidently far removed from any such situation.11
Turning next to the homology argument, it might be suggested that mem-bers of our latent class 1 under model 3 are very plausible exemplars of pop-ular or ‘mass’ consumption in the musical domain. They account for abouttwo thirds of all respondents and are very likely to listen to pop music viathe media (p = .90) but otherwise have relatively low levels of musical con-sumption. However, if we can thus rather readily identify a potential ‘mass’,there is little evidence to be found in Table 3 for the existence of a musical‘elite’, at least in the sense of a group who, while actively expressing ‘high’musical taste, at the same time reject more popular musical forms. Mem-bers of our latent class 3, the smallest of the three (10.3%), have overall thehighest probability of attending operas, jazz and classical concerts but alsoof attending pop concerts. And while they again have high probabilities oflistening to opera, jazz and classical music through the media, their proba-bility of listening to pop is likewise high in absolute terms (p = .75) and notvery much lower than that of the members of the two other latent classes.12
11As we have noted in the text, the binary responses to the eight questions on musicalconsumption with which we work can be regarded as forming an eight-way contingencytable. If our respondents were to have been distributed randomly over the cells of thistable, then we would have been able to do no more than identify just one latent class—towhich everyone belonged. In other words, model 1 of Table 2 would have sufficed.
12If musical elites are defined as those who would consume opera, classical music andjazz, either live or through any media, while at the same time not consuming pop at all,then only 36 respondents, or 0.85% of our sample, fall into this category. And even taking
12

This being so, it might be said that our results so far chiefly favour theomnivore–univore argument, although still in this case some qualificationsare also suggested. On the one hand, while musical consumption in latentclass 1 is clearly more restricted than in the other two classes, it is not entirelyunivorous. There is some non-negligible probability (p = .29) of listening toclassical music in addition to popular forms, which can perhaps be under-stood as a ‘crossover’ or a ‘Classic FM’ effect, and would merit further inves-tigation. And, on the other hand, while members of latent class 3 do have anobvious claim to be regarded as musical omnivores, latent class 2, which islarger than latent class 3, also shows omnivorous tendencies so far as listen-ing to music rather than attending musical events is concerned—suggesting,that is, a need to distinguish various degrees and kinds of omnivore.
None the less, with these qualifications being kept in mind, it would seemreasonable, and not unduly misleading, if we were to provisionally label ourlatent classes according to the univore–omnivore argument, on the followinglines: latent class 1 as univores (Us), latent class 2 as omnivores–listeners(OLs), and latent class 3 as true omnivores (Os).
3.2 Incorporating covariates into the analysis
We now move on to the question of the social characteristics of members ofour latent classes and in particular to that of how they may differ in theirlocation within the stratification of contemporary English society. In techni-cal terms, therefore, we introduce covariates into our latent class analysis oftypes of musical consumer.
We adopt the following strategy. First, we calculate, on the basis ofour preferred latent class solution (cf. Table 3), the conditional probabilityof respondents’ membership in each of our three latent classes, given theirresponses to the eight indicators.13 Thus, all respondents with a particularresponse pattern are assigned to the same latent class—that to which theyhave the highest, or modal, conditional probability of belonging. With our
a more inclusive definition of the musical elite by leaving jazz out of account, still only2.8% of the sample would be covered. A colleague thoughtfully suggested that our failureto identify a musical elite is perhaps because we have used a very broad definition of music-listening. He suggested that musical elites might casually listen to pop music on the radio,but they would never put on a record or a CD of pop music. We have repeated our latentclass analysis with a narrower definition of media consumption of music, counting CD,mini disc, tape or record only, and the results obtained are very similar to those reportedhere, except that two further local dependence terms are needed to account for weakerassociations between jazz and pop. Details are available from the authors on request.
13Thus, suppose there are three observed categorical variables A, B and C, the condi-tional probability that someone belongs to latent class t given that this person is at level
13
respondents then distributed among the three latent classes, we can go onto investigate the association between latent class membership and othervariables of interest, whether through simple tabulation or through morepowerful regression models, such as the multinomial logit. This procedure hashad several effective sociological applications—in, for example, the analysisof intergenerational exchanges (Hogan et al., 1993) or, specifically in the fieldof cultural consumption, in a study of patterns of ‘high-brow’ and ‘low-brow’reading (van Rees et al., 1999).
Assigning individuals to modal latent classes inevitably introduces errorinto the data, no matter how high the modal probabilities might be, andthe relative sizes of the latent classes after modal assignment can differ quitesignificantly from those estimated from the measurement model. However, inour present case, this is not a serious problem. Modal class assignment mis-classifies 14 per cent of the respondents which is a quite modest level.14 Sincemeasurement errors tend to attenuate the association between variables, thestatistical association reported below can be regarded as conservative esti-
mates.15
i of A, level j of B and level k of C is given by the following expression:
πABCXijkt =
πXt πAX
it πBXjt πCX
kt∑Tt=1
πXt πAX
it πBXjt πCX
kt
.
14Post-assignment, the relative sizes of the latent classes are 0.704, 0.191, and 0.104respectively, compared with 0.657, 0.240 and 0.103 in the measurement model (cf. Table 3).The percentage of cases misclassified is calculated as: 100 ×
∑j [(1 − πj) ·
nj
N], where nj
is the number of respondents giving response pattern j, πj is the estimated modal latentclass probability given response pattern j, and N is the total sample size. Note thatthe percentage of cases misclassified by latent class models is different from the indexof dissimilarity (∆) that is commonly used in loglinear analysis. While ∆ measures thediscrepancy between the fitted and observed frequencies of a contingency table, in latentclass models there is, by definition, no observed value of latent class membership. Thus,in latent class analysis the percentage of cases misclassified should be understood in termsof measurement error. In the extreme, to have zero per cent of cases misclassified wouldmean that univores will always do X but never Y or Z . . . and omnivores will always doX, Y, Z, . . . This is clearly unrealistic, as various random factors, such as a spell of illhealth, might intervene and prevent even the truest omnivore to go to any music event fora specific period. Furthermore, although the model which assumes just one latent classrarely, if ever, fits the data, it also, by definition, never misclassifies any case throughthe modal latent class assignment procedure. Thus, the percentage of cases misclassifiedshould not be used as a criterion of model selection.
15An alternative and more sophisticated way to incorporate covariates has been pro-posed. In this case, the latent class measurement model is combined directly with aregression model (Yamaguchi, 2000; Bandeen-Roche et al., 1997; Dayton and Macready,1988; Formann, 1992), and in this way the probabilistic nature of the former is preserved.
14

3.3 The distribution of types of musical consumer by
social class and social status
As earlier noted, we start from the position that in investigating the relation-ship between cultural consumption and social stratification, it is importantconceptually to maintain the Weberian distinction between social class andsocial status; and in turn we have the empirical expectation that cultural con-sumption, as an aspect of lifestyle, will be the more closely associated withstatus than with class. It is then of interest to examine, before undertak-ing more elaborate multivariate analyses, how the types of musical consumerthat we have identified are actually distributed by class and status.
In Table 4 we show results by class, following the seven-class versionof the new NS schema. It can be seen that within Classes 1 and 2, form-ing the salariat of primarily professional and managerial employees, thereis the smallest representation of univores, our most limited type of musicalconsumer, and the largest representation of omnivore–listeners and true om-nivores. The reverse is then generally the case within Classes 5, 6 and 7,making up the working class of lower supervisory and manual wage-earners,while within Classes 3 and 4, those of routine nonmanual workers and of smallemployers and self-employed workers respectively, an intermediate situationobtains, though there are more Us and fewer OLs and Os in class 3 thanin class 4. However, it should further be noted from Table 4 that univoresare the most frequently, and omnivores the least frequently occurring typewithin each class alike.
Table 4: Distribution of latent class membership within social class.
social class U OL O
1. higher managerial & professional occupations 52.3 27.1 20.72. lower managerial & professional occupations 62.5 21.9 15.63. intermediate occupations 74.9 16.9 8.24. small employers and own-account workers 68.0 20.7 11.35. lower supervisory & technical occupations 78.3 17.8 3.96. semi-routine occupations 82.1 13.2 4.77. routine occupations 81.0 15.6 3.3
Table 5 then reports the corresponding distribution by status—i.e. by
This approach accepts in effect that we can never know for certain that an individualbelongs to one latent class rather than another, and is in this regard preferable. However,our experience is that the measurement part of the model could become unstable oncemore than a quite limited number of covariates are added. Details are available from theauthors on request.
15

the 31 categories of the status scale of Chan and Goldthorpe (2004), andFigure 1 presents essentially the same information in graphical form, withmembership in each of our three latent classes being plotted against statusscore (though note the differing scales on the vertical axes). We also adda non-parametric regression line to each plot (Cleveland, 1979). Figure 1shows that the probability of being a univore is negatively related to statusin a fairly linear fashion while the probability of being a true musical omni-vore is positively related, with the slope being somewhat steeper at the highend of the status hierarchy. The probability of being a omnivore–listeneralso seems positively related to status, even though the wider dispersion ofpoints around the regression line indicates that in these cases the associationis weaker than with true omnivores. From Table 5 it can further be seenthat within four of the seven highest ranking groups, Higher professionals,Specialist managers, Teachers and other professionals in education and Scien-tists, engineers and technologists, omnivores and omnivore–listeners togetherachieve approximately equal representation with univores—i.e. are stronglyover-represented in relation to their numbers in our total sample.
Thus, status effects on type of musical consumption would, on this basis,appear somewhat clearer than class effects. However, to provide a serious testof our claim that in so far as the extent of the social stratification of musicalor other forms of cultural consumption is in question, it is on status ratherthan class that attention should focus, we need to move on to multivariateanalyses.
3.4 The social characteristics of types of musical con-
sumer: Multivariate analysis
Descriptive statistics of the covariates that are included in our multivariateanalyses are given in Table 6. These covariates are of two main kinds. First,there are ones of a broadly demographic kind that we introduce primarily ascontrols. It could be expected that musical consumption will be influencedby demographic factors, operating essentially as constraints. For example,women with young children living in the far North might be thought less likelyat least to participate in musical events than single men living in London.For our present purposes, we wish to abstract from effects of this kind on thechances of individuals being found in one or another of our latent classes.Secondly, there are covariates relating to social stratification on which ourattention focuses, and it is these that serve as our explanatory variables ofinterest. Here, in addition to the measures of class and status to whichwe have already referred, we include measures of individuals’ income and
16

Table 5: Distribution of latent class membership within status categories.status
Status categoriesa score U OL O N
HP Higher professionals 0.5643 52.3 18.8 28.9 128APB Associate professionals in business 0.5337 59.6 21.1 19.3 171SM Specialist managers 0.5107 53.3 27.5 19.2 182TPE Teachers and other professionals in ed-
ucation0.5017 46.1 24.0 29.9 167
GMA General managers and administrators 0.4114 57.9 26.3 15.8 76API Associate professionals in industry 0.3116 61.8 25.5 12.7 110SET Scientists, engineers and technologists 0.3115 51.5 30.9 17.7 136FRC Filing and record clerks 0.2559 69.6 19.6 10.7 56OMO Managers and officials, nec g 0.2355 77.8 11.1 11.1 9AOA Administrative officers and assistants 0.2274 64.3 21.4 14.3 98NCC Numerical clerks and cashiers 0.2238 80.5 14.2 5.3 169APH Associate professionals in health and
welfare0.2228 67.1 17.1 15.8 152
SEC Secretaries and receptionists 0.1539 70.1 19.1 10.8 157OCW Other clerical workers 0.1443 72.6 23.2 4.2 95BSR Buyers and sales representatives 0.1193 69.0 20.7 10.3 58CCW Childcare workers 0.1097 76.4 16.9 6.7 89MPS Managers and proprietors in services -0.0453 62.9 23.5 13.5 170PDM Plant, depot and site managers -0.0625 64.0 25.6 10.5 86SW Sales workers -0.1151 82.1 14.1 3.8 262HW Health workers -0.2121 78.7 14.6 6.7 164PSW Personal service workers -0.2261 69.6 17.4 13.0 92PSP Protective service personnel -0.2288 75.9 17.7 6.3 79RWS Routine workers in services -0.2974 87.5 11.1 1.4 208CW Catering workers -0.3261 70.6 22.1 7.4 68SDC Store and despatch clerks -0.3353 76.0 24.0 0.0 25SMO Skilled and related manual workers nec -0.4072 72.5 20.3 7.3 138TO Transport operatives -0.4114 71.6 25.7 2.8 109SMC Skilled and related manual workers in
construction and maintenance-0.5014 80.2 16.4 3.5 116
SMM Skilled and related manual workers inmetal trades
-0.5121 76.0 21.5 2.5 121
PMO Plant and machine operatives -0.5589 87.9 10.1 1.9 207GL General labourers -0.5979 88.4 8.3 3.3 121overall 70.4 19.1 10.4 3819
Note: a For examples of occupations within each category and other details, see Table 9
in the Appendix.
17

−0.6 −0.4 −0.2 0.0 0.2 0.4 0.6
5060
7080
90
U
status
perc
enta
ge
−0.6 −0.4 −0.2 0.0 0.2 0.4 0.6
1015
2025
30
OL
status
perc
enta
ge
−0.6 −0.4 −0.2 0.0 0.2 0.4 0.6
05
1015
2025
30
O
status
perc
enta
ge
Figure 1: Membership in latent classesby social status.
18

educational qualifications so that the separate effects of all these variablescab be assessed. We use a multinomial logit model with membership inour three latent classes as the dependent variable, and take univores as ourreference category. Results are reported in Table 7.16
It can be seen, to begin with, that the demographic variables that weinclude in the model have significant effects in a rather patchy and sometimesin only a marginal fashion. Women are clearly less likely than men to be OLsrather than Us, but are more likely to be Os rather than OLs: i.e. the OLshave a rather masculine bias. Younger people are clearly more likely thanolder people to be Us rather than OLs or Os and, among the omnivores, olderpeople are more likely to be Os rather than OLs. Married people appear lesslikely, as compared with singles, to be OLs rather than Us, and the presenceof older children appears to reduce the chances of individuals being Os orOLs rather than Us. Finally, region has an effect in that living in the Northor Midlands rather than in London reduces the chances of being an OL or Orather than a U.17
Turning next to our main concern with the social stratification of musicalconsumption, one result is immediately apparent from Table 7. We canconfirm our hypothesis that status is in this regard of greater importancethan is class. In the context of our multivariate model the effects of class arenon-significant, while status has a significant effect in the contrasts betweenO and U and between O and OL. In other words, the higher an individual’sstatus, the more likely he or she is to be a true omnivore rather than aunivore, and a true omnivore rather than a omnivore–listener.18 It might beargued, especially by those who favour a one-dimensional understanding ofsocial stratification and reject the utility of the class/status distinction, thatall that is being shown here is that our measure of status better captures thisone dimension than does our measure of class. However, we can report that inother work we are undertaking we obtain results that would undermine this
16The multinomial logit model, fitted with R (R Development Core Team, 2005), canbe represented as follows:
log(Pk
PU
) = x′β, k = OL,O
where PU is the probability of being a univore, Pk is the probability of belonging tothe latent class k, x is a vector of covariates, and β is the vector of parameters to beestimated. We also report in Table 7 a column showing results with OL serving as thereference category. This is just a different parameterisation of the same model.
17The size of the town in which one lives might have greater sociological relevance thanregion. Unfortunately, there is no such measure in the data set.
18In analyses not reported here, we have included quadratic terms for status and andalso age in the model. But these terms turn out to be insignificant. Details are availablefrom the authors on request.
19

Table 6: Descriptive statistics of covariates.
N %
femalea 2110 55.3
Single (reference category) 700 18.3Married or cohabiting 2473 64.8Separated, divorced or widowed 646 16.9
children 0–4b 651 17.1children 5–10b 779 20.4children 11–15b 623 16.3
London (reference category) 493 12.9The North 1141 29.9Midlands and East Anglia 1150 30.1South East 617 16.2South West 418 11.0
no qualifications (reference category) 865 22.7CSE, etc. 508 13.3O-levels 889 23.3A-levels 518 13.6post-secondary qualifications 347 9.1degree 692 18.1
Class 1—higher managerial & professional occupations (ref.cat.) 488 12.8Class 2—lower managerial & professional occupations 1023 26.8Class 3—intermediate occupations 574 15.0Class 4—small employers and own-account workers 275 7.2Class 5—lower supervisory & technical occupations 359 9.4Class 6—semi-routine occupations 620 16.2Class 7—routine occupations 480 12.6
mean s.d. min. max.age 42.1 11.8 20 64annual incomec 15573 10863 260 37700status -0.001 0.365 -0.598 0.564
Note:a Male is reference category.b Not having children in the respective age ranges are the reference categories.c The income variable in the Arts in England data set is originally coded in terms of 32
income brackets of variable width. In our analysis, we have assigned respondents to the
midpoint of the income bracket to which they belong.
20
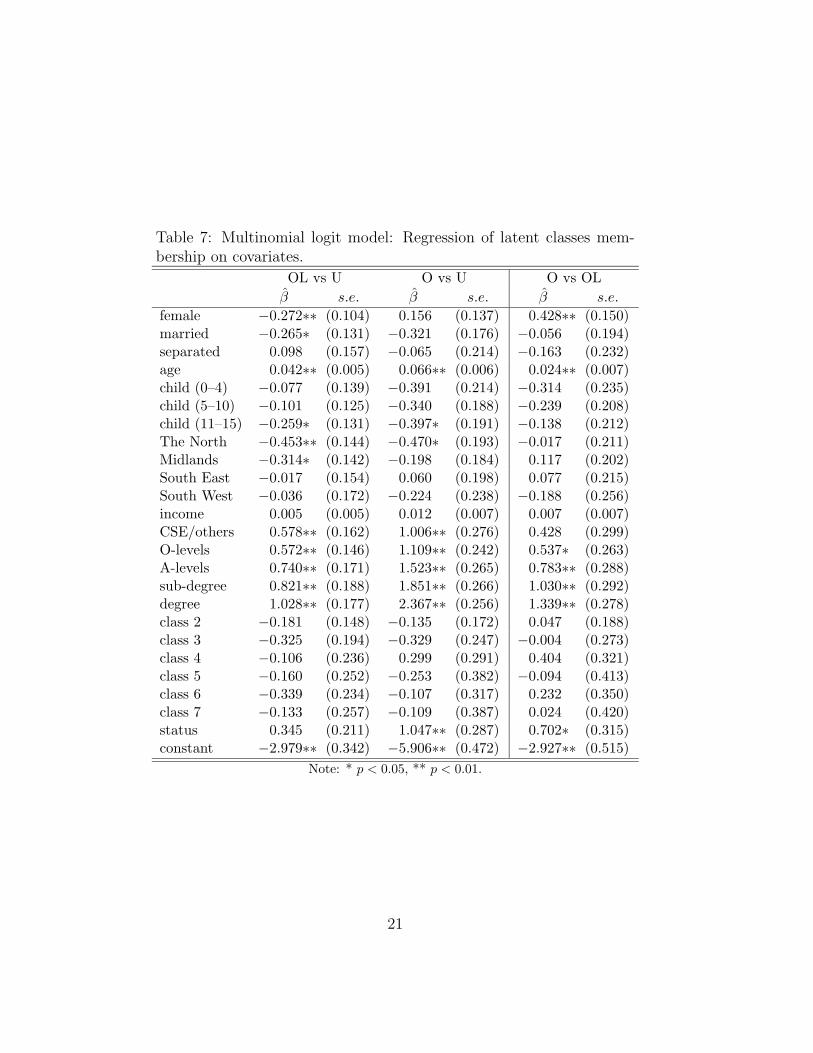
Table 7: Multinomial logit model: Regression of latent classes mem-bership on covariates.
OL vs U O vs U O vs OL
β s.e. β s.e. β s.e.
female −0.272∗∗ (0.104) 0.156 (0.137) 0.428∗∗ (0.150)married −0.265∗ (0.131) −0.321 (0.176) −0.056 (0.194)separated 0.098 (0.157) −0.065 (0.214) −0.163 (0.232)age 0.042∗∗ (0.005) 0.066∗∗ (0.006) 0.024∗∗ (0.007)child (0–4) −0.077 (0.139) −0.391 (0.214) −0.314 (0.235)child (5–10) −0.101 (0.125) −0.340 (0.188) −0.239 (0.208)child (11–15) −0.259∗ (0.131) −0.397∗ (0.191) −0.138 (0.212)The North −0.453∗∗ (0.144) −0.470∗ (0.193) −0.017 (0.211)Midlands −0.314∗ (0.142) −0.198 (0.184) 0.117 (0.202)South East −0.017 (0.154) 0.060 (0.198) 0.077 (0.215)South West −0.036 (0.172) −0.224 (0.238) −0.188 (0.256)income 0.005 (0.005) 0.012 (0.007) 0.007 (0.007)CSE/others 0.578∗∗ (0.162) 1.006∗∗ (0.276) 0.428 (0.299)O-levels 0.572∗∗ (0.146) 1.109∗∗ (0.242) 0.537∗ (0.263)A-levels 0.740∗∗ (0.171) 1.523∗∗ (0.265) 0.783∗∗ (0.288)sub-degree 0.821∗∗ (0.188) 1.851∗∗ (0.266) 1.030∗∗ (0.292)degree 1.028∗∗ (0.177) 2.367∗∗ (0.256) 1.339∗∗ (0.278)class 2 −0.181 (0.148) −0.135 (0.172) 0.047 (0.188)class 3 −0.325 (0.194) −0.329 (0.247) −0.004 (0.273)class 4 −0.106 (0.236) 0.299 (0.291) 0.404 (0.321)class 5 −0.160 (0.252) −0.253 (0.382) −0.094 (0.413)class 6 −0.339 (0.234) −0.107 (0.317) 0.232 (0.350)class 7 −0.133 (0.257) −0.109 (0.387) 0.024 (0.420)status 0.345 (0.211) 1.047∗∗ (0.287) 0.702∗ (0.315)constant −2.979∗∗ (0.342) −5.906∗∗ (0.472) −2.927∗∗ (0.515)
Note: * p < 0.05, ** p < 0.01.
21

view and are in fact much as would be expected from a Weberian standpoint.For example, in analyses of party choice in the 1997 and 2001 UK GeneralElections we find, using the same measures as in the present paper, that classhas a clearly stronger influence than does status. And a similar finding wouldalso appear to be emerging from analyses of economic life-chances, such asrisks of long term unemployment.19
As regards the other stratification variables included, the effect of incometurns out to be non-significant. In contrast, the effects of educational qualifi-cations are obviously important, and follow a pattern broadly similar to thoseof status. The higher an individual’s educational level, the more likely he orshe is to be an an O or OL rather than a U, and more likely to be an O thanan OL. However, the important question then arises of whether, once statusand other stratification variables are controlled, the effects of education per
se are in fact best understood in terms of stratification. We would ourselvestake the view that they are more plausibly seen as operating through individ-ual psychology according to the information-processing hypothesis to whichwe have previously referred: i.e. the hypothesis that the higher an individ-ual’s information-processing capacity (as indexed in our case by educationalattainment), the more complex must be the informational stimuli of any formof cultural participation in which he or she engages if pleasure and fulfilmentare to derive from it (see note 5).
Finally in this section we turn to the issue of the substantive strengths ofthe effects of status and educational attainment, the two variables that showup as clearly most important in regard to musical consumption. To this end,we report in Table 8 some predicted probabilities from our multinomial logitmodel of the latent class membership of a hypothetical person—we take a40-year old childless woman living in London—whose education and statuswe vary at three income levels.20
The effects of educational qualifications are described in Panel A of Ta-ble 8. The pattern that generally emerges is most clearly brought out inthe central lines of the panel (lines 3–5) where we hold income constant at�25,000 and status constant at the level of Managers and proprietors in ser-
19It might further be argued that because we use six parameters to capture the effectof class but only one parameter to represent status, the latter is much more likely thanthe former to be found statistically significant. In this way, we might be privileging theWeberian position that we favour. We have repeated our analysis with a fivefold versionof the class schema and with a fourfold division of the status hierarchy (see Chan andGoldthorpe, 2004). Essentially the same results are obtained as those reported in thetext except that the effect of status does now become significant in the contrast betweenomnivore-listeners and univores. Details are available from the authors on request.
20These probabilities are estimated under a model that is very similar to the one reportedin Table 7, but with the insignificant terms of class and marital status being dropped.
22
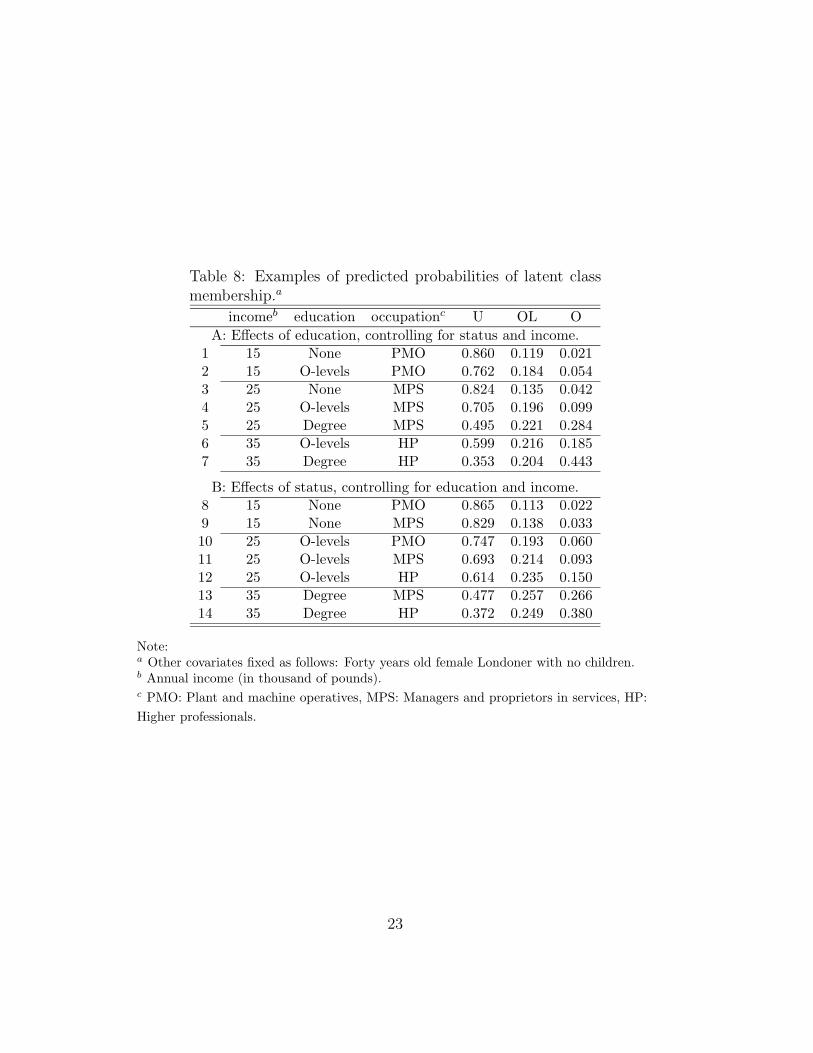
Table 8: Examples of predicted probabilities of latent classmembership.a
incomeb education occupationc U OL O
A: Effects of education, controlling for status and income.1 15 None PMO 0.860 0.119 0.0212 15 O-levels PMO 0.762 0.184 0.0543 25 None MPS 0.824 0.135 0.0424 25 O-levels MPS 0.705 0.196 0.0995 25 Degree MPS 0.495 0.221 0.2846 35 O-levels HP 0.599 0.216 0.1857 35 Degree HP 0.353 0.204 0.443
B: Effects of status, controlling for education and income.8 15 None PMO 0.865 0.113 0.0229 15 None MPS 0.829 0.138 0.03310 25 O-levels PMO 0.747 0.193 0.06011 25 O-levels MPS 0.693 0.214 0.09312 25 O-levels HP 0.614 0.235 0.15013 35 Degree MPS 0.477 0.257 0.26614 35 Degree HP 0.372 0.249 0.380
Note:a Other covariates fixed as follows: Forty years old female Londoner with no children.b Annual income (in thousand of pounds).c PMO: Plant and machine operatives, MPS: Managers and proprietors in services, HP:
Higher professionals.
23

vices. It can be seen that the probability of our hypothetical woman being aunivore is then very sensitive to the level of her educational qualifications—declining by about 33 percentage points as between ‘none’ and ‘degree’; and,further, that most of the compensating change relates to her chances of be-ing a true omnivore. A range of results on this pattern is shown graphicallyin the plots of Figure 2 in which the strength of the effects of education isindicated by the vertical distance between the lines. This distance is greatestin the plots for membership in U and O, and in the latter case, especially atthe high end of the status order.
The effects of status are illustrated in Panel B of Table 8. To beginwith, it is apparent that in all scenarios the chances of our hypotheticalwoman being a univore decline with the status we attribute to her—in factby about 13 percentage points across virtually the full status range (lines 10–12) when we suppose that she has an annual income of
�25,000 and O-level
qualifications. Again, the larger compensating change is in the probabilitiesof our hypothetical woman being a true omnivore. This effect is also revealedin Figure 2), especially by the slopes of the lines for those with a universitydegree.
In sum, one could then say, education appears to have a somewhatstronger effect than status on which type of musical consumer an individualis likely to be, but some, positive, interaction between these two variablesseems also to occur.21
4 Conclusion
We have already noted some of the immediate implications of our latent classanalysis for the three arguments on social stratification and cultural taste andconsumption from which we started. We now consider what further can besaid in the light of our examination of the social characteristics of our threetypes of musical consumer.
As regards the homology argument, we previously observed that this ap-pears to be undermined by the fact that although we can identify a potential‘mass’ of musical consumers, that is, our univores, our latent class analy-sis does not reveal a musical ‘elite’ who clearly reject more popular musicalforms. Our subsequent analyses then show that, as the homology argumentwould require, our univores do indeed predominate at the lower levels of thestratification of contemporary English society, in whatever way this may beconceptualised. Thus, as can be seen from Tables 4 and 5, univores constitute
21There are no interaction terms in our multinomial logit model but, while the model islinear in the logit, it is not linear in probability.
24

5 10 15 20
0.3
0.4
0.5
0.6
0.7
0.8
0.9
U
status
prob
abili
ty
NoneO−LDegree
5 10 15 20
0.0
0.1
0.2
0.3
0.4
0.5
0.6
OL
status
prob
abili
ty
NoneO−LDegree
5 10 15 20
0.0
0.1
0.2
0.3
0.4
0.5
0.6
O
status
prob
abili
ty
NoneO−LDegree
Figure 2: Association between latentclass membership, education and socialstatus.
Note: Other covariates fixed as follows: Forty years old female Londoner, with annual
income of �25,000 and no children.
25

a substantial majority—around 80 per cent—of the broadly defined workingclass (NS Classes 5, 6 and 7) and likewise of the categories in the lower halfof our status scale. However, what has then further to be recognised is thatunivores are by no means minoritarian at higher levels of stratification. Infact, they make up a majority of the professional and managerial salariat (NSClasses 1 and 2) and of five of the seven highest-ranking categories in thestatus scale. In other words, the homology argument breaks down not onlyin that we fail to find a musical elite that confines its consumption to ‘higher’musical forms, but further in that these forms appear to have little appealfor many in higher class and status positions, who in fact follow the mostfrequent pattern in the population at large in restricting their consumptionlargely to popular music.
These same findings would also appear highly damaging to Bourdieu’selaboration of the homology argument. Since we cannot identify a musi-cal elite, then neither a fortiori can we identify anything recognisable asBourdieu’s ‘dominant class’ that seeks both to define and appropriate highculture—and even when we focus on music, Bourdieu’s ‘infallible classifier’.22
Moreover, the results we report sustain the view we previously expressedthat there is little to be said for Bourdieu’s attempt to go beyond Weberand to ‘yoke together’ class and status: i.e. by treating status and associatedlifestyles as the symbolic aspect of the class structure and as reflecting thedistinctive forms of habitus created by different ‘class conditions’. Chan andGoldthorpe (2004) have shown that in contemporary British society the classstructure and the status order, at least as they would wish to conceptualisethem, do not map all that closely onto each other. And in this paper, we showthat, when class and status are entered into the analysis together, class turnsout to have rather little connection with musical consumption while the sig-nificance of status persists. Thus, in so far as we can identify musical elites atall, not in the sense of the homology argument but rather as omnivores whoconsume higher musical forms along with more popular ones, status—andeducation—do far more to account for membership in these groupings thandoes class. At the same time, though, it should be apparent from what has
22A dominant class of the kind Bourdieu describes would surely be large enough, if itexisted, to be picked up in our latent class analysis—i.e. would amount to at least a fewpercent of the total population. An attempt to ‘save’ the homology argument in someform could perhaps be made by postulating a musical or more general cultural elite that ismuch smaller than this and in fact too small to figure in any survey-based analysis. But itwould need to be explained how the argument then applied to the rest—i.e. virtually thewhole—of the population. It is, of course, possible that Bourdieu’s views were more aptto France, or at least to Paris, in the 1960s when in fact the empirical research on whichhe relies was carried out. Unfortunately, the data collected do not appear to be availablefor reanalysis.
26

already been said that the effects of status on type of musical consumption,while highly significant, are not overwhelmingly strong. And thus the idea ofsuch consumption being more or less compulsively determined by the habitus
of the individual’s status group—or class—would appear, at all events in thecase we have considered, to be quite inappropriate.23
As regards the individualisation argument, we have already remarked thatthe outcome of our latent class analysis—i.e. the very fact that we can iden-tify a limited number of fairly well defined types of musical consumer—atonce raises serious doubts, at least if the argument goes so far as to imply thatall patterns of consumption, cultural and otherwise, are tending to dissolveinto an infinity of individual styles. And, further to this, we can now say onthe basis of our regression analysis that the probabilities of individuals ap-proximating one rather than another type of musical consumption are indeedassociated in fairly clear, even if not always straightforwardly ‘homologous’,ways with their position in the status order and with educational attainment.On the one hand, the probability of being a univore declines steadily as levelof status and also of education increase. On the other hand, the probabilityof being a omnivore–listener and especially that of being a true omnivore arepositively related to status and education.
Although, then, musical consumption will no doubt in some degree re-flect purely individual taste and possibly, too, conscious lifestyle choice, therecan be no question that it does still remain in various ways socially strati-fied.24 Whether this stratification is less or more marked than at some earlierperiod, we are unable to say. But, so far as the present is concerned, ourfindings would indicate that for analysts of cultural consumption simply tochange their emphasis ‘from habitus to freedom’ is in fact to move from oneempirically untenable extreme to the other.
Finally, as regards the omnivore–univore argument, we earlier suggestedthat it is this that would appear most consonant with the results of our latentclass analysis—sufficiently so, at least, to justify labelling our three types ofmusical consumer in omnivore–univore terms. To this we can now add thatresults from our regression analysis are also broadly in line with omnivore–
23In fact, much the same conclusion has recently been reached in a study of musicaltastes in contemporary France of a generally far higher technical quality than that ofBourdieu: ‘Si l’analyse sur les donnees francaises confirme la robustnesse du lien entre lescaracteristiques sociales et l’orientation des preferences musicales des individus, celui-ciapparaıt sensiblement moins consistent que ne le suggere la theorie de l’habitus’ (Coulan-geon, 2003, pp.28–9).
24To link the individualisation argument with that of the decay or ‘death’ of class, assome authors have done, would then seem rather beside the point: status is the formof stratification that the argument needs chiefly to address to make good the claim thatlifestyles have broken free of all structural grounding.
27

univore expectations. As described above, omnivores tend to be of higherstatus and also to have higher levels of education than univores. At the sametime, though, certain qualifications to the omnivore–univore argument thatwe previously put forward are also underlined. In particular, the importanceof the distinction between omnivore–listeners and true omnivores is borneout in that this distinction, too, is found to have a grounding in differencesin status and education.
We further noted that the omnivore–univore argument, while apparentlyrepresenting a ‘middle way’ between the homology and individualisation ar-guments, can in differing versions have more affinity with the one or theother: that is, depending on whether omnivorousness is taken to express anew aesthetic—perhaps less inclusive than it may at first appear—that isitself exploited in status competition or simply an attempt at self-realisationthat is little constrained by conventional ideas of cultural levels. We wouldnot at this stage, before having extended our analyses to other cultural do-mains than that of music, wish to take up any very strong position on whichslant has most to commend it.25 But, so far as our present findings go, theyincline us to favour the ‘self-realisation’ rather than the ‘status competition’view. Our data are not sufficiently detailed to allow us to say whether ourmusical omnivores do in fact ‘draw a line’ at certain kinds of popular music,but we do find (see Table 3) that omnivorousness can be qualified by anapparent dislike of kinds of music, such as opera or jazz, that do not havelow status associations.
More generally, in fact, we would believe that a rather radical rethinkingis now be required of the nature of status relations in modern societies, andlikewise of the part played by differences in cultural consumption in theserelations. We would ally ourselves with proponents of the omnivore–univoreargument who claim that, whatever validity the ideas of symbolic ‘struggle’and ‘violence’, as advanced by Bourdieu and his followers, may have had forthe earlier history of modern societies, they appear out of place the contem-porary world. However, new ideas are then needed. Chan and Goldthorpe(2004) have shown, in the case of present-day Britain, that although a statusorder can still be discerned, it would appear to be less sharply demarcatedthan previously; and there is other evidence to indicate that status differencesare now less openly asserted from above or deferentially acknowledged from
25As we earlier remarked, the omnivore–univore argument has in general been developedlargely on the basis of studies of musical taste and consumption, and the musical domainmay in fact be one that is especially favourable to it because of the wide variety of genresthat it comprises and the differing uses to which they may be put. It is far from clear thatthe argument will fare as well in application to other cultural domains such as, say, thatof the visual arts.
28

below. In turn, therefore, it could also be that the connection between statusand cultural consumption is itself tending to weaken, and even on omnivore-univore lines, although, to repeat, data adequate to test this possibility arenot yet available. At all events, it may have to be recognised that whileboth collective attempts at the hierarchical differentiation of lifestyles andindividual striving for ranking within the hierarchies thus formed may stillbe pervasive, status enhancement may now be pursued through less directand overt means than previously, and may even, perhaps, no longer implyan essentially ‘zero-sum’ game in which exclusion is always as important asacceptance or in which, in Gore Vidal’s memorable phrase, ‘it is not enoughto succeed; others must fail’.
29

A The social status scale
Following the approach pioneered by Laumann (1966; 1973), the enquiry ofChan and Goldthorpe (2004) starts from the occupational structure of closefriendship. The main idea is as follows: if occupations are among the mostsalient social positions to which status attaches and if close friendship can betaken to imply relations of social equality, then by analysing the propensityfor friendships to be formed as between members of different occupationalcategories—through, say, the use of multidimensional scaling techniques—astructure of presumed social inequality may be inferred.
In the light of their findings, Chan and Goldthorpe (2004) argue thata status order can still be identified in British society, despite an evidentdecline in displays of deference and in the readiness of individuals openly toassert their social superiority. The status order that they propose is set outin Table 9 in the form of a ranking of 31 occupational categories according totheir status scores as derived from the first dimension of a multidimensionalscaling exercise.
Table 9: The 31 occupational categories ranked in descendingorder of status score, and representative occupations withineach category.
rank title code representative occupationsa
1 Higher professionals HP chartered accountants, clergy,medical practitioners, solicitors
2 Associate profssionals inbusiness
APB journalists, investment analysts,insurance brokers, designers
3 Specialist managers SM company treasurers, financial man-agers, computer systems managers,personnel managers
4 Teachers and other profes-sionals in education
TPE college lecturers, education officersand inspectors, school teachers
5 General managers and ad-ministrators
GMA bank and building society man-agers, general managers in indus-try, national and local governmentofficers
6 Associate professionals inindustry and business
API computer analysts and program-mers, quantity surveyors, voca-tional and industrial trainers
30

7 Scientists, engineers andtechnologists
SET civil and structural engineers,clinical biochemists, industrialchemists, planning engineers,software engineers
8 Filing and record clerks FRC conveyancing clerks, computerclerks, library assistants
9 Managers and officials, nec OMO security managers, cleaning man-agers
10 Administrative officers andassistants
AOA clerical officers in national and lo-cal government
11 Numerical clerks andcashiers
NCC accounts assistants, bank clerks
12 Associate professionals inhealth and welfare
APH community workers, nurses, occu-pational therapists, youth workers
13 Secretaries and reception-ists
SEC personal assistants, receptionists,secretaries, word processor opera-tors
14 Other clerical workers OCW general assistants, commerical andclerical assistants
15 Buyers and sales represen-tatives
BSR buyers and purchasing officers,technical sales representatives,wholesale representatives
16 Childcare workers CCW educational assistants, nurserynurses
17 Managers and proprietorsin services
MPS catering managers, hoteliers, pub-licans, shopkeepers and managers
18 Plant, depot and site man-agers
PDM clerks of works, farm managers,maintenance managers, transportmanagers, works managers
19 Sales workers SW cash desk and check-out operators,sales and shop assistants, windowdressers
20 Health workers HW ambulance staff, dental nurses,nursing auxiliaries
21 Personal service workers PSW caretakers and housekeepers, hair-dressers and beauticians, travel at-tendants, undertakers
31

22 Protective service person-nel
PSP fire service and police officers, se-curity guards
23 Routine workers in services RWS car park attendants, cleaners,counter-hands, couriers and mes-sengers, hotel porters, postal work-ers
24 Catering workers CW bar staff, chefs, cooks, waiters andwaitresses
25 Store and despatch clerks SDC despatch and production controlclerks, storekeepers
26 Skilled and related manualworkers n.e.c.
SMO gardeners and groundsmen, print-ers, textile workers, woodworkers
27 Transport operatives TO bus and coach drivers, lorry andvan drivers, taxi drivers
28 Skilled and related manualworkers in construction andmaintenance
SMC bricklayers, electricians, paintersand decorators, plasterers, roofers,telephone repairmen
29 Skilled and related manualworkers in metal trades
SMM fitters, setters, setter-operators,sheet metal workers, turners,welders
30 Plant and machine opera-tives
PMO assemblers, canners, fillers andpackers, food processors, mouldersand extruders, routine inspectorsand testers
31 General labourers GL agricultural workers, factorylabourers, goods porters, refusecollectors
a That is, occupations that account for relatively large numbers of individualswithin each category and at the same time give some idea of its range.
Four features of this status order are noteworthy. First, this order re-veals clear continuities with that depicted for the later nineteenth and earliertwentieth centuries in historical and earlier sociological research. Most im-portantly, status appears to be still rather systematically associated with thedegree of ‘manuality’ of work. Thus, non-manual occupations generally rankhigher than manual occupations and, within the non-manual range, profes-sional occupations rank higher than managerial occupations. Indeed, somemanagerial occupations—those which operate in personal service or man-ual milieux—such as Managers and proprietors in services (MPS) or Plant,
32

depot and site managers (PDM), are found at the bottom end of the non-manual range, ranking, in fact, below many routine clerical and secretarialoccupations.
This ranking of occupations is consistent with those reported in previousresearch (e.g. Laumann, 1966; Coxon and Jones, 1978; Stewart et al., 1980).However, in one crucial respect, the result of Chan and Goldthorpe (2004)is different: the second dimension and, to some degree, the third dimensionof their multidimensional scaling exercise are also interpretable. Specifically,the second dimension is highly correlated with the degree of occupational sexsegregation (r = −0.92), while the third dimension refers to various occupa-tional situses. To the extent that these two dimensions capture the effectsof workplace environments on the opportunities for friendship formation,the first dimension, having thus ‘purified’ of such influence, should reflectfriendship choice as influenced by social status (Chan and Goldthorpe, 2004,pp.387–389 and note 16).
The second point to note is that although this status order correlatessensibly with both income and education, the correlations are only rathermodest. A case in point is that Plant, depot and site managers (PDM), de-spite their relatively low ranking in the status order, have considerably higherincome than many occupations which rank above them (see Table 10). Sim-ilarly, further down the status order, Skilled and related manual workers inconstruction and those in metal trades (SMC and SMM) rank below Salesworkers (SW), Health workers (HW), Personal service workers (PSW), Rou-tine workers in services (RWS) and Catering workers (CW). But Table 10again reveals that these skilled manual workers have, in fact, higher incomeand educational attainment than the various types of service workers men-tioned above. Moreover, when the estimated status score is regressed onboth income and education, the coefficient of income is actually negative insign and marginally non-significant (Chan and Goldthorpe, 2004, p.392 andTable 3). The upshot is that status, in an essentially Weberian sense asinvolving relations of social superiority, equality and inferiority, appears tobe distinct, empirically as well as conceptually, from ‘socio-economic’ statusas represented by scales that in some way synthesise information on incomeand education (e.g. Duncan, 1961; Ganzeboom and Treiman, 1996).
Thirdly, although there is a clear status gradient across social classes, thespread of status within class is often quite considerable and there is a gooddeal of overlap in status between classes. Thus, in contemporary Britishsociety the mapping of status onto classes is not uniformly close. Statusstratification within class is especially extensive for Class 2 (lower managerialand professional occupations), Class 4 (small employers and own-accountworkers), Class 5 (Lower supervisory and technical occupations) and Class 7
33

Table 10: Some descriptive statistics of the 31 occupational cate-gories in desending status ranking.
median % with median % withrank income A-levels rank income A-levels
HP 1 21054 93.3 MPS 17 11129 55.7APB 2 16256 82.7 PDM 18 20240 62.2SM 3 24018 81.1 SW 19 5977 39.5TPE 4 20880 99.2 HW 20 7962 39.1GMA 5 21010 74.9 PSW 21 7541 44.8API 6 18416 86.6 PSP 22 17805 59.0SET 7 22603 93.9 RWS 23 5898 25.5FRC 8 12113 65.8 CW 24 6681 41.1OMO 9 20073 79.8 SDC 25 11115 38.6AOA 10 12597 55.9 SMO 26 10600 36.5NCC 11 11173 50.3 TO 27 12850 37.2APH 12 13888 86.4 SMC 28 14115 52.6SEC 13 8821 46.0 SMM 29 15999 57.7OCW 14 10338 57.3 PMO 30 11651 32.5BSR 15 16835 70.5 GL 31 10010 31.7CCW 16 6793 58.1
(routine occupations) (see Chan and Goldthorpe, 2004, Figures: 6 and 7).Finally, it should be noted that Chan and Goldthorpe (2004) have re-
peated their analysis in many different ways. For example, they have tried aclassification scheme that is based on 25, rather than 31, occupational cat-egories. They have used Goodman’s RC(M) models instead of multidimen-sional scaling. They have also undertaken their analyses for men and womenseparately, as well as together. In all these sensitivity tests, the results ob-tained are remarkably similar (see Chan and Goldthorpe, 2004, Figure 3 andnotes 8 and 10 esp.).
References
Bandeen-Roche, K., Miglioretti, D. L., Zeger, S. L., and Rathouz, P. J.(1997). Latent variable regression for multiple discrete outcomes. Journal
of the American Statistical Association, 92(440), 1375–1386.
Bauman, Z. (1988). Freedom. Open University Press, Milton Keynes.
Beck, U. (1992). Risk Society: Towards a New Modernity. Sage, London.
34
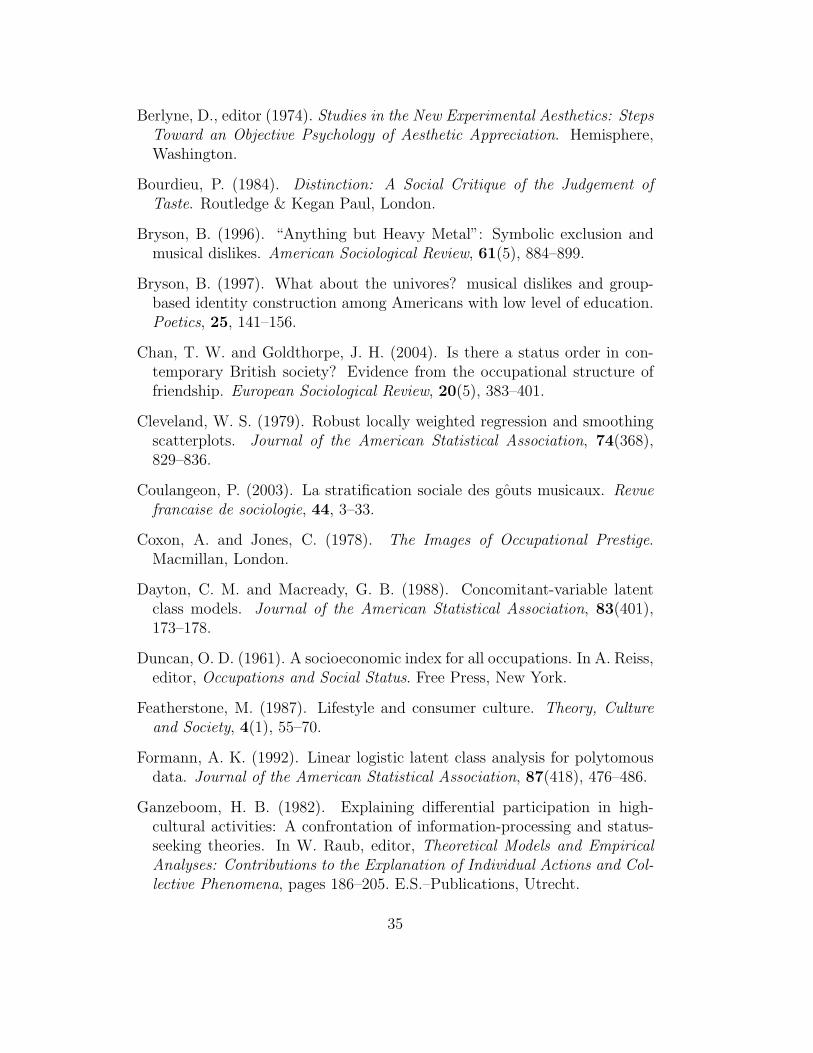
Berlyne, D., editor (1974). Studies in the New Experimental Aesthetics: Steps
Toward an Objective Psychology of Aesthetic Appreciation. Hemisphere,Washington.
Bourdieu, P. (1984). Distinction: A Social Critique of the Judgement of
Taste. Routledge & Kegan Paul, London.
Bryson, B. (1996). “Anything but Heavy Metal”: Symbolic exclusion andmusical dislikes. American Sociological Review, 61(5), 884–899.
Bryson, B. (1997). What about the univores? musical dislikes and group-based identity construction among Americans with low level of education.Poetics, 25, 141–156.
Chan, T. W. and Goldthorpe, J. H. (2004). Is there a status order in con-temporary British society? Evidence from the occupational structure offriendship. European Sociological Review, 20(5), 383–401.
Cleveland, W. S. (1979). Robust locally weighted regression and smoothingscatterplots. Journal of the American Statistical Association, 74(368),829–836.
Coulangeon, P. (2003). La stratification sociale des gouts musicaux. Revue
francaise de sociologie, 44, 3–33.
Coxon, A. and Jones, C. (1978). The Images of Occupational Prestige.Macmillan, London.
Dayton, C. M. and Macready, G. B. (1988). Concomitant-variable latentclass models. Journal of the American Statistical Association, 83(401),173–178.
Duncan, O. D. (1961). A socioeconomic index for all occupations. In A. Reiss,editor, Occupations and Social Status. Free Press, New York.
Featherstone, M. (1987). Lifestyle and consumer culture. Theory, Culture
and Society, 4(1), 55–70.
Formann, A. K. (1992). Linear logistic latent class analysis for polytomousdata. Journal of the American Statistical Association, 87(418), 476–486.
Ganzeboom, H. B. (1982). Explaining differential participation in high-cultural activities: A confrontation of information-processing and status-seeking theories. In W. Raub, editor, Theoretical Models and Empirical
Analyses: Contributions to the Explanation of Individual Actions and Col-
lective Phenomena, pages 186–205. E.S.–Publications, Utrecht.
35

Ganzeboom, H. B. and Treiman, D. J. (1996). Internationally comparablemeasures of occupational status for the 1988 International Standard Clas-sification of Occupations. Social Science Research, 25, 201–239.
Giddens, A. (1991). Modernity and Self-identity: Self and Society in the Late
Modern Age. Polity, Cambridge.
Hogan, D. P., Eggebeen, D. J., and Clogg, C. C. (1993). The structure ofintergenerational exchanges in American families. American Journal of
Sociology, 98(6), 1428–1458.
Laumann, E. O. (1966). Prestige and Association in an Urban Community.Bobbs-Merrill, Indianapolis.
Laumann, E. O. (1973). Bonds of Pluralism. Wiley, New York.
McCutcheon, A. L. (1987). Latent Class Analysis, volume 64 of Quantitative
Applications in the Social Sciences. Sage, Newbury Park, London.
Moles, A. A. (1971). Sociodynamique de la culture. Mouton, Paris.
Peterson, R. A. and Kern, R. M. (1996). Changing highbrow taste: Fromsnob to omnivore. American Sociological Review, 61(5), 900–907.
Peterson, R. A. and Simkus, A. (1992). How musical tastes mark occupa-tional status groups. In M. Lamont and M. Fournier, editors, Cultivating
Differences: Symbolic Boundaries and the Making of Inequality, chapterSeven, pages 152–186. University of Chicago Press, Chicago.
R Development Core Team (2005). R: A language and environment for
statistical computing. R Foundation for Statistical Computing, Vienna,Austria. ISBN 3-900051-07-0.
Rose, D. and Pevalin, D. J., editors (2003). A Researcher’s Guide to the
National Statistics Socio-economic Classification. Sage, London.
Sintas, J. L. and Alvarez, E. G. (2002). Omnivores show up again: Thesegmentation of cultural consumers in Spanish social space. European
Sociological Review, 18(3), 353–368.
Skelton, A., Bridgwood, A., Duckworth, K., Hutton, L., Fenn, C., Creaser,C., and Babbidge, A. (2002). Arts in England: Attendance, participationand attitudes in 2001. Research report 27, The Arts Council of England,London.
36

Stewart, A., Prandy, K., and Blackburn, R. M. (1980). Social Structure and
Occupations. Macmillan, London.
van Eijck, K. (2001). Social differentiation in musical taste patterns. Social
Forces, 79(3), 1163–1184.
van Rees, K., Vermunt, J., and Verboord, M. (1999). Cultural classificationsunder discussion: Latent class analysis of highbrow and lowbrow reading.Poetics, 26, 349–365.
Warde, A. (1997). Consumption, Food and Taste. Sage, London.
Warde, A., Tomlinson, M., and McMeekin, A. (2000). Expanding tastes?cultural omnivorousness and cultural change in the uk. The University ofManchaster CRIC Discussion Paper No.37.
Weber, M. (1922/1968). Economy and Society. University of California Press,Berkeley and Los Angeles.
Weininger, E. B. (2005). Pierre Bourdieu on social class and symbolic vio-lence. In E. O. Wright, editor, Approaches to Class Analysis, chapter 4,pages 116–165. Cambridge University Press, Cambridge.
Wilensky, H. L. (1964). Mass society and mass culture: Interdependence orindependence? American Sociological Review, 29(2), 173–197.
Wynne, D. and O’Connor, J. (1998). Consumption and the postmodern city.Urban Studies, 35, 841–864.
Yamaguchi, K. (2000). Multinomial logit latent-class regression models: Ananalysis of the predictors of gender-role attitudes among Japanese women.American Journal of Sociology, 105(6), 1702–1740.
37