culture shocks and consequences - williams collegeweb.williams.edu/economics/artsecon/slides.pdf ·...
TRANSCRIPT

PRESENTATION: INTRODUCTION MODEL METHODOLOGY DATA ANALYSIS CONCLUSIONS
Culture Shocks and Consequences:the connection between the arts and urban economic growth
Stephen SheppardWilliams College
Arts, New Growth Theory, and Economic Development Symposium
The Brookings Institution, Washington, DC
May 10, 2012
Paper and slides available at http://www.c-3-d.org/paper.pdf and http://www.c-3-d.org/slides.pdf
PRESENTATION: INTRODUCTION MODEL METHODOLOGY DATA ANALYSIS CONCLUSIONS
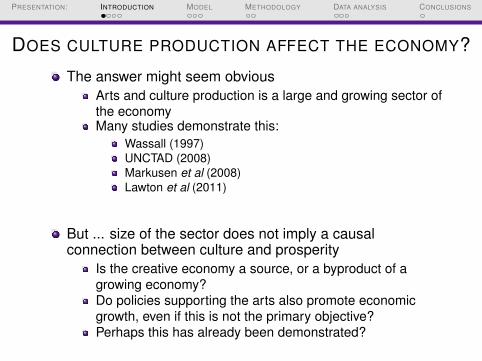
DOES CULTURE PRODUCTION AFFECT THE ECONOMY?
The answer might seem obviousArts and culture production is a large and growing sector ofthe economyMany studies demonstrate this:
Wassall (1997)UNCTAD (2008)Markusen et al (2008)Lawton et al (2011)
But ... size of the sector does not imply a causalconnection between culture and prosperity
Is the creative economy a source, or a byproduct of agrowing economy?Do policies supporting the arts also promote economicgrowth, even if this is not the primary objective?Perhaps this has already been demonstrated?
PRESENTATION: INTRODUCTION MODEL METHODOLOGY DATA ANALYSIS CONCLUSIONS
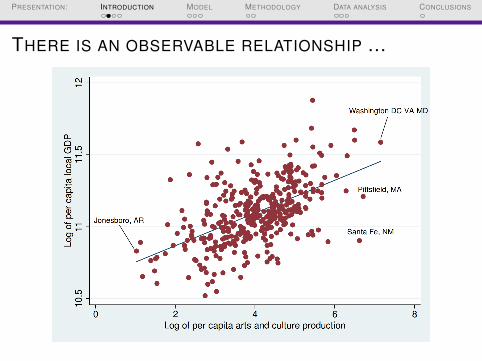
THERE IS AN OBSERVABLE RELATIONSHIP ...
PRESENTATION: INTRODUCTION MODEL METHODOLOGY DATA ANALYSIS CONCLUSIONS
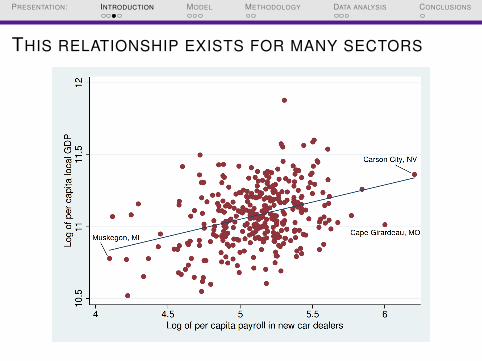
THIS RELATIONSHIP EXISTS FOR MANY SECTORS
PRESENTATION: INTRODUCTION MODEL METHODOLOGY DATA ANALYSIS CONCLUSIONS
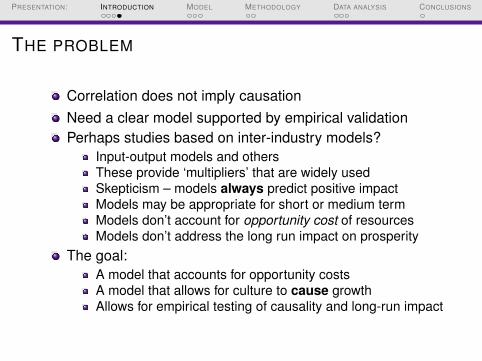
THE PROBLEM
Correlation does not imply causationNeed a clear model supported by empirical validationPerhaps studies based on inter-industry models?
Input-output models and othersThese provide ‘multipliers’ that are widely usedSkepticism – models always predict positive impactModels may be appropriate for short or medium termModels don’t account for opportunity cost of resourcesModels don’t address the long run impact on prosperity
The goal:A model that accounts for opportunity costsA model that allows for culture to cause growthAllows for empirical testing of causality and long-run impact
PRESENTATION: INTRODUCTION MODEL METHODOLOGY DATA ANALYSIS CONCLUSIONS
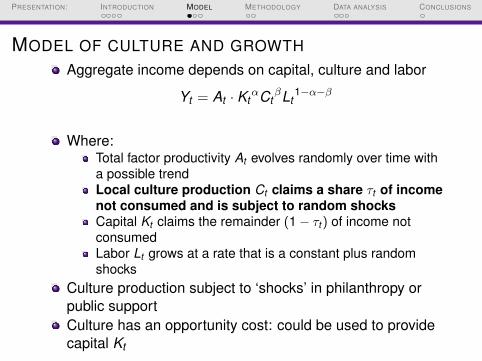
MODEL OF CULTURE AND GROWTHAggregate income depends on capital, culture and labor
Yt = At · KtαCt
βLt1−α−β
Where:Total factor productivity At evolves randomly over time witha possible trendLocal culture production Ct claims a share τt of incomenot consumed and is subject to random shocksCapital Kt claims the remainder (1− τt ) of income notconsumedLabor Lt grows at a rate that is a constant plus randomshocks
Culture production subject to ‘shocks’ in philanthropy orpublic supportCulture has an opportunity cost: could be used to providecapital Kt

PRESENTATION: INTRODUCTION MODEL METHODOLOGY DATA ANALYSIS CONCLUSIONS
CULTURE SHOCKS
The central question: do positive shocks to cultureproduction generate changes to steady-state income?We express the model in per capita terms:(
YL
)t+1
= At+1 ·sα+β(1−τt )α τt
β ·(
YL
)t
α+β·(
LtLt+1
)α+β
This implies that per capita income depends on:Total factor productivityShares of income devoted to culture and capitalLagged per capita incomeLabor growth
PRESENTATION: INTRODUCTION MODEL METHODOLOGY DATA ANALYSIS CONCLUSIONS
CONSEQUENCES OF CULTURE SHOCKS
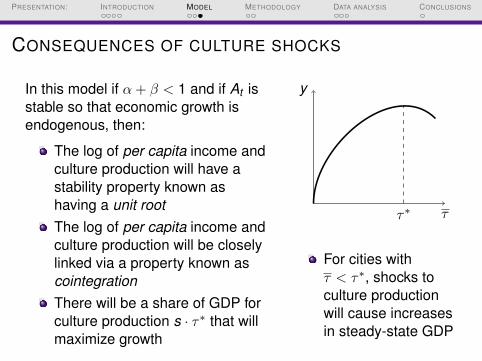
In this model if α + β < 1 and if At isstable so that economic growth isendogenous, then:
The log of per capita income andculture production will have astability property known ashaving a unit rootThe log of per capita income andculture production will be closelylinked via a property known ascointegrationThere will be a share of GDP forculture production s · τ∗ that willmaximize growth
ττ∗
y
For cities withτ < τ∗, shocks toculture productionwill cause increasesin steady-state GDP

PRESENTATION: INTRODUCTION MODEL METHODOLOGY DATA ANALYSIS CONCLUSIONS
ARE THE DATA CONSISTENT WITH THE MODEL?
Our model assumes random processes that generate dataon per capita income yt and culture production ct
We must determine if observed data on yt and ct areconsistent with the assumptions made in our modelTest hypothesis that yt and ct have a unit root
Must hold in every cityImplies that first differences ∆yt and ∆ct are stationary
Test hypothesis that yt and ct are cointegratedImplies a close connection between yt and ctThere exists a weighted sum of yt and ct that is stationaryAt least one of the variables must Granger cause the other
PRESENTATION: INTRODUCTION MODEL METHODOLOGY DATA ANALYSIS CONCLUSIONS
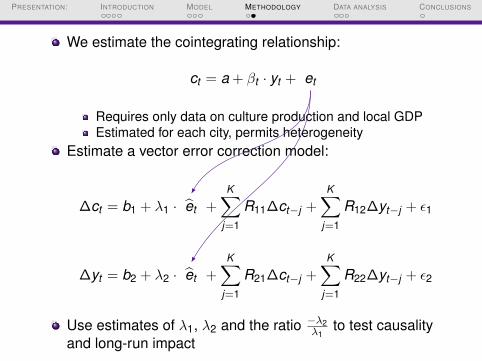
We estimate the cointegrating relationship:
ct = a + βt · yt + et
Requires only data on culture production and local GDPEstimated for each city, permits heterogeneity
Estimate a vector error correction model:
∆ct = b1 + λ1 · et +K∑
j=1
R11∆ct−j +K∑
j=1
R12∆yt−j + ε1
∆yt = b2 + λ2 · et +K∑
j=1
R21∆ct−j +K∑
j=1
R22∆yt−j + ε2
Use estimates of λ1, λ2 and the ratio −λ2λ1
to test causalityand long-run impact

PRESENTATION: INTRODUCTION MODEL METHODOLOGY DATA ANALYSIS CONCLUSIONS
AGGREGATE DATA FROM CULTURAL NON-PROFITS
PRESENTATION: INTRODUCTION MODEL METHODOLOGY DATA ANALYSIS CONCLUSIONS
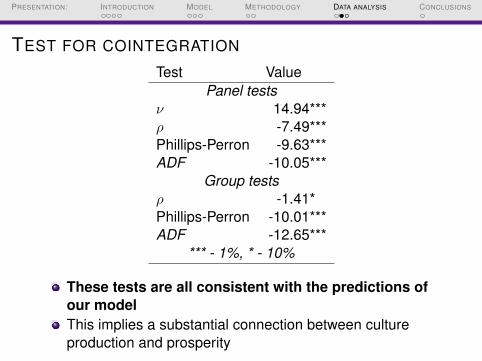
TEST FOR COINTEGRATION
Test ValuePanel tests
ν 14.94***ρ -7.49***Phillips-Perron -9.63***ADF -10.05***
Group testsρ -1.41*Phillips-Perron -10.01***ADF -12.65***
*** - 1%, * - 10%
These tests are all consistent with the predictions ofour modelThis implies a substantial connection between cultureproduction and prosperity
PRESENTATION: INTRODUCTION MODEL METHODOLOGY DATA ANALYSIS CONCLUSIONS
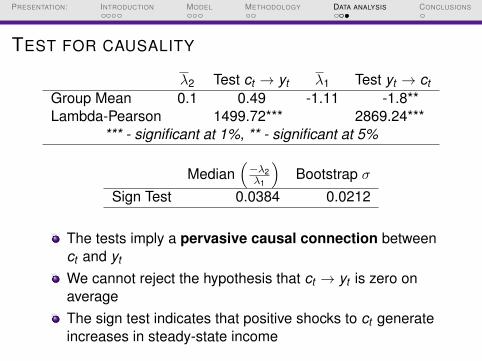
TEST FOR CAUSALITY
λ2 Test ct → yt λ1 Test yt → ctGroup Mean 0.1 0.49 -1.11 -1.8**Lambda-Pearson 1499.72*** 2869.24***
*** - significant at 1%, ** - significant at 5%
Median(−λ2λ1
)Bootstrap σ
Sign Test 0.0384 0.0212
The tests imply a pervasive causal connection betweenct and yt
We cannot reject the hypothesis that ct → yt is zero onaverageThe sign test indicates that positive shocks to ct generateincreases in steady-state income

PRESENTATION: INTRODUCTION MODEL METHODOLOGY DATA ANALYSIS CONCLUSIONS
CONCLUSIONS
There is a short-run relationship between cultureproduction and economic outputNeither this relationship nor the size of the sector implythat increases in arts support will cause economic growthEvaluation of the ability of culture to cause growth requiresa new type of model and data analysisWe provide a growth model in which shocks to culture maygenerate economic growthUsing data from cultural non-profits in US MSAs, we findthe data to be consistent with our modelArts and culture production has a pervasive causal impacton steady-state incomeA positive shock to culture production causes economicgrowth
In this sense we can say