ctf/tfc.8/inf.2 april 20, 2012 meeting of the ctf trust ... · sweden grant sek ... f/ the total...
TRANSCRIPT

CTF/TFC.8/Inf.2
April 20, 2012
Meeting of the CTF Trust Fund Committee
Washington, D.C.
May 3, 2012
TRUSTEE REPORT ON THE
FINANCIAL STATUS
OF THE CLEAN TECHNOLOGY FUND

2
I. INTRODUCTION
1. This report provides the Trust Fund Committee of the Clean Technology Fund (CTF)
with information on the financial status of the CTF Trust Fund. The paper is divided into six
sections. Following the introduction in this Section I, Section II presents the status of
contributions to the CTF; Section III discusses the endorsed CTF Investment Plans; Section IV
reports on the total funding decisions made by the CTF Trust Fund Committee; Section V shows
funding availability of the CTF Trust Fund; and Section VI reports on the update of activities
undertaken by the Trustee to manage the CTF Trust Fund. Annex 1, prepared based on
information provided by the Multilateral Development Banks (MDBs), presents the status of
disbursements made by the MDBs.
II. STATUS OF CONTRIBUTIONS
2. Contributions comprise both pledges and commitments from Contributors. Pledges
represent a Contributor’s expression of intent to make a contribution and form the basis for the
endorsement of CTF Investment Plans by the CTF Trust Fund Committee, as further discussed in
the next section. Pledges are converted to “commitments” by way of a countersigned
Contribution or Loan Agreement/Arrangement. Table 1 presents the contributions to the CTF,
broken down into pledged and committed amounts in the pledge currency. Since last reported,
Canada signed a Loan Contribution Arrangement with the Trustee in the amount of CAD 200
million (payable in US dollars). Also, the United Kingdom made an additional contribution of
GBP 133 million as part of the U.K.'s Fast Start commitment. The total contributions to the CTF
now amount to USD eq. 5.0 billion, valued at the exchange rates available on the date of the
Climate Investment Funds (CIF) pledging meeting. The current value of the contributions
amounts to USD eq. 4.8 billion as of March 31, 2012 (a difference of USD eq. 179 million due to
exchange rate movements). Total receipts to the CTF Trust Fund amount to USD eq. 3.4 billion.
Pledges and unpaid donor commitments amount to USD eq. 1.4 billion.
Contributor Currency
Pledged
Committed Total
Australia Grant AUD - 100 100 84 86 2 86
Canada Loan CAD - 200 200 193 201 7 -
France Loan EUR - 203 203 300 271 (29) 271
Germany c/ Loan EUR - 500 500 739 615 (124) 615
Japan d/ Grant USD - 1,000 1,000 1,000 1,128 128 761
Spain Capital EUR - 80 80 118 110 (8) 70
Sweden Grant SEK - 600 600 92 80 (13) 80
United Kingdom e/ Capital GBP - 518 518 964 823 (141) 823
United States f/ Grant USD 823 669 1,492 1,492 1,492 - 669
4,984 4,805 (179) 3,375
f/ The total pledge made by the United States to the CIFs is USD 2 billion; the allocation across the programs is indicative.
Contribution
Type
Contribution Amounts Historical Value of
Total Contribution
in USD eq. a/ (1)
Current Value of
Total Contribution
in USD eq. b/ (2)
FX changes
(3) = (2) - (1)
Receipts in
USD eq. b/
a/ Represents pledges valued on the basis of exchange rates as of September 25, 2008, the CIF official pledging date.
b/ Represents realized amounts plus unrealized amounts valued on the basis of exchange rates as of March 31, 2012.
c/ The EUR 500 million pledge was committed in USD in the amount of USD eq. 615 million.
d/ The USD 1 billion pledge was committed in JPY in the amount of JPY eq 93 billion.
e/ Amount pledged under the Strategic Climate Fund and allocated to the Clean Technology Fund. Additional contribution of GBP 133 million was made as part
of the UK's Fast Start commitment.
CLEAN TECHNOLOGY FUND
Table 1: Contributions
as of March 31, 2012
(in millions)

3
3. Contributors may make a contribution to the CTF in the form of a: (a) Grant Contribution,
(b) Capital Contribution, or (c) Loan Contribution. Grant or Capital Contributions to the Trust
Fund may be paid by cash or, with the Trustee’s agreement, promissory notes payable on
demand or similar obligations in a form acceptable to the Trustee in accordance with the terms of
the Contribution Agreements/Arrangements with the Trustee. Loan Contributions are paid in
cash in accordance with the terms of the Loan Agreement/Arrangement with the Trustee.
4. Table 2 shows the receipts on committed amounts from Contributors to the CTF Trust
Fund as of September 30, 2011 and March 31, 2012. Between September 30, 2011 and March
31, 2012, the Trustee received approximately USD eq. 3961 million, bringing total receipts from
contributors to USD eq. 3.4 billion as of March 31, 2012.
III. CTF Investment Plans endorsed by the CTF Trust Fund Committee
5. CTF Investment Plans, developed under the leadership of the relevant government,
outline the proposed use of CTF resources in recipient countries through a joint MDB program.
Investment Plans are submitted to the CTF Trust Fund Committee to endorse the further
development of activities for CTF financing and to facilitate prioritization of projects in the
pipeline. The value of the amounts pledged to the CTF forms the basis for endorsement of
Investment Plans by the CTF Trust Fund Committee. As noted in Table 1, the current value of
CTF contributions as of March 31, 2012 is USD eq. 4.8 billion. The Trustee uses the value of
the pledges to keep track of the surplus or the shortfall as described below.
6. To date, the CTF Trust Fund Committee has endorsed 15 Investment Plans for a total
amount of proposed CTF funding of USD 5.2 billion (see Table 3), of which USD 1 billion
which was endorsed for the Investment Plans for Nigeria and India is contingent upon the
availability of funds beyond what is planned for in the current pipeline. Between September 30,
2011 and March 31, 2012, USD 229 million was approved for CTF projects bringing total
1 Amount net of foreign exchange movements
Contributor
Contribution
Type Currency
Committed
Receipts
(Curr)
Receipts
(USD)
Committed
Receipts
(Curr)
Receipts
(USD)
Australia Grant AUD 100 100 86 100 100 86
Canada Loan CAD 200 - - - - -
France Loan EUR 203 203 271 203 203 274
Germany Loan USD 615 615 615 615 615 615
Japan Grant JPY 92,655 62,542 761 92,655 62,542 774
Spain Capital EUR 80 50 70 80 50 70
Sweden Grant SEK 600 600 80 600 500 66
United Kingdom Capital GBP 518 518 823 385 385 610
United States Grant USD 669 669 669 485 485 485
3,375 2,979
CLEAN TECHNOLOGY FUND
Table 2: Status of Contributions and Receipts
as of March 31, 2012
(in millions)
As of March 31, 2012 As of September 30, 2011

4
project approvals to USD 1.9 billion as of March 31, 2012.2 Chart 1 illustrates the percentage
breakdown of approved projects by country/region. Chart 2 shows the comparison of CTF
approved projects and pipeline by country/region.
2 Project approved amounts include project preparation grants and associated fees.
Total Pledged Amount a/ 4,805
( - ) Investment Plans Endorsed 5,245
( - ) Budgets Approved 25
( + ) Investment Income 42
Balance for new IPs (422)
Country/Region
Amount
Endorsed
Projects
Approved
Amount
Endorsed
Projects
Approved
Amount
Endorsed
Projects
Approved
Colombia 150 38 150 38 - -
Egypt 300 151 300 151 - -
India 775 - b/ - - 775 -
Indonesia 400 125 400 125 - 0
Kazakhstan 200 73 200 66 - 7
Mexico 500 414 500 343 - 71
Middle East and North Africa 750 198 750 198 - -
Morocco 150 125 150 - - 125
Nigeria 250 - b/ 250 - - -
Philippines 250 32 250 30 - 2
South Africa 500 450 500 450 - -
Thailand 170 70 300 70 (130) -
Turkey 250 172 250 172 - -
Ukraine 350 50 350 28 - 22
Vietnam 250 32 250 31 - 1
Total 5,245 1,929 4,600 1,701 645 229
b/ Endorsed subject to the availability of funds beyond what is planned for in the current
pipeline.
CLEAN TECHNOLOGY FUND
Table 3: Investment Plan Balance
as of March 31, 2012
(in USD millions)
As of September 30, 2011
(b)
As of March 31, 2012
(a)
a/ Represents realized amounts plus unrealized amounts valued on the basis of exchange rates
as of March 31, 2012.
Change since last report
(a) - (b)

5
Chart 1: CTF approved projects by country/region
Chart 2: CTF approved projects and net pipeline comparison by country/region
Colombia38 2%
Egypt151 8%
India-
0%
Indonesia125 6%
Kazakhstan73 4%
Mexico414 21%
Middle East and North Africa
198 10%
Morocco125 6%
Nigeria-
0%
Philippines32 2%
South Africa450 23%
Thailand70 4%
Turkey172 9%
Ukraine50 3%
Vietnam32 2%
113
149
775
275 127
86
552
25
250 218
50
100
78
300 218
38
151
-
125 73
414
198
125
-32
450
70
172
50 32
0%
10%
20%
30%
40%
50%
60%
70%
80%
90%
100%
Net Pipeline Amount Approved Projects

6
IV. Funding Decisions
7. The cumulative funding decisions for projects included in the endorsed Investment Plans
and administrative budgets made by the CTF Trust Fund Committee as of March 31, 2012
amount to USD 1.9 billion, an increase of USD 229 million since September 30, 2011 (see
Tables 3 and 4). Of the amount of endorsed Investment Plans of USD 5.2 billion, the CTF Trust
Fund Committee approved funding totaling USD eq. 1.9 billion, representing 37% of the total
endorsed amount.3 Table 4 also shows the breakdown of the project approvals by MDB. The
project proposals pending approval as of March 31, 2012 or those submitted to the CTF Trust
Fund Committee after March 31, 2012 are not included in the table. The breakdown of the
cumulative funding decisions by financing type4 is shown in Chart 3.
3 Of the total endorsed amount of USD 5.2 billion USD 1 billion was endorsed subject to availability of funds. 4 Public sector harder concessional loan (H-Loan) has terms of 0.75% interest, 20 years maturity and 10 years grace on principal
repayments; public sector softer concessional loan (S-Loan) has terms of 0.25% interest, 40 years maturity and 10 years grace on
principal repayments.
Projects and Fees 1,929 1,701
ADB 3 1
AfDB 377 252
EBRD 171 143
IBRD 975 972
IDB 174 104
IFC 229 229
Administrative Budget 25 25
Total 1,954 1,726
As of March 31, 2012 As of September 30, 2011
CLEAN TECHNOLOGY FUND
Table 4: Cumulative Funding Decisions
Inception to March 31, 2012
(in USD millions)

7
Chart 3: Funding Decisions by Financing Type (USD millions)
V. Funding Availability
8. Table 5 shows the Funds held in Trust for the CTF as of September 30, 2011 (USD eq.
2.6 billion) and March 31, 2012 (USD eq. 2.9 billion), based on the cumulative receipts and cash
transfers since inception. This amount is brought forward to Table 6 to calculate the Funding
Availability for the CTF Trust Fund. Funding Availability for the CTF Trust Fund refers to
Funds held in Trust with no restrictions less (a) funding decisions pending cash transfers; and (b)
amounts pending decision by the CTF Trust Fund Committee. Accordingly, the net funding
availability in the CTF Trust Fund to support the funding decisions of the CTF Trust Fund
Committee as of March 31, 2012 amounts to USD eq. 1.4 billion.
Public Sec H-Loan440
22.8%
Public Sec S-Loan947
49.1%
Preparation Grant8
0.4%
Private Sec Investment
48925.4%
Private Sec Grant34
1.8%
MDB Fee11
0.6%

8
VI. Update on Trustee Activities
9. Investment Management: Table 7 illustrates the composition of instruments in which
the CTF Trust Fund portfolio was invested as of March 31, 2012. Cash assets held in trust by the
World Bank (as the Trustee) are maintained in a commingled investment portfolio (the “Pool”)
for all trust funds administered by the World Bank. The assets in the Pool are managed in
accordance with the investment strategy established for all trust funds administered by the World
1. Cumulative Receipts 3,418 3,010
a. Cash receipts and encashed promissory notes 2,945 2,428
b. Unencashed promissory notes a/ 431 551
c. Investment income earned on undisbursed balance 42 31
d. Reflows 0 0
2. Cumulative Cash Transfers 500 384
a. Projects 459 349
b. Project Fees 10 8
c. Administrative Budget 22 22
d. Principal Repayments and Interest Payments 9 6
3. Funds held in Trust ( 3 = 1 - 2 ) 2,917 a/ b/ 2,626 a/ c/
a/ Valued on the basis of exchange rates as of March 31, 2012
b/ Includes a balance of EUR 181 million
c/ Includes a balance of EUR 181 million
As of September 30, 2011
CLEAN TECHNOLOGY FUND
Table 5: Schedule of Receipts and Cash Transfers
Updated as of March 31, 2012
(in USD eq. millions)
As of March 31, 2012
1. Funds held in Trust 2,917 2,626
a. Cash and Investments 2,487 2,075
b. Unencashed Promissory Notes 431 551
2. Financial Reserve a/ 82 100
3. Funds held in Trust with no restrictions ( 3 = 1 - 2 ) 2,836 2,526
4. Funding decisions pending cash transfers 1,463 1,347
a. Projects and Fees 1,459 1,343
b. Administrative Budget 4 4
5. Amounts pending CTF Trust Fund Committee funding decisions - 73
6. Funds available to support CTF Trust Fund Committee funding decisions ( 6 = 3 - 4 - 5 ) 1,373 b/ c/ 1,107 b/ d/
a/ Represents amount reserved to cover foreign exchange fluctuations and minimum liquidity requirements.
b/ Valued on the basis of exchange rates as of March 31, 2012
c/ Includes funds available of EUR 157 million.
d/ Includes funds available of EUR 172 million.
As of September 30, 2011
CLEAN TECHNOLOGY FUND
Table 6: Schedule of Funds Available
Updated as of March 31, 2012
(in USD eq. millions)
As of March 31, 2012

9
Bank. The Pool is actively managed so that the probability of incurring negative returns is no
more than 1% over the applicable investment horizon.
10. As of March 31, 2012, the CTF Trust Fund has earned investment income of
approximately USD 42 million on the undisbursed balance of the Trust Fund. The investment
income return since inception was approximately 3.18%.
11. Accounting and Reporting: As communicated to the Trust Fund Committee5 , as a
result of the discussions during the MDB financial consultation meetings and subsequent
teleconferences, it was agreed that, while harmonizing accounting treatments as much as possible,
all MDBs will apply special purpose accounting basis in preparing the financial statements for
the CIFs, in accordance with their own policies, procedures, and practices. A matrix which
reflects the accounting treatments discussed and agreed among the MDBs and the Trustee was
attached in the email circulated by the CIF Administrative Unit on April 11, 2012. For ease of
reference, the matrix is available on the Trustee's website (http://fiftrustee.worldbank.org/). The
CY11 audited financial statements of the CTF and SCF Trust Funds will be available on the
Trustee's website as soon as the audit is complete.
5 See email from CIF Administrative Unit dated April 11, 2012.
Asset Class Percentage
Govt 30%
Mortgage-backed Security 15%
Asset-backed Security 4%
Agency 7%
Sovereign/Govt Gtd 11%
Money Markets/Fin. Inst 32%
Corporates 2%
Swap/FX Swap 0%
100%
CLEAN TECHNOLOGY FUND
Table 7. Asset Mix of the Trust Fund Portfolio
as of March 31, 2012

10
ANNEX 1:
Disbursement Report as of December 31, 2011
1. The attached CTF Disbursement Report was prepared by the Trustee based on the
information provided by the MDBs as of December 31, 2011, and was circulated to the
Trust Fund Committee by mail on March 7, 2012.
2. The next report will be prepared as of June 30, 2012, and circulated to the Trust Fund
Committee by mail.

11
March 6, 2011
CLEAN TECHNOLOGY FUND (CTF):
DISBURSEMENT REPORT
(as of December 31, 2011)

12
Introduction
1. This CTF Disbursement Report was prepared by the Trustee based on the information
provided by the MDBs as of December 31, 2011, and is being disseminated and posted on the
CIF website as agreed by the CIF governing bodies in November 2010.
2. As agreed in the June 2011 meetings of the CIF governing bodies, the MDBs will make
efforts to provide in future reports more detailed information on disbursements, including
disbursements by MDBs at the project and country levels for public sector projects and programs
and more qualitative information on the nature and progress of disbursing funds under private
sector programs when confidentiality requirements do not permit public release of quantitative
information.
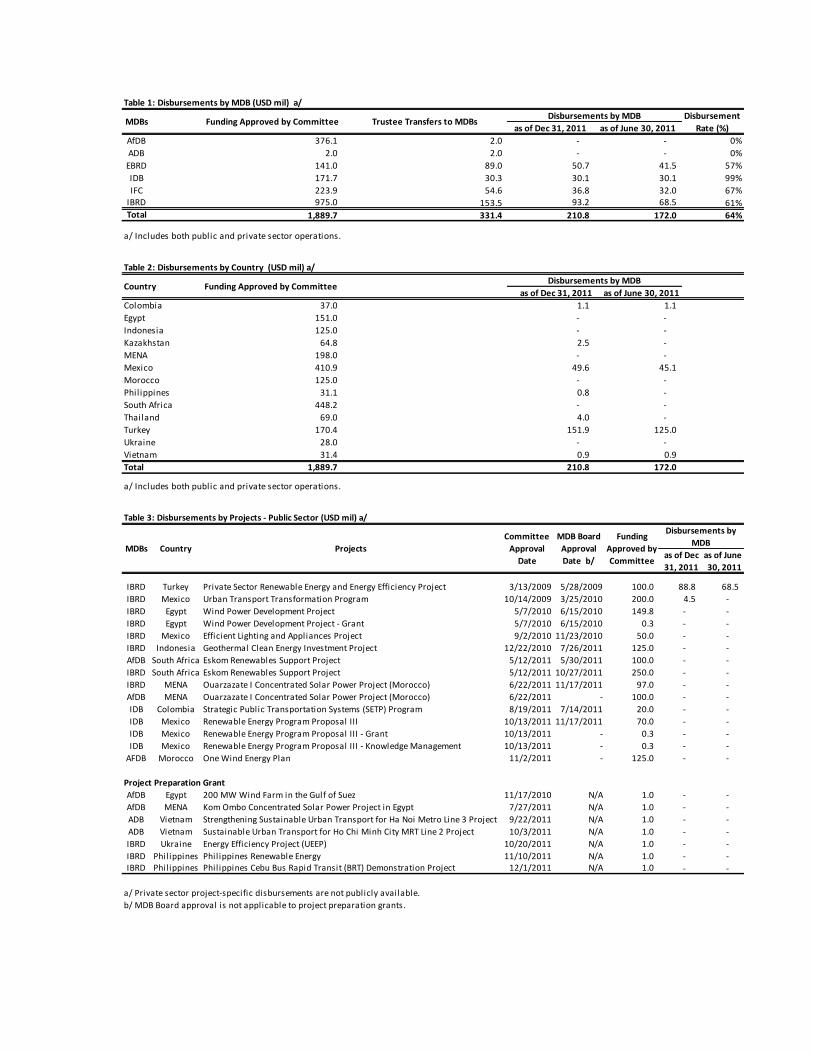
Table 1: Disbursements by MDB (USD mil) a/
as of Dec 31, 2011 as of June 30, 2011
AfDB 376.1 2.0 - - 0%
ADB 2.0 2.0 - - 0%
EBRD 141.0 89.0 50.7 41.5 57%
IDB 171.7 30.3 30.1 30.1 99%
IFC 223.9 54.6 36.8 32.0 67%IBRD 975.0 153.5 93.2 68.5 61%Total 1,889.7 331.4 210.8 172.0 64%
a/ Includes both public and private sector operations.
Disbursements by MDBTrustee Transfers to MDBsFunding Approved by CommitteeMDBs
Disbursement
Rate (%)
Table 2: Disbursements by Country (USD mil) a/
as of Dec 31, 2011 as of June 30, 2011
Colombia 37.0 1.1 1.1
Egypt 151.0 - -
Indonesia 125.0 - -
Kazakhstan 64.8 2.5 -
MENA 198.0 - -
Mexico 410.9 49.6 45.1
Morocco 125.0 - -
Philippines 31.1 0.8 -
South Africa 448.2 - -
Thailand 69.0 4.0 -
Turkey 170.4 151.9 125.0
Ukraine 28.0 - -
Vietnam 31.4 0.9 0.9
Total 1,889.7 210.8 172.0
a/ Includes both public and private sector operations.
Disbursements by MDBFunding Approved by CommitteeCountry
Table 3: Disbursements by Projects - Public Sector (USD mil) a/
as of Dec
31, 2011
as of June
30, 2011
IBRD Turkey Private Sector Renewable Energy and Energy Efficiency Project 3/13/2009 5/28/2009 100.0 88.8 68.5
IBRD Mexico Urban Transport Transformation Program 10/14/2009 3/25/2010 200.0 4.5 -
IBRD Egypt Wind Power Development Project 5/7/2010 6/15/2010 149.8 - -
IBRD Egypt Wind Power Development Project - Grant 5/7/2010 6/15/2010 0.3 - -
IBRD Mexico Efficient Lighting and Appliances Project 9/2/2010 11/23/2010 50.0 - -
IBRD Indonesia Geothermal Clean Energy Investment Project 12/22/2010 7/26/2011 125.0 - -
AfDB South Africa Eskom Renewables Support Project 5/12/2011 5/30/2011 100.0 - -
IBRD South Africa Eskom Renewables Support Project 5/12/2011 10/27/2011 250.0 - -
IBRD MENA Ouarzazate I Concentrated Solar Power Project (Morocco) 6/22/2011 11/17/2011 97.0 - -
AfDB MENA Ouarzazate I Concentrated Solar Power Project (Morocco) 6/22/2011 - 100.0 - -
IDB Colombia Strategic Public Transportation Systems (SETP) Program 8/19/2011 7/14/2011 20.0 - -
IDB Mexico Renewable Energy Program Proposal III 10/13/2011 11/17/2011 70.0 - -
IDB Mexico Renewable Energy Program Proposal III - Grant 10/13/2011 - 0.3 - -
IDB Mexico Renewable Energy Program Proposal III - Knowledge Management 10/13/2011 - 0.3 - -
AFDB Morocco One Wind Energy Plan 11/2/2011 - 125.0 - -
Project Preparation Grant
AfDB Egypt 200 MW Wind Farm in the Gulf of Suez 11/17/2010 N/A 1.0 - -
AfDB MENA Kom Ombo Concentrated Solar Power Project in Egypt 7/27/2011 N/A 1.0 - -
ADB Vietnam Strengthening Sustainable Urban Transport for Ha Noi Metro Line 3 Project 9/22/2011 N/A 1.0 - -
ADB Vietnam Sustainable Urban Transport for Ho Chi Minh City MRT Line 2 Project 10/3/2011 N/A 1.0 - -
IBRD Ukraine Energy Efficiency Project (UEEP) 10/20/2011 N/A 1.0 - -
IBRD Philippines Philippines Renewable Energy 11/10/2011 N/A 1.0 - - IBRD Philippines Philippines Cebu Bus Rapid Transit (BRT) Demonstration Project 12/1/2011 N/A 1.0 - -
a/ Private sector project-specific disbursements are not publicly available.
b/ MDB Board approval is not applicable to project preparation grants.
Disbursements by
MDBMDBs Country Projects
Committee
Approval
Date
MDB Board
Approval
Date b/
Funding
Approved by
Committee

14
Chart 1: Disbursement Summary by MDB (USD mil)
Chart 2: Disbursement Summary by Country (USD mil)
AfDB ADB EBRD IDB IFC IBRD
Funding Approved by Committee 376.1 2.0 141.0 171.7 223.9 975.0
Trustee Transfers to MDBs 2.0 2.0 89.0 30.3 54.6 153.5
Disbursements by MDB - - 50.7 30.1 36.8 93.2
0% 0%57% 99% 67%
61%
-
100.0
200.0
300.0
400.0
500.0
600.0
700.0
800.0
900.0
1,000.0
Colombia Egypt Indonesia Kazakhstan MENA Mexico Morocco PhilippinesSouth Africa
Thailand Turkey Ukraine Vietnam
Funding Approved by Committee 37.0 151.0 125.0 64.8 198.0 410.9 125.0 31.1 448.2 69.0 170.4 28.0 31.4
Disbursements by MDB 1.1 - - 2.5 - 49.6 - 0.8 - 4.0 151.9 - 0.9
-
50.0
100.0
150.0
200.0
250.0
300.0
350.0
400.0
450.0
500.0