ctc warrnambool - prevention is possible - community profile and action plan
TRANSCRIPT

Endorsed by
Funded by
Coordinated by
Funded by
Supported by
Supported by
Supported by
Sponsored by
This project has been funded under the Victorian Government’s Community Crime Prevention Programme.
Prevention is Possible
22nd Feb 2016 Version 1
Community profile and action plan to improve the healthy development
of children and young people

Communities That Care Warrnambool - Prevention is Possible: community profile and action planPage 2 Communities That Care Warrnambool - Prevention is Possible: community profile and action plan Page 2
Produced by Brophy Family and Youth Services for Communities That Care Warrnambool. February 2016 Prepared by Cameron Price Communities That Care Coordinator Brophy Family and Youth Services [email protected] Suggested citation Price, C. (2016) Communities That Care Warrnambool - Prevention is Possible: community profile and action plan to improve the healthy development of children and young people. Warrnambool: Brophy Family and Youth Services. © Brophy Family and Youth Services This publication is copyright. No part may be reproduced by any process except in accordance with the provisions of the Copyright Act 1968.
Acknowledgements The primary source for the Youth Survey results is Hall, J., Smith, R., & Toumbourou, J. (2015). 2015 Communities That Care Profile Report: Warrnambool. Geelong: Deakin University. I would like to acknowledge the authors of that report: Jessica Hall, Research Fellow, Deakin University, Rachel Smith, Murdoch Childrens Research Institute, and Professor John Toumbourou, Chair in Health Psychology, Faculty of Health, Deakin University. I would particularly like to thank Jessica Hall for her role in administering the Youth Survey and Heidi Cooney for her assistance.
Essential to the success of Communities That Care Warrnambool has been the expert advice of Dr Bosco Rowland, Alfred Deakin Post-Doctoral Fellow with the School of Psychology, Deakin University, Associate Professor in Epidemiology Jo Williams, School of Health & Social Development, Deakin University, and Professor John Toumbourou, Chair in Health Psychology, Faculty of Health, Deakin University.
Thank you to Amber Osborn, Deborah Wagner and Tina Hosseini, Community Relations Officers with Communities That Care Ltd (Australia), for responding patiently to my relentless questions.
I would like to acknowledge the service of the CTC Key Leaders and the members of the Beyond The Bell Warrnambool Local Action Group, which functions as the Communities That Care Warrnambool Board. Your guidance, strategic advice, connections and advocacy have been of great value.
The quality of decision making in the selection of priority risk and protective factors, subsequent decisions around the selection of programmes and ultimately the effectiveness with which our prevention effort will curtail adolescent health and behaviour problems is largely underpinned by the efforts of the CTC volunteer team and Brophy staff that supervised Youth Survey sessions. Thank you for your contribution. You have played a significant role in improving the lives and welfare of many young people in Warrnambool, their families and the community as a whole.
Thank you to those participating in the Data Working Group for grappling with complex information to distil it down to a short list of priority factors to focus the prevention efforts in Warrnambool. Thanks also to those participating in the Resource Assessment and Evaluation Working Group who assisted with reviewing existing programmes and assessing gaps.
Thank you to Nicola Coffey for your assistance in developing this Community Profile and Action Plan.
Thank you to Kathy Sanderson, Francis Broekman and Leeona Van Duynhoven from Brophy Family and Youth Services for your supervision, support and guidance.

Communities That Care Warrnambool - Prevention is Possible: community profile and action plan Page 3 Communities That Care Warrnambool - Prevention is Possible: community profile and action plan Page 3
Table of Contents Executive Summary ........................................................................................................................................................... 5
Introduction ...................................................................................................................................................................... 6
Communities That Care .................................................................................................................................................... 6
Risk and Protective Factors ........................................................................................................................................... 7
Social Development Strategy ........................................................................................................................................ 7
Understanding Local Needs .......................................................................................................................................... 9
CTC Youth Survey .......................................................................................................................................................... 9
Evidence-based Programmes ........................................................................................................................................ 9
Youth Survey Results ....................................................................................................................................................... 10
Health and Behavioural Problems .................................................................................................................................. 11
Substance Abuse ......................................................................................................................................................... 11
Antisocial Behaviour ................................................................................................................................................... 12
Depression / Anxiety ................................................................................................................................................... 13
Risk Factors ..................................................................................................................................................................... 14
Community Risk Factors .............................................................................................................................................. 14
Family Risk Factors ...................................................................................................................................................... 16
School Risk Factors ...................................................................................................................................................... 17
Peer / Individual Risk Factors ...................................................................................................................................... 18
Risk Factors Incline with Age ....................................................................................................................................... 20
Risk Factors by Domain ............................................................................................................................................... 20
Protective Factors ........................................................................................................................................................... 20
Community Protective Factors ................................................................................................................................... 20
Family Protective Factors ............................................................................................................................................ 21
School Protective Factors ............................................................................................................................................ 22
Peer/Individual Protective Factors ............................................................................................................................. 23
Protective Factors Decline with Age ........................................................................................................................... 25
Protective Factors by Domain ..................................................................................................................................... 25
Principles Influencing the Selection of Priority Factors .................................................................................................. 26
Malleability ................................................................................................................................................................. 26
Domains ...................................................................................................................................................................... 26
Number of Priority Factors ......................................................................................................................................... 26
Risk vs Protective Factors ............................................................................................................................................ 26
Prevalence ................................................................................................................................................................... 27
Recommendations in the Youth Survey Report .......................................................................................................... 27
Relative Prevalence of Factors ........................................................................................................................................ 27
Selection of Priority Risk and Protective Factors ............................................................................................................ 29
Inventory of Existing Programmes .................................................................................................................................. 30

Communities That Care Warrnambool - Prevention is Possible: community profile and action planPage 4 Communities That Care Warrnambool - Prevention is Possible: community profile and action plan Page 4
Programme Selection ...................................................................................................................................................... 30
Logic Model ..................................................................................................................................................................... 30
Selected Programmes ..................................................................................................................................................... 32
Social marketing and community mobilisation to reduce alcohol-related harms...................................................... 32
Reducing access to alcohol for young people under age 18 ....................................................................................... 33
Reducing access to tobacco for young people under age 18 ..................................................................................... 34
Resilient Families / Parenting Adolescents: A Creative Experience (PACE) ................................................................ 35
The Good Behaviour Game ......................................................................................................................................... 36
You Can Do It! Education ............................................................................................................................................ 37
Programmes for Consideration ....................................................................................................................................... 38
Friendly Schools and Families/ Friendly Schools Plus ................................................................................................. 38
FRIENDS for Life .......................................................................................................................................................... 39
The Strengthening Families Programme 10-14 .......................................................................................................... 40
Prevention Planning for 2017 ......................................................................................................................................... 41
Research and Evaluation Consultancy ............................................................................................................................ 41
Further Information ........................................................................................................................................................ 41

Communities That Care Warrnambool - Prevention is Possible: community profile and action plan Page 5 Communities That Care Warrnambool - Prevention is Possible: community profile and action plan Page 5
Executive Summary Communities That Care Warrnambool aims to improve the healthy development of children and young people and prevent antisocial behaviour, alcohol and drug abuse and school dropout. It works to prevent health and social problems by addressing the factors that increase the likelihood of positive development and decrease the likelihood of adverse outcomes for children and young people.
Brophy Family and Youth Services has agreed to partner with Communities That Care Ltd in a Department of Justice and Regulation funded project to coordinate Communities that Care in Warrnambool.
The Communities That Care Youth Survey asked 326 questions of 1,215 year 6, 8 and 10 students from 13 schools.
One in five year 6 students have had alcohol; one in 16 within the last four weeks. One in every 45 year 6 students binge drank (five or more drinks in a single session) within the last fortnight. Two in five year 8 students have had alcohol; one in five within the last four weeks. One in every 18 year 8 students binge drank within the last fortnight. Two in three year 10 students have had alcohol; one in three within the last four weeks. One in five year 10 students binge drank within the last fortnight. On average, for every year 8 class of 25 students, eight have been bullied. One in ten year 10 students have been suspended. Three in four year 10 students have a low commitment to school. Three in five year 10 students believe that laws and norms in the community support alcohol and drug use. A third of year 8 and 10 students are in family environments with high levels of conflict. Four in seven year 10 students have attitudes favourable to alcohol and drug use. Three in five year 6s see opportunities for prosocial involvement in school; this is halved by year 10. Three in five year 6s see rewards for prosocial involvement in schools; but only three in 16 year 10s see this. Three in four year 6s are affirmed by their families for prosocial involvement; this is halved by year 10. One in five year 6 students and two in five year 8s and 10s have symptoms of depression and anxiety.
The following risk/protective factors were selected as priorities to target:
Low commitment to school (School risk factor) School opportunities for prosocial involvement (School protective factor) Family opportunities for prosocial involvement (Family protective factor) Laws/norms favourable to substance use (Community risk factor) Favourable attitude towards drug use (Peer/individual risk factor)
Fifteen specific objectives have been set, five for each of the target outcomes:
Outcome 1: Improve education attainment Outcome 2: Reduce alcohol and other drug use Outcome 3: Reduce antisocial behaviour
This report specifies which evidence-based prevention programmes to implement in Warrnambool across the domains of community, school, family and peer/individual.
Our vision is that every child and young person who lives or attends school in Warrnambool has the environment, connections and opportunities to build physical, mental and social wellbeing.
If you have any questions or would like to support Communities That Care Warrnambool, please contact the Communities That Care Coordinator Cameron Price on 5561 8877 or email [email protected].
For further information go to http://ctcwarrnambool.com.

Communities That Care Warrnambool - Prevention is Possible: community profile and action planPage 6 Communities That Care Warrnambool - Prevention is Possible: community profile and action plan Page 6
Introduction The cost of crime in Australia from the impact on victims and the cost of the justice system and operating prisons runs into the billions every year. Every dollar invested in evidence-based prevention programmes reduces the long-term cost of crime many times over. It is for this reason that the Department of Justice and Regulation has funded Communities That Care in Warrnambool.
The level of attainment of year twelve or equivalent in Warrnambool is extremely low. Only 61% of 20 – 24 year olds have attained year 12 or equivalent, compared to a Victorian average of 75%. This does not bode well for those individuals or for local economy and community as a whole.
Alcohol and other drugs are a major public health concern contributing to many injuries and fatalities from road accidents, assaults and family violence and chronic health problems. Youth who regularly consume alcohol by age 14 are nearly half as likely to complete high school education as those who do not.
Communities That Care Warrnambool adopts a "public health" approach. In its submission to the Senate Inquiry on Domestic Violence in Australia, the Australian Women's Health Network gave a great explanation of the public health model:
Public Health has been defined as an organised response to the protection and promotion of human health…It is concerned with the health of entire populations, which may be a local neighbourhood or an entire country. Public health programs are delivered through education, promoting health lifestyles, and disease and injury prevention. This is in contrast to the medical approach to health which focuses on treating individuals after they become sick or injured.
Communities That Care Communities That Care (CTC) is an evidence-based, community-change process for reducing youth problem behaviours, including harmful substance use, low academic achievement, early school leaving, sexual risk-taking and violence.
The CTC approach applies the most up-to-date knowledge and research to foster healthy behaviour and social commitment among children and youth.
The CTC process uses an early intervention and prevention framework to guide communities towards understanding their local needs, identifying and setting priorities and implementing effective evidence-based strategies to address those needs.
Using prevention science as its base, CTC promotes healthy youth development, improves youth outcomes and reduces problem behaviours. The 5-phase CTC process uses an early intervention and prevention framework to guide communities towards identifying and understanding their local needs, setting priorities and implementing tested effective strategies to address those needs.
Phase 1 – Get Started Communities prepare for action by working to identify and recruit relevant community stakeholders and key decision-makers to the Communities That Care process.
Phase 2 – Get Organised The Community Board, Key Leader Group and relevant governance structures are established to guide decision making and planning for the CTC effort in the community.
Phase 3 – Develop a Profile A Community Profile Report is prepared using data gathered from the CTC Youth Survey, public data, and assessments of existing community resources and strengths. The Community Board finalises priorities for action.

Communities That Care Warrnambool - Prevention is Possible: community profile and action plan Page 7 Communities That Care Warrnambool - Prevention is Possible: community profile and action plan Page 7
Phase 4 – Create a Plan The Community Board develops a comprehensive Community Action Plan to guide prevention work in the community. This plan outlines chosen evidence-based programmes, relevant outcomes and allocates roles and responsibility for implementation.
Phase 5 – Implement and Evaluate Implementation of the Community Action Plan begins and the Community Board and Key Leader Groups ensure that evidence-based programmes and strategies are implemented with fidelity and evaluated as planned.
Risk and Protective Factors The Communities That Care process creates awareness of the risk and protective factors impacting on the healthy development of children and adolescents. Throughout the process, communities target their prevention efforts to reduce risk factors and strengthen protective factors in the four domains of community, family, school and peer/individual.
What are risk factors? Risk factors are those elements in a young person’s environment that increase the likelihood of them engaging in health compromising behaviours. They exist in all domains of social development – community, family, school and peer/individual. Risk factors are identifiable throughout the developmental continuum, and are consistent in effects across races and cultures.
The risk factors used in CTC have been shown in multiple longitudinal studies to be reliable predictors of at least one of six adolescent health and social problems – alcohol and drug abuse, antisocial behaviour, youth violence, school failure, anxiety/depression and teenage pregnancy. A risk and protective factor chart maps the relationship with health and social outcomes. The CTC process provides communities with tools for measuring local risk factor levels in order to select risk factor priorities on which a strategic plan can be focused.
What are protective factors? Protective factors buffer against risk in otherwise adverse circumstances by either reducing the impact of risk or changing the way a child or young person responds to it. The Social Development Strategy provides a framework that explains to communities how to increase protective factors through everyday interactions with children and adolescents. Protective factors used in CTC are derived from a research base and occur in all four social development domains.
Most of the risk and protective factors targeted in the Communities That Care process are measured using the Communities That Care Youth Survey.
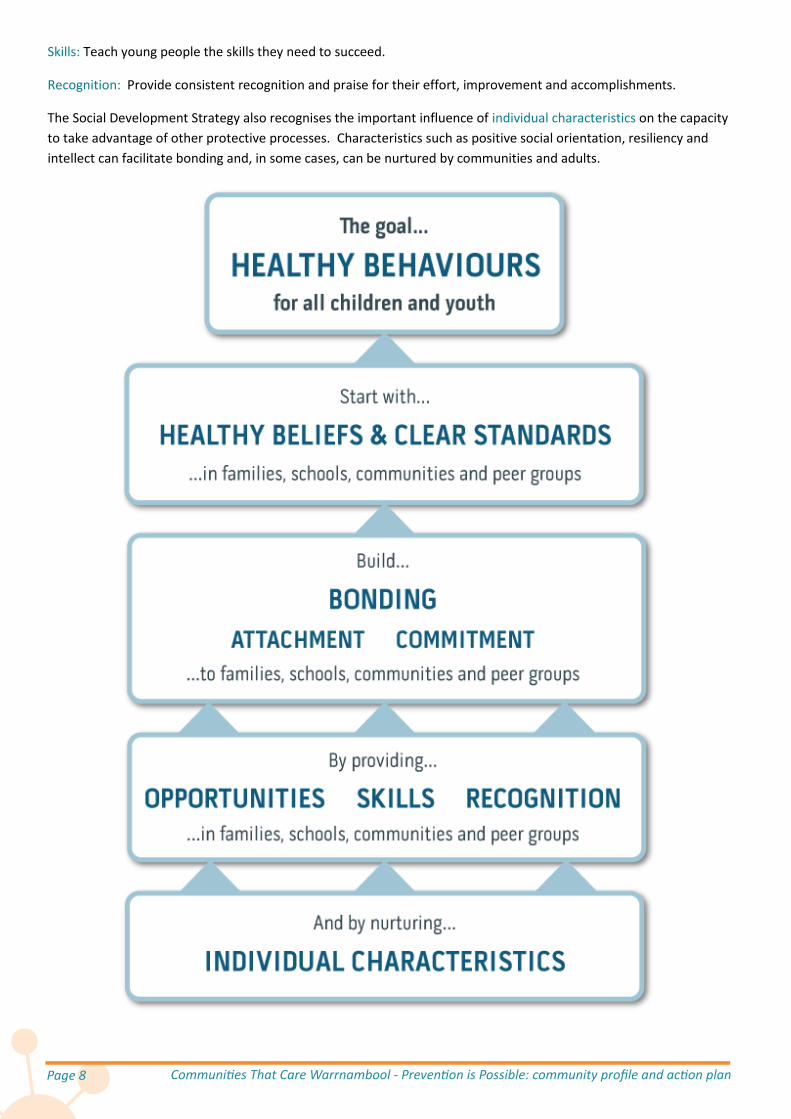
Social Development Strategy Communities that Care is underpinned by the Social Development Strategy - an evidence-based framework which organises protective factors into a simple strategy for action to promote positive youth development.
The Social Development Strategy identifies the following key components to increase protective factors for young people in the community:
Healthy beliefs and clear standards for behaviour: Young people are more likely to engage in healthy, socially responsible behaviour when parents, teachers and the community around them communicate healthy beliefs and clear standards.
Bonding: Strong, attached relationships with those who hold healthy beliefs and clear standards are an important protective influence. To create these bonds, young people need opportunities, skills and recognition.
Opportunities: Provide opportunities for active participation and meaningful involvement with prosocial others, including families, schools, communities and peer groups.
Communities That Care Warrnambool - Prevention is Possible: community profile and action planPage 8 Communities That Care Warrnambool - Prevention is Possible: community profile and action plan Page 8
Skills: Teach young people the skills they need to succeed.
Recognition: Provide consistent recognition and praise for their effort, improvement and accomplishments.
The Social Development Strategy also recognises the important influence of individual characteristics on the capacity to take advantage of other protective processes. Characteristics such as positive social orientation, resiliency and intellect can facilitate bonding and, in some cases, can be nurtured by communities and adults.

Communities That Care Warrnambool - Prevention is Possible: community profile and action plan Page 9 Communities That Care Warrnambool - Prevention is Possible: community profile and action plan Page 9
Understanding Local Needs The Communities That Care process provides communities with a unique approach to identifying and understanding the issues experienced by local children and adolescents.
CTC makes it possible to map factors that are influencing the likelihood that young people in the community will experience outcomes such as school failure and mental health problems or become involved in behaviours such as alcohol and drug abuse, violence and antisocial behaviour.
Communities follow a step-by-step process of collecting and collating local data, including administering a local youth survey, to create a profile of risk and protective factors and health and problem behaviours affecting young people in the community. This profile is a powerful tool for planning prevention strategies where genuine priorities are targeted for action. The community can use this information to make informed decisions about how to improve existing prevention-focused services that benefit children and adolescents. Gaps in service provision can also be identified and filled by introducing new interventions as necessary.
CTC Youth Survey The CTC Youth Survey is administered to students attending local primary and secondary schools. The survey is suitable for students in Grade 5 through to Year 12. CTC Ltd. work with communities to determine the most suitable year levels to survey. The survey has been designed to provide a snapshot of issues for young people, particularly in the areas of substance abuse, antisocial behaviour, youth violence and mental health. It also investigates risk and protective factors for these health and problem behaviours within the domains of community, school, family and peer/individual.
Evidence-based Programmes The Communities that Care process assists communities to select and implement evidence-based programmes and strategies to promote healthy youth development in accordance with the community’s identified priorities. “Evidence-based” on this definition refers to a documented project logic that has been evaluated and shown positive results in one or more experimental or good quality evaluation studies.
The Communities that Care Guide to Australian Prevention Strategies (2012) includes detailed information on evidence-based programmes which have been selected based on the following criteria:
Evidence of effectiveness from good quality evaluation studies in preventing youth health and social problems by reducing developmental risk factors, while also enhancing protective factors;
Feasibility for implementation and monitoring by Communities that Care coalitions;
Availability of support and advice to assist Australian implementation.
Prevention strategies are being rapidly developed and increasingly evaluated using experimental designs. Communities are encouraged to take a responsible approach to seeking out and promoting the dissemination of evaluated prevention strategies. Where previously unevaluated strategies are implemented, communities can request good quality evaluations.
Communities are also encouraged to access the ARACY Nest What works for kids. This Australian-based online resource provides a searchable database of relevant evidence-based programmes, practices and tools and provides opportunities for users to contribute to the database, with information about additional programmes, practices and tools.

Communities That Care Warrnambool - Prevention is Possible: community profile and action planPage 10 Communities That Care Warrnambool - Prevention is Possible: community profile and action plan Page 10
Youth Survey Results The Communities That Care Youth Survey asked 326 questions of 1,215 year 6, 8 and 10 students from 13 schools.
Some of the notable results from the Youth Survey follow:
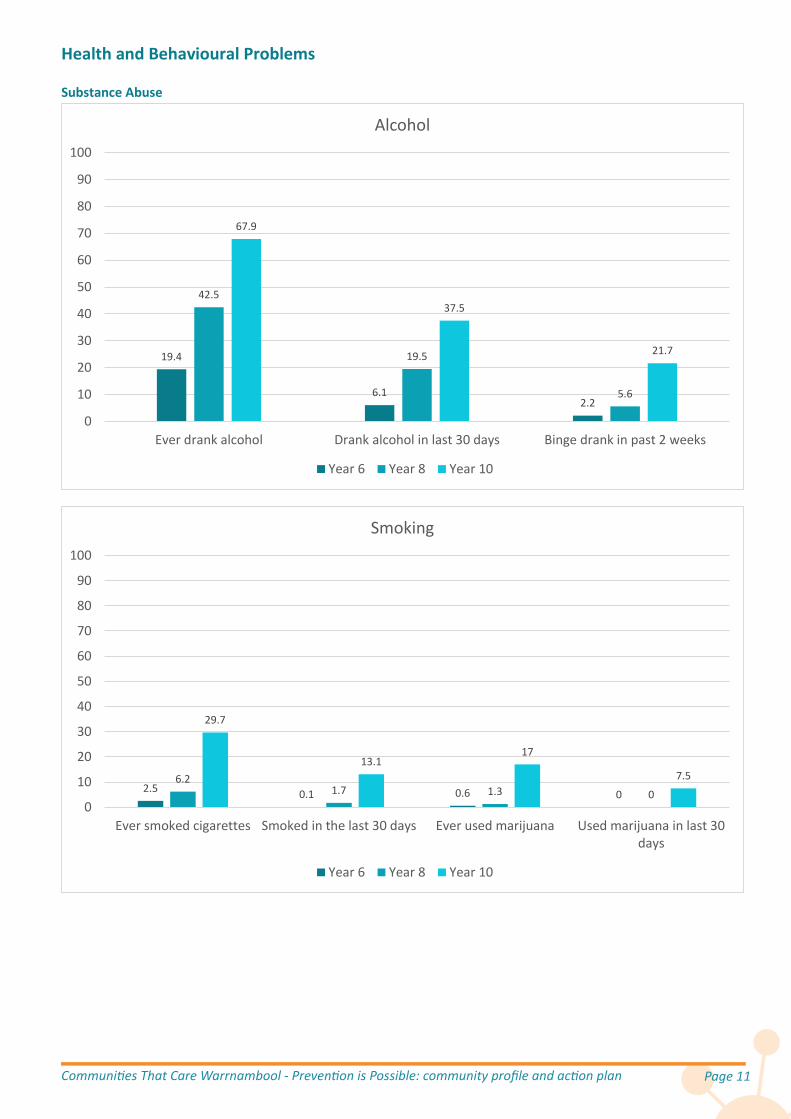
One in five year 6 students have had alcohol; one in 16 within the last four weeks.
One in every 45 year 6 students binge drank (five or more drinks in a single session) within the last fortnight.
Two in five year 8 students have had alcohol; one in five within the last four weeks.
One in every 18 year 8 students binge drank within the last fortnight.
Two in three year 10 students have had alcohol; one in three within the last four weeks.
One in five year 10 students binge drank within the last fortnight.
Three in every 23 year 10 students smoked within the last four weeks.
One in six year 10 students have had marijuana; one in 13 within the last four weeks.
One in 17 year 6 and 8 students have used solvents to get high.
On average, for every year 8 class of 25 students, eight have been bullied.
For every 25 year 8 students, three carry a weapon with the intent to use it if they felt the need.
For every 25 year 8 students, two have attacked someone.
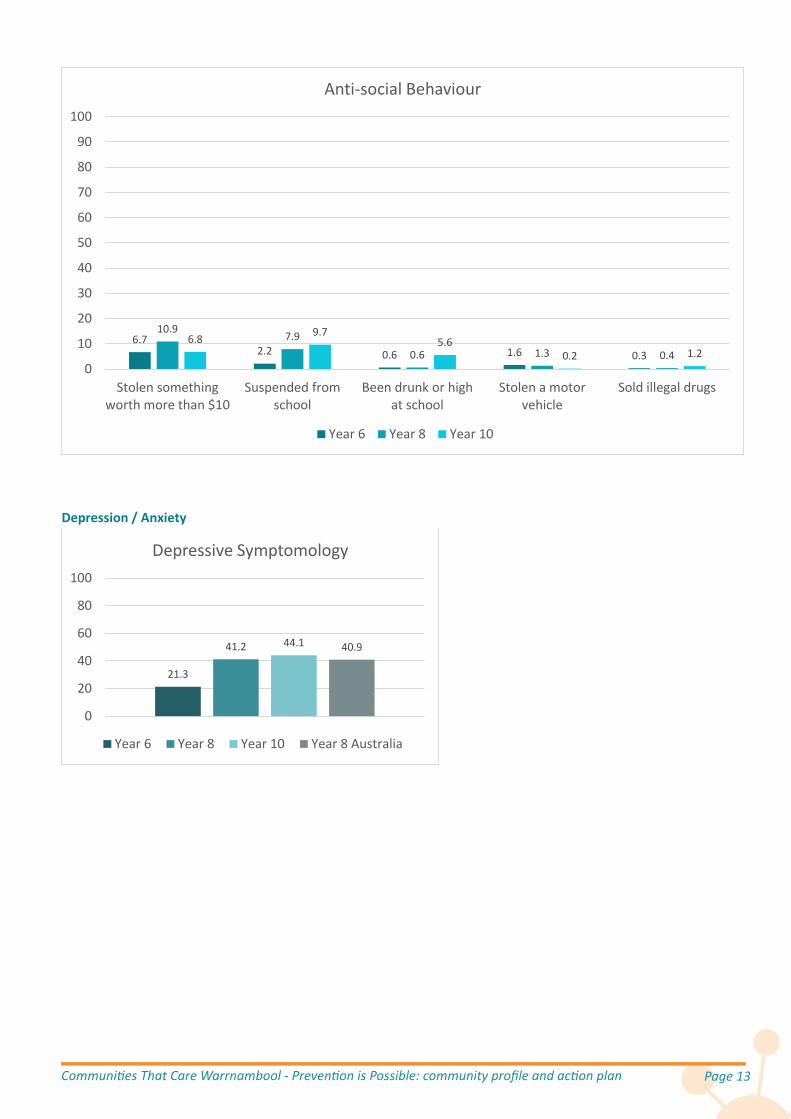
One in nine year 8 students have stolen something worth more than $10.
One in ten year 10 students have been suspended.
One in 18 year 10 students have been drunk or high at school.
Three in four year 10 students have a low commitment to school.
Three in five year 10 students believe that laws and norms in the community support alcohol and drug use.
A third of year 8 and 10 students are in family environments with high levels of conflict.
Four in seven year 10 students have attitudes favourable to alcohol and drug use.
Almost half of year 10 students have at least one of their four best friends who use alcohol or drugs.
Three in five year 6 students see opportunities for prosocial involvement; this is halved by year 10.
Three in five year 6 students see rewards for prosocial involvement; but only one in five year 10s see this.
Three in four year 6s are affirmed by their families for prosocial involvement; this is halved by year 10.
One in five year 6 students have symptoms of depression and anxiety.
Two in five year 8 and 10 students have symptoms of depression and anxiety.
Communities That Care Warrnambool - Prevention is Possible: community profile and action plan Page 11 Communities That Care Warrnambool - Prevention is Possible: community profile and action plan Page 11
Health and Behavioural Problems
Substance Abuse
19.4
6.12.2
42.5
19.5
5.6
67.9
37.5
21.7
0
10
20
30
40
50
60
70
80
90
100
Ever drank alcohol Drank alcohol in last 30 days Binge drank in past 2 weeks
Alcohol
Year 6 Year 8 Year 10
2.5 0.1 0.6 06.2
1.7 1.3 0
29.7
13.117
7.5
0
10
20
30
40
50
60
70
80
90
100
Ever smoked cigarettes Smoked in the last 30 days Ever used marijuana Used marijuana in last 30days
Smoking
Year 6 Year 8 Year 10

Communities That Care Warrnambool - Prevention is Possible: community profile and action planPage 12 Communities That Care Warrnambool - Prevention is Possible: community profile and action plan Page 12
Antisocial Behaviour
5.7 3.80 0 0.3
5.81.9 0.2 0 0.4
4.60.7 0.7 0.2 0.2
0
10
20
30
40
50
60
70
80
90
100
Ever used solvents toget high
Used solvents in last30 days
Ever used illegaldrugs
Used illegal drugs inlast 30 days
Ever usedmethamphetamines
Other Drugs
Year 6 Year 8 Year 10
25.8
7.6 9.63.5 1.9
31.5
9.9 11.87.9
4.1
29.2
8.8 7.33.9 2.2
0
10
20
30
40
50
60
70
80
90
100
Been bullied recently Bullied anotherstudent recently
Carried a weapon Attacked someone Threatenedsomeone with a
weapon
Anti-social Behaviour
Year 6 Year 8 Year 10
Communities That Care Warrnambool - Prevention is Possible: community profile and action plan Page 13 Communities That Care Warrnambool - Prevention is Possible: community profile and action plan Page 13
Depression / Anxiety
6.72.2 0.6 1.6 0.3
10.97.9
0.6 1.3 0.46.8 9.7
5.60.2 1.2
0
10
20
30
40
50
60
70
80
90
100
Stolen somethingworth more than $10
Suspended fromschool
Been drunk or highat school
Stolen a motorvehicle
Sold illegal drugs
Anti-social Behaviour
Year 6 Year 8 Year 10
21.3
41.2 44.1 40.9
0
20
40
60
80
100
Depressive Symptomology
Year 6 Year 8 Year 10 Year 8 Australia

Communities That Care Warrnambool - Prevention is Possible: community profile and action planPage 14 Communities That Care Warrnambool - Prevention is Possible: community profile and action plan Page 14
Risk Factors
Community Risk Factors Low community attachment
Neighbourhoods where residents report low levels of bonding to the neighbourhood have higher rates of juvenile crime, violence and drug use.
Community disorganisation
Neighbourhoods with high population density, lack of natural surveillance of public places, physical deterioration and high rates of adult crime have higher rates of juvenile crime, violence and drug use.
Personal transitions & mobility
Young people without stability and strong personal relationships are more likely to use drugs and become involved in antisocial behaviours.
22.728.3
37.1 33.4
0
20
40
60
80
100
Low community attachment
Year 6 Year 8 Year 10 Year 8 Australia
7 9.3 7.216.9
0
20
40
60
80
100
Community disorganisation
Year 6 Year 8 Year 10 Year 8 Australia
4.6 9.6 8.414.3
0
20
40
60
80
100
Personal transitions & mobility
Year 6 Year 8 Year 10 Year 8 Australia

Communities That Care Warrnambool - Prevention is Possible: community profile and action plan Page 15 Communities That Care Warrnambool - Prevention is Possible: community profile and action plan Page 15
Laws/norms favourable to drug use
Communities where laws regulating alcohol and other drug use are poorly enforced have higher rates of youth alcohol and drug use, violence and delinquency. Further, rates of youth alcohol and drug use and violence are higher in communities where adults believe it is normative or acceptable for minors to use alcohol or other drugs.
Perceived availability of drugs
The availability of cigarettes, alcohol, marijuana and other illegal drugs is related to a higher risk of drug use and violence among adolescents.
The following is an estimate of the prevalence of each community risk factor for adolescents in Warrnambool (derived by averaging the prevalence of each age class).
14.2
33.7
58.9
35.7
0
20
40
60
80
100
Laws/norms favourable to substance use
Year 6 Year 8 Year 10 Year 8 Australia
6.2
19.4
51.3
23.9
0
20
40
60
80
100
Perceived availability of drugs
Year 6 Year 8 Year 10 Year 8 Australia
0 10 20 30 40 50 60 70 80 90 100
Personal transitions & mobility
Community disorganisation
Perceived availability of drugs
Low community attachment
Laws/norms favourable to substance use
Prevalence of Risk Factors

Communities That Care Warrnambool - Prevention is Possible: community profile and action planPage 16 Communities That Care Warrnambool - Prevention is Possible: community profile and action plan Page 16
Family Risk Factors Poor family management
Parents’ use of inconsistent and/or unusually harsh or severe punishment with their children places the children at higher risk for substance use and other problem behaviours.
Family conflict
Children raised in families high in conflict are at risk for violence, delinquency, school dropout, teen pregnancy and drug use.
Parental attitudes favourable to drug use
In families where parents are tolerant of their children’s alcohol or drug use, children are more likely to become drug abusers. The risk is further increased if parents involve children in their own drug or alcohol using behaviour.
Parental attitudes favourable to anti-social behaviour
In families where parents are tolerant of their children’s misbehaviour, including violent and delinquent behaviour, children are more likely to become involved in violence and crime during adolescence.
22.4 26.738
28.6
0
20
40
60
80
100
Poor family management
Year 6 Year 8 Year 10 Year 8 Australia
2633.9 34.9 38.1
0
20
40
60
80
100
Family conflict
Year 6 Year 8 Year 10 Year 8 Australia
12.522
41.8
19.8
0
20
40
60
80
100
Parental attitudes favourable to drug use
Year 6 Year 8 Year 10 Year 8 Australia
13.5
28.2 29.7 28.4
0
20
40
60
80
100
Parental attitudes favourable to anti-social behaviour
Year 6 Year 8 Year 10 Year 8 Australia

Communities That Care Warrnambool - Prevention is Possible: community profile and action plan Page 17 Communities That Care Warrnambool - Prevention is Possible: community profile and action plan Page 17
The following is an estimate of the prevalence of each family risk factor for adolescents in Warrnambool (derived by averaging the prevalence of each age class).
School Risk Factors School failure
Beginning in the late primary school grades (grades 4-6), children who fall behind academically for any reason are at greater risk of drug abuse, school dropout, teenage pregnancy and violence.
Low commitment to school
Factors such as not liking school, spending little time on homework and perceiving coursework as irrelevant are predictive of drug use, violence, delinquency and school dropout.
The following is an estimate of the prevalence of each school risk factor for adolescents in Warrnambool (derived by averaging the prevalence of each age class).
0 10 20 30 40 50 60 70 80 90 100
Parental attitudes favourable to anti-social behaviour
Parental attitudes favourable to drug use
Poor family management
Family conflict
Prevalence of Family Risk Factors
10.4
27.436.3
22
0
20
40
60
80
100
School failure
Year 6 Year 8 Year 10 Year 8 Australia
37.2
71.376.8
60.1
0
20
40
60
80
100
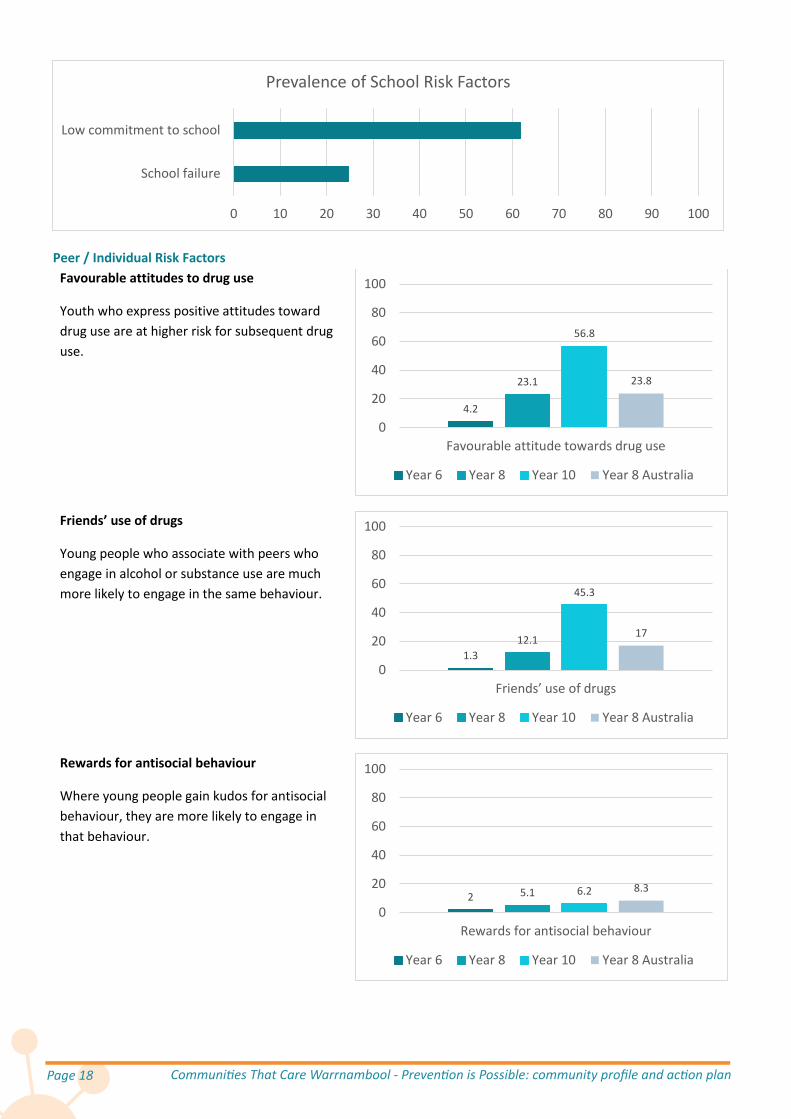
Low commitment to school
Year 6 Year 8 Year 10 Year 8 Australia
Communities That Care Warrnambool - Prevention is Possible: community profile and action planPage 18 Communities That Care Warrnambool - Prevention is Possible: community profile and action plan Page 18
Peer / Individual Risk Factors Favourable attitudes to drug use
Youth who express positive attitudes toward drug use are at higher risk for subsequent drug use.
Friends’ use of drugs
Young people who associate with peers who engage in alcohol or substance use are much more likely to engage in the same behaviour.
Rewards for antisocial behaviour
Where young people gain kudos for antisocial behaviour, they are more likely to engage in that behaviour.
0 10 20 30 40 50 60 70 80 90 100
School failure
Low commitment to school
Prevalence of School Risk Factors
4.2
23.1
56.8
23.8
0
20
40
60
80
100
Favourable attitude towards drug use
Year 6 Year 8 Year 10 Year 8 Australia
1.312.1
45.3
17
0
20
40
60
80
100
Friends’ use of drugs
Year 6 Year 8 Year 10 Year 8 Australia
2 5.1 6.2 8.3
0
20
40
60
80
100
Rewards for antisocial behaviour
Year 6 Year 8 Year 10 Year 8 Australia

Communities That Care Warrnambool - Prevention is Possible: community profile and action plan Page 19 Communities That Care Warrnambool - Prevention is Possible: community profile and action plan Page 19
Rebelliousness
Individuals with rebellious attitudes are more likely to engage in problem behaviour.
Sensation seeking
Young people who seek adrenaline experiences are more likely to engage in substance use and antisocial behaviour.
The following is an estimate of the prevalence of each peer/individual risk factor for adolescents in Warrnambool (derived by averaging the prevalence of each age class).
6.514 19.1 17.9
0
20
40
60
80
100
Rebelliousness
Year 6 Year 8 Year 10 Year 8 Australia
16.725.3 30.5
24.9
0
20
40
60
80
100
Sensation seeking
Year 6 Year 8 Year 10 Year 8 Australia
0 10 20 30 40 50 60 70 80 90 100
Rewards for antisocial behaviour
Rebelliousness
Friends’ use of drugs
Sensation seeking
Favourable attitude towards drug use
Prevalence of Peer/Individual Risk Factors

Communities That Care Warrnambool - Prevention is Possible: community profile and action planPage 20 Communities That Care Warrnambool - Prevention is Possible: community profile and action plan Page 20
Risk Factors Incline with Age There is a concerning increase in the prevalence of risk factors moving from grade 6 to year 8 and a further rise to year 10. This means that older adolescents are much more exposed to risk factors, increasing the likelihood of adverse outcomes. This is compounded by a corresponding reduction in protective factors with age, exacerbating the prevalence of problematic behaviours.
Risk Factors by Domain The average prevalence of the risk factors in the school domain are much higher than all the other domains. This means that a much higher proportion of young people are exposed to risk factors in the school domain.
Protective Factors
Community Protective Factors Community opportunities for prosocial involvement
When opportunities for positive participation are available in a community, children are more likely to become bonded to the community.
13.024.3
36.125.8
0.0
20.0
40.0
60.0
80.0
100.0
Average prevalence of risk factors
Year 6 Year 8 Year 10 Year 8 Australia
21.227.5
43.2
17.9
0
20
40
60
80
100
Average prevalence of risk factors
Community Family School Individual/peer
71.8 66.9 65.8 65.5
0
20
40
60
80
100
Community opportunities for prosocial involvement
Year 6 Year 8 Year 10 Year 8 Australia

Communities That Care Warrnambool - Prevention is Possible: community profile and action plan Page 21 Communities That Care Warrnambool - Prevention is Possible: community profile and action plan Page 21
Community rewards for prosocial involvement
Recognition for positive participation in community activities helps children bond to the community, thus lowering their risk for problem behaviours.
The following is an estimate of the prevalence of each community protective factor for adolescents in Warrnambool (derived by averaging the prevalence of each age class).
Family Protective Factors Family attachment
Young people who feel strongly bonded to their family are less likely to engage in substance use and other problem behaviours.
Family opportunities for prosocial involvement
Young people who have more opportunities to participate meaningfully in the responsibilities and activities of the family are more likely to develop strong bonds to the family.
82.6 78 76.1 77.1
0
20
40
60
80
100
Community rewards for prosocial involvement
Year 6 Year 8 Year 10 Year 8 Australia
0 10 20 30 40 50 60 70 80 90 100
Community rewards for prosocial involvement
Community opportunities for prosocial involvement
Prevalence of Community Protective Factors
90.1
72.662.4
72.9
0
20
40
60
80
100
Family attachment
Year 6 Year 8 Year 10 Year 8 Australia
76.5
49.142.5
48.8
0
20
40
60
80
100
Family opportunities for prosocial involvement
Year 6 Year 8 Year 10 Year 8 Australia

Communities That Care Warrnambool - Prevention is Possible: community profile and action planPage 22 Communities That Care Warrnambool - Prevention is Possible: community profile and action plan Page 22
Family rewards for prosocial involvement
When parents, siblings, and other family members praise, encourage and recognise things done well by their child, children are more likely to develop strong bonds to the family.
The following is an estimate of the prevalence of each family protective factor for adolescents in Warrnambool (derived by averaging the prevalence of each age class).
School Protective Factors School opportunities for prosocial involvement
When young people are given more opportunities to participate meaningfully in the classroom and school, they are more likely to develop strong bonds of attachment and commitment to school.
75.2
50.9
37.5
50.6
0
20
40
60
80
100
Family rewards for prosocial involvement
Year 6 Year 8 Year 10 Year 8 Australia
0 10 20 30 40 50 60 70 80 90 100
Family attachment
Family opportunities for prosocial involvement
Family rewards for prosocial involvement
Prevalence of Family Protective Factors
62.9
40.129.5
37.1
0
20
40
60
80
100
School opportunities for prosocial involvement
Year 6 Year 8 Year 10 Year 8 Australia

Communities That Care Warrnambool - Prevention is Possible: community profile and action plan Page 23 Communities That Care Warrnambool - Prevention is Possible: community profile and action plan Page 23
School rewards for prosocial involvement
When young people are recognised for their contributions, efforts and progress in school, they are more likely to develop strong bonds of attachment and commitment to school.
The following is an estimate of the prevalence of each school protective factor for adolescents in Warrnambool (derived by averaging the prevalence of each age class).
Peer/Individual Protective Factors Belief in the moral order
Young people who have a belief in what is ‘right’ or ‘wrong’ are less likely to use drugs or engage in delinquent or other problem behaviours.
Interaction with pro-social peers
Young people who interact with other young people who display pro-social behaviour are less likely to engage in substance use and other problem behaviours.
61
26.418.7
34
0
20
40
60
80
100
School rewards for prosocial involvement
Year 6 Year 8 Year 10 Year 8 Australia
0 10 20 30 40 50 60 70 80 90 100
School opportunities for prosocial involvement
School rewards for prosocial involvement
Prevalence of School Protective Factors
81.4
53.7 54.5
68.4
0
20
40
60
80
100
Belief in moral order
Year 6 Year 8 Year 10 Year 8 Australia
83.772 69 69.5
0
20
40
60
80
100
Interaction with prosocial peers
Year 6 Year 8 Year 10 Year 8 Australia

Communities That Care Warrnambool - Prevention is Possible: community profile and action planPage 24 Communities That Care Warrnambool - Prevention is Possible: community profile and action plan Page 24
Coping with stress - Adaptive
When young people demonstrate positive coping strategies in stressful situations they are less likely to engage in substance use and other problem behaviours.
Emotional control
Young people who demonstrate emotional control are less likely to engage in substance use and problem behaviours and experience less depression.
Social competencies
Young people with strong social competencies are more likely to resist peer pressure to engage in substance use and antisocial behaviour.
Religiosity
Young people who follow a religion are less likely to engage in problem behaviour.
71.5
53.945.4
53.8
0
20
40
60
80
100
Coping with stress - Adaptive
Year 6 Year 8 Year 10 Year 8 Australia
70.458.4
49.662.4
0
20
40
60
80
100
Emotional control
Year 6 Year 8 Year 10 Year 8 Australia
61.9
41.6 37.247.4
0
20
40
60
80
100
Social competencies
Year 6 Year 8 Year 10 Year 8 Australia
59.753 52.5 55.5
0
20
40
60
80
100
Religiosity
Year 6 Year 8 Year 10 Year 8 Australia

Communities That Care Warrnambool - Prevention is Possible: community profile and action plan Page 25 Communities That Care Warrnambool - Prevention is Possible: community profile and action plan Page 25
The following is an estimate of the prevalence of each peer/individual protective factor for adolescents in Warrnambool (derived by averaging the prevalence of each age class).
Protective Factors Decline with Age There is a concerning drop in the prevalence of protective factors moving from grade 6 to year 8 and a further drop to year 10. This means that older adolescents are much less protected from risk factors, increasing the likelihood of adverse outcomes. This is compounded by a corresponding increase in risk factors with age, exacerbating the prevalence of problematic behaviours.
Protective Factors by Domain The average prevalence of the protective factors in the school domain are much lower than all the other domains. There is an opportunity to increase the proportion of young people benefiting from protective factors in the school domain.
0 10 20 30 40 50 60 70 80 90 100
Interaction with prosocial peers
Belief in moral order
Emotional control
Coping with stress - Adaptive
Religiosity
Social competencies
Prevalence of Peer/Individual Protective Factors
73.0
55.149.3
57.2
0.0
20.0
40.0
60.0
80.0
100.0
Average prevalence of protective factors
Year 6 Year 8 Year 10 Year 8 Australia
77.2 80.6
62.071.4
0
20
40
60
80
100
Average prevalence of protective factors
Community Family School Individual/peer

Communities That Care Warrnambool - Prevention is Possible: community profile and action planPage 26 Communities That Care Warrnambool - Prevention is Possible: community profile and action plan Page 26
Principles Influencing the Selection of Priority Factors
Malleability Funds invested in delivering evidence-based prevention programmes would be better spent on programmes which have been demonstrated to be effective in addressing the priority risk and protective factors. Conversely, it would make sense to consider selecting as a priority those factors which have been shown to be subject to influence from prevention programmes. While a factor may indeed be strongly associated with an adverse health or behaviour problem we are trying to address, there is no point selecting it as a priority if no evaluation has concluded that it has been changed through prevention efforts.
To address this only those risk and protective factors which have been identified in the Guide to Australian Prevention Strategies as being subject to change from one of the listed evidence-based programmes will be considered.
Domains In the framework used, risk and protective factors exist within four domains: community, school, family and individual/peer. If prevention efforts ignore one or more domains, high risk factors and low protective factors can undermine and negate efforts in the other domains. For example efforts to address school failure (school domain) would be undermined unless poor family management (family domain) where children were going to school without breakfast was also addressed. Therefore the spread of priority factors across domains would be more effective than the same effort targeting factors in limited domains.
Number of Priority Factors Theoretically a community could attempt to address all risk and protective factors equally. This would most likely lead to such a diffuse effort that it would be unlikely to significantly change any factor, and therefore the resultant health and behavioural outcomes would remain unaffected despite all the effort. If the prevention effort is focused on a small number of factors and most prevention efforts in the community are mutually reinforcing and rally around the goal of shifting a handful of factors, then those efforts are much more likely to be effective. Adolescents with the reduced number of risk factors and/or greater number of protective factors are then less likely to develop preventable health and behavioural problems, reducing the rate of those problems at a population level.
At the extreme, a community could select only one factor. However, this would result in such a narrow focus that the prevention effort would not adequately address the breadth and complexity of the system that gives rise to the range of adolescent problems we are endeavouring to address.
The optimum is to select between three and five factors (inclusive). Invariably other factors will end up being addressed anyway, as programmes selected to address the priority factors often also positively impact on a range of other factors.
Risk vs Protective Factors There is a complex interaction between the number of risk factors in a young person’s life, the number of protective factors and the likelihood of them going on to develop preventable health or behavioural problems. The adverse impact of additional risk factors is not just additive: as the number of risk factors increases, the probability of problems increases exponentially. Also, for any given number of risk factors, increasing the number of protective factors progressively reduces the probability of adverse outcomes. However, beyond a threshold number of risk factors, this moderating effect of protective factors does not hold. In fact, those with a very high number of risk factors are not likely to have any protective factors. This has implications for the balance of risk versus protective factors included in the set of priority factors. While building protective factors is effective in reducing the likelihood of adverse outcomes, particularly for those with few risk factors, it is most important to reduce the total number of risk factors.

Communities That Care Warrnambool - Prevention is Possible: community profile and action plan Page 27 Communities That Care Warrnambool - Prevention is Possible: community profile and action plan Page 27
Prevalence The most important consideration in comparing risk factors to prioritise for targeting with evidence-based prevention programmes is the proportion of adolescents in the local community subject to the influence of each factor. In order to reduce the proportion of adolescents in the community with any particular health and behavioural problem, it makes sense to focus on those risk factors with a high prevalence, as a reduction in that factor will impact more people. For example if two risk factors were the driving influence behind an adverse outcome for young people we were trying to change and risk factor A was present in the lives of 4% of adolescents and risk factor B was present in 80% of the adolescent population, if prevention efforts could successfully remove a risk factor for one in four people, focusing on risk factor B would help twenty times more people than focusing on risk factor A. Of course it is more complex than that, as there are interactions between the factors and various factors can impact outcomes to varying degrees, however the principle is still valid that to have an impact on adolescent health and behavioural problems at a population level it is more effective to target risk factors with the higher prevalence.
Comparisons to Victorian or Australian averages are interesting and serve to provide some context to understanding how we are going as a community, however even if the local levels are statistically significantly different to State or national averages, that has no bearing on what the local levels mean for our community and how they inform choices about how we address local problems with locally implemented programmes. For this reason comparisons (where available) are included in the initial overview of risk and protective factors and are subsequently excluded from consideration in the selection of factors to prioritise for targeting.
While the data disaggregated to year level is available and corresponding figures in the Profile Report are referred to, as each factor has a different profile with different prevalence level for each year level, this makes it difficult to compare factor against factor. Factors are selected for prioritising overall as opposed to sets being selected differentially for each year level. Therefore for the purpose of generating a rank order list with the relative prevalence across the combined adolescent cohort, for each factor the prevalence levels for years 6, 8 and 10 were averaged. This would be indicative of the proportion of adolescents influenced by each factor.
Recommendations in the Youth Survey Report Another variable that was taken into consideration were the recommendations in the Youth Survey Report for which factors to prioritise. Based on the results, the authors of the report make the following recommendations:
1. Set risk factor targets to reduce early age alcohol use: consider prioritising reduced favourable attitudes to substance use and availability.
2. Set risk factor targets to improve school commitment. 3. Set risk factor targets to increase the effectiveness of parents and families: consider targets to reduce family
conflict and favourable family attitudes to substance use.
Relative Prevalence of Factors The following is an estimate of the prevalence of each risk factor for adolescents in Warrnambool (derived by averaging the prevalence of each age class). Those not listed as subject to change by any of the programmes in the Guide to Australian Prevention Strategies have been excluded. Those with a prevalence of less than 25% of the population have been excluded.

Communities That Care Warrnambool - Prevention is Possible: community profile and action planPage 28 Communities That Care Warrnambool - Prevention is Possible: community profile and action plan Page 28
The risk and protective factors selected for targeting.
The following is an estimate of the prevalence of each protective factor for adolescents in Warrnambool (derived by averaging the prevalence of each age class). Those not listed as subject to change by any of the programmes in the Guide to Australian Prevention Strategies have been excluded. Those with a prevalence of greater than 60% of the population have been excluded.
0 10 20 30 40 50 60 70 80 90 100
Parental attitudes favourable to drug use (F)
Perceived availability of drugs (C)
Favourable attitude towards drug use (P/I)
Poor family management (F)
Low community attachment (C)
Family conflict (F)
Laws/norms favourable to substance use (C)
Low commitment to school (S)
Prevalence of Risk Factors
0 10 20 30 40 50 60 70 80 90 100
Emotional control
Coping with stress - Adaptive
Family opportunities for prosocial involvement
Religiosity
Family rewards for prosocial involvement
Social competencies
School opportunities for prosocial involvement
School rewards for prosocial involvement
Prevalence of Protective Factors
Communities That Care Warrnambool - Prevention is Possible: community profile and action plan Page 29 Communities That Care Warrnambool - Prevention is Possible: community profile and action plan Page 29
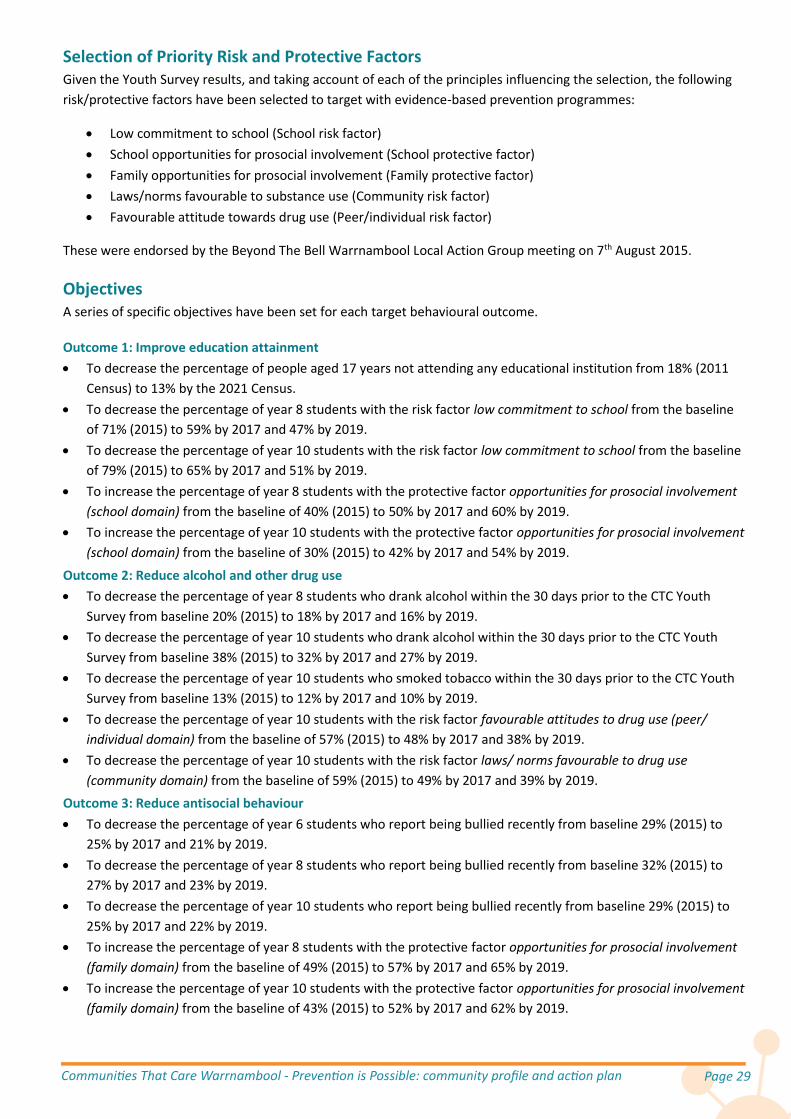
Selection of Priority Risk and Protective Factors Given the Youth Survey results, and taking account of each of the principles influencing the selection, the following risk/protective factors have been selected to target with evidence-based prevention programmes:
Low commitment to school (School risk factor) School opportunities for prosocial involvement (School protective factor) Family opportunities for prosocial involvement (Family protective factor) Laws/norms favourable to substance use (Community risk factor) Favourable attitude towards drug use (Peer/individual risk factor)
These were endorsed by the Beyond The Bell Warrnambool Local Action Group meeting on 7th August 2015.
Objectives A series of specific objectives have been set for each target behavioural outcome.
Outcome 1: Improve education attainment To decrease the percentage of people aged 17 years not attending any educational institution from 18% (2011
Census) to 13% by the 2021 Census. To decrease the percentage of year 8 students with the risk factor low commitment to school from the baseline
of 71% (2015) to 59% by 2017 and 47% by 2019. To decrease the percentage of year 10 students with the risk factor low commitment to school from the baseline
of 79% (2015) to 65% by 2017 and 51% by 2019. To increase the percentage of year 8 students with the protective factor opportunities for prosocial involvement
(school domain) from the baseline of 40% (2015) to 50% by 2017 and 60% by 2019. To increase the percentage of year 10 students with the protective factor opportunities for prosocial involvement
(school domain) from the baseline of 30% (2015) to 42% by 2017 and 54% by 2019. Outcome 2: Reduce alcohol and other drug use To decrease the percentage of year 8 students who drank alcohol within the 30 days prior to the CTC Youth
Survey from baseline 20% (2015) to 18% by 2017 and 16% by 2019. To decrease the percentage of year 10 students who drank alcohol within the 30 days prior to the CTC Youth
Survey from baseline 38% (2015) to 32% by 2017 and 27% by 2019. To decrease the percentage of year 10 students who smoked tobacco within the 30 days prior to the CTC Youth
Survey from baseline 13% (2015) to 12% by 2017 and 10% by 2019. To decrease the percentage of year 10 students with the risk factor favourable attitudes to drug use (peer/
individual domain) from the baseline of 57% (2015) to 48% by 2017 and 38% by 2019. To decrease the percentage of year 10 students with the risk factor laws/ norms favourable to drug use
(community domain) from the baseline of 59% (2015) to 49% by 2017 and 39% by 2019. Outcome 3: Reduce antisocial behaviour To decrease the percentage of year 6 students who report being bullied recently from baseline 29% (2015) to
25% by 2017 and 21% by 2019. To decrease the percentage of year 8 students who report being bullied recently from baseline 32% (2015) to
27% by 2017 and 23% by 2019. To decrease the percentage of year 10 students who report being bullied recently from baseline 29% (2015) to
25% by 2017 and 22% by 2019. To increase the percentage of year 8 students with the protective factor opportunities for prosocial involvement
(family domain) from the baseline of 49% (2015) to 57% by 2017 and 65% by 2019. To increase the percentage of year 10 students with the protective factor opportunities for prosocial involvement
(family domain) from the baseline of 43% (2015) to 52% by 2017 and 62% by 2019.

Communities That Care Warrnambool - Prevention is Possible: community profile and action planPage 30 Communities That Care Warrnambool - Prevention is Possible: community profile and action plan Page 30
Inventory of Existing Programmes CTC Warrnambool conducted an inventory of existing programmes that address the wellbeing of children and young people who live or go to school in Warrnambool. Two hundred programmes were identified. A gap analysis was conducted. This process is detailed in Communities That Care Warrnambool Community Resources Assessment Report.
Programme Selection There are evidence-based prevention programmes currently running targeting early childhood or parents with young children. The Youth Survey results indicated that this cohort have relatively low risk and high protection. This is in stark contrast to the adolescents, who have high levels of risk and low protection, particularly in the family and school domains. In order to get a substantial change in risk/protective factors over the next one to three years, it was decided that this round the focus would be on those who will be moving into year 8 or 10 sometime over the next three years. So the primary target group is 10-14 year olds. Programmes run locally or which have run successfully elsewhere have been selected which:
are evidence-based (evaluation in a peer-reviewed journal which concludes the programme is effective) are prevention-focused (not intervention-focused) universal (rather than targeted or selected) directly address priority risk/protective factors target the 10 – 14 year old cohort
Logic Model
Priority Risk /Protective Factors Target Behavioural Outcomes
Decrease laws and norms favourable to substance use (Community risk factor)
Decrease favourable attitudes towards drug use (Peer/ individual risk factor)
Increase family opportunities for prosocial involvement (Family protective factor)
Improve education attainment Reduce alcohol and other drug use Reduce antisocial behaviour
Decrease low commitment to school (School risk factor)
Increase school opportunities for prosocial involvement (School protective factor)

Communities That Care Warrnambool - Prevention is Possible: community profile and action plan Page 31
Communities That Care Warrnambool - Prevention is Possible: community profile and action plan Page 31
Programmes / Strategies Priority Risk /Protective Factors
Social Marketing and Community Mobilisation to Reduce Alcohol-Related Harm
Reducing Access to Alcohol for Young People Under 18
Decrease laws and norms favourable to substance use (Community risk factor)
Reducing Access to Tobacco for Young People Under 18
Decrease favourable attitudes towards drug use (Peer/ individual risk factor)
Research and Evaluation Consultancy
Increase family opportunities for prosocial involvement (Family protective factor)
Prevention Planning for 2017
Decrease low commitment to school (School risk factor)
Resilient Families / PACE
Increase school opportunities for prosocial involvement (School protective factor)
The Good Behaviour Game
You Can Do It! Education

Communities That Care Warrnambool - Prevention is Possible: community profile and action planPage 32 Communities That Care Warrnambool - Prevention is Possible: community profile and action plan Page 32
Selected Programmes
Social marketing and community mobilisation to reduce alcohol-related harms
Description A new social marketing intervention is being developed and trialled in a partnership between Deakin University and CTC Ltd. The intervention has been designed using an evidence-based behaviour change approach called the Theory of Planned Behaviour. The social marketing intervention focuses on alerting parents and adolescents to the National Health and Medical Research Council (2009) guidelines for safe alcohol use, and seeks to convince parents and adolescents to set agreements that adults will not supply alcohol to underage youth.
Evaluation Evidence Evidence from community mobilisation interventions suggest that multi-level, targeted prevention programmes are effective at reducing adolescent alcohol use. In the US, Project Northland combined community-wide taskforce education with peer leadership and parental involvement/education to achieve a small but significant reduction in weekly adolescent alcohol use in those exposed to the intervention, compared to the control group. Australian programmes have also achieved success in reducing alcohol-related harm through a combination of community mobilisation (evident through increased media activity, the formation of coalitions and groups and increased community awareness and concern for alcohol-related harm) and social marketing strategies (Cooper, Midford, Jaeger, & Hall, 2001; Midford & Boots, 1999).
Target Audience 11 – 17 years old
Target Risk Factors Community disorganisation Perceived availability of drugs (alcohol) Laws and norms favourable to drug use Parental attitudes favourable to problem
behaviour Favourable attitudes to alcohol use
Target Protective Factors Community attachment Community opportunities for prosocial
involvement Community rewards for prosocial involvement
Community Indicators High rates on indicators of youth alcohol-
related harm High rates of alcohol misuse

Communities That Care Warrnambool - Prevention is Possible: community profile and action plan Page 33
Communities That Care Warrnambool - Prevention is Possible: community profile and action plan Page 33
Reducing access to alcohol for young people under age 18
Description A research partnership between Deakin University and CTC Ltd. is developing and testing an intervention to check retailer compliance with minimum age laws for alcohol sales. Purchase attempts are monitored for a young person who looks to be under the legal age for alcohol purchase. Retailers receive information about the purchase attempt and the law. This strategy is supported through media stories and public information. In subsequent years the strategy may be expanded to discourage other community practices that increase the availability to minors including secondary supply (adults buying and providing alcohol to minors) and the promotion of child-friendly alcohol products such as the discounting of alcopops (premixed sweetened alcohol products).
Evaluation Evidence Evidence shows that enforcement of liquor laws can increase compliance with minimum age laws. A US intervention to increase retailer compliance with underage sales laws used a strategy of compliance checks coupled with media advocacy to deter retailers from selling alcohol to minors (Scribner & Cohen, 2001). The evaluation found substantial gains in compliance (51%) among retailers who were issued with citations for failing compliance checks, as well as gains in compliance for those who had not been cited (35%).
Target Audience 11 – 17 years old
Target Risk Factors Community disorganisation Perceived availability of drugs (alcohol) Laws and norms favourable to drug use
Community Indicators Alcohol sales to young people
under age 18 High rates of youth alcohol use

Communities That Care Warrnambool - Prevention is Possible: community profile and action planPage 34
Communities That Care Warrnambool - Prevention is Possible: community profile and action plan Page 34
Reducing access to tobacco for young people under age 18
Description Compliance checks and enforcement of legislation banning sales to young people under age 18 can reduce smoking prevalence in this group. Compliance checks involve a young person that appears to be under the legal age seeking to purchase tobacco products from a retailer. Retailers that comply with current legislation by refusing to sell tobacco receive a letter advising of the monitoring program and its outcome. Retailers that fail to comply can receive a warning letter or penalty. In general, penalties are increased for second and subsequent offences.
Evaluation Evidence Evidence suggests that it is possible to reduce tobacco use in young people through the application of a combination of regulatory, early-intervention and harm-reduction approaches. A Cochrane Review of interventions to reduce tobacco sales to minors found evidence to support compliance checks and enforcement of legislation as effective strategies for restricting tobacco access for minors (Stead & Lancaster, 2005). A Sydney study which sent retailers a warning letter threatening prosecution if they failed to comply with legislation resulted in a second offence rate of 31% compared to 60% amongst retailers who had not been warned.
Target Audience 11 – 17 years old
Target Risk Factors Community disorganisation Perceived availability of drugs (tobacco) Laws and norms favourable to drug use
Community Indicators Tobacco sales to young people
under age 18 High rates of youth tobacco use

Communities That Care Warrnambool - Prevention is Possible: community profile and action plan Page 35
Communities That Care Warrnambool - Prevention is Possible: community profile and action plan Page 35
Resilient Families / Parenting Adolescents: A Creative Experience (PACE)
Description The school-based Resilient Families prevention programme is designed to develop the knowledge, skills and support networks of students and their parents in order to promote adolescent health and wellbeing. The program consists of the following five intervention components: 1) a 10-session curriculum for students; 2) the Parenting Adolescents Quiz (PAQ) evening; 3) Parenting Adolescents: a Creative Experience (PACE); 4) policies and processes implemented by the school to build a community of parents to enhance support for, and communication with, parents during the early secondary school years; and 5) parent education handbooks. The PACE programme is an 8-week sequential parenting programme that comprises one of the five components of the Resilient Families program. This programme is based on an adult learning model and follows a curriculum that covers adolescent communication, conflict resolution and adolescent development (Jenkin & Bretherton, 1994).
Evaluation Evidence A Victorian evaluation of the programme found that students in the intervention schools reported increases in family attachment and high school rewards compared to control schools (Shortt, Hutchinson, Chapman, & Toumbourou, 2007). Students whose parents attended the extended parent education group (8 week PACE group) were more than twice as likely as their peers to report positive problem solving at follow-up. The PACE programme demonstrated positive outcomes in a large quasi-experimental study in Australia. At the twelve-week follow-up parents and adolescents reported a reduction in family conflict and adolescents reported increased maternal care, less delinquency and less substance use (Toumbourou & Gregg, 2002).
Target Audience 11 – 14 years old
Target Risk Factors Poor family management Poor discipline Family conflict Parental attitudes favourable to problem
behaviour Low commitment to school Low family attachment
Target Protective Factors Family attachment Family opportunities for prosocial involvement Family rewards for prosocial involvement Social skills
Community Indicators Sole parents Parental social isolation Poor links between schools, families and family
services

Communities That Care Warrnambool - Prevention is Possible: community profile and action planPage 36
Communities That Care Warrnambool - Prevention is Possible: community profile and action plan Page 36
The Good Behaviour Game
Description The Good Behaviour Game (GBG) has been carefully designed to provide a feasible method for introducing a positive classroom discipline system. Classroom disruptions in school can increase aggressive peer behaviour and trigger early pathways to behaviour problems such as violence, aggression and attention and impulsivity problems. Positive discipline practices are well known to assist in reducing behaviour problems and are more effective where they can be reinforced with positive peer support.
Evaluation Evidence A number of randomised trials support the effectiveness of the GBG as a strategy for improving classroom management and reducing student behaviour problems. Outcomes for GBG students include reductions in rates of attention-deficit/ hyperactivity problems, oppositional defiant problems and conduct problems relative to control classrooms (van Lier, Muthén, van der Sar, & Crijnen, 2004).
Target Audience 5 – 13 years old
Target Risk Factors Low commitment to school Antisocial behaviour Peer rewards for antisocial involvement
Target Protective Factors School opportunities for prosocial involvement School rewards for prosocial involvement Social skills Belief in the moral order
Community Indicators Low parental education School suspension School truancy Low income, poor housing, unemployment Bullying
Communities That Care Warrnambool - Prevention is Possible: community profile and action plan Page 37
Communities That Care Warrnambool - Prevention is Possible: community profile and action plan Page 37
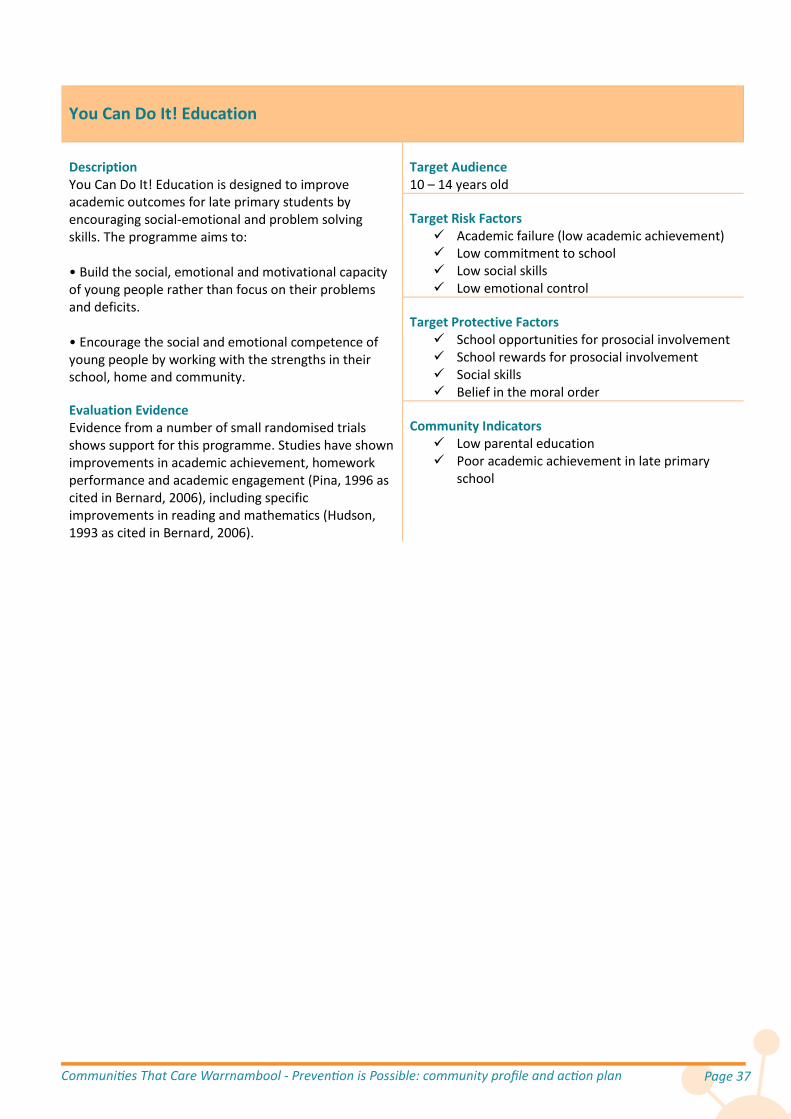
You Can Do It! Education
Description You Can Do It! Education is designed to improve academic outcomes for late primary students by encouraging social-emotional and problem solving skills. The programme aims to: • Build the social, emotional and motivational capacity of young people rather than focus on their problems and deficits. • Encourage the social and emotional competence of young people by working with the strengths in their school, home and community.
Evaluation Evidence Evidence from a number of small randomised trials shows support for this programme. Studies have shown improvements in academic achievement, homework performance and academic engagement (Pina, 1996 as cited in Bernard, 2006), including specific improvements in reading and mathematics (Hudson, 1993 as cited in Bernard, 2006).
Target Audience 10 – 14 years old
Target Risk Factors Academic failure (low academic achievement) Low commitment to school Low social skills Low emotional control
Target Protective Factors School opportunities for prosocial involvement School rewards for prosocial involvement Social skills Belief in the moral order
Community Indicators Low parental education Poor academic achievement in late primary
school

Communities That Care Warrnambool - Prevention is Possible: community profile and action planPage 38 Communities That Care Warrnambool - Prevention is Possible: community profile and action plan Page 38
Programmes for Consideration
Friendly Schools and Families/ Friendly Schools Plus
Description Friendly School and Families is a whole-school bullying prevention programme that incorporates evidence-based strategies to manage and prevent bullying in schools. The programme provides resources to build school capacity to systematically respond to bullying and provides strategies to parents, teachers and students to effectively prevent and manage bullying. Friendly Schools Plus extends and updates the Friendly Schools and Families program, incorporating an additional 6 years of research into best-practice bullying prevention processes. Friendly Schools Plus incorporates evidence-based strategies to deal with cyber-bullying in schools.
Evaluation Evidence A three year effectiveness trial called Friendly Schools Friendly Families demonstrated positive outcomes for students exposed to the intervention. These students experienced a significant reduction in bullying behaviour, greater feelings of safety and happiness at school and an increase in social skills relative to the students in schools that did not receive the programme (Cross et al., 2010).
Target Audience 6 – 14 years old
Target Risk Factors Low commitment to school Antisocial behaviour Favourable attitudes to problem behaviour Low social skills Interaction with antisocial peers
Target Protective Factors School and family attachment School and family opportunities for prosocial
involvement School and family rewards for prosocial
involvement Social skills
Community Indicators School bullying

Communities That Care Warrnambool - Prevention is Possible: community profile and action plan Page 39
Communities That Care Warrnambool - Prevention is Possible: community profile and action plan Page 39
FRIENDS for Life
Description FRIENDS for Life (FRIENDS) is a 10-session cognitive behaviour therapy programme designed to prevent anxiety and depression in children and young people. The programme teaches practical behavioural, physiological and cognitive strategies to identify and deal with anxiety that children and young people experience. The programme also builds emotional resilience and promotes self-development. FRIENDS is effective as a treatment or as a school-based prevention course and can be delivered by teachers in a school system.
Evaluation Evidence Evaluation evidence supports the benefits of the FRIENDS programme in preventing and treating anxiety. An evaluation of the effectiveness of the programme with Grade 6 students found reduced symptoms of anxiety, and increased coping skills, relative to control students (Lock & Barrett, 2003). A follow up study showed beneficial effects were maintained at 12 months, 24 months and 36 months. A Grade 9 implementation was less effective. The FRIENDS intervention is being implemented internationally and the website reports a number of favourable evaluations.
Target Audience 10 – 14 years old
Target Risk Factors Poor coping skills Antisocial behaviour Favourable attitudes to problem behaviour Interaction with antisocial peers
Target Protective Factors Social skills Emotional control
Community Indicators Mental health problems in children and
adolescents Depressive symptoms in late primary school
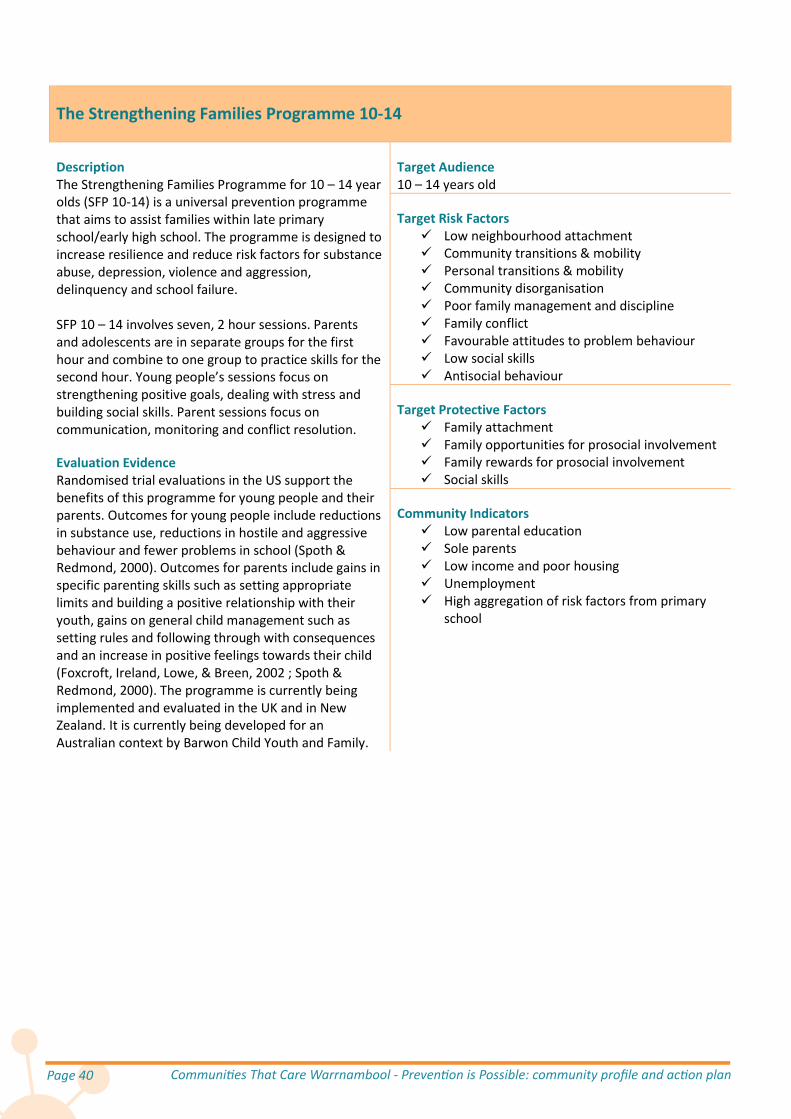
Communities That Care Warrnambool - Prevention is Possible: community profile and action planPage 40
Communities That Care Warrnambool - Prevention is Possible: community profile and action plan Page 40
The Strengthening Families Programme 10-14
Description The Strengthening Families Programme for 10 – 14 year olds (SFP 10-14) is a universal prevention programme that aims to assist families within late primary school/early high school. The programme is designed to increase resilience and reduce risk factors for substance abuse, depression, violence and aggression, delinquency and school failure. SFP 10 – 14 involves seven, 2 hour sessions. Parents and adolescents are in separate groups for the first hour and combine to one group to practice skills for the second hour. Young people’s sessions focus on strengthening positive goals, dealing with stress and building social skills. Parent sessions focus on communication, monitoring and conflict resolution.
Evaluation Evidence Randomised trial evaluations in the US support the benefits of this programme for young people and their parents. Outcomes for young people include reductions in substance use, reductions in hostile and aggressive behaviour and fewer problems in school (Spoth & Redmond, 2000). Outcomes for parents include gains in specific parenting skills such as setting appropriate limits and building a positive relationship with their youth, gains on general child management such as setting rules and following through with consequences and an increase in positive feelings towards their child (Foxcroft, Ireland, Lowe, & Breen, 2002 ; Spoth & Redmond, 2000). The programme is currently being implemented and evaluated in the UK and in New Zealand. It is currently being developed for an Australian context by Barwon Child Youth and Family.
Target Audience 10 – 14 years old
Target Risk Factors Low neighbourhood attachment Community transitions & mobility Personal transitions & mobility Community disorganisation Poor family management and discipline Family conflict Favourable attitudes to problem behaviour Low social skills Antisocial behaviour
Target Protective Factors Family attachment Family opportunities for prosocial involvement Family rewards for prosocial involvement Social skills
Community Indicators Low parental education Sole parents Low income and poor housing Unemployment High aggregation of risk factors from primary
school

Communities That Care Warrnambool - Prevention is Possible: community profile and action plan Page 41 Communities That Care Warrnambool - Prevention is Possible: community profile and action plan Page 41
Prevention Planning for 2017 During 2016 CTC Warrnambool will work with schools and other agencies to select and plan for programmes to be implemented in 2017. Programmes for consideration could include those detailed in this Plan or other evidence-based prevention programmes.
Research and Evaluation Consultancy One thing that became evident through the inventory of existing programmes and the gap analysis conducted as part of the Resource Assessment process was that many existing programmes do not have a strong evidence base. In addition to identifying and scaling up existing evidence-based programmes being run locally and introducing other evidence-based programmes which have been run successfully elsewhere, there is a need to support existing programmes to build up the degree to which they are evidence-based. This can be achieved through the provision of a service providing advice on incorporating evidence-based strategies into existing local programmes and also by designing and/or implementing evaluation processes. This will result in both building up local capacity and also will increase the effectiveness of programmes, with the flow-on effect of improved outcomes.
Further Information Our vision is that every child and young person who lives or attends school in Warrnambool has the environment, connections and opportunities to build physical, mental and social wellbeing.
Thank you for being part of making this happen.
If you have any questions or would like to support Communities That Care Warrnambool, please contact the Communities That Care Coordinator Cameron Price on 5561 8877 or email [email protected].
For further information go to http://ctcwarrnambool.com.

Communities That Care Warrnambool - Prevention is Possible: community profile and action planPage 42