cs 147: computer systems performance analysis - advanced
TRANSCRIPT

CS 147:Computer Systems Performance Analysis
Advanced Regression Techniques
1 / 31
CS 147:Computer Systems Performance Analysis
Advanced Regression Techniques
2015
-06-
15
CS147
Overview
Curvilinear RegressionCommon TransformationsGeneral Transformations
Handling Outliers
Common Mistakes
2 / 31
Overview
Curvilinear RegressionCommon TransformationsGeneral Transformations
Handling Outliers
Common Mistakes
2015
-06-
15
CS147
Overview

Curvilinear Regression
Curvilinear Regression
I Linear regression assumes a linear relationship betweenpredictor and response
I What if it isn’t linear?I You need to fit some other type of function to the relationship
3 / 31
Curvilinear Regression
I Linear regression assumes a linear relationship betweenpredictor and response
I What if it isn’t linear?I You need to fit some other type of function to the relationship
2015
-06-
15
CS147Curvilinear Regression
Curvilinear Regression

Curvilinear Regression
When To Use Curvilinear Regression
I Easiest to tell by sightI Make a scatter plot
I If plot looks non-linear, try curvilinear regressionI Or if non-linear relationship is suspected for other reasonsI Relationship should be convertible to a linear form
4 / 31
When To Use Curvilinear Regression
I Easiest to tell by sightI Make a scatter plot
I If plot looks non-linear, try curvilinear regressionI Or if non-linear relationship is suspected for other reasonsI Relationship should be convertible to a linear form
2015
-06-
15
CS147Curvilinear Regression
When To Use Curvilinear Regression

Curvilinear Regression Common Transformations
Types of Curvilinear Regression
I Many possible types, based on a variety of relationships:I y = axb
I y = a + b/xI y = abx
I Etc., ad infinitum
5 / 31
Types of Curvilinear Regression
I Many possible types, based on a variety of relationships:I y = axb
I y = a + b/xI y = abx
I Etc., ad infinitum
2015
-06-
15
CS147Curvilinear Regression
Common TransformationsTypes of Curvilinear Regression
Curvilinear Regression Common Transformations
Transform Them to Linear Forms
I Apply logarithms, multiplication, division, whatever to producesomething in linear form
I I.e., y = a + b × somethingI Or a similar form
I If predictor appears in more than one transformed predictorvariable, correlation is likely!
6 / 31
Transform Them to Linear Forms
I Apply logarithms, multiplication, division, whatever to producesomething in linear form
I I.e., y = a + b × somethingI Or a similar form
I If predictor appears in more than one transformed predictorvariable, correlation is likely!
2015
-06-
15
CS147Curvilinear Regression
Common TransformationsTransform Them to Linear Forms
Curvilinear Regression Common Transformations
Sample Transformations
I For y = aebx take logarithm of y , do regression onlog y = b0 + b1x , let b = b1, a = eb0
I For y = a + b log x , take log of x before fitting parameters, letb = b1, a = b0
I For y = axb, take log of both x and y , let b = b1, a = eb0
7 / 31
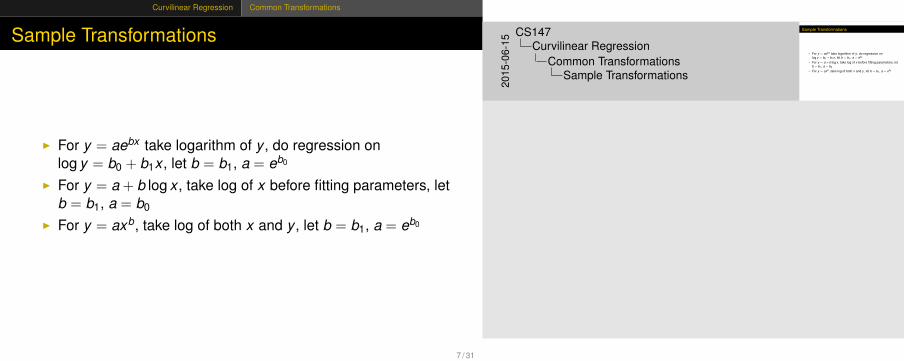
Sample Transformations
I For y = aebx take logarithm of y , do regression onlog y = b0 + b1x , let b = b1, a = eb0
I For y = a + b log x , take log of x before fitting parameters, letb = b1, a = b0
I For y = axb, take log of both x and y , let b = b1, a = eb0
2015
-06-
15
CS147Curvilinear Regression
Common TransformationsSample Transformations
Curvilinear Regression Common Transformations
Corrections to Jain p. 257(Early Editions)
Nonlinear Lineary = a + b/x y = a+b(1/x)
y = 1/(a + bx) (1/y) = a + bxy = x(a + bx) (x/y) = a + bx
y = abx ln y = ln a + x ln b
y = a + bxn y = a + b(xn)
8 / 31
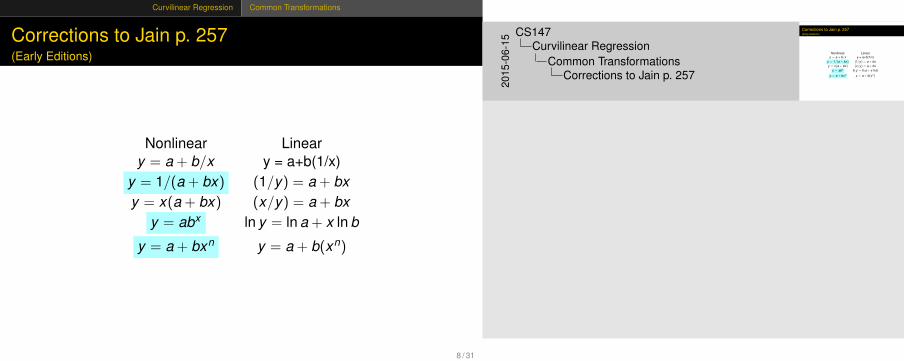
Corrections to Jain p. 257(Early Editions)
Nonlinear Lineary = a + b/x y = a+b(1/x)
y = 1/(a + bx) (1/y) = a + bxy = x(a + bx) (x/y) = a + bx
y = abx ln y = ln a + x ln b
y = a + bxn y = a + b(xn)
2015
-06-
15
CS147Curvilinear Regression
Common TransformationsCorrections to Jain p. 257

Curvilinear Regression General Transformations
General Transformations
I Use some function of response variable y in place of y itselfI Curvilinear regression is one exampleI But techniques are more generally applicable
9 / 31
General Transformations
I Use some function of response variable y in place of y itselfI Curvilinear regression is one exampleI But techniques are more generally applicable
2015
-06-
15
CS147Curvilinear Regression
General TransformationsGeneral Transformations

Curvilinear Regression General Transformations
When To Transform?
I If known properties of measured system suggest itI If data’s range covers several orders of magnitudeI If homogeneous variance assumption of residuals
(homoscedasticity) is violated
10 / 31
When To Transform?
I If known properties of measured system suggest itI If data’s range covers several orders of magnitudeI If homogeneous variance assumption of residuals
(homoscedasticity) is violated
2015
-06-
15
CS147Curvilinear Regression
General TransformationsWhen To Transform?
Curvilinear Regression General Transformations
Transforming Due To (Lack of) Homoscedasticity
I If spread of scatter plot of residual vs. predicted responseisn’t homogeneous,
I Then residuals are still functions of the predictor variablesI Transformation of response may solve the problem
11 / 31
Transforming Due To (Lack of) Homoscedasticity
I If spread of scatter plot of residual vs. predicted responseisn’t homogeneous,
I Then residuals are still functions of the predictor variablesI Transformation of response may solve the problem
2015
-06-
15
CS147Curvilinear Regression
General TransformationsTransforming Due To (Lack of)Homoscedasticity

Curvilinear Regression General Transformations
What Transformation To Use?
I Compute standard deviation of residualsI Plot as function of mean of observations
I Assuming multiple experiments for single set of predictor valuesI Check for linearity: if linear, use a log transform
I If variance against mean of observations is linear, usesquare-root transform
I If standard deviation against mean squared is linear, useinverse (1/y ) transform
I If standard deviation against mean to a power is linear, usepower transform
I More covered in the book
12 / 31
What Transformation To Use?
I Compute standard deviation of residualsI Plot as function of mean of observations
I Assuming multiple experiments for single set of predictor valuesI Check for linearity: if linear, use a log transform
I If variance against mean of observations is linear, usesquare-root transform
I If standard deviation against mean squared is linear, useinverse (1/y ) transform
I If standard deviation against mean to a power is linear, usepower transform
I More covered in the book2015
-06-
15
CS147Curvilinear Regression
General TransformationsWhat Transformation To Use?
Curvilinear Regression General Transformations
General Transformation Principle
For some observed relation between standard deviation andmean, s = g(y):
let h(y) =∫
1g(y)
dy
transform to w = h(y) and regress on w
13 / 31
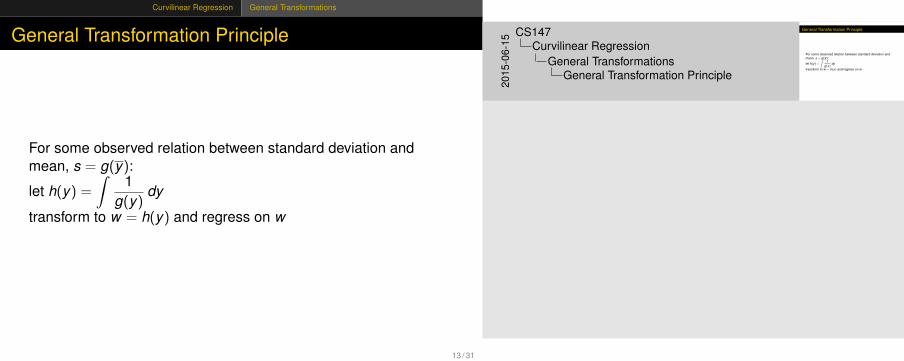
General Transformation Principle
For some observed relation between standard deviation andmean, s = g(y):
let h(y) =∫
1g(y)
dy
transform to w = h(y) and regress on w
2015
-06-
15
CS147Curvilinear Regression
General TransformationsGeneral Transformation Principle

Curvilinear Regression General Transformations
Example: Log Transformation
If standard deviation against mean is linear, then g(y) = ay
So h(y) =∫
1ay
dy =1a
ln y
14 / 31
Example: Log Transformation
If standard deviation against mean is linear, then g(y) = ay
So h(y) =∫
1ay
dy =1a
ln y
2015
-06-
15
CS147Curvilinear Regression
General TransformationsExample: Log Transformation

Curvilinear Regression General Transformations
Confidence Intervals for Nonlinear Regressions
I For nonlinear fits using general (e.g., exponential)transformations:
I Confidence intervals apply to transformed parametersI Not valid to perform inverse transformation before calculating
intervalsI Must express confidence intervals in transformed domain
15 / 31
Confidence Intervals for Nonlinear Regressions
I For nonlinear fits using general (e.g., exponential)transformations:
I Confidence intervals apply to transformed parametersI Not valid to perform inverse transformation before calculating
intervalsI Must express confidence intervals in transformed domain
2015
-06-
15
CS147Curvilinear Regression
General TransformationsConfidence Intervals for NonlinearRegressions

Handling Outliers
Outliers
I Atypical observations might be outliersI Measurements that are not truly characteristicI By chance, several standard deviations outI Or mistakes might have been made in measurement
I Which leads to a problem:Do you include outliers in analysis or not?
16 / 31
Outliers
I Atypical observations might be outliersI Measurements that are not truly characteristicI By chance, several standard deviations outI Or mistakes might have been made in measurement
I Which leads to a problem:Do you include outliers in analysis or not?
2015
-06-
15
CS147Handling Outliers
Outliers
Handling Outliers
Deciding How To Handle Outliers
1. Find them (by looking at scatter plot)2. Check carefully for experimental error3. Repeat experiments at predictor values for each outlier4. Decide whether to include or omit outliers
I Or do analysis both ways
Question: Is last point in last lecture’s example an outlier on ratingvs. year plot?
17 / 31
Deciding How To Handle Outliers
1. Find them (by looking at scatter plot)2. Check carefully for experimental error3. Repeat experiments at predictor values for each outlier4. Decide whether to include or omit outliers
I Or do analysis both ways
Question: Is last point in last lecture’s example an outlier on ratingvs. year plot?
2015
-06-
15
CS147Handling Outliers
Deciding How To Handle Outliers
Handling Outliers
Rating vs. Year
1940 1960 1980
Year
0
2
4
6
8
Rating
18 / 31
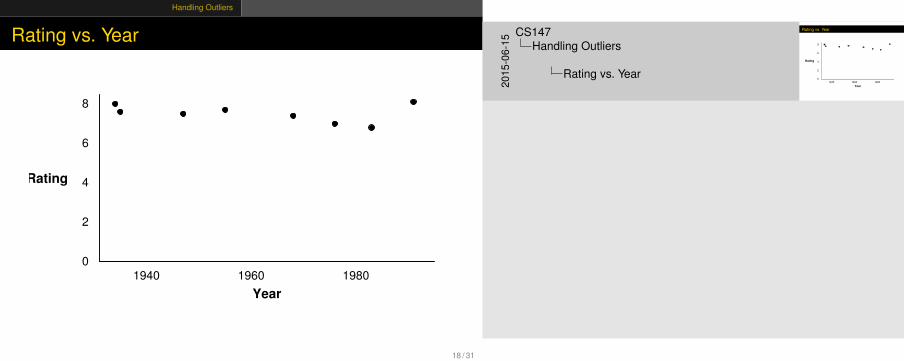
Rating vs. Year
1940 1960 1980
Year
0
2
4
6
8
Rating
2015
-06-
15
CS147Handling Outliers
Rating vs. Year

Common Mistakes
Common Mistakes in Regression
I Generally based on taking shortcutsI Or not being carefulI Or not understanding some fundamental principle of statistics
19 / 31
Common Mistakes in Regression
I Generally based on taking shortcutsI Or not being carefulI Or not understanding some fundamental principle of statistics
2015
-06-
15
CS147Common Mistakes
Common Mistakes in Regression

Common Mistakes
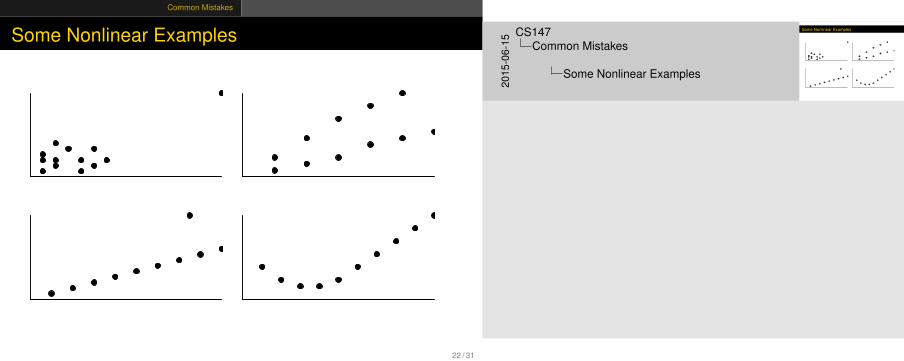
Not Verifying Linearity
I Draw the scatter plotI If it’s not linear, check for curvilinear possibilitiesI Misleading to use linear regression when relationship isn’t
linear
20 / 31
Not Verifying Linearity
I Draw the scatter plotI If it’s not linear, check for curvilinear possibilitiesI Misleading to use linear regression when relationship isn’t
linear
2015
-06-
15
CS147Common Mistakes
Not Verifying Linearity

Common Mistakes
Relying on Results Without Visual Verification
I Always check scatter plot as part of regressionI Examine predicted line vs. actual points
I Particularly important if regression is done automatically
21 / 31
Relying on Results Without Visual Verification
I Always check scatter plot as part of regressionI Examine predicted line vs. actual points
I Particularly important if regression is done automatically
2015
-06-
15
CS147Common Mistakes
Relying on Results Without VisualVerification
Common Mistakes
Some Nonlinear Examples
22 / 31
Some Nonlinear Examples
2015
-06-
15
CS147Common Mistakes
Some Nonlinear Examples

Common Mistakes
Attaching Importance to Parameter Values
I Numerical values of regression parameters depend on scaleof predictor variables
I So just because a particular parameter’s value seems “small”or “large,” not necessarily an indication of importance
I E.g., converting seconds to microseconds doesn’t changeanything fundamental
I But magnitude of associated parameter changes
23 / 31
Attaching Importance to Parameter Values
I Numerical values of regression parameters depend on scaleof predictor variables
I So just because a particular parameter’s value seems “small”or “large,” not necessarily an indication of importance
I E.g., converting seconds to microseconds doesn’t changeanything fundamental
I But magnitude of associated parameter changes
2015
-06-
15
CS147Common Mistakes
Attaching Importance to Parameter Values
Common Mistakes
Not Specifying Confidence Intervals
I Samples of observations are randomI Thus, regression yields parameters with random propertiesI Without confidence interval, impossible to understand what a
parameter really means
24 / 31
Not Specifying Confidence Intervals
I Samples of observations are randomI Thus, regression yields parameters with random propertiesI Without confidence interval, impossible to understand what a
parameter really means
2015
-06-
15
CS147Common Mistakes
Not Specifying Confidence Intervals

Common Mistakes
Not Calculating Coefficient of Determination
I Without R2, difficult to determine how much of variance isexplained by the regression
I Even if R2 looks good, safest to also perform an F-testI Not that much extra effort
25 / 31
Not Calculating Coefficient of Determination
I Without R2, difficult to determine how much of variance isexplained by the regression
I Even if R2 looks good, safest to also perform an F-testI Not that much extra effort
2015
-06-
15
CS147Common Mistakes
Not Calculating Coefficient of Determination

Common Mistakes
Using Coefficient of Correlation Improperly
I Coefficient of determination is R2
I Coefficient of correlation is RI R2 gives percentage of variance explained by regression, not
RI E.g., if R is .5, R2 is .25I And regression explains 25% of varianceI Not 50%!
26 / 31
Using Coefficient of Correlation Improperly
I Coefficient of determination is R2
I Coefficient of correlation is RI R2 gives percentage of variance explained by regression, not
RI E.g., if R is .5, R2 is .25I And regression explains 25% of varianceI Not 50%!
2015
-06-
15
CS147Common Mistakes
Using Coefficient of Correlation Improperly

Common Mistakes
Using Highly Correlated Predictor Variables
I If two predictor variables are highly correlated, using bothdegrades regression
I E.g., likely to be correlation between an executable’s on-diskand in-core sizes
I So don’t use both as predictors of run timeI Means you need to understand your predictor variables as
well as possible
27 / 31
Using Highly Correlated Predictor Variables
I If two predictor variables are highly correlated, using bothdegrades regression
I E.g., likely to be correlation between an executable’s on-diskand in-core sizes
I So don’t use both as predictors of run timeI Means you need to understand your predictor variables as
well as possible
2015
-06-
15
CS147Common Mistakes
Using Highly Correlated Predictor Variables

Common Mistakes
Using Regression Beyond Range of Observations
I Regression is based on observed behavior in a particularsample
I Most likely to predict accurately within range of that sampleI Far outside the range, who knows?
I E.g., regression on run time of executables smaller than sizeof main memory may not predict performance of executablesthat need VM activity
28 / 31
Using Regression Beyond Range of Observations
I Regression is based on observed behavior in a particularsample
I Most likely to predict accurately within range of that sampleI Far outside the range, who knows?
I E.g., regression on run time of executables smaller than sizeof main memory may not predict performance of executablesthat need VM activity
2015
-06-
15
CS147Common Mistakes
Using Regression Beyond Range ofObservations

Common Mistakes
Measuring Too Little of the Range
I Converse of prevoius mistakeI Regression only predicts well near range of observationsI If you don’t measure commonly used range, regression won’t
predict muchI E.g., if many programs are bigger than main memory, only
measuring those that are smaller is a mistake
29 / 31
Measuring Too Little of the Range
I Converse of prevoius mistakeI Regression only predicts well near range of observationsI If you don’t measure commonly used range, regression won’t
predict muchI E.g., if many programs are bigger than main memory, only
measuring those that are smaller is a mistake
2015
-06-
15
CS147Common Mistakes
Measuring Too Little of the Range

Common Mistakes
Using Too Many Predictor Variables
I Adding more predictors does not necessarily improve model!I More likely to run into multicollinearity problemsI So what variables to choose?
I It’s an artI Subject of much of this course
30 / 31
Using Too Many Predictor Variables
I Adding more predictors does not necessarily improve model!I More likely to run into multicollinearity problemsI So what variables to choose?
I It’s an artI Subject of much of this course
2015
-06-
15
CS147Common Mistakes
Using Too Many Predictor Variables

Common Mistakes
Assuming a Good Predictor Is a Good Controller
I Often, a goal of regression is finding control variablesI But correlation isn’t necessarily controlI Just because variable A is related to variable B, you may not
be able to control values of B by varying AI E.g., if number of hits on a Web page is correlated to server
bandwidth, you might not boost hits by increasing bandwidth
31 / 31
Assuming a Good Predictor Is a Good Controller
I Often, a goal of regression is finding control variablesI But correlation isn’t necessarily controlI Just because variable A is related to variable B, you may not
be able to control values of B by varying AI E.g., if number of hits on a Web page is correlated to server
bandwidth, you might not boost hits by increasing bandwidth
2015
-06-
15
CS147Common Mistakes
Assuming a Good Predictor Is a GoodController