crpaqs filter measurements field program · pdf filecrpaqs filter measurements field program...
TRANSCRIPT
CRPAQS Filter MeasurementsField Program
Final Report
Submitted to:
Karen Magliano
California Air Resources Board
By:
Steven D. Kohl
Desert Research Institute
January 26, 2005

1-2
Table of Contents
1. CRPAQS Field Study ........................................................................................................ 1-1
2. Filter Measurements........................................................................................................... 2-12.1 Analysis Methods: ................................................................................................. 2-3
2.1.1 Gravimetric Analysis ..................................................................................... 2-32.1.2 Elements by XRF........................................................................................... 2-32.1.3 Elemental and Organic Carbon...................................................................... 2-32.1.4 Inorganic Ion Analyses ................................................................................. 2-52.1.5 Ion Chromatographic Analysis for Chloride, Nitrate, and Sulfate ................ 2-52.1.6 Ammonium Analysis ..................................................................................... 2-62.1.7 Atomic Absorption Analysis for Soluble metals ........................................... 2-7
2.2 Measurement Validity............................................................................................ 2-9
3. Database Structures and Features ...................................................................................... 3-1
4. References.......................................................................................................................... 4-4

1-1
1. CRPAQS FIELD STUDY
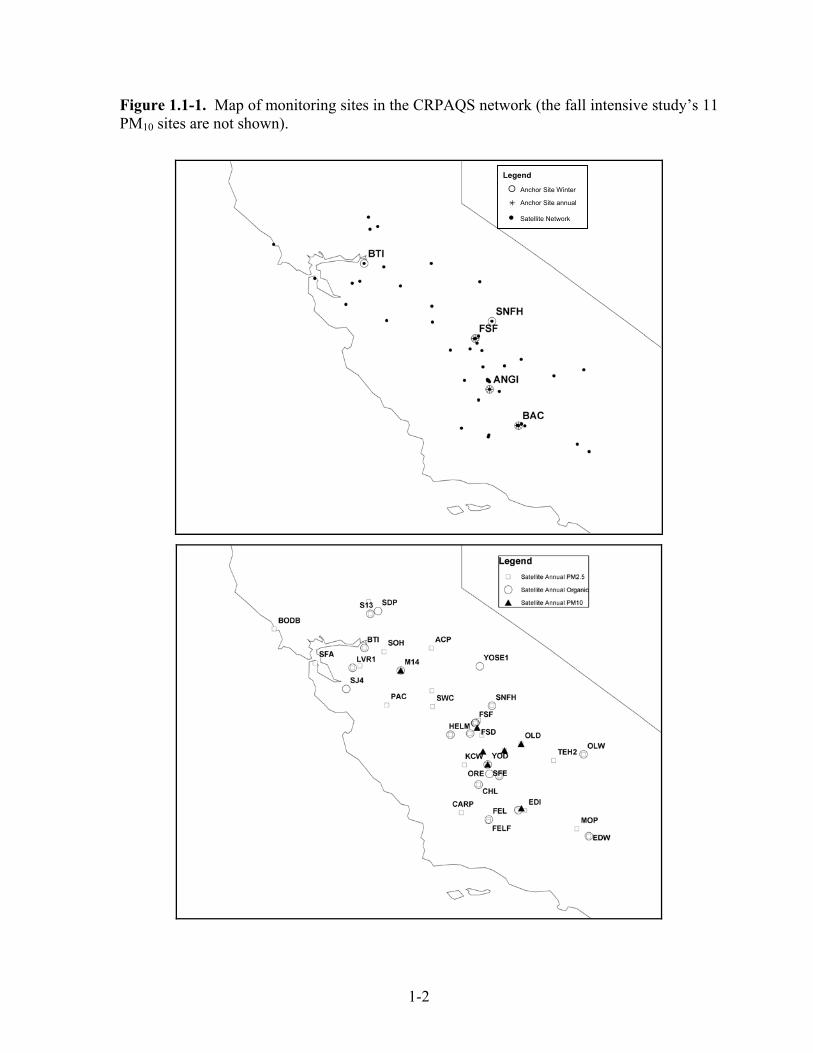
The CRPAQS aerosol monitoring network is shown in Figure 1.1-1. Measurementsof precursor gases and PM taken during CRPAQS included: 1) gaseous NH3 and HNO3 bythe denuder difference method with DRI medium-volume sequential gas samplers (SGS) atthe anchor sites; 2) PM2.5 and NH3 by DRI sequential filter samplers (SFS) equipped withBendix 240 cyclone inlets and preceding nitric acid denuders at the anchor sites; and 3)PM2.5, PM10, and NH3 by battery-powered Airmetrics Minivol samplers at the satellite sites.PM2.5 and PM10 mass, filter transmission (babs), 40 elements (Na to U; Watson et al., 1999),ions (Cl–, NO3
–, SO4=, Na+, K+, NH4
+; Chow and Watson, 1999), volatilized NO3–, and seven-
fraction organic and elemental carbon were acquired.
Measurements of gaseous and particulate organic compounds included: 1) 123volatile organic compounds (VOCs) from C2 to C12 by canister sampling and gaschromatography/mass spectrometry (GC/MS) analysis, 2) 63 VOCs from C8 to C20 byTenax-TA cartridge sampling with analysis by the thermal desorption/cryogenicpreconcentration method followed by high-resolution gas chromatography separation andflame ionization detection and/or combined mass spectrometry/Fourier transform infrareddetection, 3) 14 carbonyl compounds by dinitrophenylhydrazine (DNPH) cartridge samplingand high-performance liquid chromatography analysis, and 4) 151 semivolatile organiccompounds (SVOCs) and particulate organics sampled with DRI organic sampling systemsat 4 anchor sites (Angiola, Bethel Island, Fresno, and Sierra Foothill) and with Minivolsamplers equipped with Teflon-impregnated glass-fiber filters at the 20 satellite sites andanalyzed by gas chromatography/mass spectrometry. Table 1.1-1 summarizes measurementsacquired from the CRPAQS network.
The annual anchor network includes 14 months of daily PM2.5 sampling between12/03/99 and 02/03/01 at two major urban centers (Fresno [FSF] and Bakersfield [BAC]) torepresent community human exposure, and at one intrabasin gradient and vertical gradientsite (Angiola [ANGI]) located in a flat field ~85 km south/southeast of Fresno to representenvironments with minimal influences from urban or non-urban sources. Two additionalanchor sites (Bethel Island [BTI] and Sierra Foothill [SNFH]) were added during the 15-day,5 times/day winter intensive program for both PM2.5 and gaseous NH3 and HNO3measurements. Measurements of VOCs (C2 to C20) and carbonyls were taken 4 times/dayduring the winter intensive program at 4 anchor sites (Angiola, Bethel Island, Fresno, andSierra Foothill). To achieve adequate loadings for heavy hydrocarbons, SVOCs andparticulate organics were sampled 2 times/day at the Angiola, Bethel Island, and SierraFoothill anchor sites and 4 times/day at the Fresno anchor site during the winter intensive.
The satellite network included annual, fall intensive, and winter intensive samplingprograms at a total of 53 sites in 8 categories defined by environmental characteristicssurrounding the sites (as noted in Table 1.1-1) and included 18 community exposure sites, 11emissions source dominated sites, 9 visibility sites, 11 intrabasin gradient sites, 2 vertical
1-2
Figure 1.1-1. Map of monitoring sites in the CRPAQS network (the fall intensive study’s 11PM10 sites are not shown).
Legend
Anchor Site Winter
+× Anchor Site annual
• Satellite Network

1-3
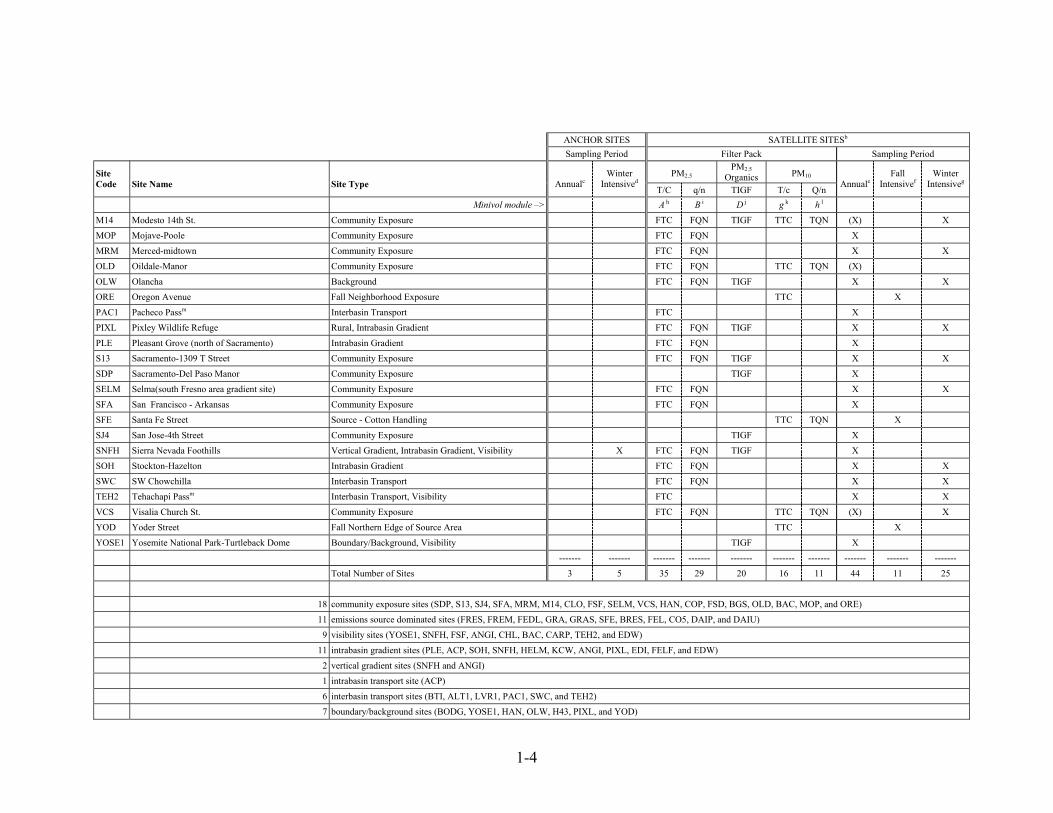
Table 1.1-1. Summary of CRPAQS anchor and satellite site aerosol measurements.a
ANCHOR SITES SATELLITE SITESb
Sampling Period Filter Pack Sampling Period
PM2.5PM2.5
Organics PM10SiteCode Site Name Site Type Annualc
WinterIntensived
T/C q/n TIGF T/c Q/n AnnualeFall
IntensivefWinter
Intensiveg
Minivol module –> A h B i D j g k h l
ACP Angels Camp Intrabasin Gradient FTC FQN X X
ALT1 Altamont Passm Interbasin Transport FTC X X
ANGI Angiola-ground level Intrabasin Gradient, Vertical Gradient, Visibility X X TIGF X
BAC Bakersfield-5558 California Street Community Exposure, Visibility X X TIGF X
BGS Bakersfield-1120 Golden State Community Exposure TTC TQN (X)
BODG Bodega Marine Lab Boundary/Background FTC FQN X X
BRES BAC-Residential Source- woodburning FTC FQN X X
BTI Bethel Island Interbasin Transport X FTC FQN TIGF X
CARP Carrizo Plainm Intrabasin Gradient, Visibility FTC X
CHL China Lake Visibility FTC FQN TIGF X
CLO Clovis Community Exposure FTC FQN X X
CO5 Corcoran Railroad Shoulder Source - Railroad/ Unpaved Shoulder TTC X
COP Corcoran-Patterson Avenue Community Exposure FTC FQN TIGF TTC TQN (X) X X
DAIP Dairy Road - Paved Source - Paved Road TTC X
DAIU Dairy Road - Unpaved Source-Unpaved Road TTC X
EDI Edisonm Intrabasin Gradient FTC X X
EDW Edwards Air Force Base Intrabasin Gradient, Visibility FTC FQN TIGF X
FEDL Feedlot or Dairy Source - Cattle FTC FQN TIGF X X
FEL Fellows Source- Oilfields FTC FQN TIGF X X
FELF Foothills above Fellows Intrabasin Gradient FTC FQN X X
FREM Fresno MV Source - Motor Vehicle FTC FQN X X
FRES Residential area near FSF, with woodburning Source - Woodburning FTC FQN TIGF X X
FSD Fresno Drummond Community Exposure TTC TQN (X)
FSF Fresno-3425 First Street Community Exposure, Visibility X X TIGF X
GRA Grain Elevator Source - Grain Elevators TTC TQN X
GRAS Grain Elevator South Source - Zone of Influence TTC TQN X
H43 Highway 43 Southern Boundary TTC TQN X
HAN Hanford-Irwin St. Community Exposure and Fall Northern Boundary TTC TQN (X) X
HELM Agricultural fields/Helm-Central Fresno County Intrabasin Gradient FTC FQN TIGF X X
KCW Kettleman Citym Intrabasin Gradient FTC X X
LVR1 Livermore - New site Interbasin Transport FTC FQN TIGF X X
1-4
ANCHOR SITES SATELLITE SITESb
Sampling Period Filter Pack Sampling Period
PM2.5PM2.5
Organics PM10SiteCode Site Name Site Type Annualc
WinterIntensived
T/C q/n TIGF T/c Q/n AnnualeFall
IntensivefWinter
Intensiveg
Minivol module –> A h B i D j g k h l
M14 Modesto 14th St. Community Exposure FTC FQN TIGF TTC TQN (X) X
MOP Mojave-Poole Community Exposure FTC FQN X
MRM Merced-midtown Community Exposure FTC FQN X X
OLD Oildale-Manor Community Exposure FTC FQN TTC TQN (X)
OLW Olancha Background FTC FQN TIGF X X
ORE Oregon Avenue Fall Neighborhood Exposure TTC X
PAC1 Pacheco Passm Interbasin Transport FTC X
PIXL Pixley Wildlife Refuge Rural, Intrabasin Gradient FTC FQN TIGF X X
PLE Pleasant Grove (north of Sacramento) Intrabasin Gradient FTC FQN X
S13 Sacramento-1309 T Street Community Exposure FTC FQN TIGF X X
SDP Sacramento-Del Paso Manor Community Exposure TIGF X
SELM Selma(south Fresno area gradient site) Community Exposure FTC FQN X X
SFA San Francisco - Arkansas Community Exposure FTC FQN X
SFE Santa Fe Street Source - Cotton Handling TTC TQN X
SJ4 San Jose-4th Street Community Exposure TIGF X
SNFH Sierra Nevada Foothills Vertical Gradient, Intrabasin Gradient, Visibility X FTC FQN TIGF X
SOH Stockton-Hazelton Intrabasin Gradient FTC FQN X X
SWC SW Chowchilla Interbasin Transport FTC FQN X X
TEH2 Tehachapi Passm Interbasin Transport, Visibility FTC X X
VCS Visalia Church St. Community Exposure FTC FQN TTC TQN (X) X
YOD Yoder Street Fall Northern Edge of Source Area TTC X
YOSE1 Yosemite National Park-Turtleback Dome Boundary/Background, Visibility TIGF X
------- ------- ------- ------- ------- ------- ------- ------- ------- -------
Total Number of Sites 3 5 35 29 20 16 11 44 11 25
18 community exposure sites (SDP, S13, SJ4, SFA, MRM, M14, CLO, FSF, SELM, VCS, HAN, COP, FSD, BGS, OLD, BAC, MOP, and ORE)
11 emissions source dominated sites (FRES, FREM, FEDL, GRA, GRAS, SFE, BRES, FEL, CO5, DAIP, and DAIU)
9 visibility sites (YOSE1, SNFH, FSF, ANGI, CHL, BAC, CARP, TEH2, and EDW)
11 intrabasin gradient sites (PLE, ACP, SOH, SNFH, HELM, KCW, ANGI, PIXL, EDI, FELF, and EDW)
2 vertical gradient sites (SNFH and ANGI)
1 intrabasin transport site (ACP)
6 interbasin transport sites (BTI, ALT1, LVR1, PAC1, SWC, and TEH2)
7 boundary/background sites (BODG, YOSE1, HAN, OLW, H43, PIXL, and YOD)

1-5
(X) Includes the seven PM10 sites operated during the annual program.
a Teflon-membrane filter samples were analyzed for mass by gravimetry, filter transmission (babs) by densitometry, and elements (Na, Mg, Al, Si, P, S, Cl, K, Ca, Ti, V, Cr, Mn, Fe, Co, Ni, Cu, Zn, Ga,As, Se, Br, Rb, Sr, Y, Zr, Mo, Pd, Ag, Cd, In, Sn, Sb, Ba, La, Au, Hg, Tl, Pb, and U) by x-ray fluorescence (Watson et al., 1999); quartz-fiber filter samples were analyzed for anions (Cl–, NO3
–,SO4
=) by ion chromatography (Chow and Watson, 1999), ammonium by automated colorimetry, water-soluble Na+ and K+ by atomic absorption spectrophotometry, and 7-fraction organic andelemental carbon (OC1 combusted at 120 °C, OC2 at 250 °C, OC3 at 450 °C, OC4 at 550 °C, EC1 at 550 °C, EC2 at 700 °C, and EC3 at 800 °C with pyrolysis correction) by thermal/opticalreflectance (Chow et al., 1993a, 2001); citric-acid-impregnated filter samples were analyzed for ammonia by automated colorimetry; and sodium-chloride-impregnated filters were analyzed forvolatilized nitrate by ion chromatography.
b Sampling with battery-powered Minivol samplers (Airmetrics, Eugene, OR) equipped with PM10/PM2.5 (in tandem) or PM10 inlets at a flow rate of 5 L/min.c Anchor site annual sampling program used DRI medium-volume sequential filter samplers (SFS) equipped with Bendix 240 cyclone PM2.5 inlets and preceding anodized aluminum nitric acid
denuders. Sampling was conducted daily, 24 hours/day (midnight to midnight) from 12/02/99 to 02/03/01 at a flow rate of 20 L/min. Two filter packs were used for sampling: 1) each Teflon/citricacid filter pack consists of a front Teflon-membrane filter (for mass, babs, and elemental analyses) backed up by a citric-acid-impregnated cellulose-fiber filter (for ammonia), and 2) each quartz/NaClfilter pack consists of a front quartz-fiber filter (for ion and carbon analyses) backed up by a sodium-chloride-impregnated cellulose-fiber filter (for volatilized nitrate).
d Anchor site winter intensive sampling included both SFS for PM2.5 sampling and sequential gas samplers (SGS) for ammonia and nitric acid sampling by denuder difference on 15 forecast episodedays (12/15/00 to 12/18/00, 12/26/00 to 12/28/00, 01/04/01 to 01/07/01, and 01/31/01 to 02/03/01). The two SGS were equipped with: 1) citric-acid-coated glass denuders and quartz-fiber filtersbacked up by citric-acid-impregnated cellulose-fiber filters for ammonia (NH3); and 2) anodized aluminum denuders and quartz-fiber filters backed up by sodium-chloride-impregnated cellulose-fiberfilters for nitric acid (HNO3). VOCs and carbonyls were sampled 4 times/day (0000-0500, 0500-1000, 1000-1600, and 1600-2400) at 4 anchor sites (Angiola, Fresno, Bethel Island, and SierraFoothill). Heavy hydrocarbons were sampled with Tenax and PUF/XAD samplers 4 times/day (0000-0500, 0500-1000, 1000-1600, and 1600-2400) at the Fresno anchor site and 2 times/day (0500-1600 and 1600-next day 0500) at the Bethel Island, Sierra Foothill, and Angiola anchor sites.
C2 to C12 volatile organic compound (VOC) samples were acquired with canister samplers and analyzed by Dr. Reinhold Rasmussen at the Oregon Graduate Institute of Science and Technology,Portland, OR, using gas chromatography with mass spectrometry to determine concentrations of 123 VOCs:propenepropaneisobutane1,3-butadienen-butanemethanolt-2-butene1&2-butynec-2-butene3-methyl-1-buteneethanolisopentane1-pentene2-methyl-1-butenen-pentaneisoprenet-2-pentenec-2-pentene2-methyl-2-butene2,2-dimethylbutanecyclopentene
4-methyl-1-pentene3-methyl-1-pentenecyclopentane2,3-dimethylbutanemethyl-t-butylether2-methylpentane2,2-dimethylpentane3-methylpentane2-methyl-1-pentene1-hexenen-hexanet-3-hexenet-2-hexene2-methyl-2-pentenecis-3-methyl-2-pentenec-3-hexenec-2-hexenetrans-3-methyl-2-pentenemethylcyclopentane2,4-dimethylpentane2,2,3-trimethylbutane
1-methylcyclopentenebenzene3,3-dimethylpentanecyclohexane4-methylhexene2-methylhexane2,3-dimethylpentanecyclohexene3-methylhexane1,3-dimethylcyclopentane3-ethylpentane1-heptene2,2,4-trimethylpentanet-3-heptenen-heptane2,4,4-trimethyl-1-pentenemethylcyclohexane2,5-diemthylhexane2,4-diemthylhexane2,3,4-trimethylpentanetoluene
2,3-dimethylhexane2-methylheptane4-methylheptane3-methylheptane2,2,5-trimethylhexaneoctene-11,1-dimethylcyclohexanen-octane2,3,5-trimethylhexane2,4-dimethylheptane4,4-dimethylheptane2,6-dimethylheptane2,5-dimethylheptane3,3-dimethylheptaneethylbenzenem- & p-xylene2-methyloctane3-methyloctanestyreneo-xylene1-nonene
n-nonaneisopropylbenzeneisopropylcyclohexane2,6-dimethyloctanealpha-pinene3,6-dimethyloctanen-propylbenzenem-ethyltoluenep-ethyltoluene1,3,5-trimethylbenzeneo-ethyltolueneoctanalbeta-pinene1-decene1,2,4-trimethylbenzenen-decaneisobutylbenzenesec-butylbenzene1,2,3-trimethylbenzenelimoneneindan
indene1,3-diethylbenzene1,4-diethylbenzenen-butylbenzene1,2-diethylbenzene1,3-dimethyl-4-ethylbenzeneisopropyltoluenenonanal1-undecenen-undecane1,2,4,5-tetramethylbenzene1,2,3,5-tetramethylbenzene1,2,3,4-tetramethylbenzene2-methylindan1-methylindan1-dodecenenaphthalenen-dodecane
C8 to C20 volatile organic compound samples were acquired with glass cartridges filled with Tenax-TA (a polymer of 2,6-diphenyl-p-phenylene oxide) solid adsorbent and analyzed by the thermaldesorption/cryogenic preconcentration method followed by high-resolution gas chromatography separation and flame ionization detection and/or combined mass spectrometry/Fourier transforminfrared detection for 63 VOCs:1,2,4,5-tetramethylbenzene1(1,1-dimethylethyl)3-5-dimethylbenzene
(1-methylethyl)benzene1-methyl-4-(1-methylethyl)benzene
1,4-diethylbenzene1,2-diethylbenzene
1,3-diethylbenzene(1-methylpropyl)benzene
1,2,3,4-tetramethylbenzene2,3-dihydroindene (indan)

1-6
1,2,3,5-tetramethylbenzene1-methyl-2-(1-methylethyl)benzene1-methyl-3-(1-methylethyl)benzenen-pentylbenzene(2-methylpropyl)benzene1-methyl-2-ethylbenzene1-methyl-3-ethylbenzene1-methyl-4-ethylbenzene4-methylindan2-methylindan5-methylindan
1,3-dimethyl-4-ethylbenzene1,2-dimethyl-3-ethylbenzene1,3-dimethyl-5-ethylbenzene1,2-dimethyl-4-ethylbenzene1-methyl-2-n-propylbenzene1-methyl-3-n-propylbenzene1-methyl-4-n-propylbenzene1-methyl-2-n-butylbenzene1,4-dimethyl-2-ethylbenzene1,3-dimethyl-2-ethylbenzene1-ethyl-2-n-propylbenzene
1,3-di-n-propylbenzene2-methylnaphthalene1-methylnaphthalenehexanalheptanaloctanalnonanaldecanalundecanaldodecanaltridecanal
TetradecanalPentadecanalHexadecanalOctadecanal2-furaldehydebenzaldehydeacetophenone2,5-dimethylbenzaldehydeethanone-1(3-methoxyphenol)t-2,4-decadienalUndecane
dodecanetridecanetetradecanepentadecanehexadecaneheptadecaneoctadecanenonadecaneeicosane
Carbonyl samples were acquired with AtmAA sequential carbonyl samplers and analyzed by Dr. Kochy Fung at AtmAA Environmental Consultants, Calabasas, CA, using high-performance liquidchromatography to determine concentrations of 14 carbonyls (formaldehyde, acetaldehyde, acetone, acrolein, propanal, crotonal, methyl ethyl ketone, methacrolein, butanal, pentanal, glyoxal,hexanal, benzaldehyde, and m-tolualdehyde). Particulate and semivolatile organic compound samples were acquired with DRI Organic Sampling System samplers on Teflon-impregnated glass fiberfilters backed up with a PUF/XAD-4/PUF sandwich solid adsorbents and analyzed by gas chromatography with mass spectrometry for 151 particulate and semivolatile VOCs:Naphthalene2-menaphthalene1-menaphthalene2,6+2,7-dimenaphthalene1,7+1,3+1,6-dimenaphthalene2,3+1,4+1,5-dimenaphthalene1,2-dimenaphthalene1,8-dimenapthaleneBiphenyl2-methylbiphenyl3-methylbiphenyl4-methylbiphenylTrimethylnaphthalene IsomersEthyl-MethylnaphthalenesAcenaphthyleneAcenaphthenephenanthreneFluoreneMethylfluorenes Isomers1-methylfluoreneMethylphenanthrenes Isomers2-methylphenanthrene1-methylphenanthrene3,6-dimethylphenanthrene1,7-dimethylphenanthreneAnthracene9-methylanthracenefluoranthenepyreneMethylpyrene/fluoranthenes4-methylpyrenereteneBenzonaphthothiophene
Benz(a)anthracene7-methylbenz[a]anthraceneChrysene/triphenyleneBenzo(b+j+k)FLBePBaP7-methylbenzo[a]pyreneindeno[123-cd]pyrenedibenz(ah+ac)anthraceneBenzo(b)chryseneBenzo(ghi)perylenecoronene4Hcyclopenta(def)phenanthrenbenzo(c)phenanthrenePerylenequinolinedibenzo[a,e]pyrenedibenzo[a,h]pyrenedibenzo[a,i]pyrenedibenzo[a,l]pyrenedibenz[a,j]acridinedibenz[a,h]acridine7H-dibenzo[c,g]carbazole5-methylchrysenedibenz[a,h]anthracene7,12-dimethylbenzanthracene3-methylcholanthreneOxy-PAH9-fluorenoneXanthoneAcenaphthenequinonePerinaphthenoneAnthraquinone
9-anthraldehydeBenzanthroneBenz(a)anthracene-7,12-dione1,4-chrysenequinone9,10-dihydrobenzo(a)pyren-7(8H)-oneNitro-PAH1-Nitronaphthalene2-NitronaphthaleneMethylnitronaphthalenes2-Nitrobiphenyl4-Nitrobiphenyl5-Nitroacenaphthene2-Nitrofluorene9-Nitroanthracene1-Nitropyrene4-Nitropyrene3-Nitrofluoranthene7-Nitrobenz(a)anthracene6-Nitrochrysene6-Nitrobenzo(a)pyrene1,8-Dinitropyrene1,6-Dinitropyrene1,3-Dinitropyrene
Hopanes&Steranes18(H)-22,29,30-trisnorneohopane17(H)-22,29,30-trisnorhopane17(H)-21(H)-29-norhopane17(H)-21(H)-hopane20R,5(H),14 (H),17(H)-cholestane20R,5(H),14(H),17(H)-cholestane20R&S,5(H),14(H),17 (H)-ergostane20R&S,5(H),14(H),17 (H)-sitostane
Carpanes8, 13-Dimethyl-14-n-butylpodocarpane8, 13Dimethyl-14-[3’-methylbutyl] podocarpanen-Alkanoic Acidsoctanoic acidnonanoic aciddecanoic acidundecanoic aciddodecanoic acidtridecanoic acidtetradecanoic acidheptadecanoic acidoctadecanoic acidnonadecanoic acideicosanoic acidAlkanedioic acidsoctadecanedioic acidnonadecanedioic acidAromatic acidsbenzoic acidmethylbenzoic acid
Alkanesn-pentadecanen-hexadecanen-heptadecanen-octadecanen-nonadecanen-eicosanen-heneicosanen-docosanen-tricosanen-tetracosane
n-pentacosanen-hexacosanen-heptacosanen-octacosanefarnesanenorpristanenorfarnesanepristanephytane
Saturated Cycloalkanestridecylcyclohexanetetradecylcyclohexanepentadecylcyclohexanehexadecylcyclohexaneheptadecylcyclohexaneoctadecylcyclohexanenonadecylcyclohexane
Lower priority cycloalkanesheptylcyclohexaneoctylcyclohexanenonylcyclohexanedecylcyclohexaneundecylcyclohexanedodecylcyclohexaneeicosylcyclohexaneheneicosycyclohexane

1-7
e Satellite site annual sampling program included every-sixth-day 24-hour sampling at 35 PM2.5 sites and 7 PM10 sites between 12/02/99 and 02/03/01. Particulate organic compounds were sampled at20 sites between 02/06/00 and 01/31/01.
f Satellite site fall intensive study included 24-hour sampling of PM10 on 37 days between 10/09/00 and 11/14/00 at 11 sites. 6 sites (COP, H43, HAN, GRA, GRAS, and SFE) were equipped with bothTeflon/citric acid and quartz/NaCl filter packs. 5 sites (CO5, DAIP, DAIU, ORE, and YOD) were equipped with only Teflon/citric acid filter packs.
g Satellite site winter intensive study included 24-hour sampling of PM2.5 on 13 forecast episode days (12/15/00 to 12/18/00, 12/25/00, 12/27/00, 12/28/00, 01/04/01 to 01/06/01, and 02/01/01 to02/03/01) at 25 PM2.5 sites, with 21 of the sites equipped with both Teflon/citric acid and quartz/NaCl filter packs.
h Minivol module A: PM2.5 Teflon/citric acid filter packs at 35 satellite sites. Each filter pack consisted of a front Teflon-membrane filter (for mass, babs, and elements) backed up by a citric-acid-impregnated cellulose-fiber filter (for ammonia).
i Minivol module B: PM2.5 quartz/NaCl filter packs at 29 satellite sites (same sites as module A but excluding ALT1, PAC1, KCW, EDI, CARP, and TEH2). Each filter pack consisted of a front pre-fired quartz-fiber filter (for ions and carbon) backed up by a sodium-chloride-impregnated cellulose-fiber filter (for volatilized nitrate).
j Minivol module D: PM2.5 Teflon-impregnated glass-fiber filters (TIGF) at a total of 20 sites (including 3 annual anchor sites [Fresno, Angiola, and Bakersfield], 14 annual satellite sites, the San Jose-4th St. [SJ4] site, the Sacramento-Del Paso Manor [SPP] site, and the Yosemite [YOSE1] site). A total of 61 samples acquired over the yearlong sampling period were composited as one sample andanalyzed by gas chromatography with mass spectrometry (GC/MS) for 151 particulate organic compounds as listed in footnote d above.
k Minivol module g: PM10 Teflon/citric acid filter packs at 16 satellite sites, 4 of which (M14, VCS, COP, and OLD) were collocated with annual PM2.5 measurements, and 7 of which (M14, VCS,COP, FSD, BGS, HAN, and OLD) were annual PM10 sites. Each filter pack consisted of a front Teflon-membrane filter (for mass, babs, and elements) backed up by a citric-acid-impregnatedcellulose-fiber filter (for ammonia).
l Minivol module h: PM10 quartz/NaCl filter packs at 16 satellite sites, 4 of which were collocated with annual PM2.5 measurements (M14, VCS, COP, and OLD), and 7 of which (M14, VCS, COP,FSD, BGS, HAN, and OLD) were annual PM10 sites. Each filter pack consisted of a front quartz-fiber filter (for ion and carbon analyses) backed up by a sodium-chloride-impregnated cellulose-fiberfilter (for volatilized nitrate).
m One of six sites (ALT1, PAC1, KCW, EDI, CARP, and TEH2) where only Minivol module A Teflon/citric acid filter packs were acquired.

1-8
gradient sites, 1 intrabasin transport site, 6 interbasin transport sites, and 7boundary/background sites. The satellite sites were designed to: 1) examine spatialvariations of PM concentrations within the study domain, 2) identify potential pollutanttransport in the prevailing wind direction, 3) determine the zones of influence of specificemitters (e.g., fugitive dust) on PM loadings in a mixed-land-use area, and 4) evaluate thezones of representation of single-site measurements for community exposure to PM. Thesatellite sites within the air basin represent middle-scale (0.1 to 0.5 km), neighborhood-scale (0.5 to 4 km), and urban-scale (4 to 100 km) influences around the anchor sites,whereas the inter- or intrabasin gradient sites and boundary/background sites representurban-scale to regional-scale (100 to 1,000 km) influences.
The annual satellite network consisted of 14 months of every-sixth-day, 24-hoursampling at 53 locations (including 35 PM2.5 sites, 20 PM2.5 organic compound sites [12months of sampling between 02/06/00 and 01/31/01 only], and 7 PM10 sites). The fallintensive study included daily 24-hour sampling of PM10 between 10/09/00 and 11/14/00at 11 sites. The winter intensive study included daily 24-hour sampling of PM2.5 on 13forecast episode days at 25 sites. PM2.5 organic compound samples collected during theannual program were composited to one sample per site for gas chromatography/massspectrometry analysis of particulate organics.
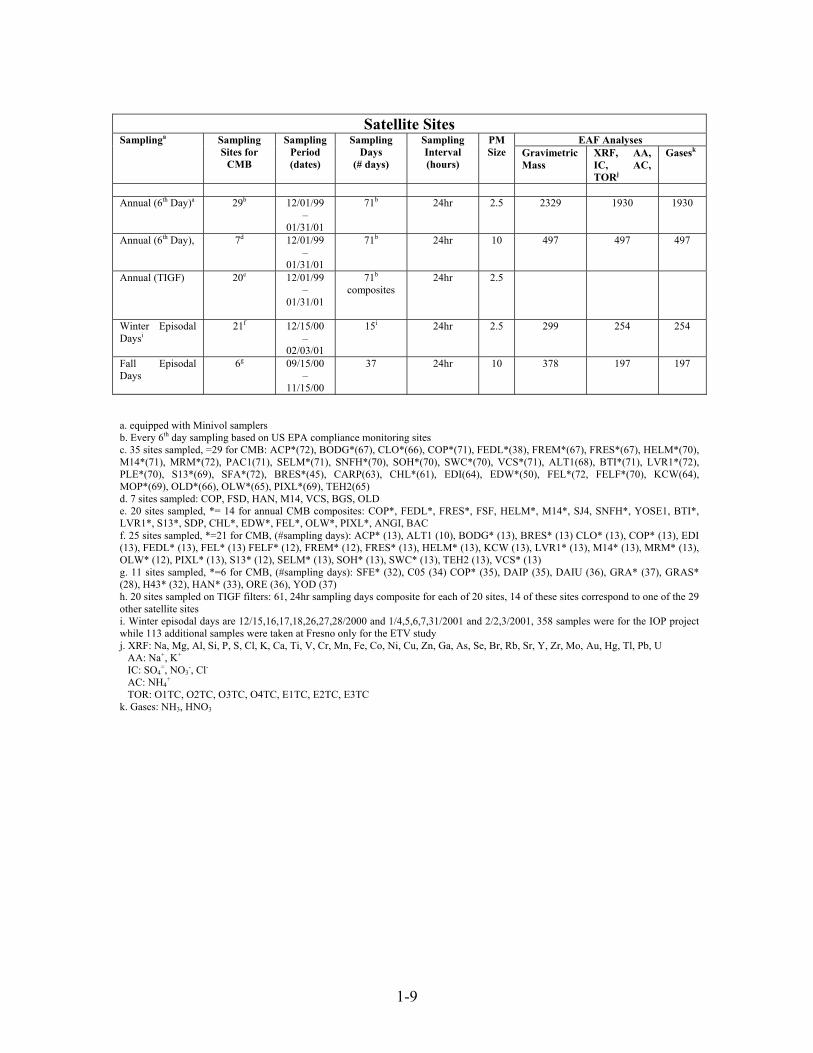
Table 1.1-2. below provides a summary of the filter analyses performed for the CRPAQSproject.
Table 1.1-2
CRPAQS, AMBIENT DATAEAF AnalysesAnchor Sites Sampling Sites Sampling
Period(dates)
SamplingDays(# days)
SamplingInterval(hours)
PMSize Gravimetric
MassXRF, AA,IC, AC,TORj
Gasesk
WinterEpisodali,o,SFS
Fresno,Angiola,
(Bakersfield),Sierra Foothill,Bethel Island
12/15/00to
02/03/01
15 3-13 hr 2.5 471 471 471
Annual, SFS Fresno,Angiola,
Bakersfield,
12/03/99–
02/04/01
413 24hr 2.5 1229 290
SummerEpisodal Days,SFSn
Fresno 06/29/00–
09/05/00
10 24hr 2.5 10 10
1-9
Satellite SitesEAF AnalysesSamplinga Sampling
Sites forCMB
SamplingPeriod(dates)
SamplingDays
(# days)
SamplingInterval(hours)
PMSize Gravimetric
MassXRF, AA,IC, AC,TORj
Gasesk
Annual (6th Day)a 29b 12/01/99–
01/31/01
71b 24hr 2.5 2329 1930 1930
Annual (6th Day), 7d 12/01/99–
01/31/01
71b 24hr 10 497 497 497
Annual (TIGF) 20e 12/01/99–
01/31/01
71b
composites24hr 2.5
Winter EpisodalDaysi
21f 12/15/00–
02/03/01
15i 24hr 2.5 299 254 254
Fall EpisodalDays
6g 09/15/00–
11/15/00
37 24hr 10 378 197 197
a. equipped with Minivol samplersb. Every 6th day sampling based on US EPA compliance monitoring sitesc. 35 sites sampled, =29 for CMB: ACP*(72), BODG*(67), CLO*(66), COP*(71), FEDL*(38), FREM*(67), FRES*(67), HELM*(70),M14*(71), MRM*(72), PAC1(71), SELM*(71), SNFH*(70), SOH*(70), SWC*(70), VCS*(71), ALT1(68), BTI*(71), LVR1*(72),PLE*(70), S13*(69), SFA*(72), BRES*(45), CARP(63), CHL*(61), EDI(64), EDW*(50), FEL*(72, FELF*(70), KCW(64),MOP*(69), OLD*(66), OLW*(65), PIXL*(69), TEH2(65)d. 7 sites sampled: COP, FSD, HAN, M14, VCS, BGS, OLDe. 20 sites sampled, *= 14 for annual CMB composites: COP*, FEDL*, FRES*, FSF, HELM*, M14*, SJ4, SNFH*, YOSE1, BTI*,LVR1*, S13*, SDP, CHL*, EDW*, FEL*, OLW*, PIXL*, ANGI, BACf. 25 sites sampled, *=21 for CMB, (#sampling days): ACP* (13), ALT1 (10), BODG* (13), BRES* (13) CLO* (13), COP* (13), EDI(13), FEDL* (13), FEL* (13) FELF* (12), FREM* (12), FRES* (13), HELM* (13), KCW (13), LVR1* (13), M14* (13), MRM* (13),OLW* (12), PIXL* (13), S13* (12), SELM* (13), SOH* (13), SWC* (13), TEH2 (13), VCS* (13)g. 11 sites sampled, *=6 for CMB, (#sampling days): SFE* (32), C05 (34) COP* (35), DAIP (35), DAIU (36), GRA* (37), GRAS*(28), H43* (32), HAN* (33), ORE (36), YOD (37)h. 20 sites sampled on TIGF filters: 61, 24hr sampling days composite for each of 20 sites, 14 of these sites correspond to one of the 29other satellite sitesi. Winter episodal days are 12/15,16,17,18,26,27,28/2000 and 1/4,5,6,7,31/2001 and 2/2,3/2001, 358 samples were for the IOP projectwhile 113 additional samples were taken at Fresno only for the ETV studyj. XRF: Na, Mg, Al, Si, P, S, Cl, K, Ca, Ti, V, Cr, Mn, Fe, Co, Ni, Cu, Zn, Ga, As, Se, Br, Rb, Sr, Y, Zr, Mo, Au, Hg, Tl, Pb, U AA: Na+, K+
IC: SO4=, NO3
-, Cl-
AC: NH4+
TOR: O1TC, O2TC, O3TC, O4TC, E1TC, E2TC, E3TCk. Gases: NH3, HNO3

2-1
2.FILTER MEASUREMENTS
The anchor sites annual sampling program used DRI medium-volume sequential filtersamplers (SFS) equipped with Bendix 240 cyclone PM2.5 inlets and preceding anodizedaluminum nitric acid denuders. Sampling was conducted daily, 24 hours/day (midnightto midnight) from 12/02/99 to 02/03/01 at a flow rate of 20 L/min. Two filter packs wereused for sampling: 1) each Teflon/citric acid filter pack consists of a front Teflon-membrane filter (for mass, babs, and elemental analyses) backed up by a citric-acid-impregnated cellulose-fiber filter (for ammonia), and 2) each quartz/NaCl filter packconsists of a front quartz-fiber filter (for ion and carbon analyses) backed up by asodium-chloride-impregnated cellulose-fiber filter (for volatilized nitrate).
Anchor site winter intensive sampling included both SFS for PM2.5 sampling andsequential gas samplers (SGS) for ammonia and nitric acid sampling by denuderdifference on 15 forecast episode days (12/15/00 to 12/18/00, 12/26/00 to 12/28/00,01/04/01 to 01/07/01, and 01/31/01 to 02/03/01). Sampling periods during the forecastdays were 0000-0500, 0500-1000, 1000-1300, 1300-1600 and 1600-2400. The two SGSwere equipped with: 1) citric-acid-coated glass denuders and quartz-fiber filters backedup by citric-acid-impregnated cellulose-fiber filters for ammonia (NH3); and 2) anodizedaluminum denuders and quartz-fiber filters backed up by sodium-chloride-impregnatedcellulose-fiber filters for nitric acid (HNO3).
The satellite annual sampling program used battery-powered Minivol samplers(Airmetrics, Eugene, OR) equipped with PM10/PM2.5 (in tandem) or PM10 inlets at a flowrate of 5 L/min.
Satellite site annual sampling program included every-sixth-day 24-hour sampling at 35PM2.5 sites and 7 PM10 sites between 12/02/99 and 02/03/01. Particulate organiccompounds were sampled at 20 sites between 02/06/00 and 01/31/01.
Satellite site fall intensive study included 24-hour sampling of PM10 on 37 days between10/09/00 and 11/14/00 at 11 sites. 6 sites (COP, H43, HAN, GRA, GRAS, and SFE)were equipped with both Teflon/citric acid and quartz/NaCl filter packs. 5 sites (CO5,DAIP, DAIU, ORE, and YOD) were equipped with only Teflon/citric acid filter packs.
Satellite site winter intensive study included 24-hour sampling of PM2.5 on 13 forecastepisode days (12/15/00 to 12/18/00, 12/25/00, 12/27/00, 12/28/00, 01/04/01 to 01/06/01,and 02/01/01 to 02/03/01) at 25 PM2.5 sites, with 21 of the sites equipped with bothTeflon/citric acid and quartz/NaCl filter packs.
Minivol module A: PM2.5 Teflon/citric acid filter packs at 35 satellite sites. Each filterpack consisted of a front Teflon-membrane filter (for mass, babs, and elements)backed up by a citric-acid-impregnated cellulose-fiber filter (for ammonia).
2-2
Minivol module B: PM2.5 quartz/NaCl filter packs at 29 satellite sites (same sites asmodule A but excluding ALT1, PAC1, KCW, EDI, CARP, and TEH2). Eachfilter pack consisted of a front pre-fired quartz-fiber filter (for ions and carbon)backed up by a sodium-chloride-impregnated cellulose-fiber filter (for volatilizednitrate).
Minivol module D: PM2.5 Teflon-impregnated glass-fiber filters (TIGF) at a total of 20sites (including 3 annual anchor sites [Fresno, Angiola, and Bakersfield], 14annual satellite sites, the San Jose-4th St. [SJ4] site, the Sacramento-Del PasoManor [SPP] site, and the Yosemite [YOSE1] site). A total of 61 samplesacquired over the yearlong sampling period were composited as one sample andanalyzed by gas chromatography with mass spectrometry (GC/MS) for 151particulate organic compounds as listed in footnote d above.
Minivol module g: PM10 Teflon/citric acid filter packs at 16 satellite sites, 4 of which(M14, VCS, COP, and OLD) were collocated with annual PM2.5 measurements,and 7 of which (M14, VCS, COP, FSD, BGS, HAN, and OLD) were annual PM10sites. Each filter pack consisted of a front Teflon-membrane filter (for mass, babs,and elements) backed up by a citric-acid-impregnated cellulose-fiber filter (forammonia).
Minivol module h: PM10 quartz/NaCl filter packs at 16 satellite sites, 4 of which werecollocated with annual PM2.5 measurements (M14, VCS, COP, and OLD), and 7of which (M14, VCS, COP, FSD, BGS, HAN, and OLD) were annual PM10 sites.Each filter pack consisted of a front quartz-fiber filter (for ion and carbonanalyses) backed up by a sodium-chloride-impregnated cellulose-fiber filter (forvolatilized nitrate).
During the Anchor sites winter intensive the Fresno and Angiola sites were equippedwith Micro Orifice Uniform Deposit Impactor (MOUDI) samplers. Three samplers weredeployed at each site with one collecting Teflon substrates for mass and elementalanalyses, a second collecting Teflon substrates for ion analyses and third collectingaluminum substrates for carbon analysis.
The MOUDI samplers were run on the winter intensive schedule’s 15 forecast episodedays but were run every other sampling period in order to allow for substrate changesbetween sampling periods. During the first winter sampling episode the MOUDIs wereconfigured with the following stages, 5.62, 2.5, 1.8, 1.0, 0.56, 0.32, 0.18, 0.10 and <0.10microns. After the first episode we obtained new 0.05 micron impaction plates from themanufacturer and shifted the cutpoints to 5.62, 2.5, 1.0, 0.56, 0.32, 0.18, 0.10, 0.05 and<0.05 microns for all subsequent samples.

2-3
2.1 Analysis Methods:
2.1.1 Gravimetric Analysis
Unexposed and exposed Teflon-membrane filters are equilibrated at a temperature of21.5 ± 1.5 °C and a relative humidity of 35 ± 5% for a minimum of 24 hours prior toweighing. Weighing is performed on a Mettler MT-5 electro microbalance with ±0.001mg sensitivity. The charge on each filter is neutralized by exposure to a polonium sourcefor 30 seconds before the filter is placed on the balance pan. The balance is calibratedwith a 200 mg Class S weight and the tare is set prior to weighing each batch of filters.After every 10 filters are weighed, the calibration and tare are re-checked. If the results ofthese performance tests deviate from specifications by more than ±5 mg, the balance isre-calibrated.
All initial filter weights are checked by an independent technician. Samples are re-weighed if these check-weights do not agree with the original weights within ±0.010 mg.At least 30% of the exposed filter weights are checked by an independent technician.Samples are re-weighed if these check-weights do not agree with the original weightswithin ±0.015 mg. Pre- and post-weights, check weights, and re-weights (if required) arerecorded on data sheets and are directly entered into a data base via an RS232 connection.All weights are entered by filter number into the DRI aerosol data base.
2.1.2 Elements by XRF
After gravimetric analysis, samples collected on the Teflon-membrane filters wereanalyzed by energy dispersive X-ray fluorescence (ED-XRF, Kevex 0700) for thefollowing 40 elements: sodium (Na), magnesium (Mg), aluminum (Al), silicon (Si),phosphorus (P), sulfur (S), chlorine (Cl), potassium (K), calcium (Ca), titanium (Ti),vanadium (V), chromium (Cr), manganese (Mn), iron (Fe), cobalt (Co), nickel (Ni),copper (Cu), zinc (Zn), gallium (Ga), arsenic (As), selenium (Se), bromine (Br), rubidium(Rb), strontium (Sr), yttrium (Y), zirconium (Zr), molybdenum (Mo), palladium (Pd),silver (Ag), cadmium (Cd), indium (In), tin (Sn), antimony (Sb), barium (Ba), gold (Au),mercury (Hg), thallium (Tl), lead (Pb), lanthanum (La), and uranium (U).
Calibration is performed using thin film standards from Micromatter Inc. A multielementthin film standard is analyzed with each run to monitor for calibration drift and is used asthe indicator for routine calibrations.
2.1.3 Elemental and Organic Carbon
The thermal/optical reflectance (TOR) method measures organic (OC) and elemental(EC) carbon. The TOR method is based on the principle that different types of carbon-containing particles are converted to gases under different temperature and oxidationconditions. The different carbon fractions from TOR are useful for comparison with

2-4
other methods which are specific to a single definition for OC and EC. These specificcarbon fractions also help distinguish among seven carbon fractions reported by TOR:
• The carbon evolved in a helium atmosphere at temperatures between ambientand 120 °C (OC1)
• The carbon evolved in a helium atmosphere at temperatures between 120 °Cand 250 °C (OC2)
• The carbon evolved in a helium atmosphere at temperatures between 250 °Cand 450 °C (OC3)
• The carbon evolved in a helium atmosphere between 450 °C and 550 °C(OC4)
• The carbon evolved in an oxidizing atmosphere at 550 °C (EC1)
• The carbon evolved in an oxidizing atmosphere between 550 °C and 700 °C(EC2)
• The carbon evolved in an oxidizing atmosphere between 700 °C and 800 °C(EC3)
The thermal/optical reflectance carbon analyzer consists of a thermal system and anoptical system. The thermal system consists of a quartz tube placed inside a coiledheater. Current through the heater is controlled to attain and maintain pre-settemperatures for given time periods. A portion of a quartz filter is placed in the heatingzone and heated to different temperatures under non-oxidizing and oxidizingatmospheres. The optical system consists of a He-Ne laser, a fiber optic transmitter andreceiver, and a photocell. The filter deposit faces a quartz light tube so that the intensityof the reflected laser beam can be monitored throughout the analysis.
As the temperature increases from ambient (~25 °C) to 550 °C, organic carboncompounds are volatilized from the filter in a non-oxidizing (He) atmosphere whileelemental carbon is not oxidized. When oxygen is added to the helium at temperaturesgreater than 550 °C, the elemental carbon burns and enters the sample stream. Theevolved gases pass through an oxidizing bed of heated manganese dioxide where they areoxidized to carbon dioxide, then across a heated nickel catalyst which reduces the carbondioxide to methane (CH4). The methane is then quantified with a flame ionizationdetector (FID).
The reflected laser light is continuously monitored throughout the analysis cycle. Thenegative change in reflectance is proportional to the degree of pyrolytic conversion from

2-5
organic to elemental carbon which takes place during organic carbon analysis. Afteroxygen is introduced, the reflectance increases rapidly as the light-absorbing carbon isburned off the filter. The carbon measured after the reflectance attains the value it had atthe beginning of the analysis cycle is classified as elemental carbon. This adjustment forpyrolysis in the analysis is significant, as high as 25% of organic or elemental carbon,and it cannot be ignored.
The system is calibrated by analyzing samples of known amounts of methane, carbondioxide, and potassium hydrogen phthalate (KHP). The FID response is ratioed to areference level of methane injected at the end of each sample analysis. Performance testsof the instrument calibration are conducted at the beginning and end of each day'soperation. Intervening samples are re-analyzed when calibration changes of more than±10% are found.
Known amounts of American Chemical Society (ACS) certified reagent grade crystalsucrose and KHP are committed to TOR as a verification of the organic carbon fractions.Fifteen different standards are used for each calibration. Widely accepted primarystandards for elemental and/or organic carbon are still lacking. Results of the TORanalysis of each filter are entered into the DRI data base.
2.1.4 Inorganic Ion Analyses
Water-soluble chloride, nitrate, sulfate, ammonium, sodium, and potassium are obtainedby extracting the quartz-fiber particle filter in 15 ml of deionized-distilled water (DDW).The extraction vials are capped and sonicated for 60 minutes, shaken for 60 minutes, thenaged overnight to assure complete extraction of the deposited material in the solvent.The ultrasonic bath water is monitored to prevent temperature increases from thedissipation of ultrasonic energy in the water. After extraction, these solutions are storedunder refrigeration prior to analysis.
2.1.5 Ion Chromatographic Analysis for Chloride, Nitrate, and Sulfate
Water-soluble chloride (Cl-), nitrate (NO3-), and sulfate (SO4
=) are measured with theDionex 2020i (Sunnyvale, CA) ion chromatograph (IC). In IC, an ion-exchange columnseparates the sample ions in time for individual quantification by a conductivity detector.Prior to detection, the column effluent enters a suppressor column where the chemicalcomposition of the component is altered, resulting in a matrix of low conductivity. Theions are identified by their elution/retention times and are quantified by the conductivitypeak area. Approximately 2 ml of the filter extract are injected into the ionchromatograph. The resulting peaks are integrated and the peak integrals are converted toconcentrations using calibration curves derived from solution standards. The Dionexsystem for the analysis of Cl-, NO3
-, and SO4= contains a guard column (AG4a column,
Cat. No. #37042), an anion separator column (AS4a column, Cat. No. #37041) with astrong basic anion exchange resin, and an anion micro membrane suppressor column(250 ´ 6 mm ID) with a strong acid ion exchange resin. The anion eluent consists of

2-6
sodium carbonate (Na2CO3) and sodium bicarbonate (NaHCO3) prepared in DDW. TheDDW is verified to have a conductivity of less than 1.8 ´ 10-5 ohm/cm prior topreparation of the eluent. For quantitative determinations, the ion chromatograph isoperated at a flow rate of 2.0 ml/min.
The primary standard solution containing NaCl, NaNO3, and (Na)2SO4 is prepared withreagent grade salts dried in an oven at 105 °C for one hour and then brought to roomtemperature in a desiccator. These anhydrous salts are weighed to the nearest 0.10 mg ona routinely calibrated analytical balance under controlled temperature (~20 °C) andrelative humidity (±30%) conditions. These salts are diluted in precise volumes of DDW.Calibration standards are prepared at least once each month by diluting the primarystandard solution to concentrations covering the range expected in the filter extracts.These standards are then stored in a refrigerator. The calibration concentrations preparedare at 0.1, 0.2, 0.5, 1.0, and 2.0 mg/ml for each of the analysis species.
Calibration curves are performed weekly. Chemical compounds are identified bymatching the retention time of each peak in the unknown sample with the retention timesof peaks in the chromatograms of the standards. A DDW blank is analyzed after every20 samples and a calibration standard is analyzed after every 10 samples. These qualitycontrol checks verify the baseline and the calibration, respectively. EnvironmentalResearch Associates (ERA, Arvada, CO) standards are used daily as an independentquality assurance (QA) check. These standards (ERA Wastewater Nutrient and ERAMineral WW) are traceable to NIST simulated rainwater standards. If the valuesobtained for these standards do not coincide within a pre-specified uncertainty level(typically three standard deviations of the baseline level or ±5%), the samples betweenthat standard and the previous calibration standards are re-analyzed.
After analysis, the printout for each sample in the batch is reviewed for the following: 1)proper operational settings, 2) correct peak shapes and integration windows, 3) peakoverlaps, 4) correct background subtraction, and 5) quality control sample comparisons.When values for replicates differ by more than ±10% or values for standards differ bymore than ±5%, samples before and after these quality control checks are designated forre-analysis in a subsequent batch. Individual samples with unusual peak shapes,background subtractions, or deviations from standard operating parameters are alsodesignated for re-analysis.
Using the same IC analysis procedure, water soluble nitrate and nitric acid concentrationsare obtained from the NaCl impregnated cellulose backup filter and the denuded and non-denuded filter packs from the Nitric Acid Sequential Gas Samplers (SGS).
2.1.6 Ammonium Analysis
An Astoria 2 AC system (Astoria–Pacific, Clackamas, OR) was used to measure NH4+
concentration by the indolphenol method. Each sample was mixed with reagents andsubjected to appropriate reaction periods before submission to the colorimeter. Beer’s

2-7
Law relates the liquid’s absorbency to the amount of the ion in the sample. Aphotomultiplier tube measured this absorbency through an interference filter, which isspecific to NH4
+. Two ml of extract in a sample vial were placed in a computer-controlledautosampler. Calibration curves are produced with each daily batch of samples.
The same analysis method was used for the determination of ammonia concentrationsfrom the citric acid impregnated backup filters as well as the denuded and non-denudedfilter packs from the Ammonia Sequential Gas Samplers (SGS).
2.1.7 Atomic Absorption Analysis for Soluble metals
Soluble sodium, magnesium, potassium and calcium were measured using a VarianSpectra AA-880 atomic absorption spectrophotometer. In atomic absorptionspectrophotometry the sample is aspirated into a flame and atomized. A light beam froma hollow cathode lamp is directed through the flame, into a monochromator, and onto aphotoelectric detector that measures the amount of light absorbed by the atomizedelement in the flame. The cathode of a hollow cathode lamp contains the pure metalwhich results in a line source emission spectrum. Since each element has its owncharacteristic absorption wavelength, the source lamp composed of that element is used.The amount of energy of the characteristic wavelength absorbed in the flame isproportional to the concentration of the element in the sample. Calibration curves areproduced with each daily batch of samples.

2-8
Table 2.1-1. Minimum detectable limits (MDLs) of chemical species using DRI standardanalysis protocols.
SpeciesAnalysisMethoda
MDLb
(µg/filter)MDLc
(µg/m3)Chloride (Cl-) IC 1.5005 0.0625Nitrite (NO2-) IC 1.5005 0.0625Nonvolatilized Nitrate (NO3
-) IC 1.5005 0.0625Volatilized Nitrate (NO3
-) IC 1.5005 0.0625Nitric Acid (HNO3) IC 1.5005 0.0625Sulfate (SO4
=) IC 1.5005 0.0625Ammonium (NH4
+) AC 1.5005 0.0625Ammonia (NH3) AC 1.5005 0.0625Soluble Sodium (Na+) AAS 0.2362 0.0098Soluble Magnesium (Mg++) AAS 0.0547 0.0023Soluble Potassium (K+) AAS 0.1498 0.0062Soluble Calcium (Ca++) AAS 0.0979 0.0041Organic Carbon (OC) TOR 2.7590 0.1150Elemental Carbon (EC) TOR 2.7590 0.1150Sodium (Na) XRF 0.9533 0.0397Magnesium (Mg) XRF 0.3456 0.0144Aluminum (Al) XRF 0.1382 0.0058Silicon (Si) XRF 0.0864 0.0036Phosphorus (P) XRF 0.0778 0.0032Sulfur (S) XRF 0.0691 0.0029Chlorine (Cl) XRF 0.1382 0.0058Potassium (K) XRF 0.0835 0.0035Calcium (Ca) XRF 0.0634 0.0026Titanium (Ti) XRF 0.0403 0.0017Vanadium (V) XRF 0.0346 0.0014Chromium (Cr) XRF 0.0259 0.0011Manganese (Mn) XRF 0.0230 0.0010Iron (Fe) XRF 0.0202 0.0008Cobalt (Co) XRF 0.0115 0.0005Nickel (Ni) XRF 0.0115 0.0005Copper (Cu) XRF 0.0144 0.0006Zinc (Zn) XRF 0.0144 0.0006Gallium (Ga) XRF 0.0259 0.0011

2-9
Table 2.1-1. (continued)
SpeciesAnalysisMethoda
MDLb
(µg/filter)MDLc
(µg/m3)Arsenic (As) XRF 0.0230 0.0010Selenium (Se) XRF 0.0173 0.0007Bromine (Br) XRF 0.0144 0.0006Rubidium (Rb) XRF 0.0144 0.0006Strontium (Sr) XRF 0.0144 0.0006Yttrium (Y) XRF 0.0173 0.0007Zirconium (Zr) XRF 0.0230 0.0010Molybdenum (Mo) XRF 0.0374 0.0016Palladium (Pd) XRF 0.1526 0.0064Silver (Ag) XRF 0.1670 0.0070Cadmium (Cd) XRF 0.1670 0.0070Indium (In) XRF 0.1786 0.0074Tin (Sn) XRF 0.2333 0.0097Antimony (Sb) XRF 0.2477 0.0103Barium (Ba) XRF 0.7171 0.0299Lanthanum (La) XRF 0.8554 0.0356Gold (Au) XRF 0.0432 0.0018Mercury (Hg) XRF 0.0346 0.0014Thallium (Tl) XRF 0.0346 0.0014Lead (Pb) XRF 0.0403 0.0017Uranium (U) XRF 0.0317 0.0013__________________
a IC = ion chromatography. AC = automated colorimetry. AAS = atomic absorption spectrophotometry.TOR = thermal/optical reflectance. XRF = x-ray fluorescence.
b Minimum detectable limit (MDL) is the concentration at which instrument response equals three timesthe standard deviation of the response to a known concentration of zero.
c MDL assuming a nominal sample volume of 24 cubic meters
2.2 Measurement Validity
All of the filtered-based measurements are validated. Ninety-five percent of the samplespassed the Level I and Level II tests.
Level II data validation was performed as each batch of analysis data was completed.Individual database files are saved in spreadsheet programs to allow linear regressionplotting of the following: sum of measured species versus mass, sulfate versus totalsulfur, chloride versus total chlorine, soluble potassium versus total potassium, measuredanions versus measured cations, and measured versus predicted ammoniun.
Mass and elemental measurements done on the Teflon filters are non-destructive thusallowing reanalysis if needed. Quartz and cellulose filters are quantitatively cut in half,with one half being extracted and analyzed and the second half archived for future

2-10
analysis if needed.
Plot outliers were identified and these filter pairs were further scrutinized by recheckingfield data and analysis results and applying flags as appropriate. If no problems wereidentified with the field data or the original analysis results the filter was sent forreanalysis. Reanalysis results were merged into the database and a replicate ‘r’, flag wasadded to that analysis method flag field. Analysis data not flagged as void, ‘v’, areconsidered to be valid when the validation flags (field and analysis) are included with thedata point.
The measured sum of species should be less than or equal to the gravimetricallydetermined mass concentration. Figure 2.2-1 below is the plot of the PM10 satellite sitesdata that shows good agreement overall with four obvious plot outliers above theregression line, these filter pairs were reanalyzed and flagged. Similar plots for all of theCRPAQS data have been produced.
y = 0.7287x + 4.3579R2 = 0.9358
0.0
50.0
100.0
150.0
200.0
250.0
0.0 50.0 100.0 150.0 200.0 250.0
Mass (micrograms/m3)
Sum
of S
peci
es (m
icro
gram
s/m
3)
Figure 2.2-1. Summed PM10 mass versus gravimetric PM10 mass during CRPAQS.
The validation plot for measured versus calculated ammonium for the PM10 satellite sitesis shown in Figure 2.2-2 below, good agreement is shown for the independentmeasurements (measured by automated colorimetry and calculated by ionchromatography) of particulate ammonium thereby validating the data from bothmethods.

2-11
y = 1.0138x + 0.1483R2 = 0.965
y = 1.0409x + 0.4375R2 = 0.9679
0.0
5.0
10.0
15.0
20.0
25.0
30.0
0.0 5.0 10.0 15.0 20.0 25.0 30.0
Measured Ammonium (micrograms/m3)
Cal
cula
ted
Am
mon
ium
(mic
rogr
ams/
m3)
(NH4)2SO4NH4HSO4Linear (NH4HSO4)Linear ((NH4)2SO4)
Figure 2.2-2. Comparisons between measured ammonium and calculated ammoniumbased on nitrate and sulfate measurements.
The ratio of measured anions to measured cations showed very good agreement in theCRPAQS datasets, for example, the PM10 satellite sites data has a slope of 1.07 with acorrelation coefficient of 0.98, this shows that adequate ions for closure in the ion balancewere measured during the study.
Validation of all of the physical consistency of the measurement data is done in ananalogous manner, with each of the checks listed above performed for each dataset.

3-1
3.DATABASE STRUCTURES AND FEATURES
The raw CRPAQS data was processed with Microsoft FoxPro 2.6 for Windows(Micrsosoft Corp., 1994), a commercially available relational database managementsystem. FoxPro can handle 256 fields of up to 4,000 characters per record and up to onebillion records per file. The data base files (*.DBF) can also be read directly into avariety of popular statistical, plotting, data base, and spreadsheet programs withoutrequiring any specific conversion software. After processing, the final CRPAQS datawere converted from FoxPro to Microsoft Excel format for reporting purposes.
In FoxPro, one of five field types (character, date, numerical, logical, or memo) wasassigned to each observable. Sampling sites and particle size fractions are defined as“character” fields, sampling dates are defined as “date” fields, and measured data aredefined as “numeric” fields. “logical” fields are used to represent a “yes” or “no” valueapplied to a variable, and “memo” fields accommodate large blocks of text and are usedto document the data validation results.
Data contained in different XBase files can be linked by indexing on and relating tocommon attributes in each file. Sampling site, sampling hour, sampling period, particlesize, and sampling substrate IDs are, typically, the common fields that can be used torelate data in one file to the corresponding data in another file.
To assemble the final data files, information was merged from many data files derivedfrom field monitoring and laboratory analyses by relating information on the commonfields cited above.
Measurement precisions were propagated from precisions of the volumetricmeasurements, the chemical composition measurements, and the field blank variabilityusing the methods of Bevington (1969) and Watson et al. (1995). The followingequations calculated the precision associated with filter-based measurements:
Ci = (Mi – Bi)/V (3-1)V = F × t (3-2)
Bi = 1n
Bijj 1
n
=∑ for Bi > σBi (3-3)
Bi = 0 for Bi ≤ σBi (3-4)
σBi = STDBi = [ 1n -1
(B B ) ]ijj 1
n
i2 1/2
=∑ − for STDBi>SIGBi (3-5)
σBi = SIGBi = [1n
( ) ]Bijj 1
n2 1/2σ
=∑ for STDBi ≤ SIG4Bi (3-6)
σCi = [V
(M B )V
]Mi2
Bi2
2V
2i i
2
41/2σ σ σ+
+− (3-7)
3-2
σRMSi = ( 1n
)Ci2 1/2
j 1
n
σ=∑ (3-8)
σV/V = 0.05 (3-9)
where:
Bi = average amount of species i on field blanksBij = the amount of species i found on field blank jCi = the ambient concentration of species iF = flow rate throughout sampling periodMi = amount of species i on the substrateMijf = amount of species i on sample j from original analysisMijr = amount of species i on sample j from replicate analysisn = total number of samples in the sumSIGBi = the root mean square error (RMSE), the square root of the averaged
sum of the squared of σBij.STDBi = standard deviation of the blankσBi = blank precision for species iσBij = precision of the species i found on field blank jσCi = propagated precision for the concentration of species iσMi = precision of amount of species i on the substrateσRMSi = root mean square precision for species iσV = precision of sample volumet = sample durationV = volume of air sampled
Dynamic field blanks were periodically placed in each sampling system without air beingdrawn through them to estimate the magnitude of passive deposition for the period oftime which filter packs remained in a sampler. No statistically significant inter-sitedifferences in field blank concentrations were found for any species after removal ofoutliers (i.e., concentration exceeding three times the standard deviations of the fieldblanks). The average field blank concentrations (with outliers removed) were calculatedfor each species on each substrate (e.g., Teflon-membrane, quartz-fiber), irrespective ofthe sites.
Blank precisions (σBi) are defined as the higher value of the standard deviation of theblank measurements, STDBi, or the square root of the averaged squared uncertainties ofthe blank concentrations, SIGBi. If the average blank for a species was less than itsprecision, the blank was set to zero (as shown in Equation 3-4). The precisions (σMi) forXRF analysis were determined from counting statistics unique to each sample. Hence,the σMi is a function of the energy-specific peak area, the background, and the area underthe baseline.

3-3

4-4
4. REFERENCES
Watson, J.G.; Chow, J.C.; and Frazier, C.A. (1999). X-ray fluorescence analysis ofambient air samples. In Elemental Analysis of Airborne Particles, Vol. 1, S.Landsberger and M. Creatchman, Eds. Gordon and Breach Science, Amsterdam,pp. 67-96.
Chow, J.C.; and Watson, J.G. (1999). Ion chromatography in elemental analysis. InElemental Analysis of Airborne Particles, Vol. 1, S. Landsberger and M.Creatchman, Eds. Gordon and Breach Science, Amsterdam, pp. 97-137.
Bevington, P.R. (1969). Data Reduction and Error Analysis for the Physical Sciences.McGraw Hill, New York, NY.
Watson, J.G.; Lioy, P.J.; and Mueller, P.K., (1995). The measurement process: Precision,accuracy, and validity. In Air Sampling Instruments for Evaluation ofAtmospheric Contaminants, Cohen, B.S. and Hering, S.V., editors. AmericanConference of Governmental Industrial Hygienists, Cincinnati, OH, pp. 187-194.