crowdrem: harnessing the power of the mobile crowd for
TRANSCRIPT

CrowdREM: Harnessing the Power ofthe Mobile Crowd for Flexible Wireless Network Monitoring
Andreas Achtzehn, Janne Riihijärvi, Irving Antonio Barría Castillo,Marina Petrova, Petri Mähönen
Institute for Networked Systems, RWTH Aachen UniversityKackertstrasse 9, D-52072 Aachen, Germany
{aac, jar, iba, mpe, pma}@inets.rwth-aachen.de
ABSTRACTHigh-speed mobile broadband connections have opened ex-citing new opportunities to collect sensor data from thou-sands or even millions of distributed mobile devices for thepurpose of crowdsourced decision making. In this paper, wepropose CrowdREM (crowdsourced radio environment map-ping), a framework with the specific aim of monitoring andmodelling wireless cellular networks. CrowdREM enablesoperator-independent and highly efficient collection of net-work performance data along all layers of the communica-tions protocol stack. Such extensive information on networkload, spectrum usage, or local coverage can help operatorsto optimize their networks and service quality and enableimproved consumer decision making. In this paper, we in-troduce the CrowdREM mobile architecture and show firstresults from a prototype implementation on open-source mo-bile phones. We demonstrate the versatility of using com-modity devices for network and spectrum monitoring, andpresent the challenges originating from the use of uncali-brated and low-precision measurement equipment. We haveacquired an extensive data set from using our prototype im-plementation in a 21-day measurement campaign coveringmore than 1 000 hours of measurement data. From this wepresent and discuss the potential derivation of tangible andrelevant network performance and signal quality indicators,which could, e.g., be conducted by independent parties.
Categories and Subject DescriptorsC.2.3 [Computer-Communication Networks]: [Networkmonitoring]; C.4 [Performance of Systems]: Measure-ment techniques
General TermsMeasurement; Performance; Reliability
KeywordsCrowdsourcing; Mobile; Drive Testing; Cellular Networks
Permission to make digital or hard copies of all or part of this work for personal orclassroom use is granted without fee provided that copies are not made or distributedfor profit or commercial advantage and that copies bear this notice and the full cita-tion on the first page. Copyrights for components of this work owned by others thanACM must be honored. Abstracting with credit is permitted. To copy otherwise, or re-publish, to post on servers or to redistribute to lists, requires prior specific permissionand/or a fee. Request permissions from [email protected]’15, February 12–13, 2015, Santa Fe, New Mexico, USA.Copyright is held by the owner/author(s). Publication rights licensed to ACM.ACM 978-1-4503-3391-7/15/02 ...$15.00.http://dx.doi.org/10.1145/2699343.2699348.
1. INTRODUCTIONThe densification and complexity explosion of wireless cel-
lular networks is putting high burdens on network opera-tors. Monitoring their networks for coverage holes or lowperformance becomes increasingly difficult, if not impossi-ble. Traditional approaches of carrying out extensive drivetesting campaigns with expensive personnel and equipmentare reaching their limits, and it has become obvious thatthe “intelligence of the crowd” will need to be employedin order to manage networking complexities. LTE release10 [8] has therefore foreseen a possibility to collect networkperformance statistics from user equipment (UE). A signif-icant limitation of a proposed minimization of drive testing(MDT) is its focus on a single network and few user link per-formance aspects. For establish a truly comprehensive viewof wireless network operations, extended means of collectingperformance statistics from UEs will need to be employed.
Several projects already gather performance data on cel-lular networks for this purpose, see [7]. NetRadar [2] collectstraces from mobile devices to acquire localized link through-put statistics; OpenCellID [5] collects cell tower informationand correlates them with user locations to establish networkdensity and coverage maps; and finally, OpenSignal [12]measures the signal strength of cell towers to estimate achiev-able throughputs. However, none of the current approachesyet takes a holistic view along all operators and protocol lev-els to enable advanced modelling, e.g. through spatial statis-tics and machine learning based filtering methods, to buildhighly relevant coverage and performance estimates.
In this paper, we present CrowdREM, a framework for col-lecting spectrum usage and protocol data with sensor fusioncapabilities. CrowdREM’s uniqueness comes from its capa-bility to jointly collect spectrum and performance data fromseveral local network operators; both, at the level of puresignal level measurements as well as through monitoring ofrelevant control traffic. Such extensive data, if combined andcross-correlated with local information [3] and other higherlayer performance metrics, can yield an enhanced under-standing of the current state of the radio environment [14, 6].This will help operators to conduct terminal-centric networktuning, and allows users to adapt their download schedulesto reduce radio activity overheads [4]. Further, CrowdREMmay be maintained, e.g., by a third party to offer real-time,independent information for consumers and local regulators.
To demonstrate its feasibility, we have implemented aproof-of-concept CrowdREM on an open-source mobile phoneplatform. We present the challenges of distributed spectrumsensing with inexpensive hardware such as the signal degra-

System sensorslocation, orientation, brightness, …
RF spectrum samplingPower samples over frequency
collection
Control traffic samplingCollection of paging and
network messages
Base-bandCPU
GenericCPU
User equipment
UE functionalities
CrowdREM scheduler
CrowdREM local DB
Crow
dREM
synch
CrowdREM cloud backend
CrowdREM controller
CrowdREM DB
Crow
dREM
synch
CrowdREM
data miningand
visualization
CrowdREM users
Figure 1: The CrowdREM architecture.
dation due to non-uniform antenna patterns, uncertaintieson phone placement, and packet-loss induced statistical biasthat need to be considered and compensated for. Our workthereby goes beyond earlier works, e.g. [9], that require com-plex signal processing on non-commodity hardware, and donot lend themselves for application in crowdsourcing. Wehave extensively tested our design with data from approxi-mately 13 000 measurement sessions, which constitute morethan 1 000 hours of monitoring data. We present both find-ings from calibrating the hardware and results on the signalstability over several days of measurements in stationary se-tups. Further, we provide initial results from the data min-ing of the approximately 70 million samples of control trafficmessages, which underlines the benefit of crowdsourced col-lection to generate more precise network load estimates.
The rest of this paper is organized as follows: In Section2 we present the CrowdREM architecture and its prototypeimplementation. In Section 3 we discuss, through examplesof calibration measurements with our own base station anda comparison study in a fixed location, the limitations ofsingle-device measurements. Section 4 further analyzes cen-soring methods for network measurements in low signal levelenvironments, and the benefits of data fusion at a centralcoordinating entity for deriving tangible data on networkperformance indicators such as paging rate and immediatechannel assignments. Section 5 concludes this paper.
2. CROWDREM ARCHITECTUREIn the following we provide a brief overview of the envi-
sioned CrowdREM architecture. CrowdREM differs fromapproaches such as [9] as it is designed to operate on regu-lar UEs, e.g. smartphones, tablets, or laptops with wirelessconnections. Fig. 1 shows that its design is divided betweenlocal data collection, cloud data processing, and storage.
At the core of the UE components, a CrowdREM sched-uler manages the collection of radio environment and sys-tem data. Its main purpose is to balance the requirementsof data storage and sampling costs in terms of energy con-sumption and service level, with the purpose of minimizingthe impact of CrowdREM on the UEs regular operationsand battery lifetime. As noted by Lane et al. [10], advancedprediction-based schedulers for smartphone crowdsourcingcan reduce energy consumption by up to 90% depending onthe scenario. For this purpose, the scheduler runs a dynamic
collection policy, which can be adapted if, e.g., more ex-tensive data collection becomes necessary. The CrowdREMscheduler furthermore monitors user behavior, in order topreempt collection tasks when user interactions take place.The power of a policy-based data collection lies in the flex-ibility of defining rules for the collection process. It con-stantly monitors relevant system sensors such as the bright-ness sensor or the gyroscope to determine where the UE iscurrently located, and whether deviations from the regularcollection schedule are necessary.
Our architectures separates pure RF spectrum samplingfrom the collection of control traffic data. RF samplingcomprises sweeps over the various frequency bands to deter-mine power levels according to a scheduler-defined frequencyplan and bandwidth selection. The scheduler needs to takeparticular care that this will not disrupt ongoing transmis-sions. In contrast, control traffic collection may be carriedasynchronously and even while user interactions take place.While normally UEs discard control traffic not intended fortheir own operations, for CrowdREM the baseband systemneeds to pass through all messages. Further, the CrowdREMscheduler needs to enforce a channel sequence to be moni-tored and a dwell time for the collection of control messages.We find that control traffic information is well suited to de-termine network load, because it alleviates the hidden nodeproblem pure power sampling approaches as used e.g. in [4]face. The extra power required for control traffic samplingitself is minimal, since the UE constantly needs to mon-itor broadcast transmissions anyways; any overheads thusoriginate from storing and processing steps. The collectedmeasurements are augmented with regular system sensor in-formation to determine, e.g. the relative orientation of theUE towards the serving cell tower. They are stored in alocal database, which is synchronized asynchronously anddepending on bandwidth availability with the cloud-basedpart of the CrowdREM architecture.
All heavy processing tasks of CrowdREM have been de-signed to operate in the cloud to provide better battery life-time of the UEs, maximize the crowdsourcing benefits, andminimize maintenance overheads. A central CrowdREMcontroller manages the integrated UEs by distributing thehigh-level collection policy. The controller uses the availabledata in the CrowdREM data mining backend. For example,it would increase the sampling cycle for UEs located in re-gions of high network load volatility or limited sampling de-vice density. The CrowdREM controller would then adaptthe policy of a selection of UEs to create more fine-grainedsampling results. As the CrowdREM controller has a globalview of the radio environment, its decision making is draw-ing directly from the distributed nature of the crowdsourcingapproach. Several data views can be defined to study thevarious performance aspects of the network. Thereby, differ-ent stakeholders can review the CrowdREM data accordingto their analysis needs.
2.1 Prototype ImplementationWe have implemented a fully functional prototype of the
CrowdREM architecture on the OpenMoko platform. Open-Moko [11] is an open-source project that offers smartphoneswith fully disclosed hard- and software. The architecture issimilar to that of commercial devices as it offloads signal pro-cessing into a baseband processor. Applications and man-agement run in a separate embedded processor. Although

the used APIs are OpenMoko-specific, their capabilities areimplemented in every mobile phones. We presume that ven-dors may disclose their APIs given the benefits, based alsoon more recent discussions in the 3GPP MDT context.
After installing a modified Linux on the phone, the base-band processor firmware was replaced by OsmocomBB [13],a software suite which provides layer 1 to 3 functionalitieswith a fully open API. We have designed a wrapper to con-trol OsmocomBB, collect data, and store it in the local datarepository. We note that, while these steps are necessaryfor this particular platform, commercial smartphones mayexpose the same API without firmware modification. Therequired sniffing and power measurement components arenecessarily implemented in any mobile phone, thus we con-sider exposing them e.g. to an Android/iOS app would bereasonable given the benefits for the various stakeholders.
We have conducted an extensive measurement campaignwith the prototype in the mid-sized city of Aachen, Ger-many. To gather network statistics, we distributed identi-cally configured OpenMoko phones to university students.The campaign lasted for 21 days, from which we acquiredapproximately 13,000 measurement session sets. We man-ually selected a simplified collection policy that allowed fora particularly broad data set to be generated at the costof shorter battery lifetime. Each measurement session con-sisted of an initial phase in which the UE1 scanned across allphysical E-GSM channels (ARFCNs) to yield power levelsand network/cell identification information. In the city area,four different network operators are active, thus we selectedfor each of them the strongest ARFCN for collecting controltraffic. The individual per ARFCN dwell time was set to45 seconds and all decodable messages in the logical broad-cast and common control channels (BCCH and CCCH) werestored along with additional system level sensor information.
3. CELLULAR NETWORKRADIO ENVIRONMENT ANALYSIS
Using examples from our prototype implementation wewill in the following show the challenges and opportunitiesin crowdsourced measurement setups. In this section, wefocus on those physical layer measurements that are used todetermine the radio environment of a UE.
3.1 Determining UE OrientationNo UE antenna is perfectly omnidirectional, thus signal
strength variations may be observed even if the position ofthe UE remains unchanged. This defines an initial require-ment for a crowdsourced measurement approach, which isto implement means to determine the relative orientationof the UE to the monitored network infrastructure, e.g. byintegrating gyroscope measurements. In order to illustratethe need for this additional information, we have carried outcalibration measurement through running an open-sourceGSM-BS (OpenBTS) [1] with the popular USRP platformacting as a radio frontend. We mounted the UE to a tripodand took measurements while rotating the phone along itsx, y, and z axis. Note that the UE antenna is located inthe bottom part of the phone. Figure 2 shows that the mea-sured signal strength varies by 4.4 dB when the UE is rolled(rotating the y axis), which can be considered minor and is
1In the following we refer to the GSM mobile station (MS)as UE for the sake of conformity.
020
40
60
80
100
120
140
160
081
200
220
240
260
280
300
320
340
-68 -66 -64 -62 -60 -58 -56 -54
XYZ
Figure 2: Reported signal strength (in dBm) of theCrowdREM prototype with respect to its orienta-tion towards the BS.
within the measurement precision requirements of a GSMphone. While this is an expected outcome due to the geom-etry of the device, larger deviations could be observed whenthe z axis of the UE was rotated. Here, an up to 10.7 dBdifference in signal strength could be observed depending onwhether the bottom of the UE was pointing towards the BSor away from it. Similar observations could be made whenthe phone was rotated while standing upright, i.e. the phoneis considerably more sensitive from the back than from thefront, which is a common antenna design for smartphones.This highlights the necessity to integrate this sensory datain the data collection process and compensate for resultinguncertainties in the analysis.
3.2 UE LocalizationThe second challenge in crowdsourced measurements arises
from imprecisions in the localization process. Small devia-tions in the position of a UE can yield significantly differentmeasurements, particularly when measurements are takenin complex indoor radio environments. This is especiallychallenging since traditional localization methods using GPSgenerally fail to work in such locations. A crowdsourcedmeasurement setup such as CrowdREM must therefore col-lect auxiliary information from the UE sensors to augmentGPS position estimates, e.g. through Wi-Fi fingerprinting.
In the following we illustrate how extensive these measure-ment deviations can become in a single UE scenario withGPS-only positioning. For this, we selected the data froma UE that was often located in the same building duringour measurement campaign. In total, 14 distinct measure-ment periods (comprised of consecutive measurement ses-sions) could be identified where the phone reported to beplaced in an area of approximately 40 m in or around thebuilding. A sensible assumption is that all these measure-ments were taken inside the user’s apartment.
In Fig. 3 we show the mean measured signal strengthon the 4 strongest ARFCNs for all measurement periods.Through readings from the control traffic analysis (see Sec-tion 4) we found that these ARFCN measurements alwaysmap to the same BSs. Up to 8 dB of relative deviation in
1 2 3 4 5 6 7 8 9 10 11 12 13 14−66
−64
−62
−60
−58
−56
−54
−52
consecutive measurement period number
ARFC
N s
igna
l stre
ngth
[dBm
]strongest2nd strongest3rd strongest4th strongest
Figure 3: Observed signal strength of the strongestARFCNs for different consecutive measurement pe-riods. Each period is comprised of several measure-ment sessions, for which we report the mean signalstrength value.
the measurements between consecutive periods are reported,and only for period numbers 9 to 12 more stable results arefound. However, as we can see from the relative values inthe figure, there is an apparent correlation between signalstrength values of the different ARFCNs. We can thus con-clude that despite lower localization precision, it is possibleto at least establish relative signal strength distributions forvarious operators and BSs.
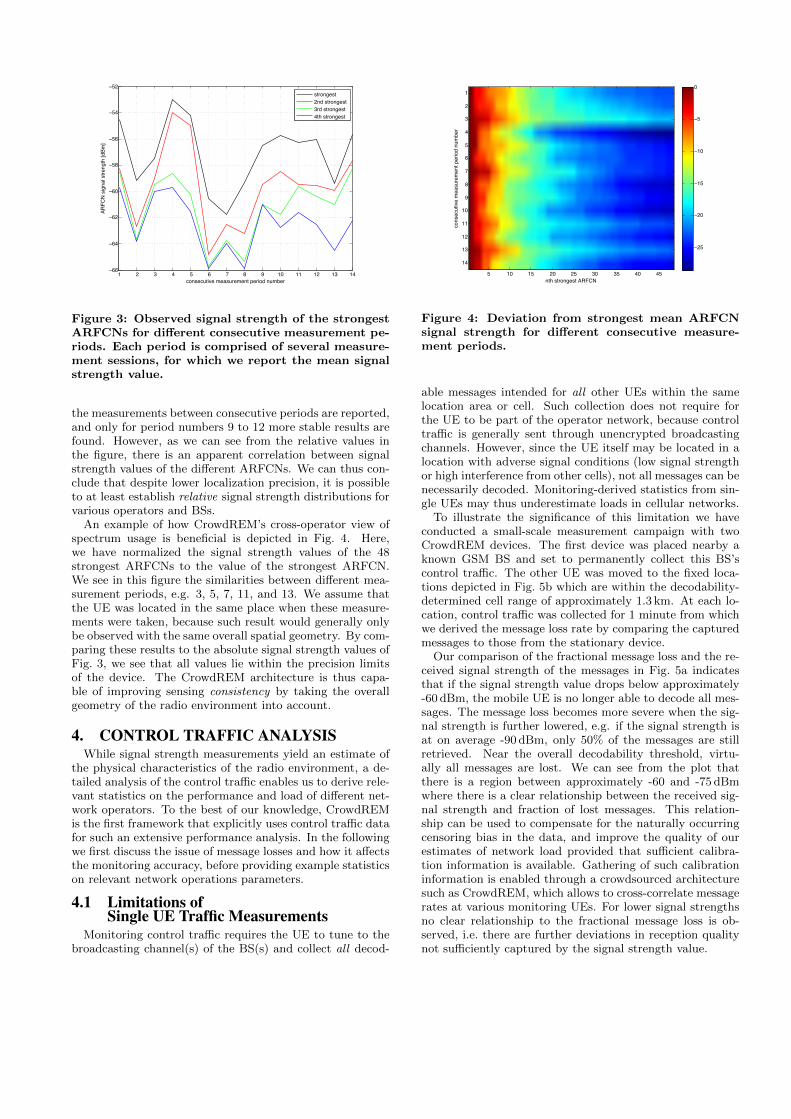
An example of how CrowdREM’s cross-operator view ofspectrum usage is beneficial is depicted in Fig. 4. Here,we have normalized the signal strength values of the 48strongest ARFCNs to the value of the strongest ARFCN.We see in this figure the similarities between different mea-surement periods, e.g. 3, 5, 7, 11, and 13. We assume thatthe UE was located in the same place when these measure-ments were taken, because such result would generally onlybe observed with the same overall spatial geometry. By com-paring these results to the absolute signal strength values ofFig. 3, we see that all values lie within the precision limitsof the device. The CrowdREM architecture is thus capa-ble of improving sensing consistency by taking the overallgeometry of the radio environment into account.
4. CONTROL TRAFFIC ANALYSISWhile signal strength measurements yield an estimate of
the physical characteristics of the radio environment, a de-tailed analysis of the control traffic enables us to derive rele-vant statistics on the performance and load of different net-work operators. To the best of our knowledge, CrowdREMis the first framework that explicitly uses control traffic datafor such an extensive performance analysis. In the followingwe first discuss the issue of message losses and how it affectsthe monitoring accuracy, before providing example statisticson relevant network operations parameters.
4.1 Limitations ofSingle UE Traffic Measurements
Monitoring control traffic requires the UE to tune to thebroadcasting channel(s) of the BS(s) and collect all decod-
nth strongest ARFCN
cons
ecut
ive
mea
sure
men
t per
iod
num
ber
5 10 15 20 25 30 35 40 45
1
2
3
4
5
6
7
8
9
10
11
12
13
14
−25
−20
−15
−10
−5
0
Figure 4: Deviation from strongest mean ARFCNsignal strength for different consecutive measure-ment periods.
able messages intended for all other UEs within the samelocation area or cell. Such collection does not require forthe UE to be part of the operator network, because controltraffic is generally sent through unencrypted broadcastingchannels. However, since the UE itself may be located in alocation with adverse signal conditions (low signal strengthor high interference from other cells), not all messages can benecessarily decoded. Monitoring-derived statistics from sin-gle UEs may thus underestimate loads in cellular networks.
To illustrate the significance of this limitation we haveconducted a small-scale measurement campaign with twoCrowdREM devices. The first device was placed nearby aknown GSM BS and set to permanently collect this BS’scontrol traffic. The other UE was moved to the fixed loca-tions depicted in Fig. 5b which are within the decodability-determined cell range of approximately 1.3 km. At each lo-cation, control traffic was collected for 1 minute from whichwe derived the message loss rate by comparing the capturedmessages to those from the stationary device.
Our comparison of the fractional message loss and the re-ceived signal strength of the messages in Fig. 5a indicatesthat if the signal strength value drops below approximately-60 dBm, the mobile UE is no longer able to decode all mes-sages. The message loss becomes more severe when the sig-nal strength is further lowered, e.g. if the signal strength isat on average -90 dBm, only 50% of the messages are stillretrieved. Near the overall decodability threshold, virtu-ally all messages are lost. We can see from the plot thatthere is a region between approximately -60 and -75 dBmwhere there is a clear relationship between the received sig-nal strength and fraction of lost messages. This relation-ship can be used to compensate for the naturally occurringcensoring bias in the data, and improve the quality of ourestimates of network load provided that sufficient calibra-tion information is available. Gathering of such calibrationinformation is enabled through a crowdsourced architecturesuch as CrowdREM, which allows to cross-correlate messagerates at various monitoring UEs. For lower signal strengthsno clear relationship to the fractional message loss is ob-served, i.e. there are further deviations in reception qualitynot sufficiently captured by the signal strength value.

-50 -60 -70 -80 -90 -100
0.0
0.2
0.4
0.6
0.8
1.0
Received signal strength [ dBm ]
Frac
tion
of m
essa
ges
lost
(a) Fractional message loss vs. received signal strength.
50.778
50.781
50.784
50.787
50.790
6.065 6.070 6.075 6.080 6.085lon
lat
0.00
0.25
0.50
0.75
1.00Loss
(b) Fractional message loss map.
Figure 5: Two UE measurement comparison. Fig. 5ashows the fractional loss of messages compared tothe average RSSI value of the received messages. InFig. 5b the spatial distribution of the loss rate isdepicted.
4.2 Crowdsourced Network Load EstimationA further benefit of using multiple coordinated UEs to
collect control traffic is that message loss and limited UEavailability do not affect the overall collection capability ofthe crowdsourced data mining architecture in CrowdREM.Since only a smaller number of devices are needed if good re-ception quality is experienced, one may extend the batterylifetime of the crowdsourcing UEs by scheduling less fre-quent data collection. In the following, we discuss relevantnetwork load indicators that can be easily derived thereby.The results are illustrative for an advanced data mining thatis enabled by using the CrowdREM architecture.
In our first analysis example we study the network load bymeans of quantifying the paging load observed for a singleoperator. In the GSM system architecture, paging messagesare used to request channel reservations for UEs, e.g. toinitiate a network-initiated voice call. In Fig. 6a we plotthe rate of different paging messages for the location areaof a single operator as measured by various UEs over 17days in our campaign. We see that paging messages aredominated by type 1 requests, which are messages sent toup to 2 devices. Other paging messages for more than twodevices (type 2 and type 3) do not contribute to the over-all paging rate. Surprisingly, there is no apparent correla-tion between the time of day and the paging rate, whichwould have been expected from increased day-time user ac-
0 5 10 15 20 25 3010−5
10−4
10−3
10−2
10−1
100
imm. assignment inter−arrival time (sec)
full day5pm − 5am (night)5am − 5pm (day)complete dataset
0 2 4 6 8 10 12 14 16 18 20 22 240
0.5
1
1.5
2
2.5
3
hour of day
imm
. ass
ignm
ent m
essa
ge ra
te (m
sg/s
ec)
Figure 7: Probability density function of the inter-arrival times of immediate assignment messages forchannel allocation.
tivity. Occasionally, higher paging rates can be observedduring the night, which seems counter-intuitive. On deeperinspection we found that the operators intentionally insertblank paging messages, presumably to allow UEs to synchmore frequently, which also explains the relative steadinessof ARFCN measurements (see Section 3.2) over time. Thus,we conclude that paging messages are a weak indicator ofnetwork load.
A better indicator for network activity is the number ofindividual UEs queried in paging messages. Fig. 6b exhibitsthe expected day-time dependency of network load. Fur-thermore, we can observe that during weekends the numberof paged UEs drops, as seems intuitive. Through compar-ison of the different days we can make further derivationson the user behavior, e.g. increased activity is observed onMonday mornings, whereas the network load steadily dropsalready on Friday afternoons.
The time of day dependency can also be found in an analy-sis of the immediate assignment message rates of a single BS.These messages are sent to allocate channels to UEs withinthe cell, thus they are only observable by a smaller group ofmonitoring UEs in nearby locations. We take the exampleof a single cell that was monitored by a single CrowdREMUE. We note that such analysis is only possible if the UE isnot moved during the day, and when beneficial signal qual-ity levels are observed. For lower signal levels, means ofmessage loss compensation as discussed in Section 4.1 needto be applied. A plot of the probability density functionof the inter-arrival rate in Fig. 7 shows that during nighttimes the inter-arrival time increases, i.e. fewer requestsare made per unit time, while it noticeably decreases start-ing at around 5am in the morning. We can further observelower rates during lunch time, when supposedly less callsare made. Such figures allow for the derivation of tangibleload models for application in network traffic modelling aswe, e.g., can already infer from the data set used to createFig. 7 that heavy-tailed distributions are more appropriateto model the observed time variability.

day 1(tue) day 2(wed) day 3(thu) day 4(fri) day 5(sat) day 6(sun) day 7(mon) day 8(tue) day 9(wed) day 10(thu) day 11(fri) day 12(sat) day 13(sun) day 14(mon) day 15(tue) day 16(wed)0
10
20
30
40
50
60pa
ging
requ
ests
/sec
ond
paging 1 request paging 2 request paging 3 request all paging requestsday 17(thu)
(a) Paging messages.
day 1(tue) day 2(wed) day 3(thu) day 4(fri) day 5(sat) day 6(sun) day 7(mon) day 8(tue) day 9(wed) day 10(thu) day 11(fri) day 12(sat) day 13(sun) day 14(mon) day 15(tue) day 16(wed)0
5
10
15
20
25
30
UEs
pag
ed/s
econ
d
paging 1 request paging 2 request paging 3 request all paging requestsday 17(thu)
(b) Number of UEs paged.
Figure 6: Paging message rates and number of individual paged UEs per second over a period of 17 days fora single location area (LA). Rates depicted here are calculated individually for each 45-second measurementsession.
5. CONCLUSIONSIn this paper, we have presented CrowdREM, a frame-
work for the crowdsourced monitoring of cellular networks.CrowdREM enables the distributed collection of spectrumusage and network information from inexpensive mobile ter-minals to build a comprehensive and holistic view of thestructure and use of wireless networks. Contrary to earlierworks, CrowdREM is not limited to a single operator ornetworking aspect, but it provides means to independentlyderive performance statistics relevant to network operators,customers, and regulators.
Our practical analysis with a prototype implementationhas showcased the benefits of using a crowdsourced datamining, where limitations in positioning accuracy, orienta-tion, and message loss experienced for individual measure-ments can be compensated for through combined samplingfrom multiple sensor entities. We have furthermore usedresults from an extensive measurement campaign coveringmore than 1,000 hours of measurement data on live cellu-lar networks to demonstrate the derivation of relevant net-work performance indicators such as the paging rate, num-ber of active users, and the time dependency of networkload. While our proof-of-concept implementation runs onlyon 2G networks, the principal idea of CrowdREM extendsalso to more current network generations.
In the future we plan to fully integrate and port CrowdREMto other platforms and 3G/4G networks to enable more ex-tensive data collection, whereby we are also interested inother cross-layer metrics such as browser performance. Fur-ther, we are interested in studying social and economic in-centives for participating in a crowdsourced data collection,e.g. through more precision localization from extended en-vironment fingerprinting.
6. REFERENCES[1] OpenBTS. www.openbts.org.
[2] Aalto University. NetRadar. www.netradar.org.
[3] I. Carreras et al. Crowd-sensing: Why contextmatters. In Proc. IEEE PERCOM Workshops, pages368–371, March 2013.
[4] A. Chakraborty et al. Coordinating cellularbackground transfers using LoadSense. In Proc. ACMMobicom, September 2013.
[5] ENAiKOON. OpenCellID. www.opencellid.org.
[6] A. Galindo-Serrano et al. Harvesting MDT data:Radio environment maps for coverage analysis incellular networks. In Proc. CROWNCOM, pages37–42, July 2013.
[7] U. Goel et al. Survey of end-to-end mobile networkmeasurement testbeds. 2014. arXiv:1411.5003 [cs.NI].
[8] W. Hapsari et al. Minimization of drive tests solutionin 3GPP. IEEE Communications Magazine,50(6):28–36, June 2012.
[9] S. Kumar et al. LTE radio analytics made easy andaccessible. In Proc. ACM SIGCOMM, pages 211–222,2014.
[10] N. D. Lane et al. Piggyback crowdsensing (PCS):Energy efficient crowdsourcing of mobile sensor databy exploiting smartphone app opportunities. In Proc.SenSys, pages 7:1–7:14, 2013.
[11] OpenMoko project. OpenMoko. www.openmoko.org.
[12] OpenSignal, Inc. OpenSignal. www.opensignal.com.
[13] OsmocomBB project. OsmocomBB. bb.osmocom.org.
[14] J. van de Beek et al. How a layered REM architecturebrings cognition to today’s mobile networks. IEEEWireless Communications, 19(4):17–24, August 2012.