crowd-sourced price data collection through mobile phones · data collection through mobile phones...
TRANSCRIPT

CROWD-SOURCED PRICE DATA COLLECTION THROUGH MOBILE
PHONES
New Techniques and Technologies for Statistics
NTTS 2013
NADA HAMADEH, Senior Statistician MARKO RISSANEN, Consultant
MIZUKI YAMANAKA, Consultant

INTRODUCTION

if there would be a new way to collect price data that is
Cost-efficient and timely
Enables high item and geographical coverage
Comparable across countries
Open to users
The World Bank Pilot Study for Crowd-Sourced Price Data Collection through Mobile Phones combines the need for high-frequency data, the recent developments in the ICT sector,
and the power of the crowd in an innovative way.
IMAGINE

ICT Development
Over 6 BILLION mobile subscriptions worldwide – 75 % of the world population
now has ACCESS to a MOBILE PHONE
…is making crowd-
sourcing possible

PROJECT DESIGN

The Pilot
The objective was to study the feasibility of crowd-sourced price data collection
JANA
Crowd
The pilot method was implemented by non-professional price collectors (NPCs) as the “crowd,” using Personal Computers (PCs) and mobile phones as modern ICT means for collecting data
The pilot was carried out by a World Bank contracted private company, JANA
Price data was collected for 30 tightly specified food commodity items on a monthly basis
Items

Country Coverage
Country # of
Survey Locations
# of Supermarkets
Language Status Months covered
Bangladesh 47 1,282 English implemented Jan'12 - May'12
Brazil 13 41 Portuguese implemented Jan'12 - May'12
China - - n/a not implemented
Egypt - - English stopped Aug'11 - Sep'11
India 33 405 English implemented Aug'11 - May'12
Indonesia 41 237 Indonesian implemented Sep'11 - May'12
Kenya 41 1,447 English implemented Sep'11 - May'12
Nigeria 35 1,023 English implemented Sep'11 - May'12
Pakistan 49 516 English implemented Dec'11 - May'12
Philippines 38 212 English implemented Dec'11 - May'12
Uganda - - English stopped Oct'11 - Nov'11
Total 297 5,163
In summary, the survey process gathered data successfully for at least six months in India, Kenya and Nigeria, and for at least four months in
Bangladesh, Indonesia, Philippines, Pakistan and, to a lesser degree, in Brazil

Recruitment and Retainment Recruitment of Non-Professional Price
Collectors (NPC), training and price collection survey
was performed using a custom built website
Recruitment
Training and Building Engagement
Price Collection … developed in three languages (English, Portuguese, and
Indonesian) to target focused geographies

Compensation Unique feature of the pilot was payment by airtime using
JANA’s international network of mobile operators
The data collection method benefits NPCs in low and middle income countries
Incentive structure
1st Supermarket $1.00
2nd - 3rd Supermarket
$0.50
Item batch (30 items)
$5.00
Referral bonus $1.00
Item batch: Indonesia
$7.00
Item batch: Brazil
$15.00

Active NPCs
Country Aug '11
Sep '11
Oct '11
Nov '11
Dec '11
Jan '12
Feb '12
Mar '12
Apr '12
May '12
Total
Bangladesh n/a n/a n/a n/a n/a 21 240 671 1,333 162 2,428
Brazil 0 0 0 0 0 1 3 9 17 25 55
Indonesia 0 6 0 0 0 10 43 52 60 44 215
India 1 45 62 71 86 77 112 113 118 42 726
Kenya 0 5 24 73 142 84 151 364 576 493 1,912
Nigeria 0 3 3 53 65 70 221 249 274 53 991
Philippines n/a n/a n/a n/a 5 19 40 45 59 8 176
Pakistan n/a n/a n/a n/a 2 70 119 185 199 79 654
Total 3 60 95 212 300 331 689 1,017 1,303 744 4,751
In total, 4,751 NPCs submitted price data within the pilot project

Data Collected Data collected is broken into three categories:
◦ NPC prequalification data Date of birth, Location, Languages spoken, Level of
education, Mobile phone information, Level of internet access, and other contact details
◦ Supermarket data Name of the supermarket, Location information, and Photograph
of the supermarket
◦ Price data Price of the item identified Weight or volume of the item;
Additional comments; and Photograph of the item
Website stored additional metadata, e.g. country specific currency, timing information, and location information (GPS)
[11] Long grain rice - Non-Parboiled Quantity 0.5 - 1.2 Kilogram
Brand Well known Type Long grain, white rice (milled rice)
Packaging Pre-packed Quality High grade
Preparation Uncooked, non-parboiled
Other features Not enriched, not aromatic (fragrant), not sticky
Exclude Premium rice e.g. Basmati rice, Jasmine rice

DATA ANALYSIS

Data Verification
Each NPC was scored based on various behaviors and the quality of the item batches that they submitted
Verification of the submitted data is a semi-automated process, involving analysis and manual inspection
NPC Scoring HIGH: Automatically verified
NEGATIVE: Blacklisted NEUTRAL: Manually verified
• Frequency of collection, number of batches submitted, length of time taken to submit a batch, and the interval between item batches
• Registering multiple times to get around limits
• Patterns of referrals
• Number of entries in a batch and the number of comments indicated the quality of data input
NPC Behavior
of Interest

Submitted and Accepted Item Batches
1613
501
3417
5527
1401
421
146
7016
789
65
121
944
759
200
26
941
0 2000 4000 6000 8000
Pakistan
Philippines
Nigeria
Kenya
India
Indonesia
Brazil
Bangladesh
Batches accepted Batches rejected

Data Validation
Once the data is verified, price observations for each item at country level are validated using statistical
measures
T-ratio
Min/Max ratio
CV
Coefficient of Variation (CV) is defined as standard deviation divided by item average price, and multiplied by 100
Observations failing to pass the set thresholds of the indices were excluded from the datasets
Defined as minimum price divided by maximum price
Defined as distance of a price observation from average price, divided by std. deviation

Accepted & Rejected Observations
66739
14947
81215
190202
62837
5424
0
231640
2940
2392
19818
16371
3200
3752
4445
13023
0 100.000 200.000
Pakistan
Philippines
Nigeria
Kenya
India
Indonesia
Brazil
Bangladesh
Accepted Observations Rejected Observations
CV before CV After
50.9 32.6
438.3 -
74.5 33.6
49.8 34.8
47 27.4
92.7 38.1
181.5 29.7
58.6 35.9

Deleted observations per item
Item Deleted,
% Item
Deleted, %
Item Deleted,
%
Tuna steaks 21% White rice 12% Banana 9%
Cornflakes 17% Shrimps 12% White bread 8%
Wheat flour 15% Instant coffee 11% Brown Potatoes 8%
Cassava 15% Dried white beans 11% Soybean oil 8%
Flour White 14% Orange 11% Sunflower oil 8%
Canned sardines 14% Maize 11% Milk 8%
Long grain rice 14% Onion 10% Chicken legs 8%
Minced beef 13% Apple 10% White sugar 6%
Tea 13% Palm oil 9% Chicken eggs 6%
Cooking salt 13% Carrots 9% Coca Cola/ Pepsi Cola
6%
Covers all countries for the whole survey period

Monthly Average Prices for India, US$
180
185
190
195
200
205
210
215
220
225
230
1,0
1,5
2,0
2,5
3,0
3,5
4,0
4,5
5,0
Sep Oct Nov Dec Jan Feb Mar Apr
Long grain rice - Non-Parboiled 100% Beef, mincedChicken legs Sunflower oilOrange Tuna steaksInstant coffee, Nescafe Classic CPI
US$ CPI

Sub-National Prices for India, US$ India Mumbai Hyderabad Pune Nashik Jabalpur Rest
Rice 1.53 1.41 1.65 1.54 1.59 1.45 1.41
White rice 0.81 0.69 0.92 0.83 0.80 0.74 0.75
Cornflakes 2.02 2.03 2.44 1.68 1.66 1.91 1.89
Wheat flour 0.77 0.70 0.81 0.83 0.75 0.79 0.74
Maize Flour 1.67 1.70 1.72 1.59 1.46 1.71 1.73
White bread 0.99 0.90 1.01 1.11 1.00 0.94 0.99
Minced beef 3.42 3.77 3.36 3.26 3.09 3.29 3.53
Chicken legs 2.68 2.51 3.02 2.44 2.53 2.70 2.51
TOTALS FOR ALL ITEMS
Overall Price Ratio 1 0.98 1.04 0.99 0.95 1.01 0.97
Total # of obs. 27694 3662 8611 2656 4244 2019 6502
Av. # of obs. per item
923 122 287 89 141 67 217
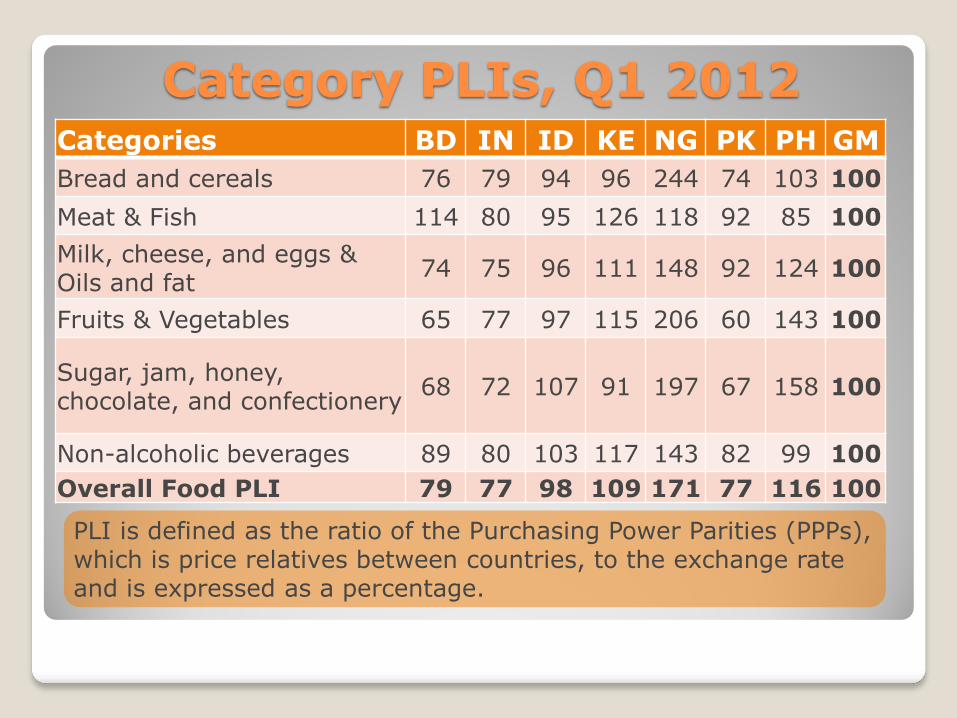
Category PLIs, Q1 2012 Categories BD IN ID KE NG PK PH GM
Bread and cereals 76 79 94 96 244 74 103 100
Meat & Fish 114 80 95 126 118 92 85 100
Milk, cheese, and eggs & Oils and fat
74 75 96 111 148 92 124 100
Fruits & Vegetables 65 77 97 115 206 60 143 100
Sugar, jam, honey, chocolate, and confectionery
68 72 107 91 197 67 158 100
Non-alcoholic beverages 89 80 103 117 143 82 99 100
Overall Food PLI 79 77 98 109 171 77 116 100
PLI is defined as the ratio of the Purchasing Power Parities (PPPs), which is price relatives between countries, to the exchange rate and is expressed as a percentage.

Comparison of PLIs
147
124 100 97 97
122 112 100 104
82
0
50
100
150
200
Philippines Indonesia Bangladesh Pakistan India
Pilot ADB
Relationship of price levels is similar to official statistics released by the Asian Development Bank (ADB) for 2009
For the pilot, the PLI is for all 30 food items, based on the data for the 7 pilot countries. For the ADB study, the PLI is for Food and Non-Alcoholic
Beverages, based on the data for the 21 participating countries in the Asia comparison. Both figures are recalculated to make Bangladesh as the base
(Bangladesh PLI = 100).

CHALLENGES, SUCCESSES AND LESSONS LEARNED

Challenges
Local laws pertaining to the use of the Internet, mobile phones, data collection and photography can cause problems
Cultural and language barriers can significantly impact the success of the data collection process
Legal Cultural
Language
Building Trust
A sense of trust had to be achieved to ensure utmost data quality while balancing with fraudulent identification measures
Incentive level
The incentive level and structure affected the recruitment and retainment of NPCs; high income countries may need more incentive

Challenges
Survey Coverage
The purpose of this pilot was to check what kind of penetration and survey coverage can be achieved
In the future, a survey framework needs to be established at the beginning of the project
Working with a huge dataset of microdata that results from such a project can be challenging
This requires database and validation systems to be put in place, in order to ensure robustness of the data validation process
One way to ensure the quality is having data collectors and data users validate the data
Managing and
Analyzing Big Data

Successes
Prices were collected from around 5,000 supermarkets in close to 300 survey locations, spread across the pilot countries, by over 7,000 NPCs
DESPITE THE CHALLENGES FACED, THE PROJECT WAS SUCCESSFUL!
The collected data showed that crowd-sourced price collection is feasible
Data Summary
Developed platform can have a wide variety of applications at the World Bank, international and regional agencies,
NSIs and NGOs
Comparable Timely Cost
efficient High
coverage
In addition, the method benefits NPCs through compensation and feedback they receive from the
released data

THANK YOU